
Valence Bond Insights into the H-Abstraction Barrier in Cytochrome P450


Abstract

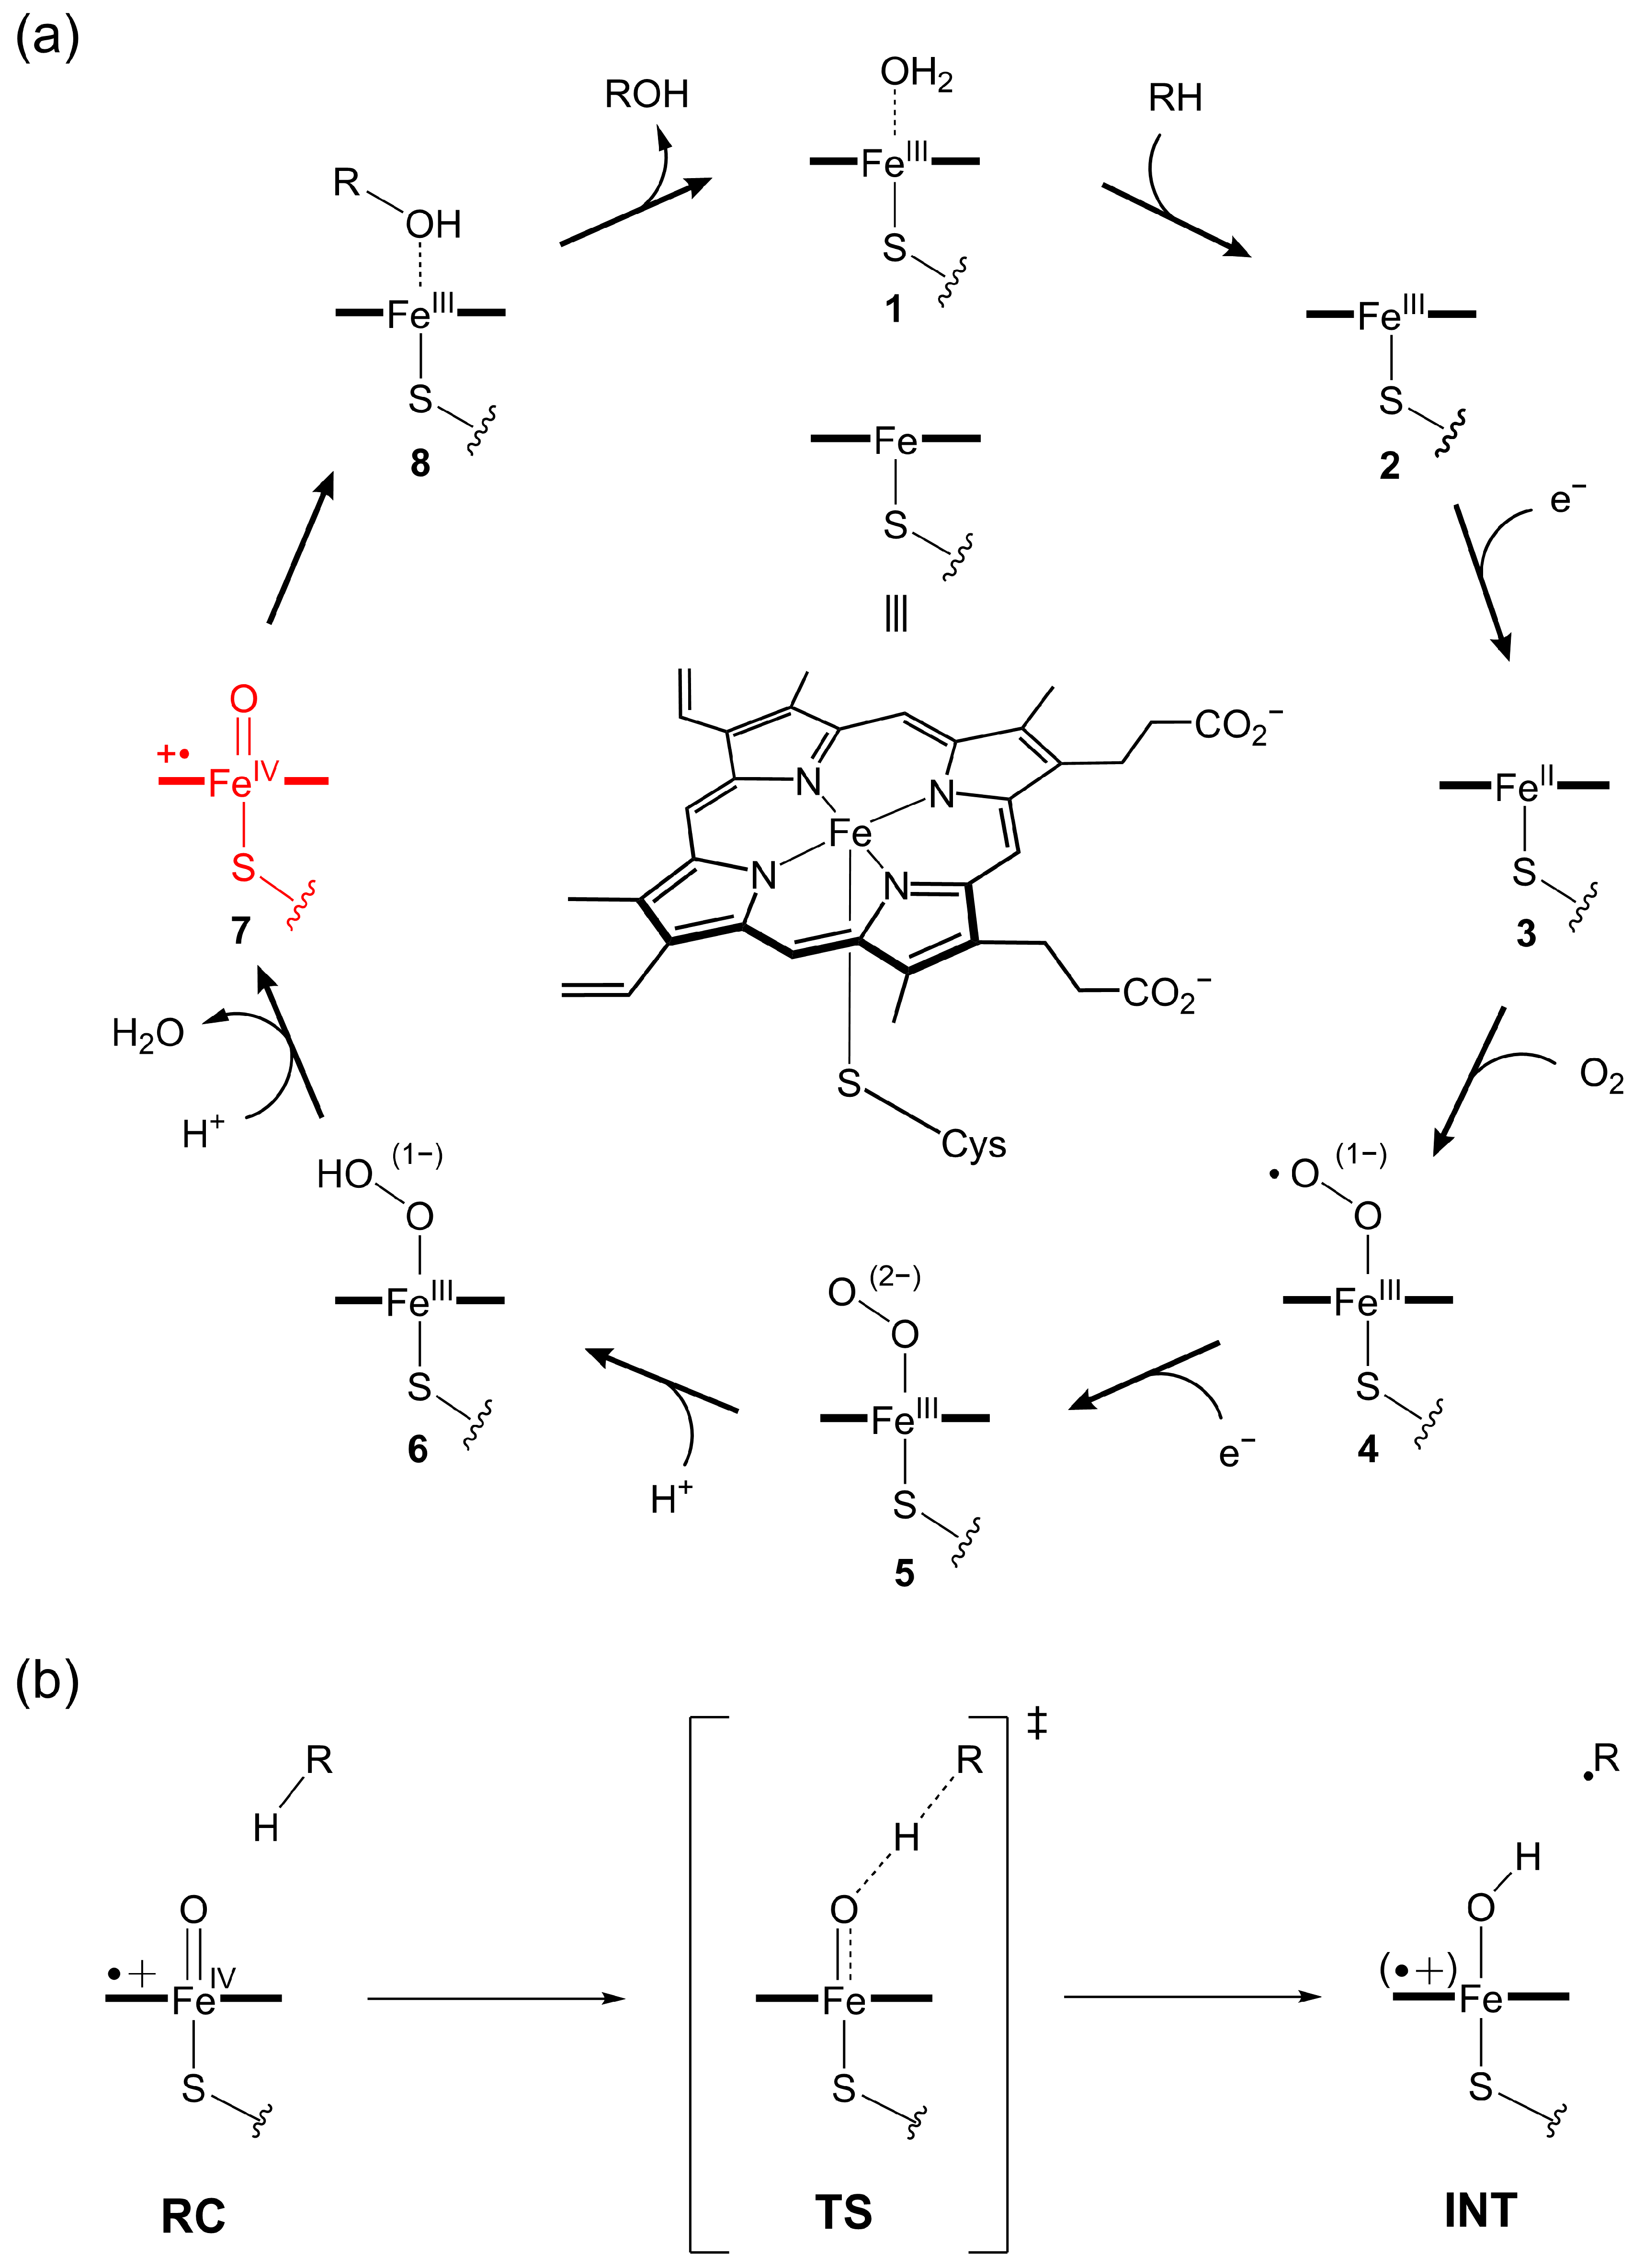
1. Introduction
2. Results and Discussion
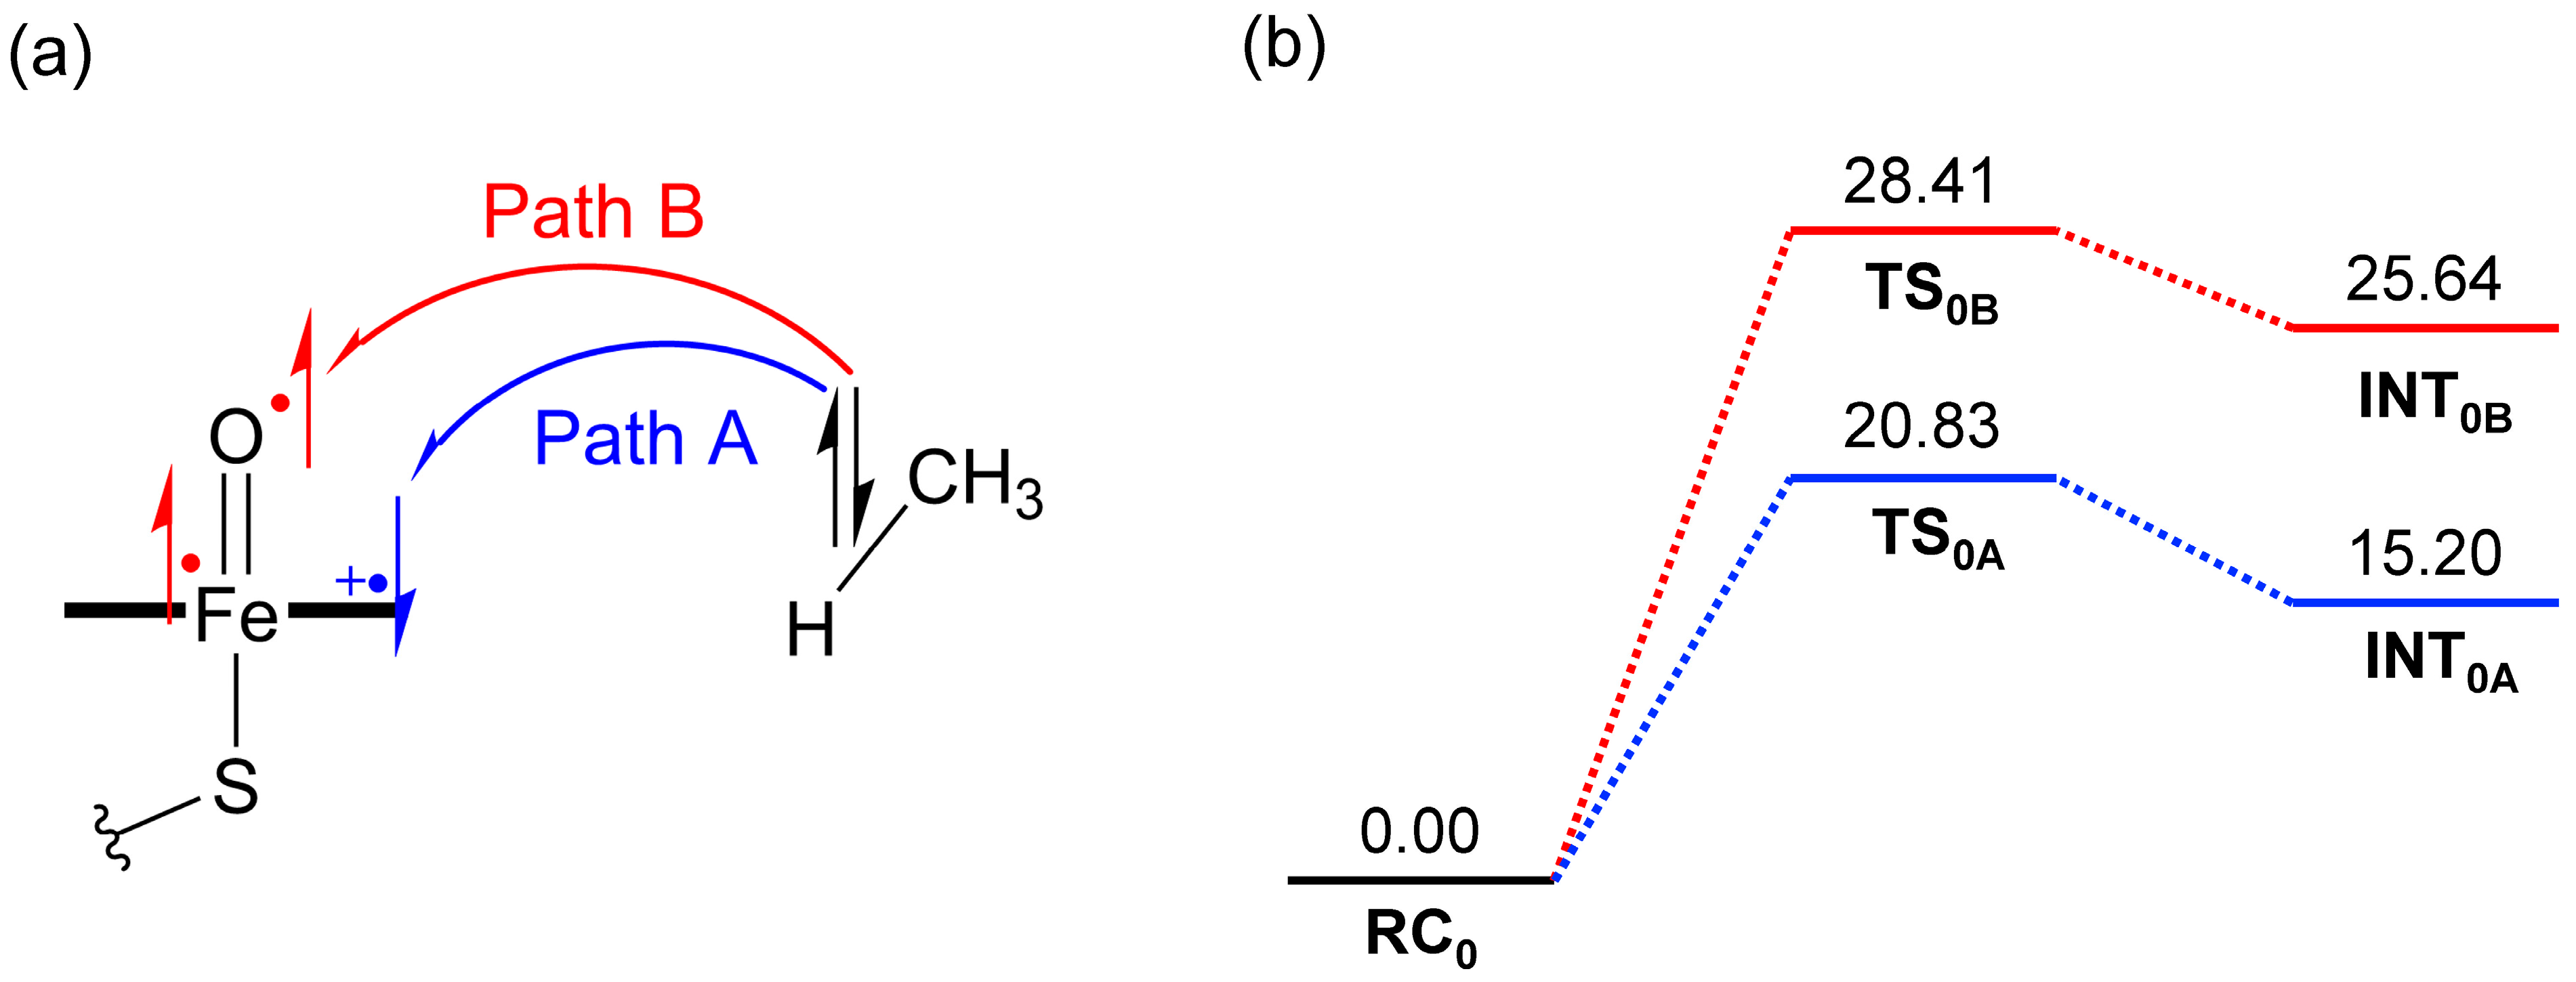
2.1. DFT Calculations
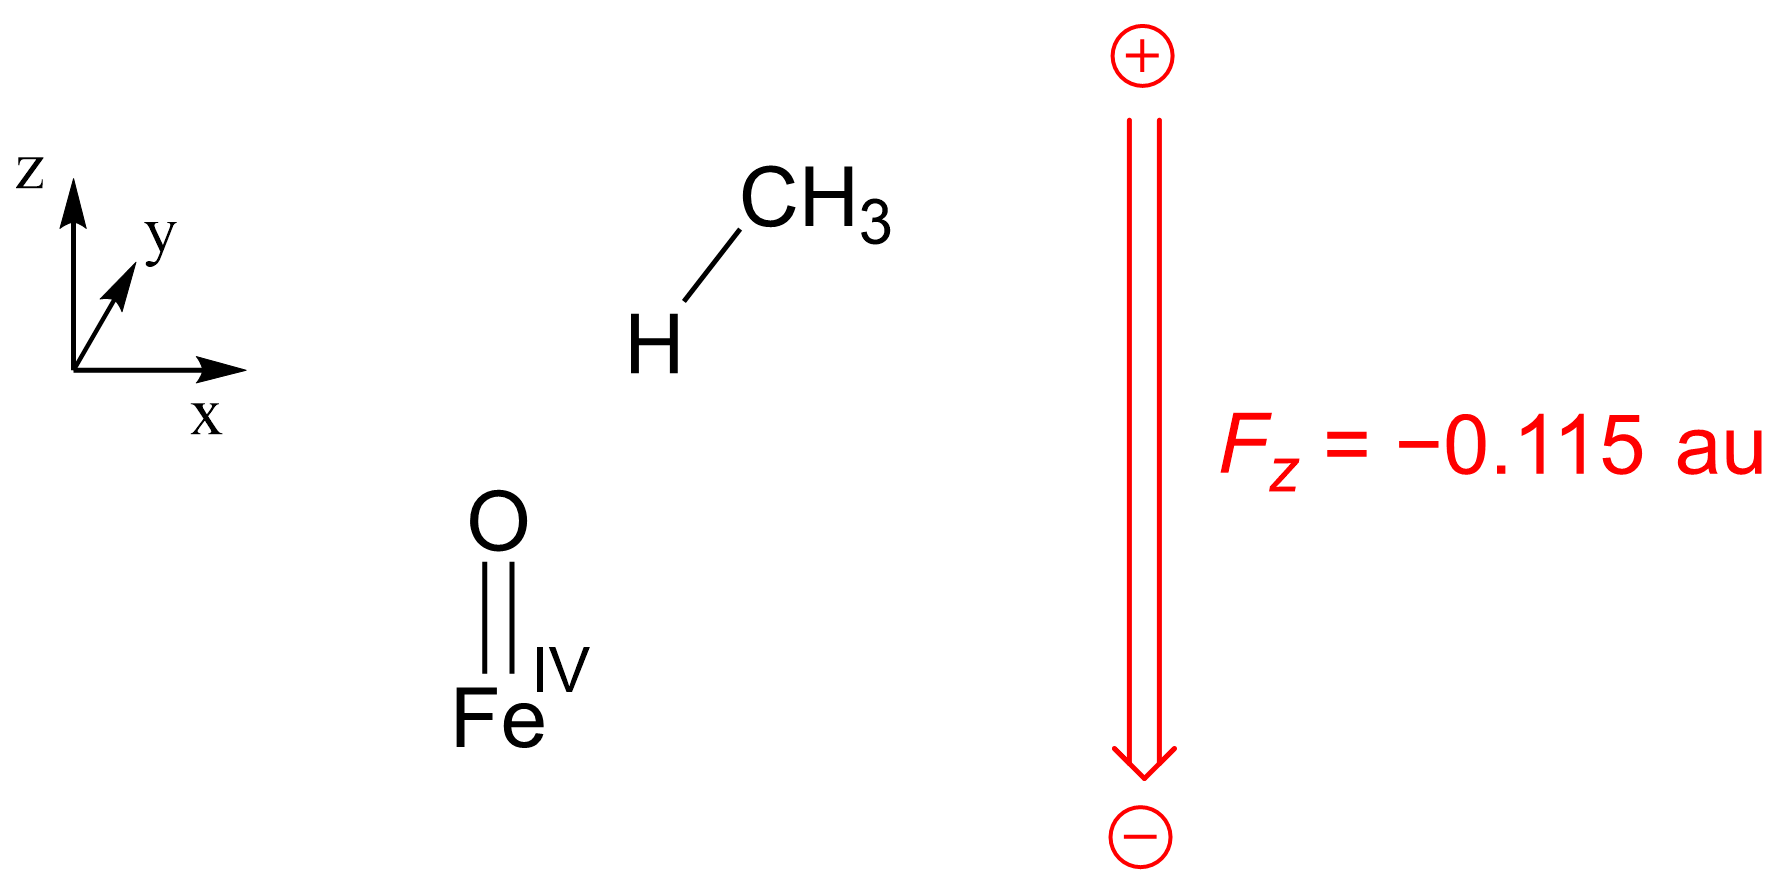
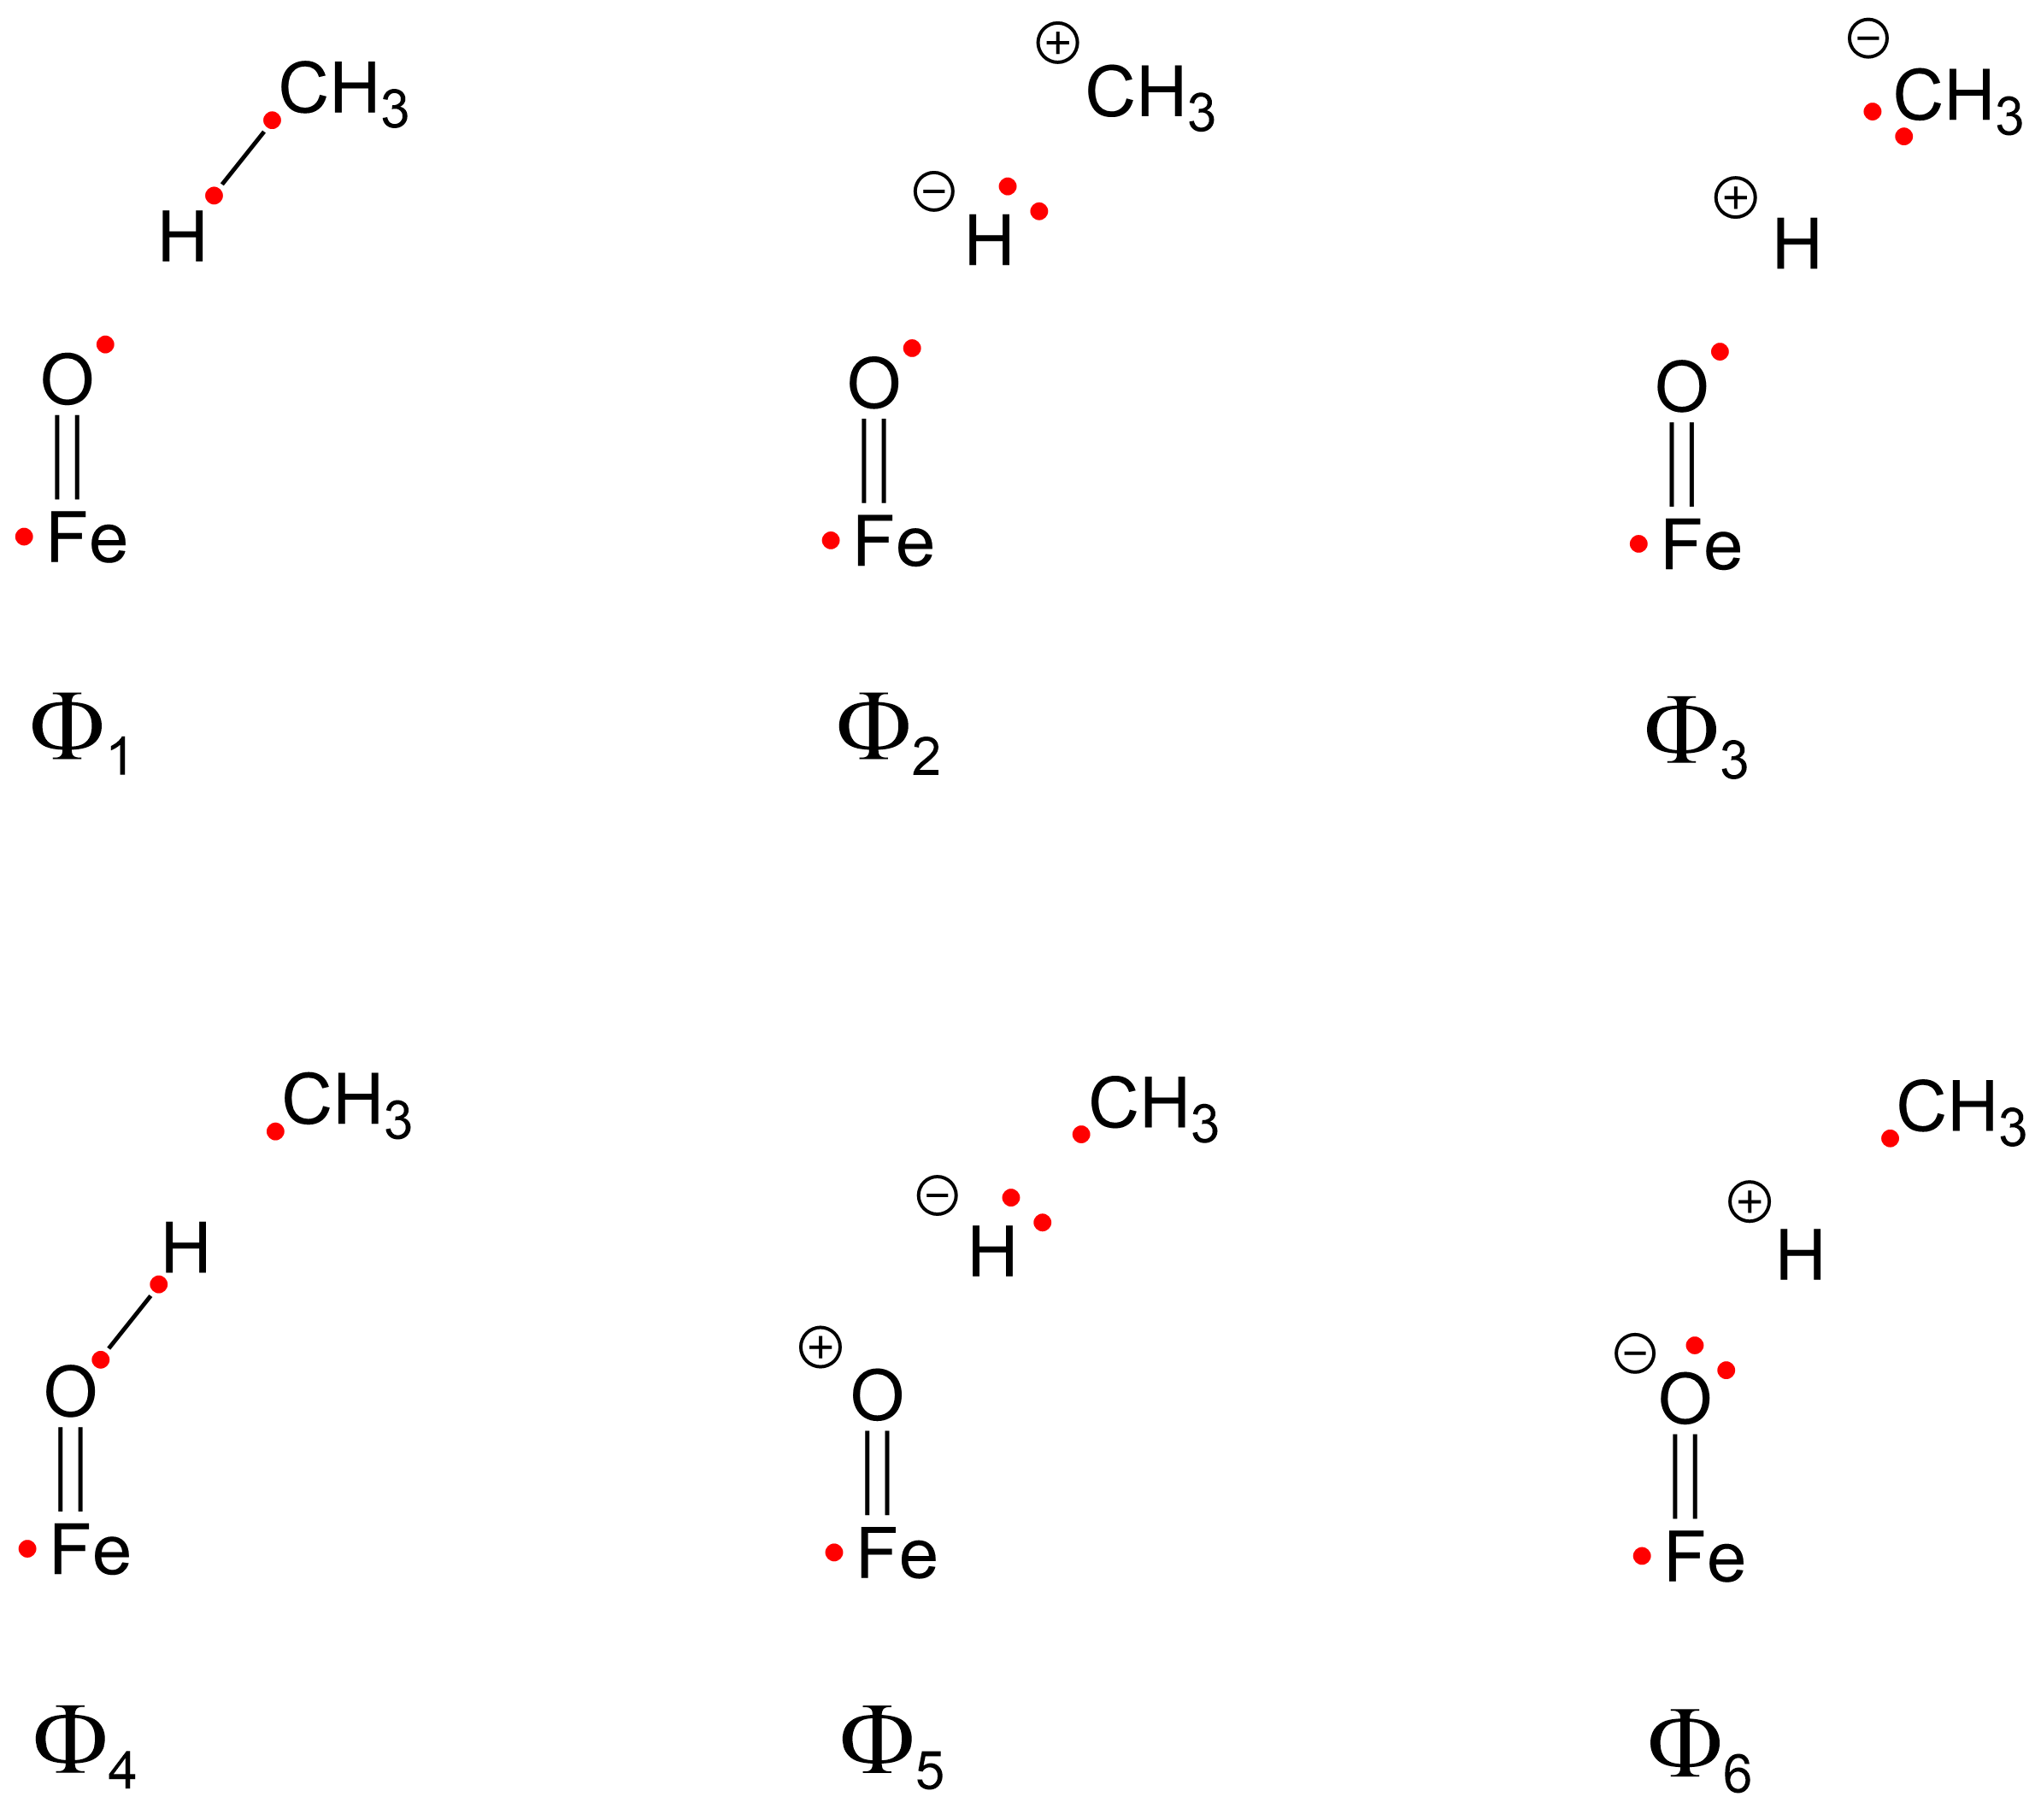
2.2. VB Calculations
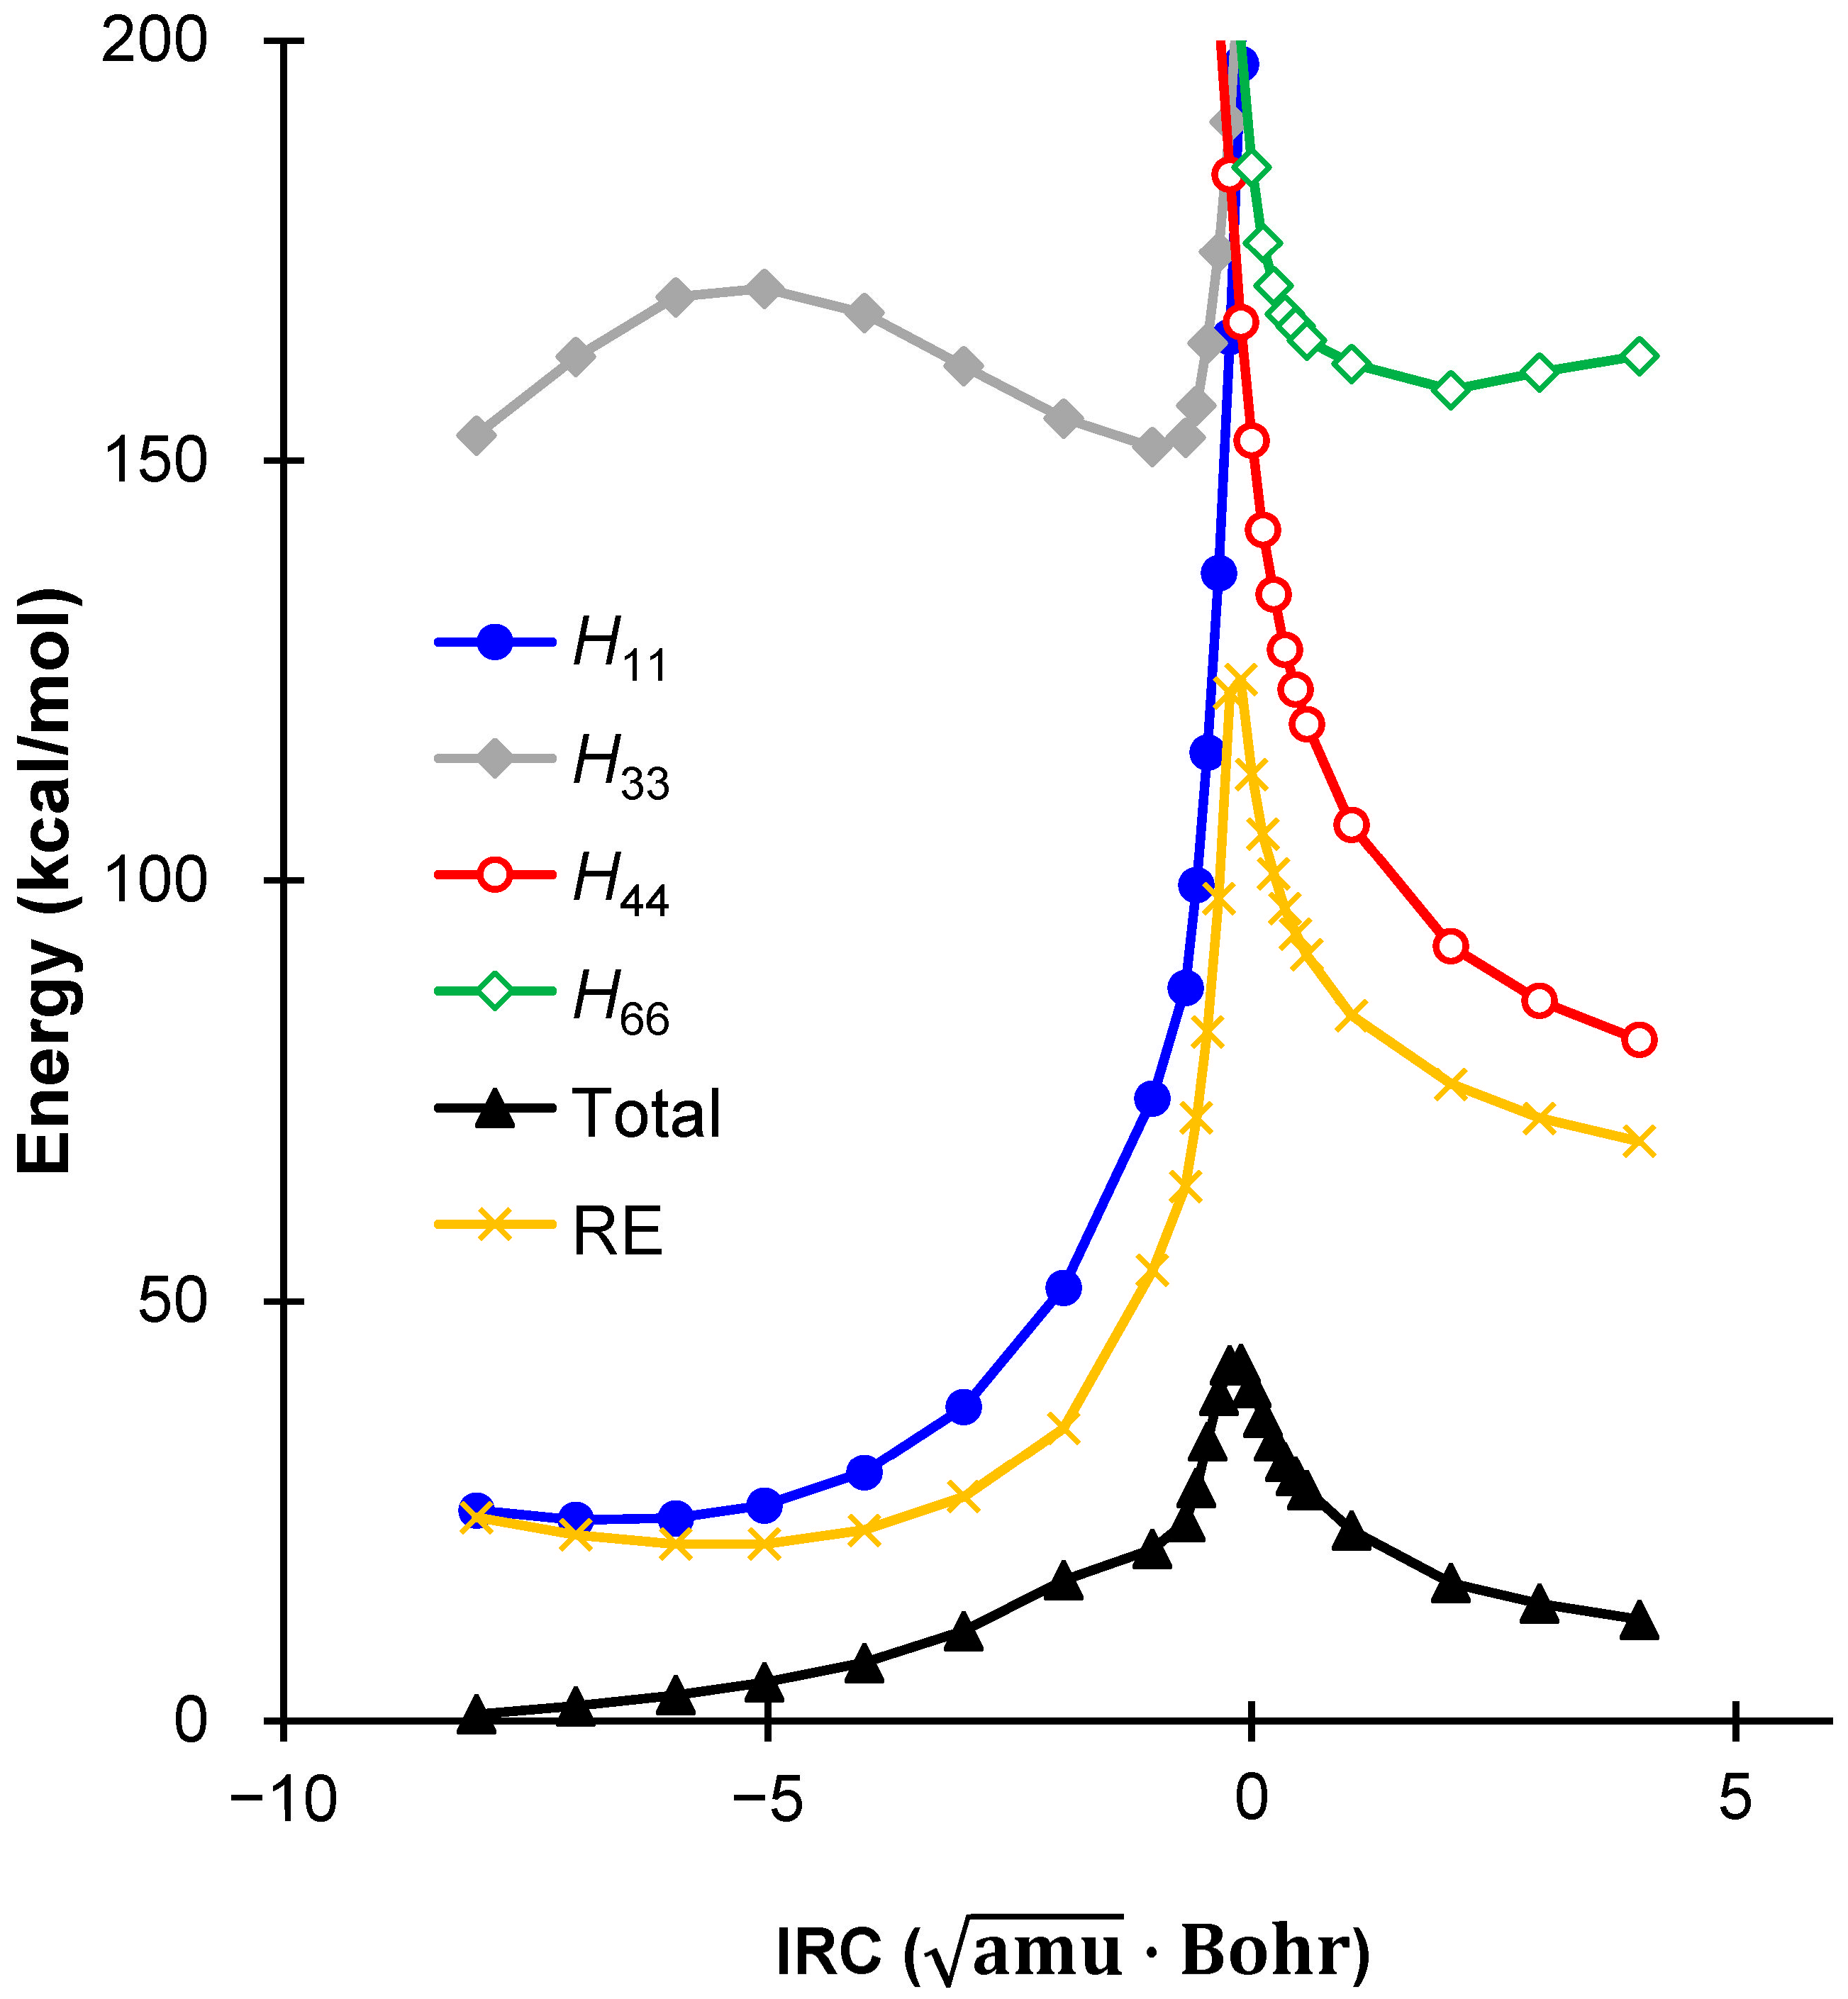
2.3. Comparison Between DFT and VB Energies
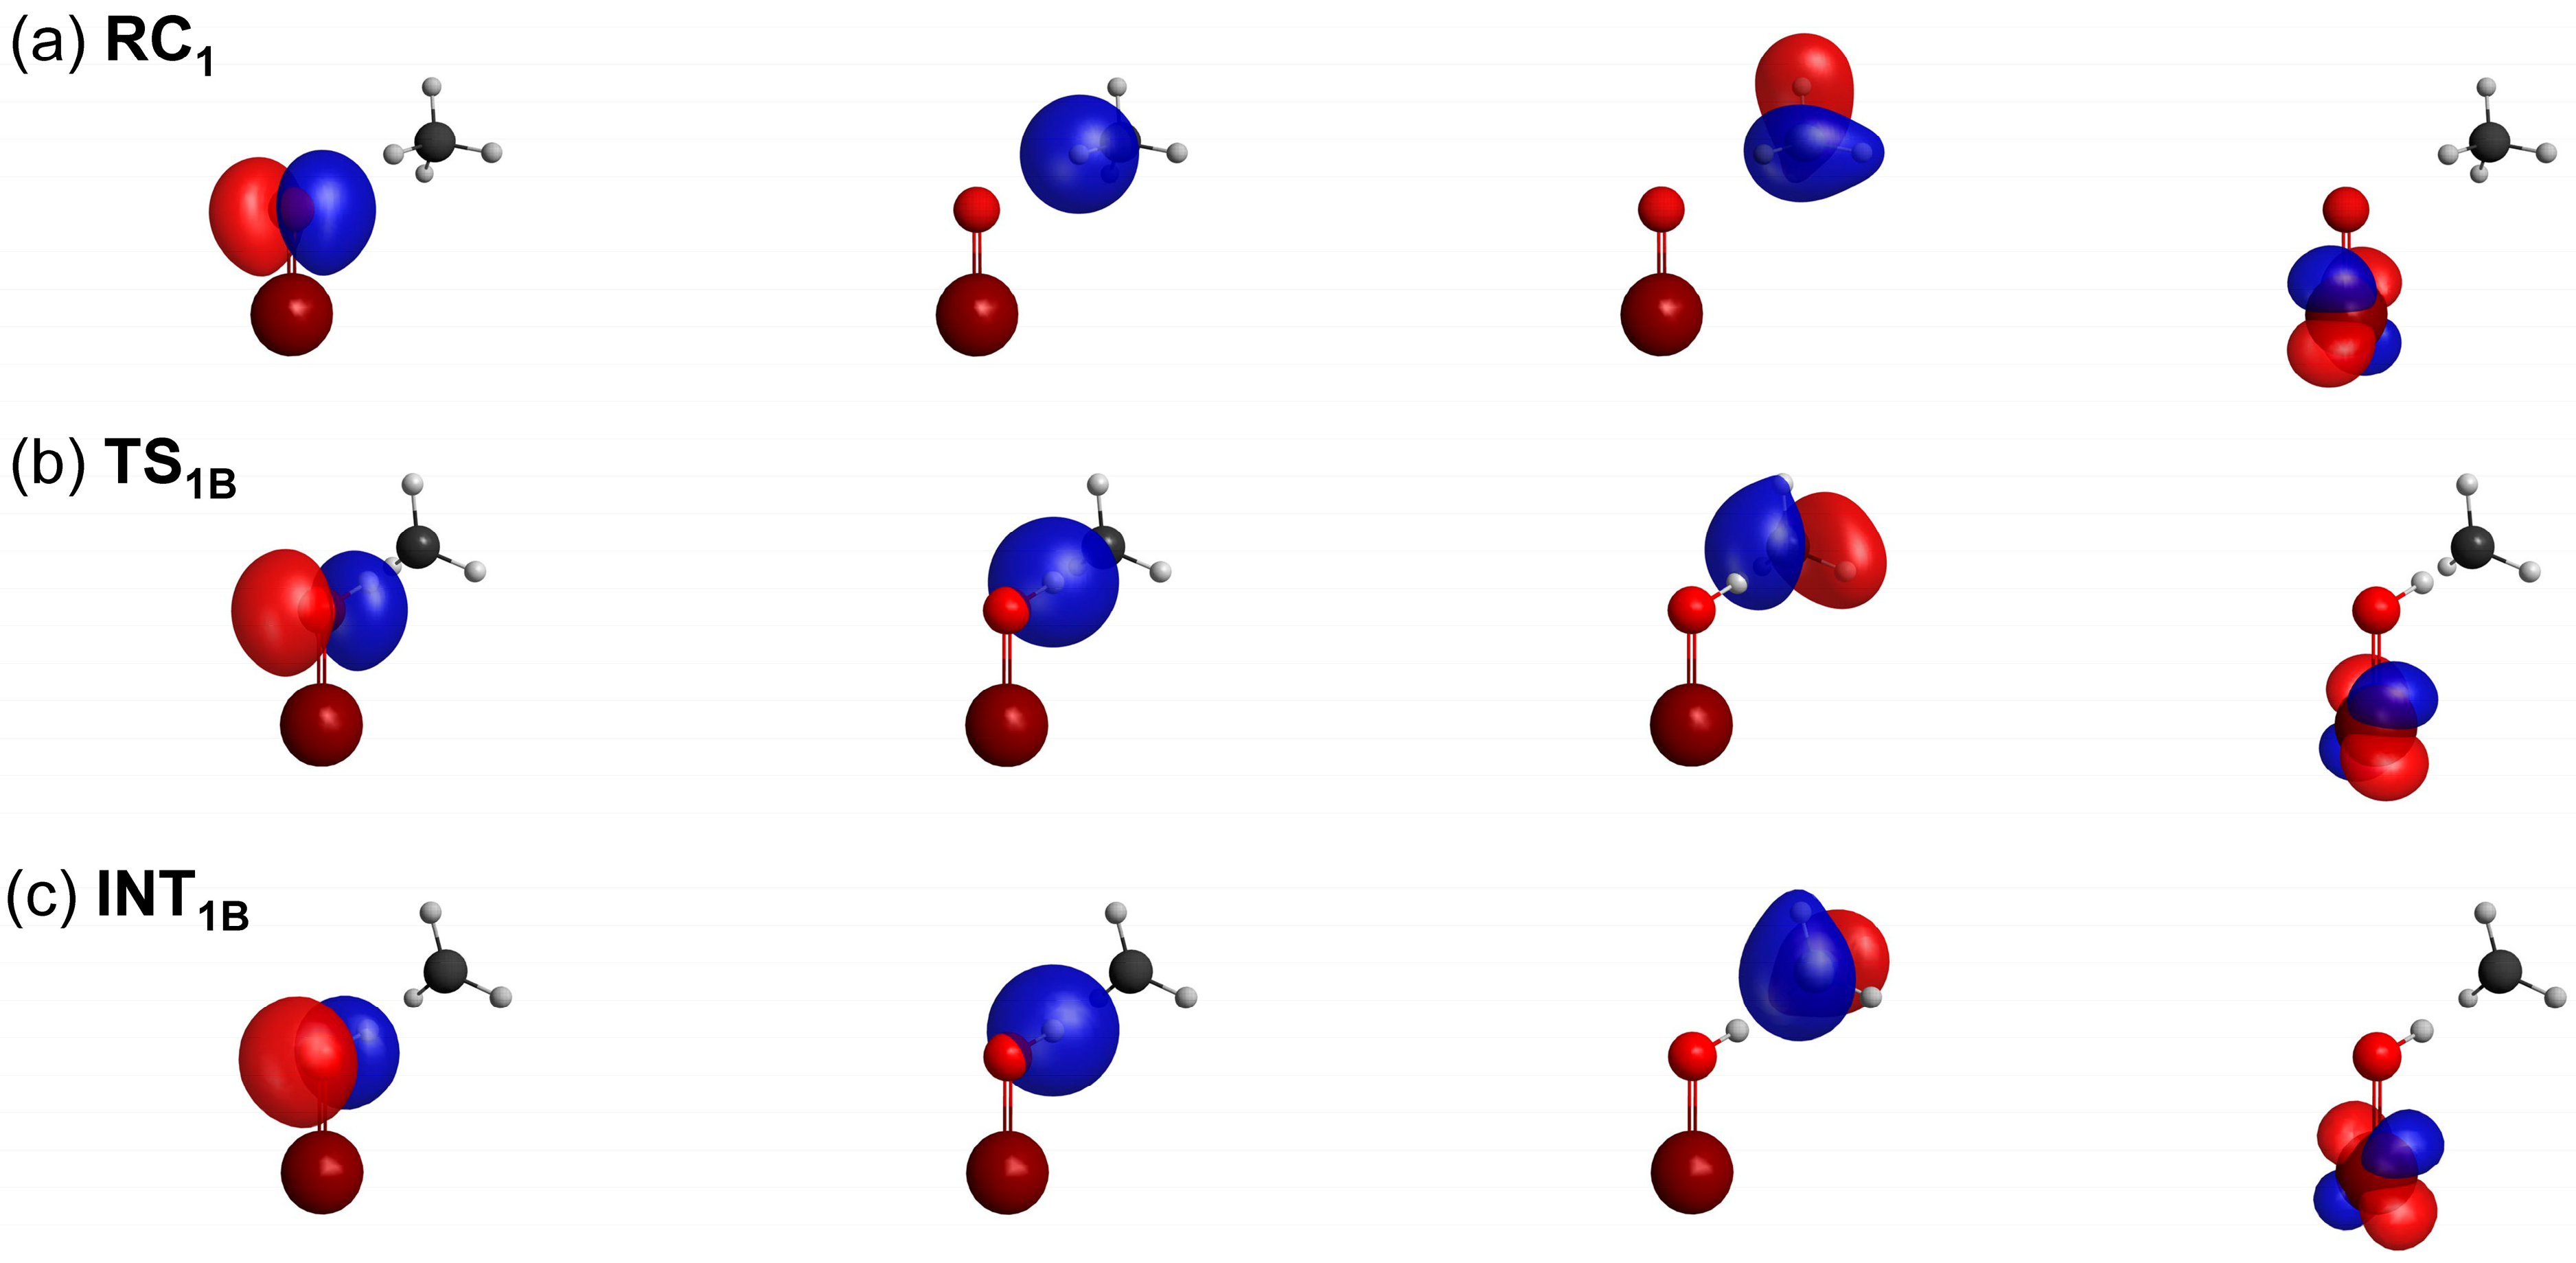
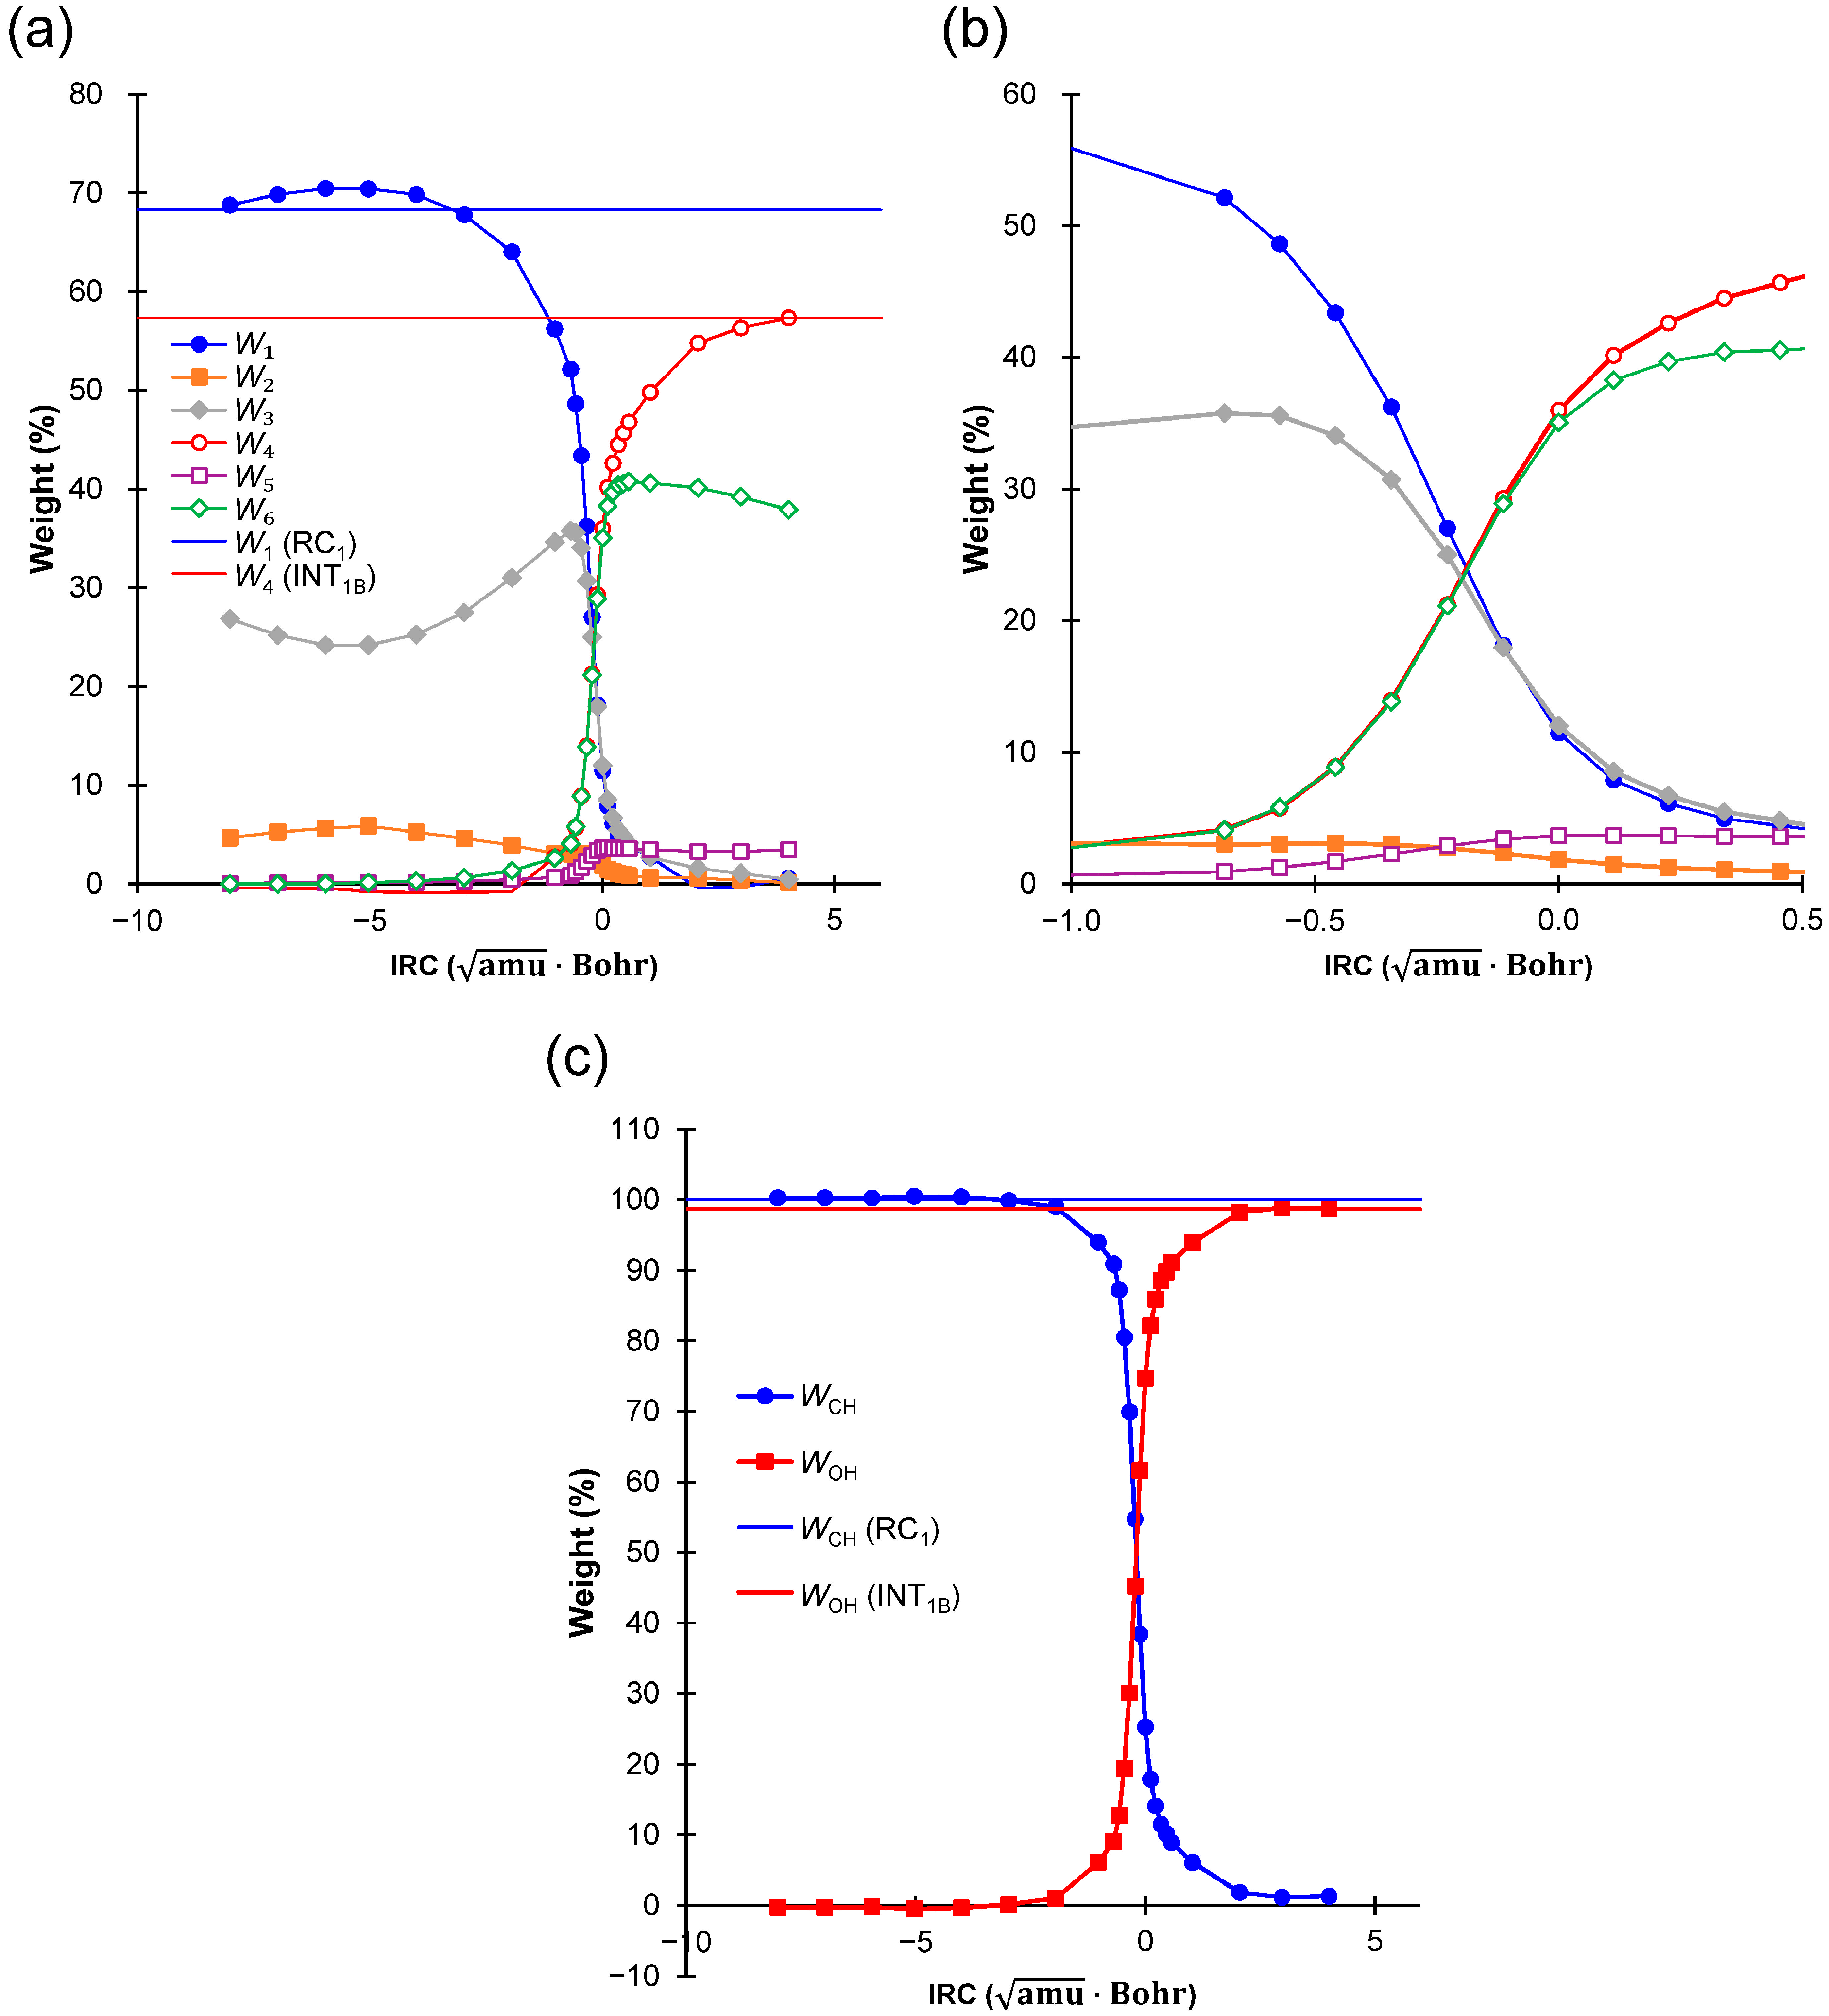
2.4. Weights of VB Structures
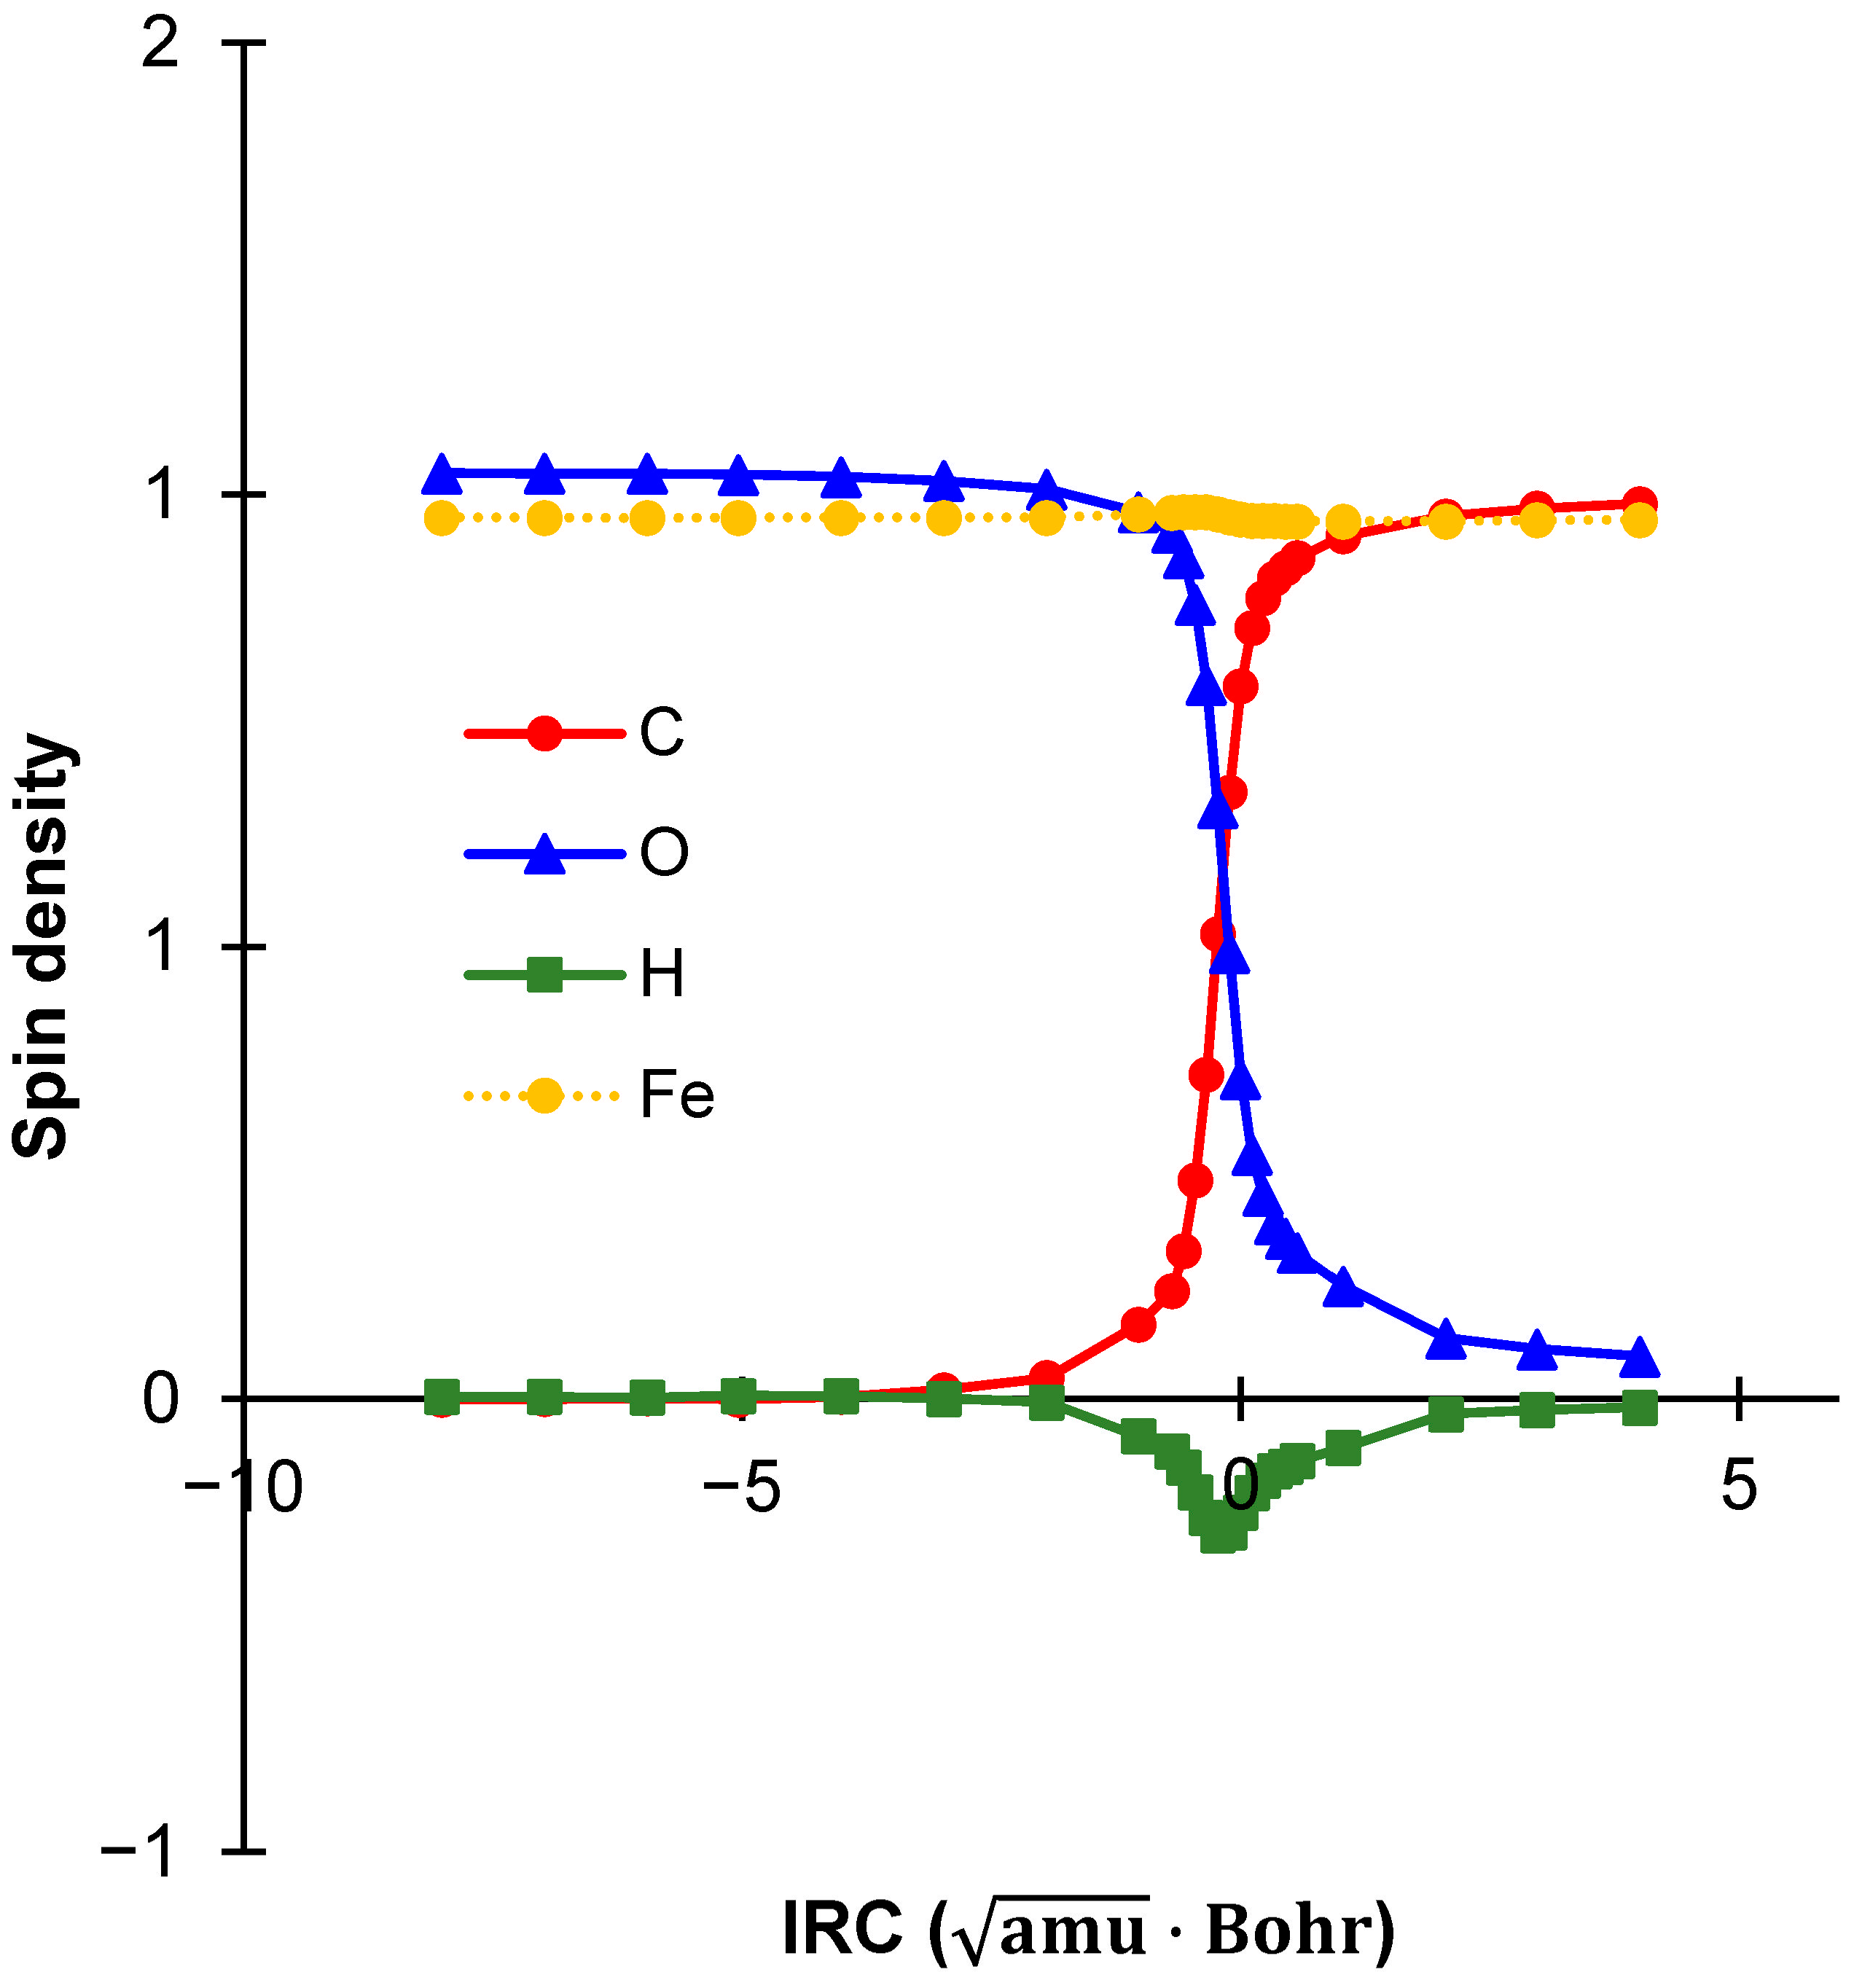
2.5. Spin Density
3. Materials and Methods
4. Conclusions
Supplementary Materials
Author Contributions
Funding
Institutional Review Board Statement
Informed Consent Statement
Data Availability Statement
Conflicts of Interest
References
- Ortiz de Montellano, P.R. (Ed.) Cytochrome P450: Structure, Mechanism, and Biochemistry, 4th ed.; Springer: Cham, Switzerland, 2015. [Google Scholar]
- Schöneboom, J.C.; Cohen, S.; Lin, H.; Shaik, S.; Thiel, W. Quantum Mechanical/Molecular Mechanical Investigation of the Mechanism of C–H Hydroxylation of Camphor by Cytochrome P450cam: Theory Supports a Two-State Rebound Mechanism. J. Am. Chem. Soc. 2004, 126, 4017–4034. [Google Scholar] [CrossRef] [PubMed]
- Yue, D.; Ng, E.W.H.; Hirao, H. Hydrogen-Bond-Assisted Catalysis: Hydroxylation of Paclitaxel by Human CYP2C8. J. Am. Chem. Soc. 2024, 146, 30117–30125. [Google Scholar] [CrossRef] [PubMed]
- Groves, J.T.; McClusky, G.A.; White, R.E.; Coon, M.J. Aliphatic Hydroxylation by Highly Purified Liver Microsomal Cytochrome P-450. Evidence for a Carbon Radical Intermediate. Biochem. Biophys. Res. Commun. 1978, 81, 154–160. [Google Scholar] [CrossRef] [PubMed]
- Ortiz de Montellano, P.R. Hydrocarbon Hydroxylation by Cytochrome P450 Enzymes. Chem. Rev. 2010, 110, 932–948. [Google Scholar] [CrossRef] [PubMed]
- Meunier, B.; de Visser, S.P.; Shaik, S. Mechanism of Oxidation Reactions Catalyzed by Cytochrome P450 Enzymes. Chem. Rev. 2004, 104, 3947–3980. [Google Scholar] [CrossRef] [PubMed]
- Sono, M.; Roach, M.P.; Coulter, E.D.; Dawson, J.H. Heme-Containing Oxygenases. Chem. Rev. 1996, 96, 2841–2888. [Google Scholar] [CrossRef]
- Denisov, I.G.; Makris, T.M.; Sligar, S.G.; Schlichting, I. Structure and Chemistry of Cytochrome P450. Chem. Rev. 2005, 105, 2253–2278. [Google Scholar] [CrossRef] [PubMed]
- Rittle, J.; Green, M.T. Cytochrome P450 Compound I: Capture, Characterization, and C-H Bond Activation Kinetics. Science 2010, 330, 933–937. [Google Scholar] [CrossRef]
- Costas, M.; Chen, K.; Que, L. Biomimetic Nonheme Iron Catalysts for Alkane Hydroxylation. Coord. Chem. Rev. 2000, 200, 517–544. [Google Scholar] [CrossRef]
- Baik, M.-H.; Newcomb, M.; Friesner, R.A.; Lippard, S.J. Mechanistic Studies on the Hydroxylation of Methane by Methane Monooxygenase. Chem. Rev. 2003, 103, 2385–2420. [Google Scholar] [CrossRef]
- Krebs, C.; Fujimori, D.G.; Walsh, C.T.; Bollinger, J.M. Non-Heme Fe(IV)–Oxo Intermediates. Acc. Chem. Res. 2007, 40, 484–492. [Google Scholar] [CrossRef]
- Nam, W.; Lee, Y.-M.; Fukuzumi, S. Tuning Reactivity and Mechanism in Oxidation Reactions by Mononuclear Nonheme Iron(IV)-Oxo Complexes. Acc. Chem. Res. 2014, 47, 1146–1154. [Google Scholar] [CrossRef] [PubMed]
- Shaik, S.; Kumar, D.; de Visser, S.P.; Altun, A.; Thiel, W. Theoretical Perspective on the Structure and Mechanism of Cytochrome P450 Enzymes. Chem. Rev. 2005, 105, 2279–2328. [Google Scholar] [CrossRef]
- Shaik, S.; Hirao, H.; Kumar, D. Reactivity of High-Valent Iron–Oxo Species in Enzymes and Synthetic Reagents: A Tale of Many States. Acc. Chem. Res. 2007, 40, 532–542. [Google Scholar] [CrossRef]
- Yoshizawa, K. Theoretical Study on Kinetic Isotope Effects in the C–H Bond Activation of Alkanes by Iron-Oxo Complexes. Coord. Chem. Rev. 2002, 226, 251–259. [Google Scholar] [CrossRef]
- Ye, S.; Neese, F. Quantum Chemical Studies of C–H Activation Reactions by High-Valent Nonheme Iron Centers. Curr. Opin. Chem. Biol. 2009, 13, 89–98. [Google Scholar] [CrossRef]
- Roy, L. Theoretical Identification of the Factors Governing the Reactivity of C–H Bond Activation by Non-Heme Iron(IV)-Oxo Complexes. ChemPlusChem 2019, 84, 893–906. [Google Scholar] [CrossRef] [PubMed]
- Kumar, R.; Pandey, B.; Sen, A.; Ansari, M.; Sharma, S.; Rajaraman, G. Role of Oxidation State, Ferryl-Oxygen, and Ligand Architecture on the Reactivity of Popular High-Valent FeIV=O Species: A Theoretical Perspective. Coord. Chem. Rev. 2020, 419, 213397. [Google Scholar] [CrossRef]
- Lonsdale, R.; Harvey, J.N.; Mulholland, A.J. Inclusion of Dispersion Effects Significantly Improves Accuracy of Calculated Reaction Barriers for Cytochrome P450 Catalyzed Reactions. J. Phys. Chem. Lett. 2010, 1, 3232–3237. [Google Scholar] [CrossRef]
- Shaik, S.; Cohen, S.; Wang, Y.; Chen, H.; Kumar, D.; Thiel, W. P450 Enzymes: Their Structure, Reactivity, and Selectivity—Modeled by QM/MM Calculations. Chem. Rev. 2010, 110, 949–1017. [Google Scholar] [CrossRef]
- Guallar, V.; Baik, M.-H.; Lippard, S.J.; Friesner, R.A. Peripheral Heme Substituents Control the Hydrogen-Atom Abstraction Chemistry in Cytochromes P450. Proc. Natl. Acad. Sci. USA 2003, 100, 6998–7002. [Google Scholar] [CrossRef]
- Altun, A.; Shaik, S.; Thiel, W. What Is the Active Species of Cytochrome P450 during Camphor Hydroxylation? QM/MM Studies of Different Electronic States of Compound I and of Reduced and Oxidized Iron–Oxo Intermediates. J. Am. Chem. Soc. 2007, 129, 8978–8987. [Google Scholar] [CrossRef]
- Godfrey, E.; Porro, C.S.; de Visser, S.P. Comparative Quantum Mechanics/Molecular Mechanics (QM/MM) and Density Functional Theory Calculations on the Oxo–Iron Species of Taurine/α-Ketoglutarate Dioxygenase. J. Phys. Chem. A 2008, 112, 2464–2468. [Google Scholar] [CrossRef] [PubMed]
- Lonsdale, R.; Houghton, K.T.; Żurek, J.; Bathelt, C.M.; Foloppe, N.; de Groot, M.J.; Harvey, J.N.; Mulholland, A.J. Quantum Mechanics/Molecular Mechanics Modeling of Regioselectivity of Drug Metabolism in Cytochrome P450 2C9. J. Am. Chem. Soc. 2013, 135, 8001–8015. [Google Scholar] [CrossRef] [PubMed]
- Lai, R.; Li, H. Hydrogen Abstraction of Camphor Catalyzed by Cytochrome P450cam: A QM/MM Study. J. Phys. Chem. B 2016, 120, 12312–12320. [Google Scholar] [CrossRef]
- Hirao, H.; Yue, D.; Xia, S.; Zhang, E.; Zhang, H.; Yan, J.; Xiao, Z. Computational Studies on Human Cytochrome P450: Advancing Insights into Drug Metabolism. Trends Chem. 2025, accepted. [Google Scholar]
- Chen, H.; Lai, W.; Shaik, S. Exchange-Enhanced H-Abstraction Reactivity of High-Valent Nonheme Iron(IV)-Oxo from Coupled Cluster and Density Functional Theories. J. Phys. Chem. Lett. 2010, 1, 1533–1540. [Google Scholar] [CrossRef]
- Kupper, C.; Mondal, B.; Serrano-Plana, J.; Klawitter, I.; Neese, F.; Costas, M.; Ye, S.; Meyer, F. Nonclassical Single-State Reactivity of an Oxo-Iron(IV) Complex Confined to Triplet Pathways. J. Am. Chem. Soc. 2017, 139, 8939–8949. [Google Scholar] [CrossRef]
- Feldt, M.; Martín-Fernández, C.; Harvey, J.N. Energetics of Non-Heme Iron Reactivity: Can Ab Initio Calculations Provide the Right Answer? Phys. Chem. Chem. Phys. 2020, 22, 23908–23919. [Google Scholar] [CrossRef]
- Shaik, S.S. What Happens to Molecules as They React? A Valence Bond Approach to Reactivity. J. Am. Chem. Soc. 1981, 103, 3692–3701. [Google Scholar] [CrossRef]
- Shaik, S.; Shurki, A. Valence Bond Diagrams and Chemical Reactivity. Angew. Chem. Int. Ed. 1999, 38, 586–625. [Google Scholar] [CrossRef]
- Hirao, H. Correlation Diagram Approach as a Tool for Interpreting Chemistry: An Introductory Overview. Wiley Interdiscip. Rev. Comput. Mol. Sci. 2011, 1, 337–349. [Google Scholar] [CrossRef]
- Shaik, S.; Kumar, D.; de Visser, S.P. A Valence Bond Modeling of Trends in Hydrogen Abstraction Barriers and Transition States of Hydroxylation Reactions Catalyzed by Cytochrome P450 Enzymes. J. Am. Chem. Soc. 2008, 130, 10128–10140. [Google Scholar] [CrossRef]
- Shaik, S.; Lai, W.; Chen, H.; Wang, Y. The Valence Bond Way: Reactivity Patterns of Cytochrome P450 Enzymes and Synthetic Analogs. Acc. Chem. Res. 2010, 43, 1154–1165. [Google Scholar] [CrossRef]
- Zhang, E.; Hirao, H. Synergistic Charge Transfer Effect in Ferrous Heme-CO Bonding within Cytochrome P450. Molecules 2024, 29, 873. [Google Scholar] [CrossRef]
- Zhang, E.; Hirao, H. Exploring the Bonding Nature of Iron(IV)-Oxo Species through Valence Bond Calculations and Electron Density Analysis. J. Phys. Chem. A 2024, 128, 7167–7176. [Google Scholar] [CrossRef]
- Liu, S.; Hirao, H. Energy Decomposition Analysis of the Nature of Coordination Bonding at the Heme Iron Center in Cytochrome P450 Inhibition. Chem. Asian J. 2022, 17, e202200360. [Google Scholar] [CrossRef]
- Liu, S.; Xia, S.; Yue, D.; Sun, H.; Hirao, H. The Bonding Nature of Fe–CO Complexes in Heme Proteins. Inorg. Chem. 2022, 61, 17494–17504. [Google Scholar] [CrossRef] [PubMed]
- Hirao, H.; Zhang, E. Bidirectional Charge Transfer at the Heme Iron in Reversible and Quasi-Irreversible Cytochrome P450 Inhibition. Inorg. Chem. 2023, 62, 16599–16608. [Google Scholar] [CrossRef]
- Zhang, E.; Hirao, H. Exploring Bonding in Bioinorganic Chemistry: Ab Initio Valence Bond Calculations of Iron(II)-CO and Iron(IV)-oxo Units in Cytochrome P450 under Oriented External Electric Fields. Chem. Methods 2025, e202400090. [Google Scholar] [CrossRef]
- Shaik, S.; de Visser, S.P.; Kumar, D. External Electric Field Will Control the Selectivity of Enzymatic-Like Bond Activations. J. Am. Chem. Soc. 2004, 126, 11746–11749. [Google Scholar] [CrossRef] [PubMed]
- Hirao, H.; Chen, H.; Carvajal, M.A.; Wang, Y.; Shaik, S. Effect of External Electric Fields on the C-H Bond Activation Reactivity of Nonheme Iron-Oxo Reagents. J. Am. Chem. Soc. 2008, 130, 3319–3327. [Google Scholar] [CrossRef] [PubMed]
- Cho, K.-B.; Hirao, H.; Chen, H.; Carvajal, M.A.; Cohen, S.; Derat, E.; Thiel, W.; Shaik, S. Compound I in Heme Thiolate Enzymes: A Comparative QM/MM Study. J. Phys. Chem. 2008, 112, 13128–13138. [Google Scholar] [CrossRef] [PubMed]
- Lai, W.; Chen, H.; Cho, K.-B.; Shaik, S. External Electric Field Can Control the Catalytic Cycle of Cytochrome P450cam: A QM/MM Study. J. Phys. Chem. Lett. 2010, 1, 2082–2087. [Google Scholar] [CrossRef]
- Wang, M.; Qu, Z. The C–H Bond Activation by Non-Heme Oxidant [(N4Py)FeIV(O)]2+ with External Electric Field. Theor. Chem. Acc. 2020, 139, 64. [Google Scholar] [CrossRef]
- de Visser, S.P.; Mukherjee, G.; Ali, H.S.; Sastri, C.V. Local Charge Distributions, Electric Dipole Moments, and Local Electric Fields Influence Reactivity Patterns and Guide Regioselectivities in A-Ketoglutarate-Dependent Non-Heme Iron Dioxygenases. Acc. Chem. Res. 2022, 55, 65–74. [Google Scholar] [CrossRef]
- Wu, J.; Long, T.; Wang, H.; Liang, J.-X.; Zhu, C. Oriented External Electric Fields Regurating the Reaction Mechanism of CH4 Oxidation Catalyzed by Fe(IV)-Oxo-Corrolazine: Insight from Density Functional Calculations. Front. Chem. 2022, 10, 896944. [Google Scholar] [CrossRef]
- Ogliaro, F.; Harris, N.; Cohen, S.; Filatov, M.; de Visser, S.P.; Shaik, S. A Model “Rebound” Mechanism of Hydroxylation by Cytochrome P450: Stepwise and Effectively Concerted Pathways, and Their Reactivity Patterns. J. Am. Chem. Soc. 2000, 122, 8977–8989. [Google Scholar] [CrossRef]
- Li, C.; Shaik, S. How Do Perfluorinated Alkanoic Acids Elicit Cytochrome P450 to Catalyze Methane Hydroxylation? An MD and QM/MM Study. RSC Adv. 2012, 3, 2995–3005. [Google Scholar] [CrossRef]
- Olsen, L.; Rydberg, P.; Rod, T.H.; Ryde, U. Prediction of Activation Energies for Hydrogen Abstraction by Cytochrome P450. J. Med. Chem. 2006, 49, 6489–6499. [Google Scholar] [CrossRef]
- Fukui, K. The Path of Chemical Reactions—The IRC Approach. Acc. Chem. Res. 1981, 14, 363–368. [Google Scholar] [CrossRef]
- Becke, A.D. Density-Functional Thermochemistry. III. The Role of Exact Exchange. J. Chem. Phys. 1993, 98, 5648–5652. [Google Scholar] [CrossRef]
- Lee, C.; Yang, W.; Parr, R.G. Development of the Colle-Salvetti Correlation-Energy Formula into a Functional of the Electron Density. Phys. Rev. B Condens. Matter 1988, 37, 785–789. [Google Scholar] [CrossRef] [PubMed]
- Vosko, S.H.; Wilk, L.; Nusair, M. Accurate Spin-Dependent Electron Liquid Correlation Energies for Local Spin Density Calculations: A Critical Analysis. Can. J. Phys. 1980, 58, 1200–1211. [Google Scholar] [CrossRef]
- Stephens, P.J.; Devlin, F.J.; Chabalowski, C.F.; Frisch, M.J. Ab Initio Calculation of Vibrational Absorption and Circular Dichroism Spectra Using Density Functional Force Fields. J. Phys. Chem. 1994, 98, 11623–11627. [Google Scholar] [CrossRef]
- Grimme, S.; Ehrlich, S.; Goerigk, L. Effect of the Damping Function in Dispersion Corrected Density Functional Theory. J. Comput. Chem. 2011, 32, 1456–1465. [Google Scholar] [CrossRef]
- Becke, A.D.; Johnson, E.R. A Density-Functional Model of the Dispersion Interaction. J. Chem. Phys. 2005, 123, 154101. [Google Scholar] [CrossRef]
- Weigend, F.; Ahlrichs, R. Balanced Basis Sets of Split Valence, Triple Zeta Valence and Quadruple Zeta Valence Quality for H to Rn: Design and Assessment of Accuracy. Phys. Chem. Chem. Phys. 2005, 7, 3297–3305. [Google Scholar] [CrossRef]
- Ditchfield, R.; Hehre, W.J.; Pople, J.A. Self-Consistent Molecular-Orbital Methods. IX. An Extended Gaussian-Type Basis for Molecular-Orbital Studies of Organic Molecules. J. Chem. Phys. 1971, 54, 724–728. [Google Scholar] [CrossRef]
- Hehre, W.J.; Ditchfield, R.; Pople, J.A. Self—Consistent Molecular Orbital Methods. XII. Further Extensions of Gaussian—Type Basis Sets for Use in Molecular Orbital Studies of Organic Molecules. J. Chem. Phys. 1972, 56, 2257–2261. [Google Scholar] [CrossRef]
- Mitin, A.V.; Baker, J.; Pulay, P. An Improved 6-31G* Basis Set for First-Row Transition Metals. J. Chem. Phys. 2003, 118, 7775–7782. [Google Scholar] [CrossRef]
- Hariharan, P.C.; Pople, J.A. The Influence of Polarization Functions on Molecular Orbital Hydrogenation Energies. Theor. Chim. Acta 1973, 28, 213–222. [Google Scholar] [CrossRef]
- Frisch, M.J.; Trucks, G.W.; Schlegel, H.B.; Scuseria, G.E.; Robb, M.A.; Cheeseman, J.R.; Scalmani, G.; Barone, V.; Petersson, G.A.; Nakatsuji, H.; et al. Gaussian 16, Revision C.01; Gaussian, Inc.: Wallingford, CT, USA, 2016. [Google Scholar]
- Wu, W.; Su, P.; Shaik, S.; Hiberty, P.C. Classical Valence Bond Approach by Modern Methods. Chem. Rev. 2011, 111, 7557–7593. [Google Scholar] [CrossRef] [PubMed]
- Chen, Z.; Ying, F.; Chen, X.; Song, J.; Su, P.; Song, L.; Mo, Y.; Zhang, Q.; Wu, W. XMVB 2.0: A New Version of Xiamen Valence Bond Program. Int. J. Quantum Chem. 2015, 115, 731–737. [Google Scholar] [CrossRef]
- Schmidt, M.W.; Baldridge, K.K.; Boatz, J.A.; Elbert, S.T.; Gordon, M.S.; Jensen, J.H.; Koseki, S.; Matsunaga, N.; Nguyen, K.A.; Su, S.; et al. General Atomic and Molecular Electronic Structure System. J. Comput. Chem. 1993, 14, 1347–1363. [Google Scholar] [CrossRef]
- van Lenthe, J.H.; Balint-Kurti, G.G. The Valence-Bond SCF (VB SCF) Method. Synopsis of Theory and Test Calculation of OH Potential Energy Curve. Chem. Phys. Lett. 1980, 76, 138–142. [Google Scholar] [CrossRef]
- van Lenthe, J.H.; Balint-Kurti, G.G. The Valence-Bond Self-Consistent Field Method (VB–SCF): Theory and Test Calculations. J. Chem. Phys. 1983, 78, 5699–5713. [Google Scholar] [CrossRef]
- Hiberty, P.C.; Flament, J.P.; Noizet, E. Compact and Accurate Valence Bond Functions with Different Orbitals for Different Configurations: Application to the Two-Configuration Description of F2. Chem. Phys. Lett. 1992, 189, 259–265. [Google Scholar] [CrossRef]
- Hiberty, P.C.; Humbel, S.; Byrman, C.P.; van Lenthe, J.H. Compact Valence Bond Functions with Breathing Orbitals: Application to the Bond Dissociation Energies of F2 and FH. J. Chem. Phys. 1994, 101, 5969–5976. [Google Scholar] [CrossRef]
- Hiberty, P.C.; Shaik, S. Breathing-Orbital Valence Bond Method—A Modern Valence Bond Method That Includes Dynamic Correlation. Theor. Chem. Acc. 2002, 108, 255–272. [Google Scholar] [CrossRef]
- Chirgwin, B.H.; Coulson, C.A. The Electronic Structure of Conjugated Systems. VI. Proc. R. Soc. Lond. 1950, 201, 196–209. [Google Scholar]
- Bode, B.M.; Gordon, M.S. Macmolplt: A Graphical User Interface for GAMESS. J. Mol. Graph. Model. 1998, 16, 133–138. [Google Scholar] [CrossRef] [PubMed]

| RC | TS | INT | |
|---|---|---|---|
| DFT a | 0.00 | 28.41 | 25.64 |
| VBSCF b | 0.00 | 43.46 | 11.52 |
| BOVB b | 0.00 | 39.69 | 10.19 |
| Weight | RC1 | TS1B | INT1B |
|---|---|---|---|
| W1 | 68.30 | 11.45 | 0.64 |
| W2 | 4.27 | 1.85 | 0.16 |
| W3 | 27.43 | 12.00 | 0.50 |
| W4 | −0.01 | 35.98 | 57.34 |
| W5 | 0.00 | 3.66 | 3.48 |
| W6 | 0.00 | 35.06 | 37.89 |
| WCH | 100.00 | 25.30 | 1.30 |
| WOH | 0.00 | 74.70 | 98.70 |
Disclaimer/Publisher’s Note: The statements, opinions and data contained in all publications are solely those of the individual author(s) and contributor(s) and not of MDPI and/or the editor(s). MDPI and/or the editor(s) disclaim responsibility for any injury to people or property resulting from any ideas, methods, instructions or products referred to in the content. |
© 2025 by the authors. Licensee MDPI, Basel, Switzerland. This article is an open access article distributed under the terms and conditions of the Creative Commons Attribution (CC BY) license (https://creativecommons.org/licenses/by/4.0/).
Share and Cite
Zhang, E.; Hirao, H. Valence Bond Insights into the H-Abstraction Barrier in Cytochrome P450. Molecules 2025, 30, 2242. https://doi.org/10.3390/molecules30102242
Zhang E, Hirao H. Valence Bond Insights into the H-Abstraction Barrier in Cytochrome P450. Molecules. 2025; 30(10):2242. https://doi.org/10.3390/molecules30102242
Chicago/Turabian StyleZhang, Enhua, and Hajime Hirao. 2025. "Valence Bond Insights into the H-Abstraction Barrier in Cytochrome P450" Molecules 30, no. 10: 2242. https://doi.org/10.3390/molecules30102242
APA StyleZhang, E., & Hirao, H. (2025). Valence Bond Insights into the H-Abstraction Barrier in Cytochrome P450. Molecules, 30(10), 2242. https://doi.org/10.3390/molecules30102242