

QuEChERS and UPLC-MS/MS-Based Quantification of Human Plasma of Eight Nucleoside Reverse Transcriptase Inhibitors and Platinum Anticancer Drugs for Hepatocellular Carcinoma


Abstract
1. Introduction
2. Results
2.1. Validation
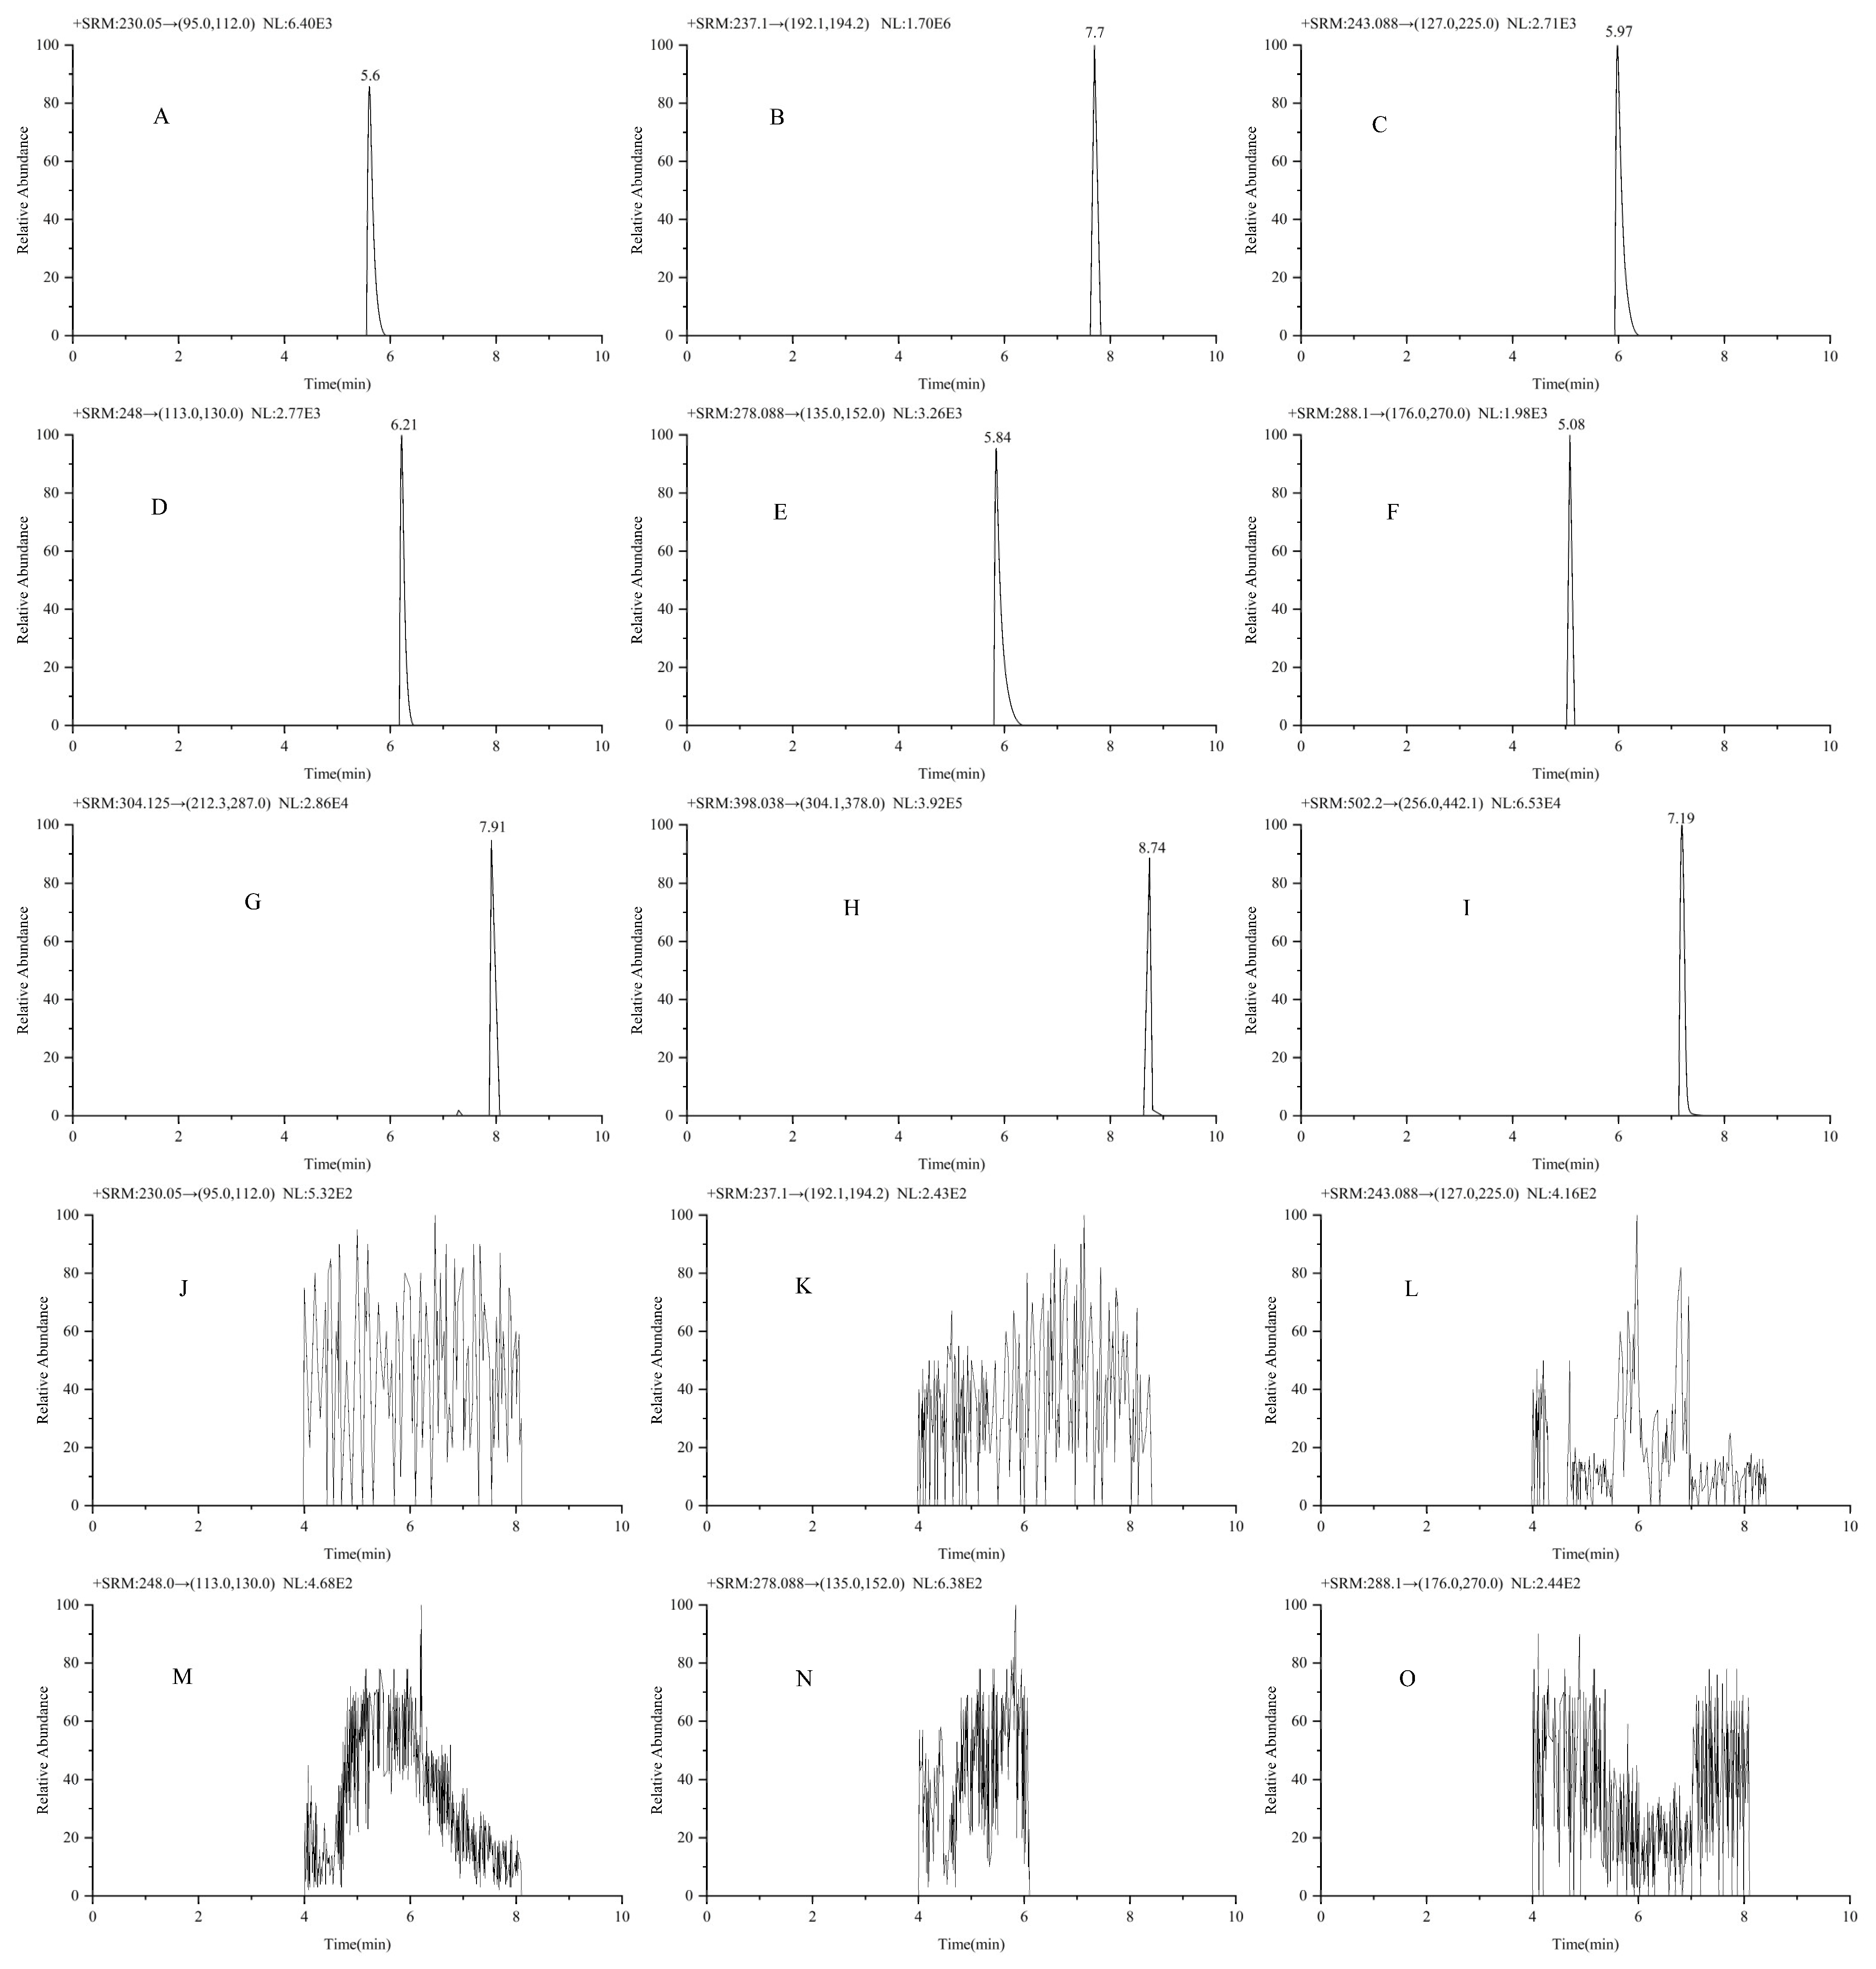
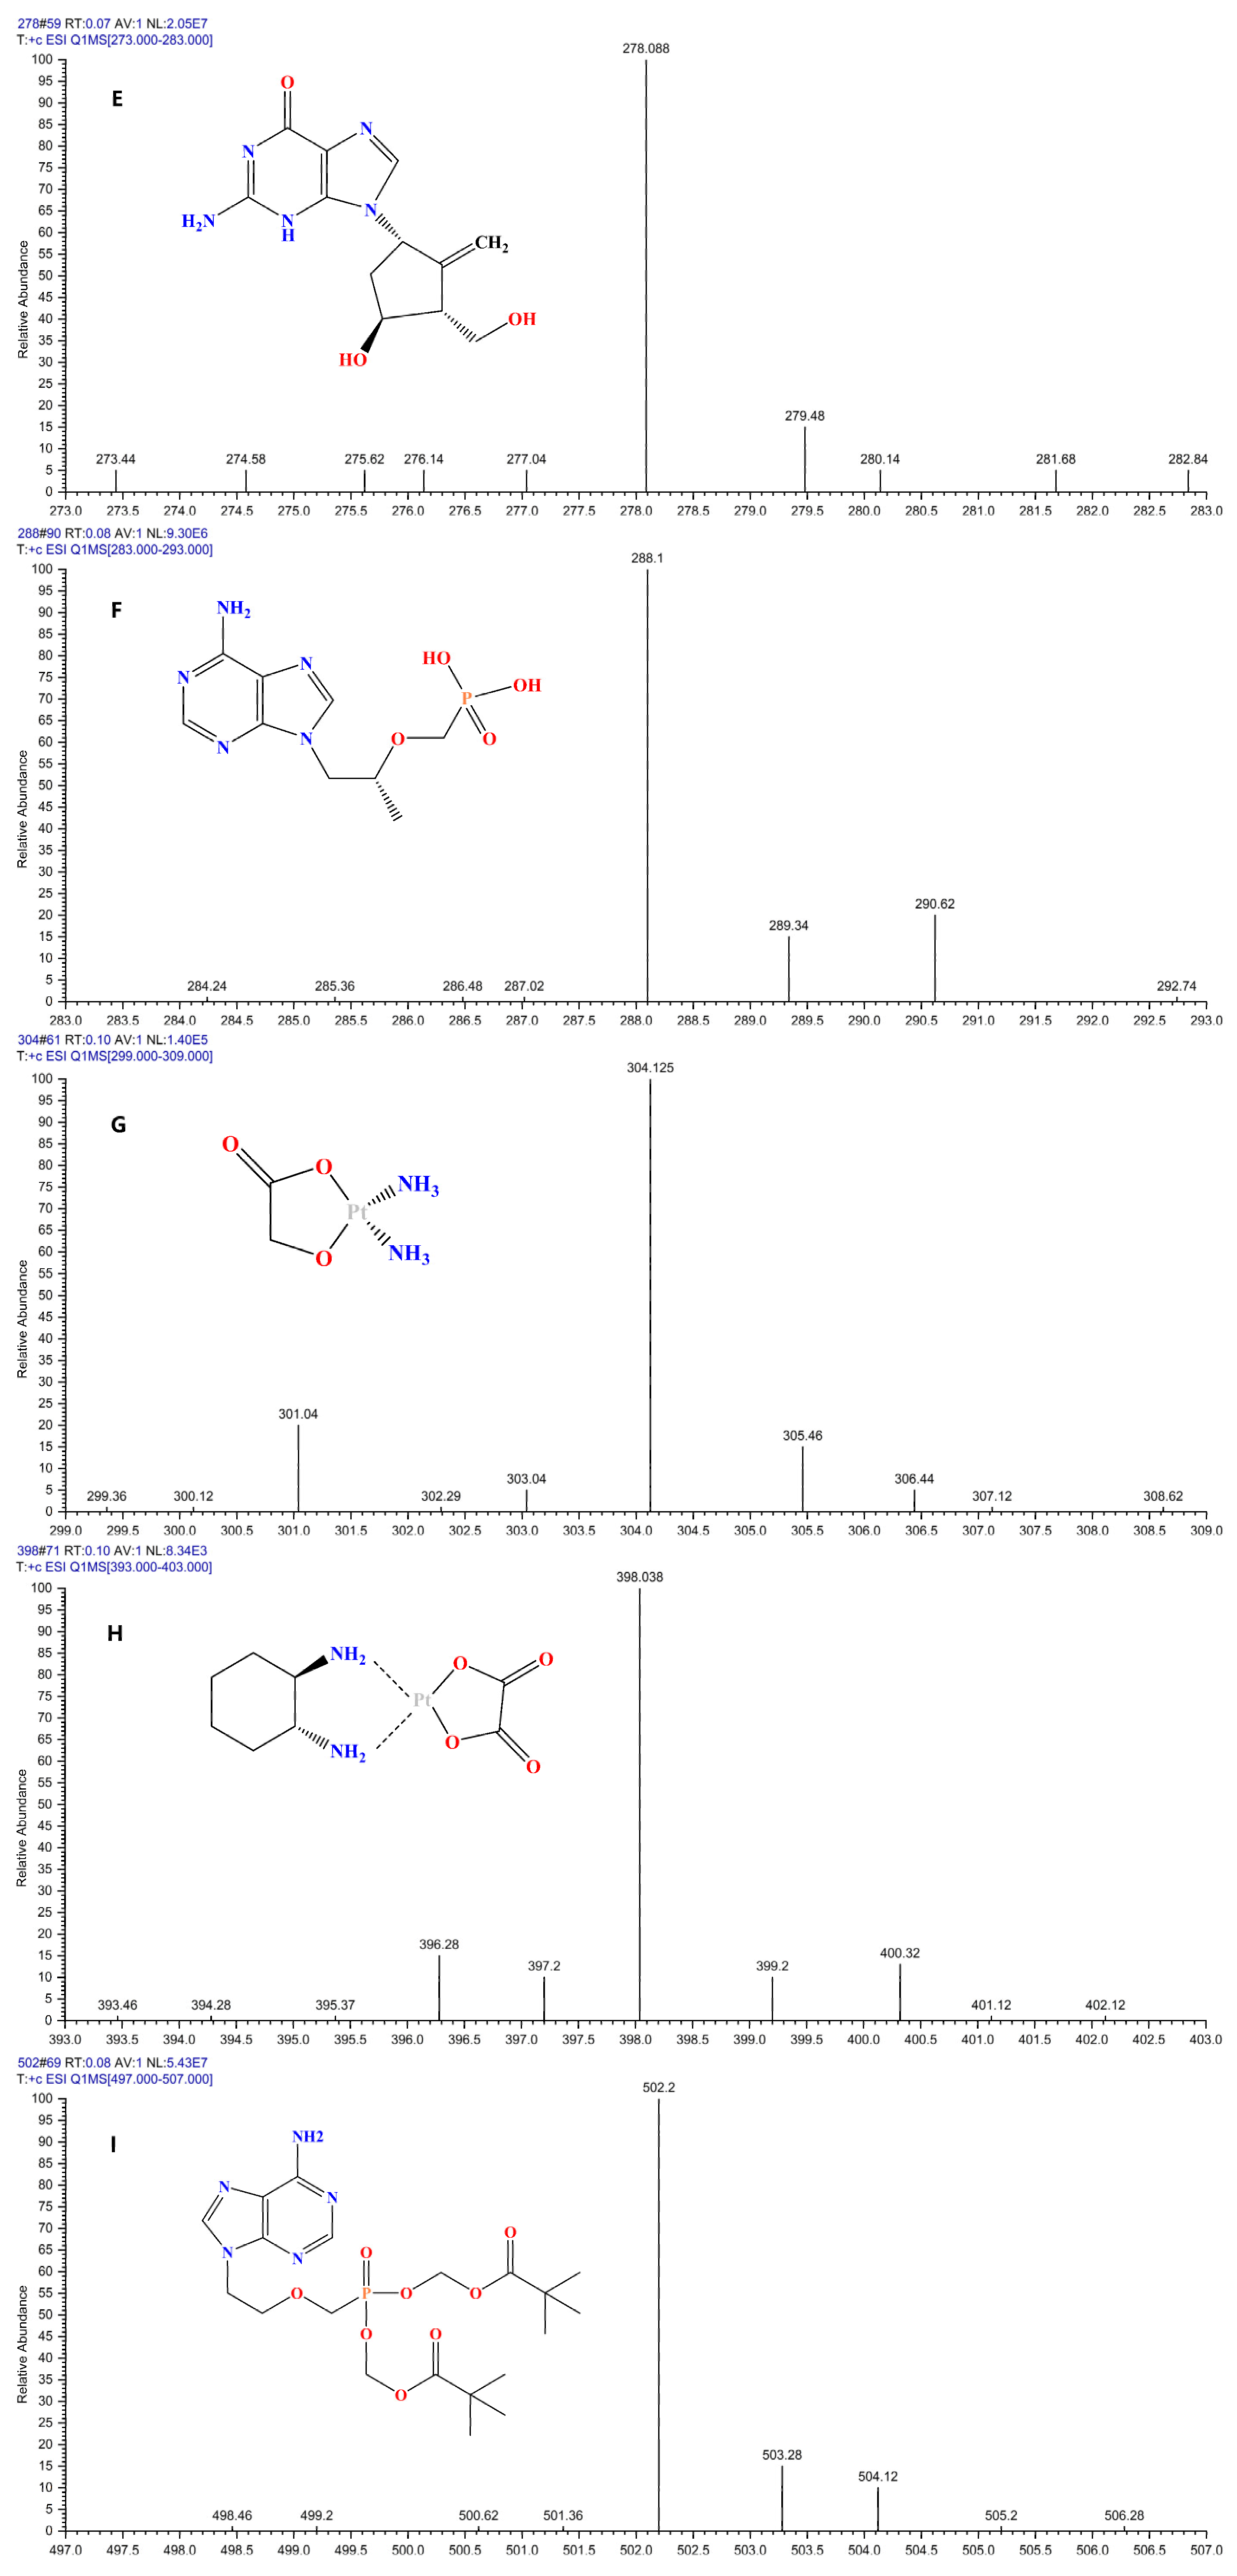
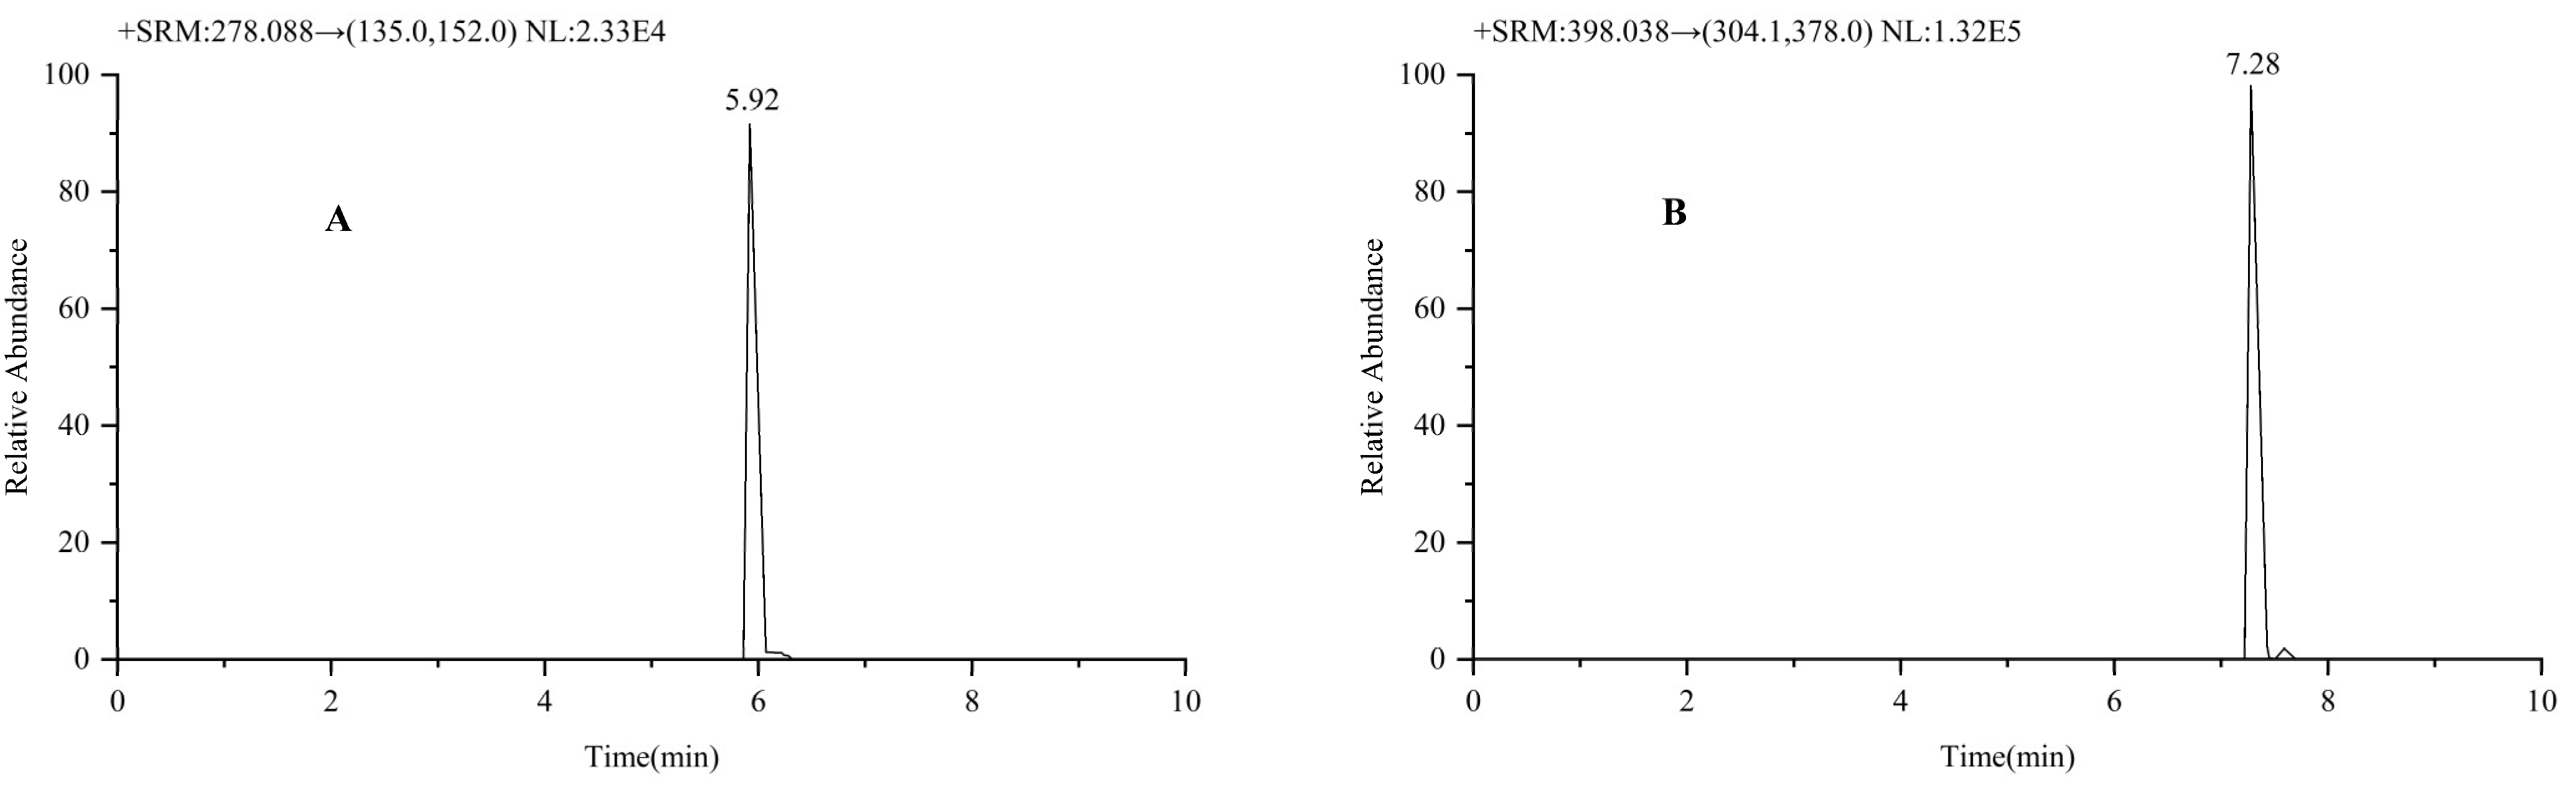
2.1.1. Selectivity and Specificity
2.1.2. Preparation of Standard Curves
2.1.3. Precision and Accuracy
2.1.4. Matrix Effects and Recovery
2.1.5. Stability
3. Discussion
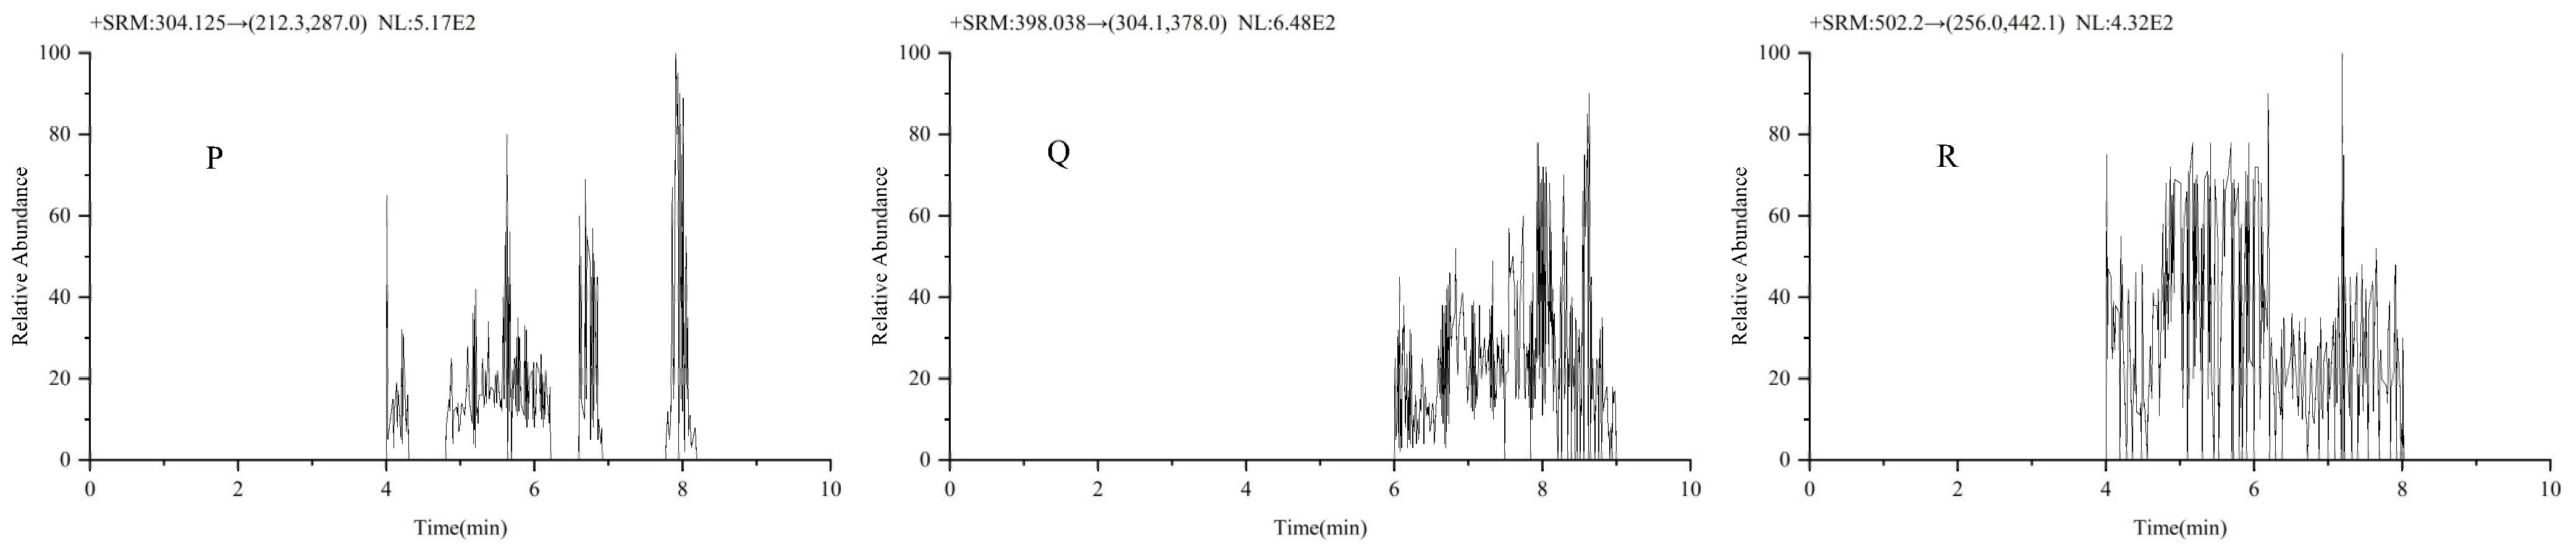
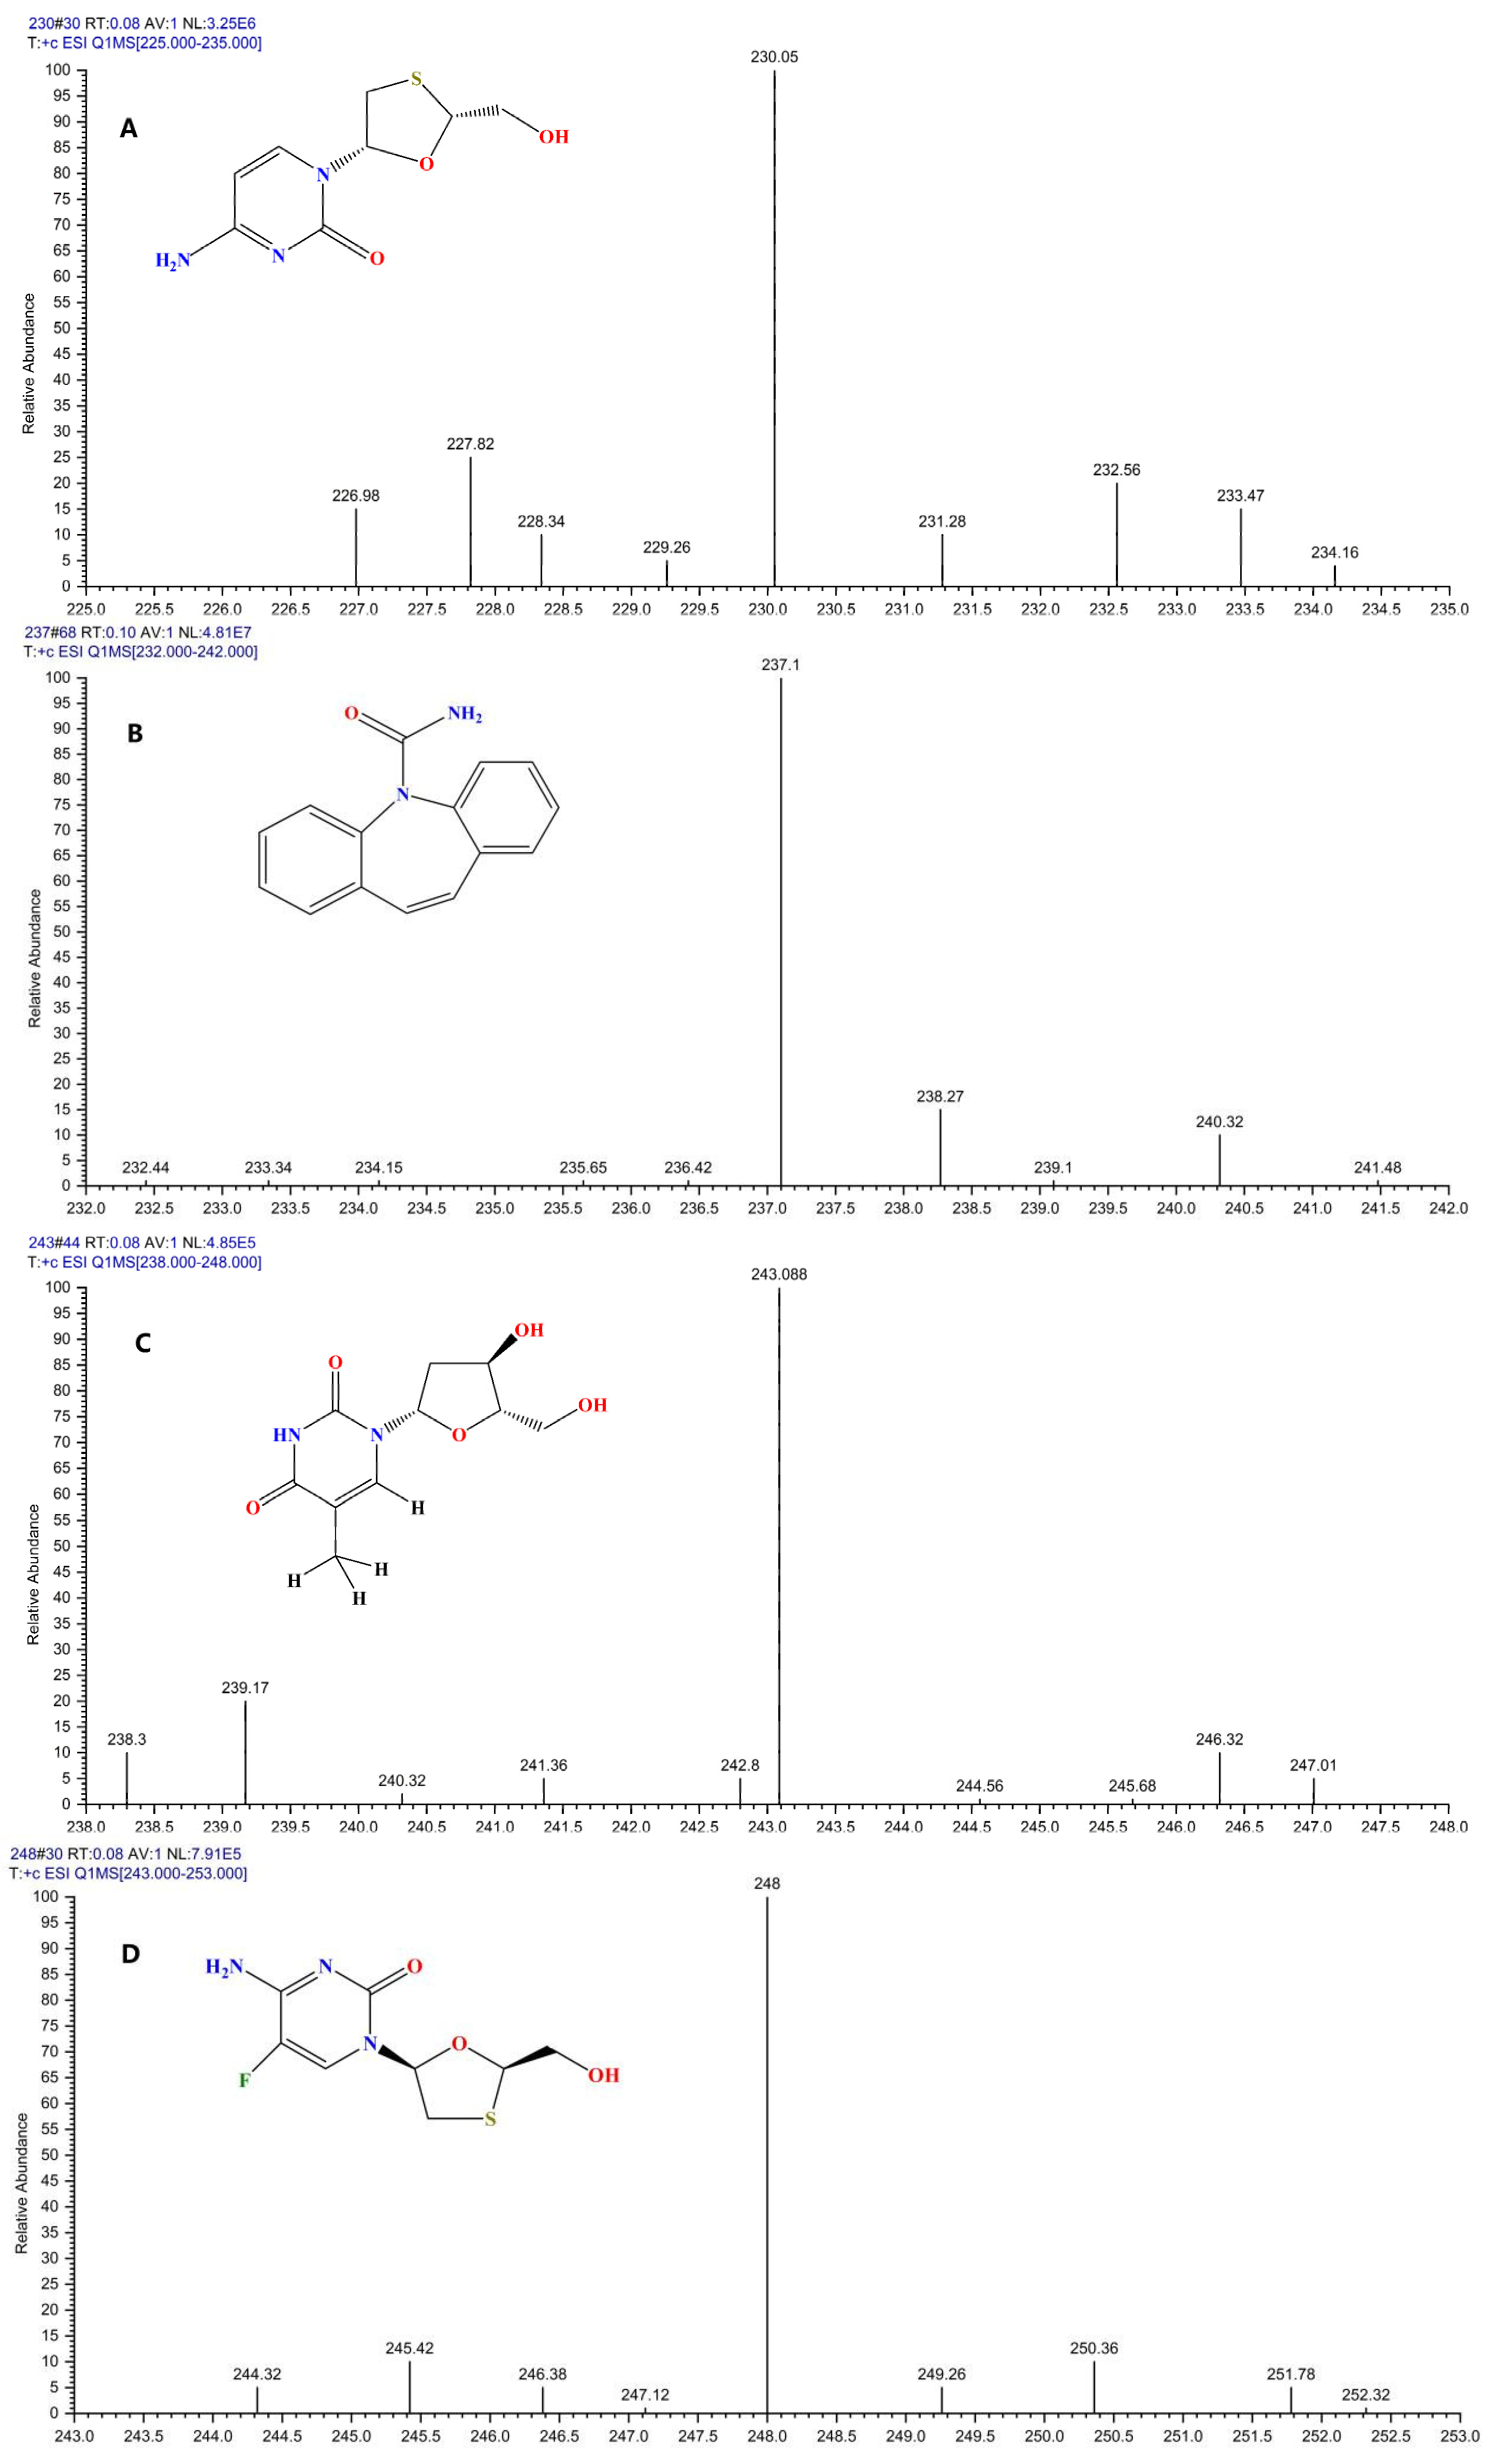
3.1. MS Conditions
3.2. MS Optimization
3.3. Pretreatment Condition Optimization
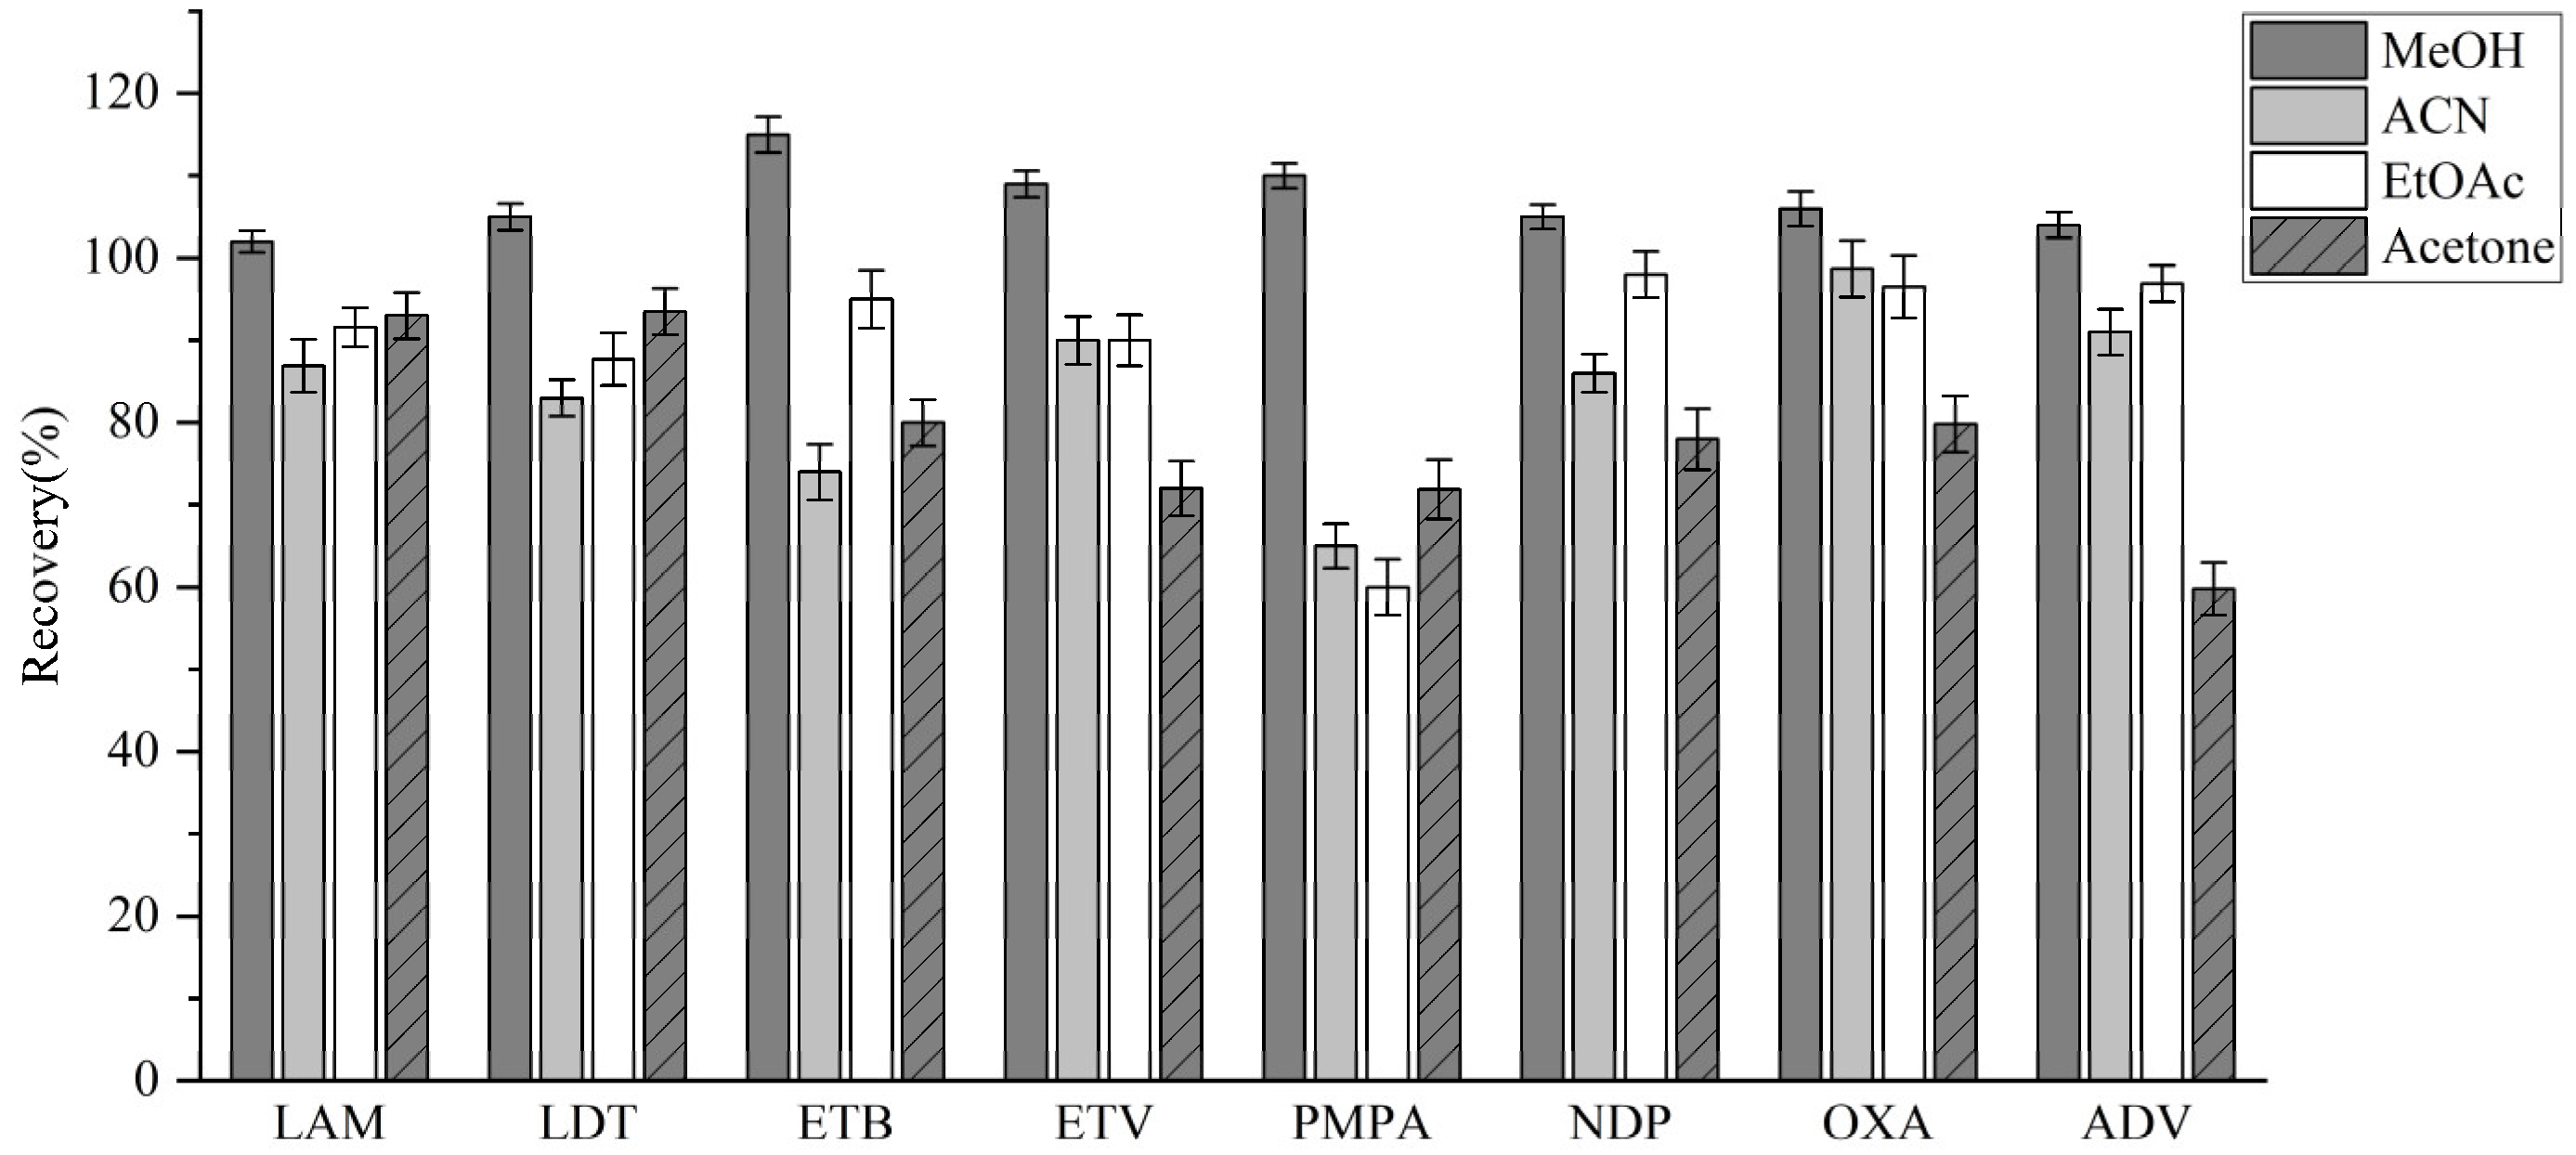
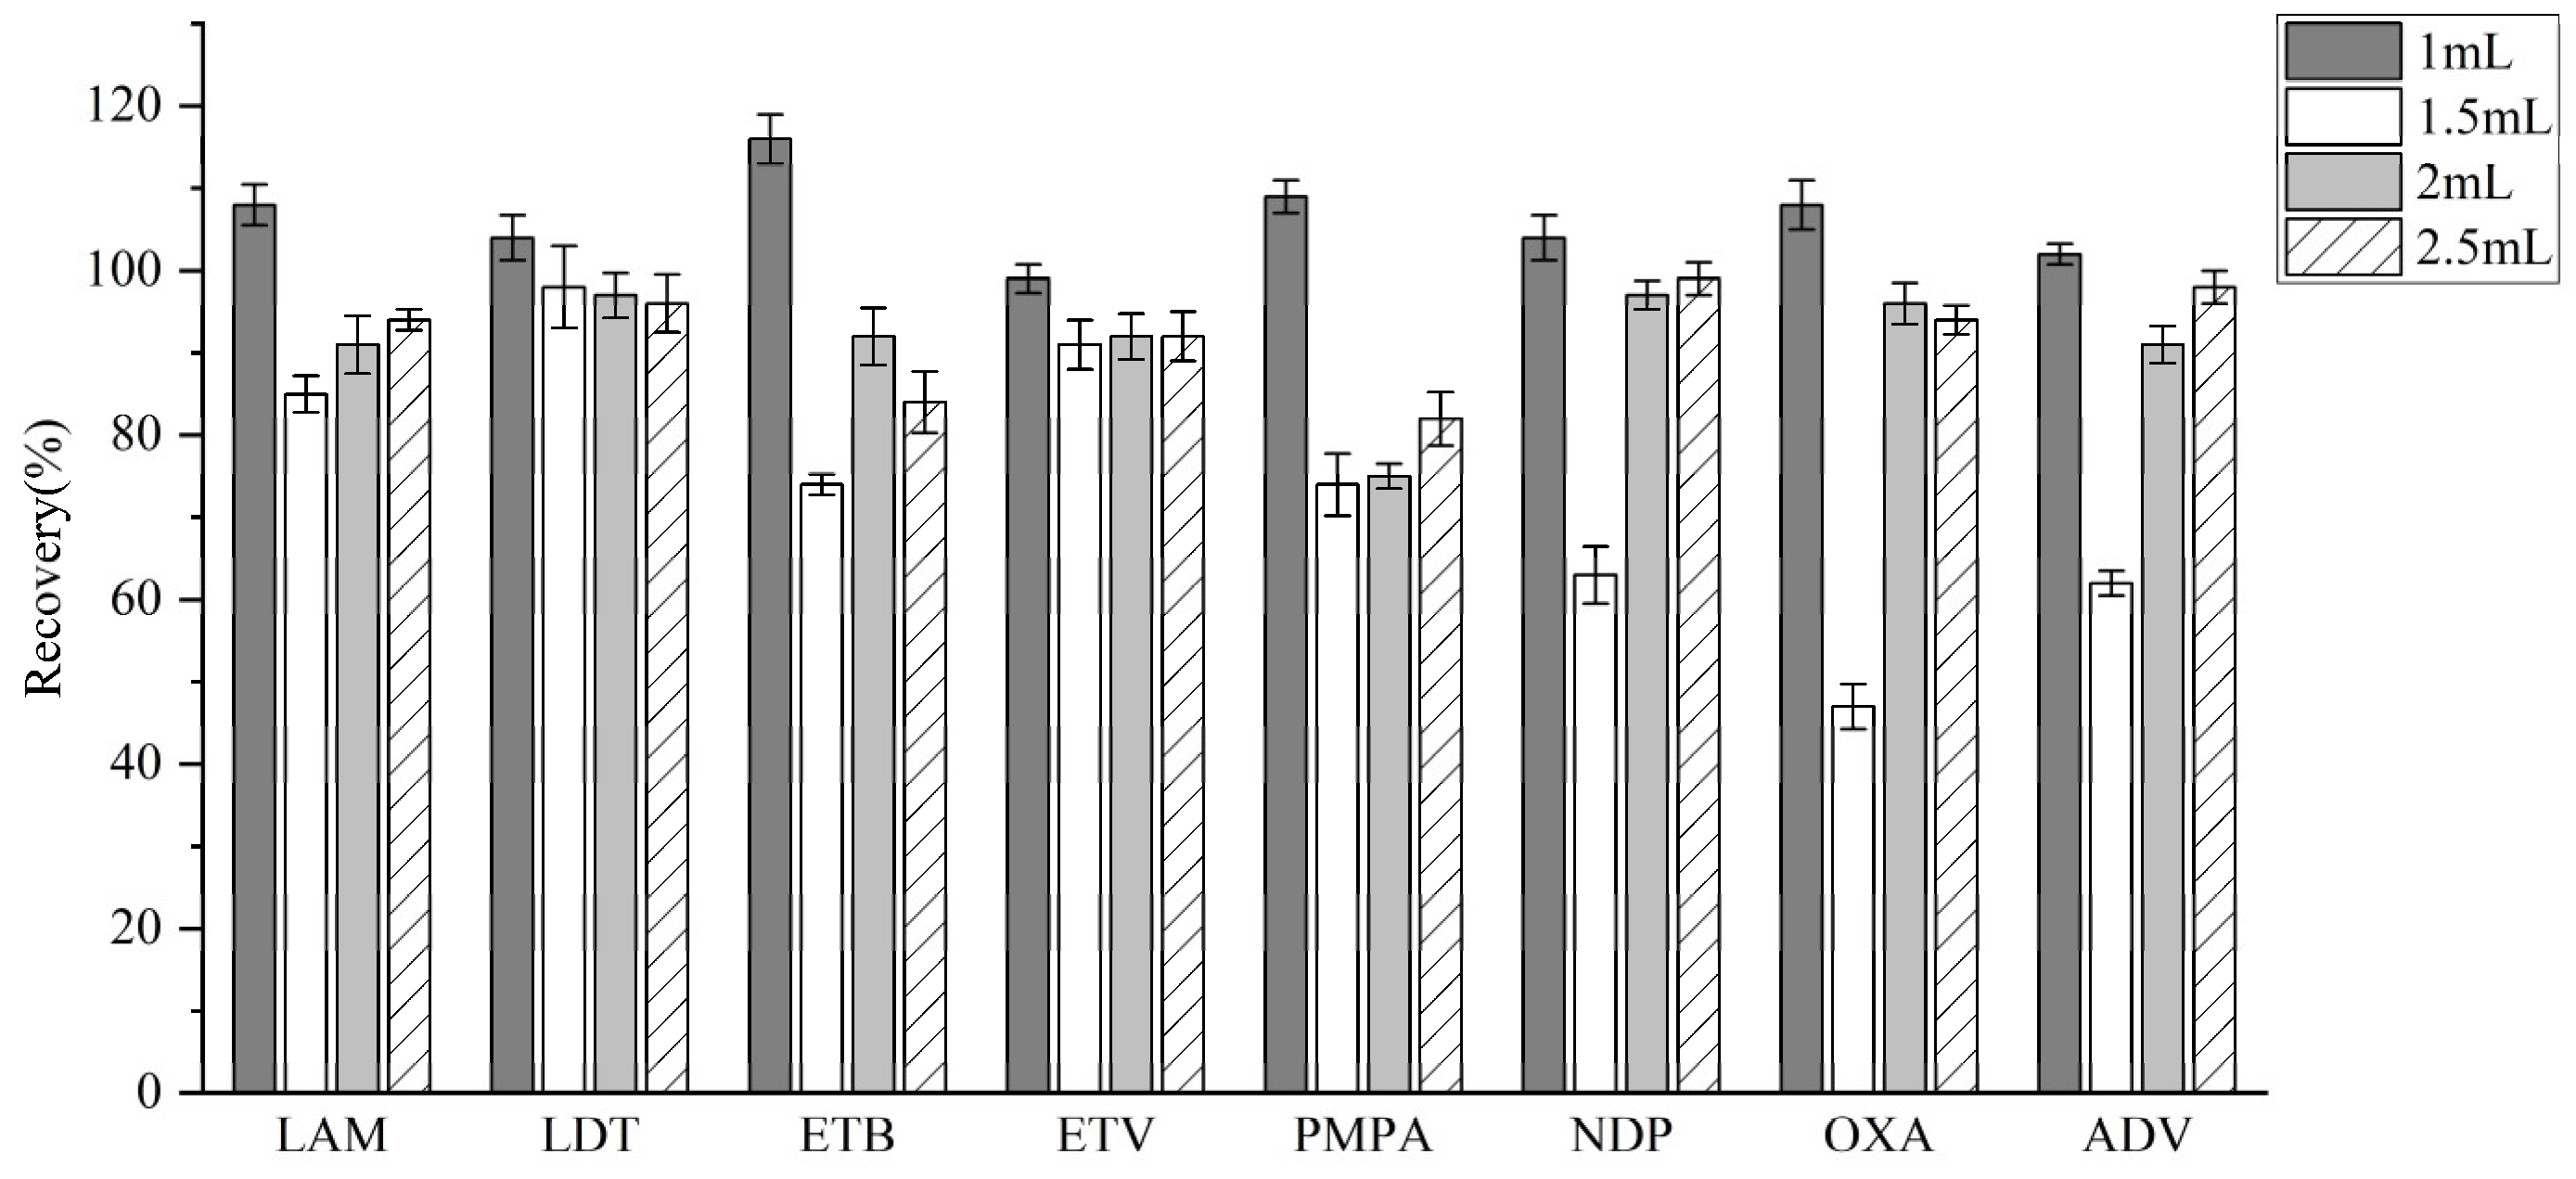
3.3.1. Extractant Optimization
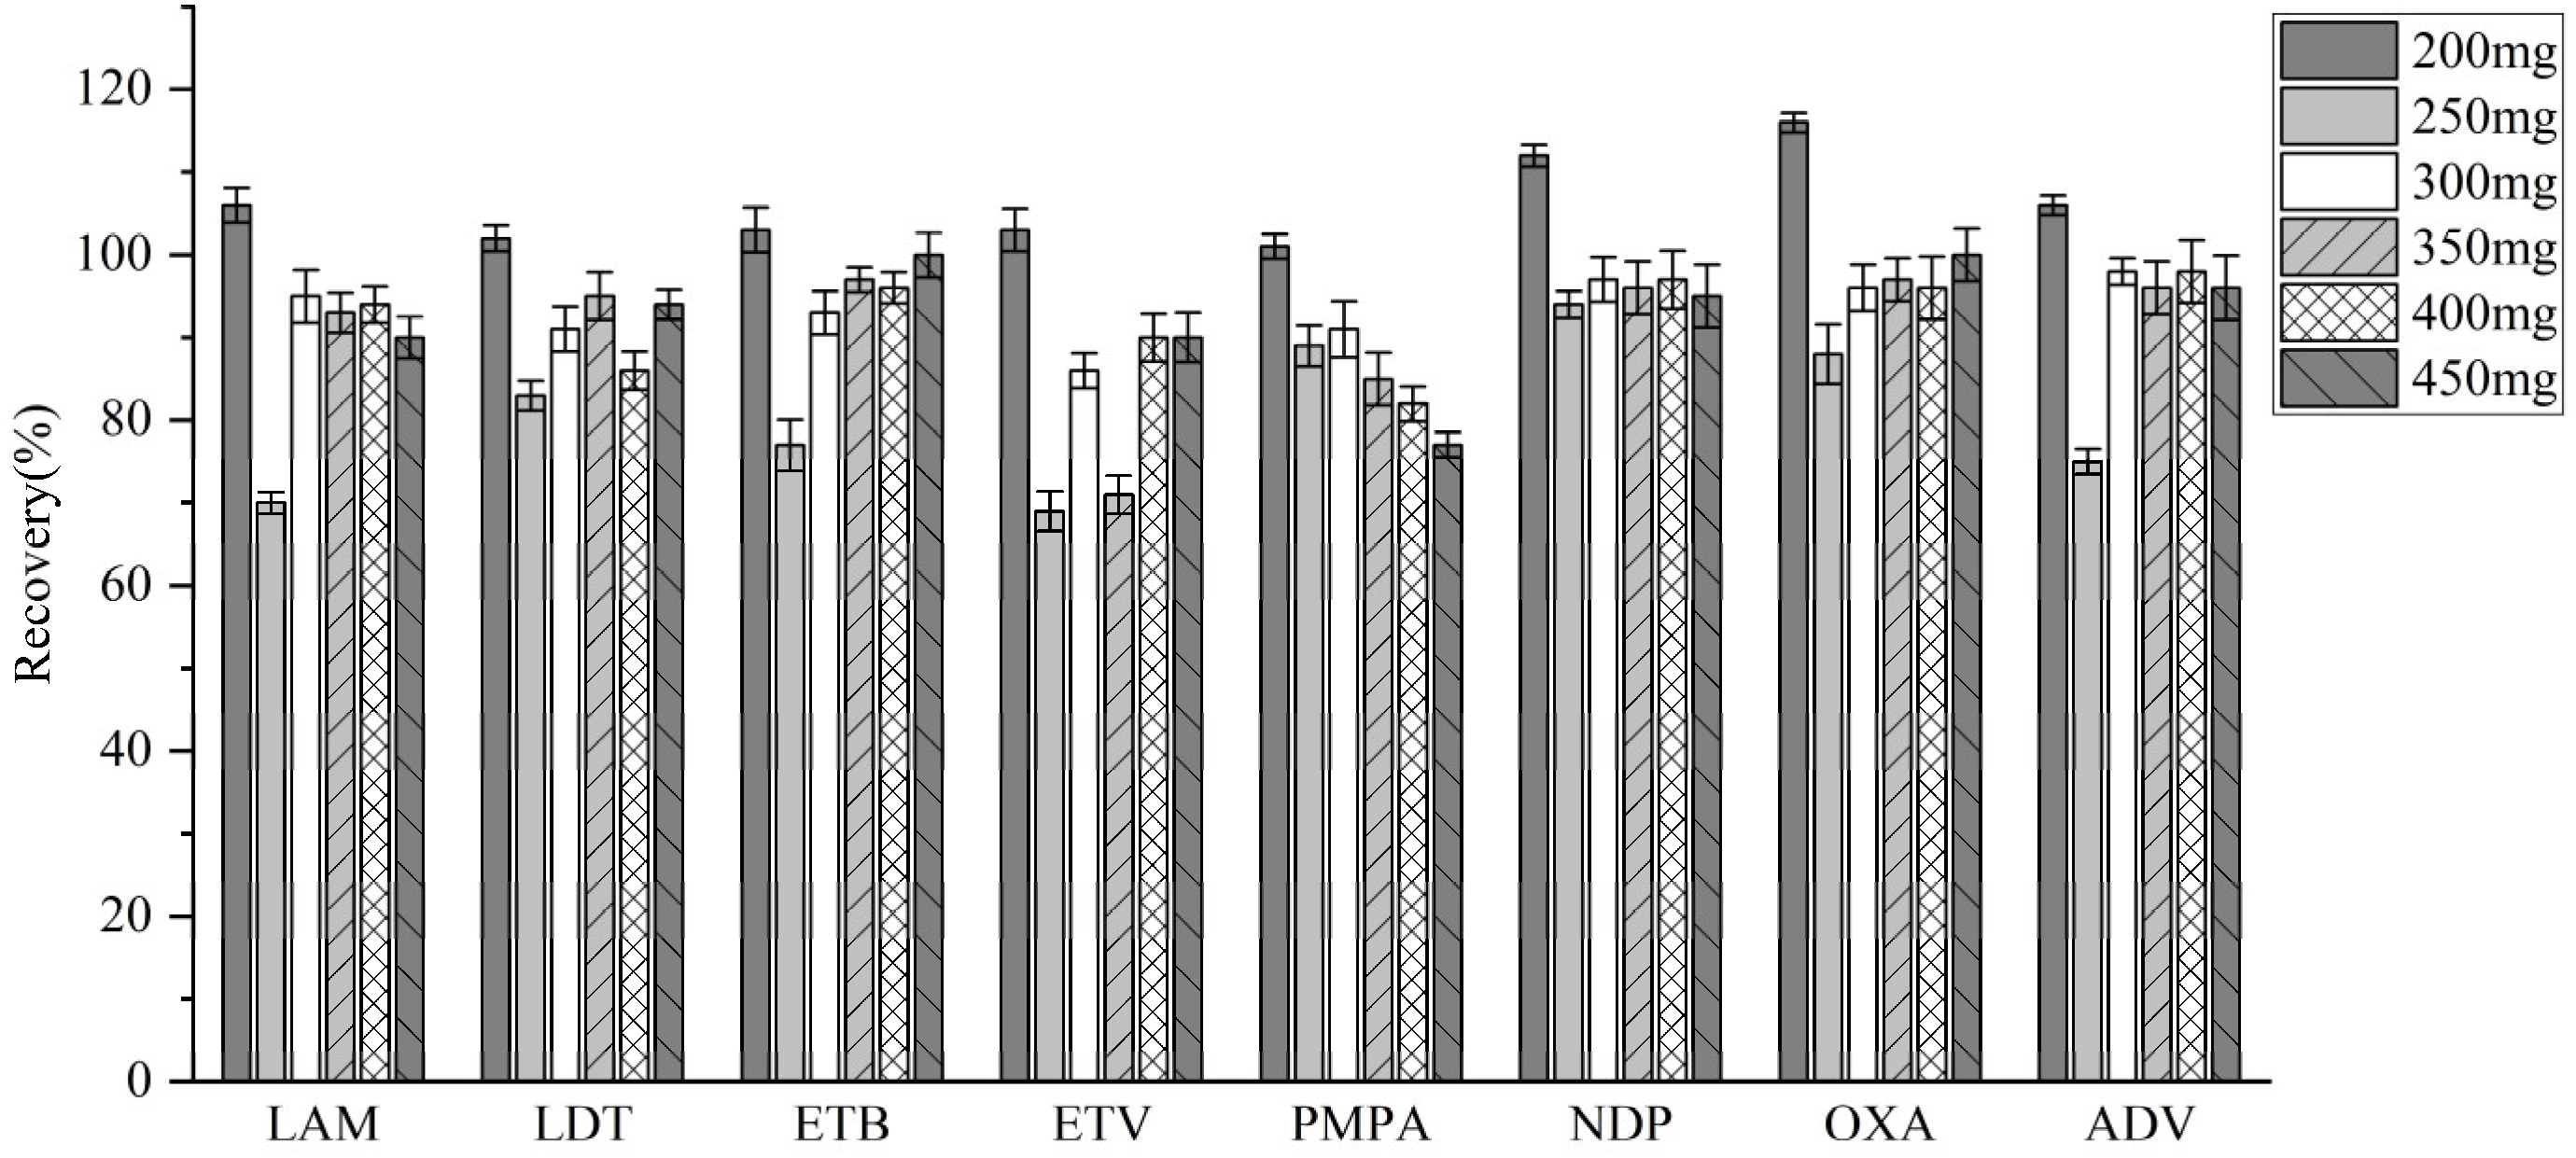
3.3.2. Selection of Salting-Out Agents
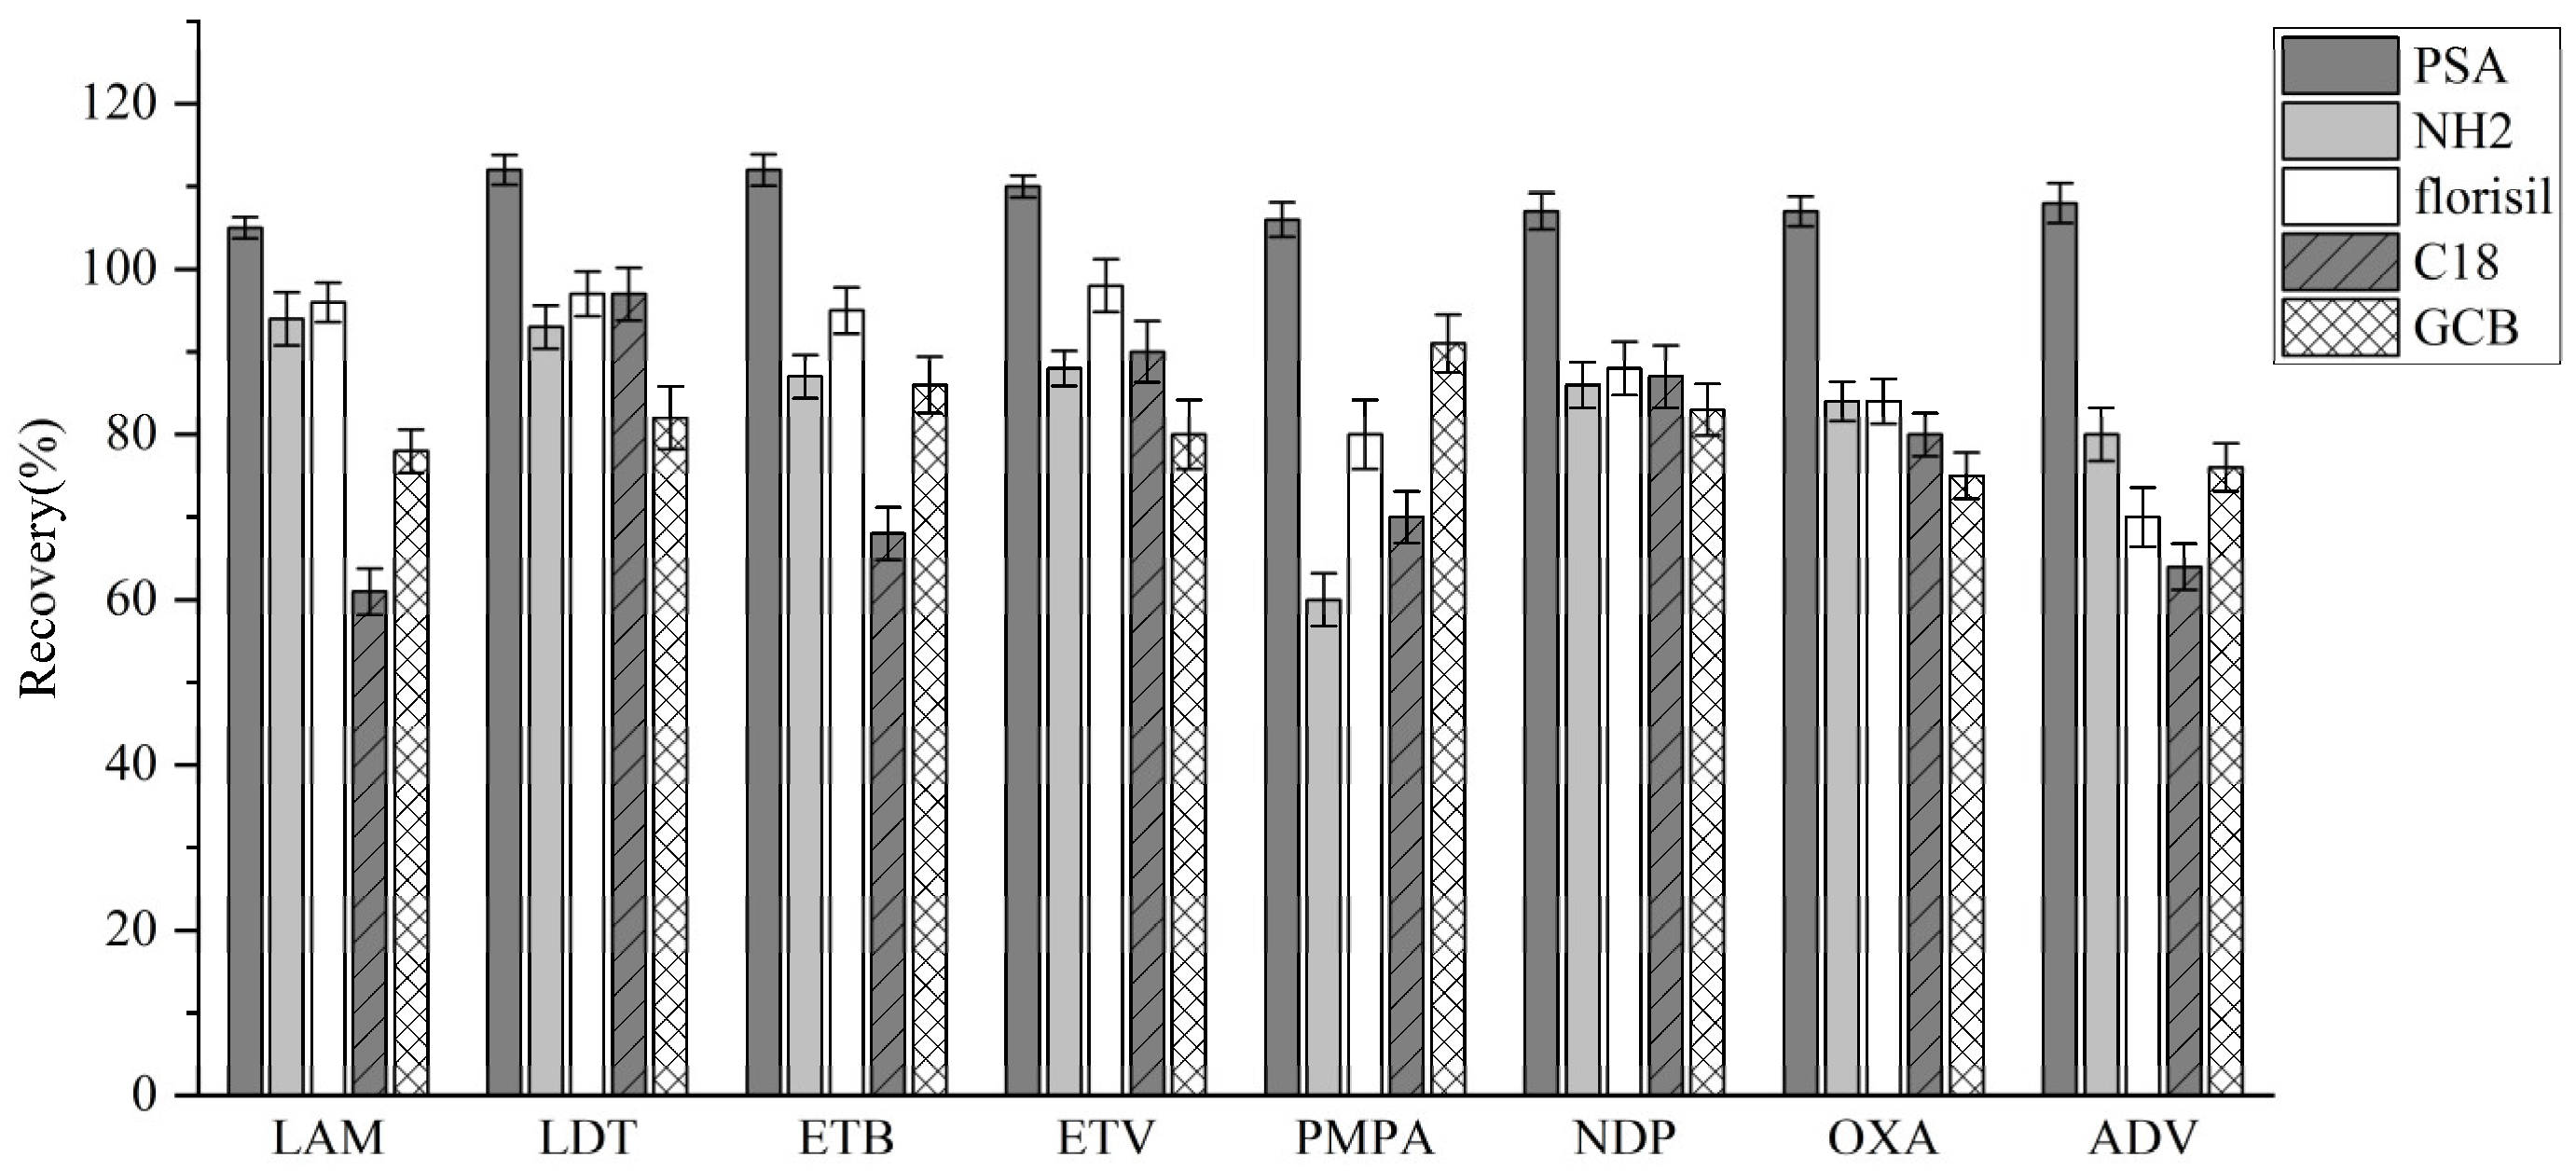
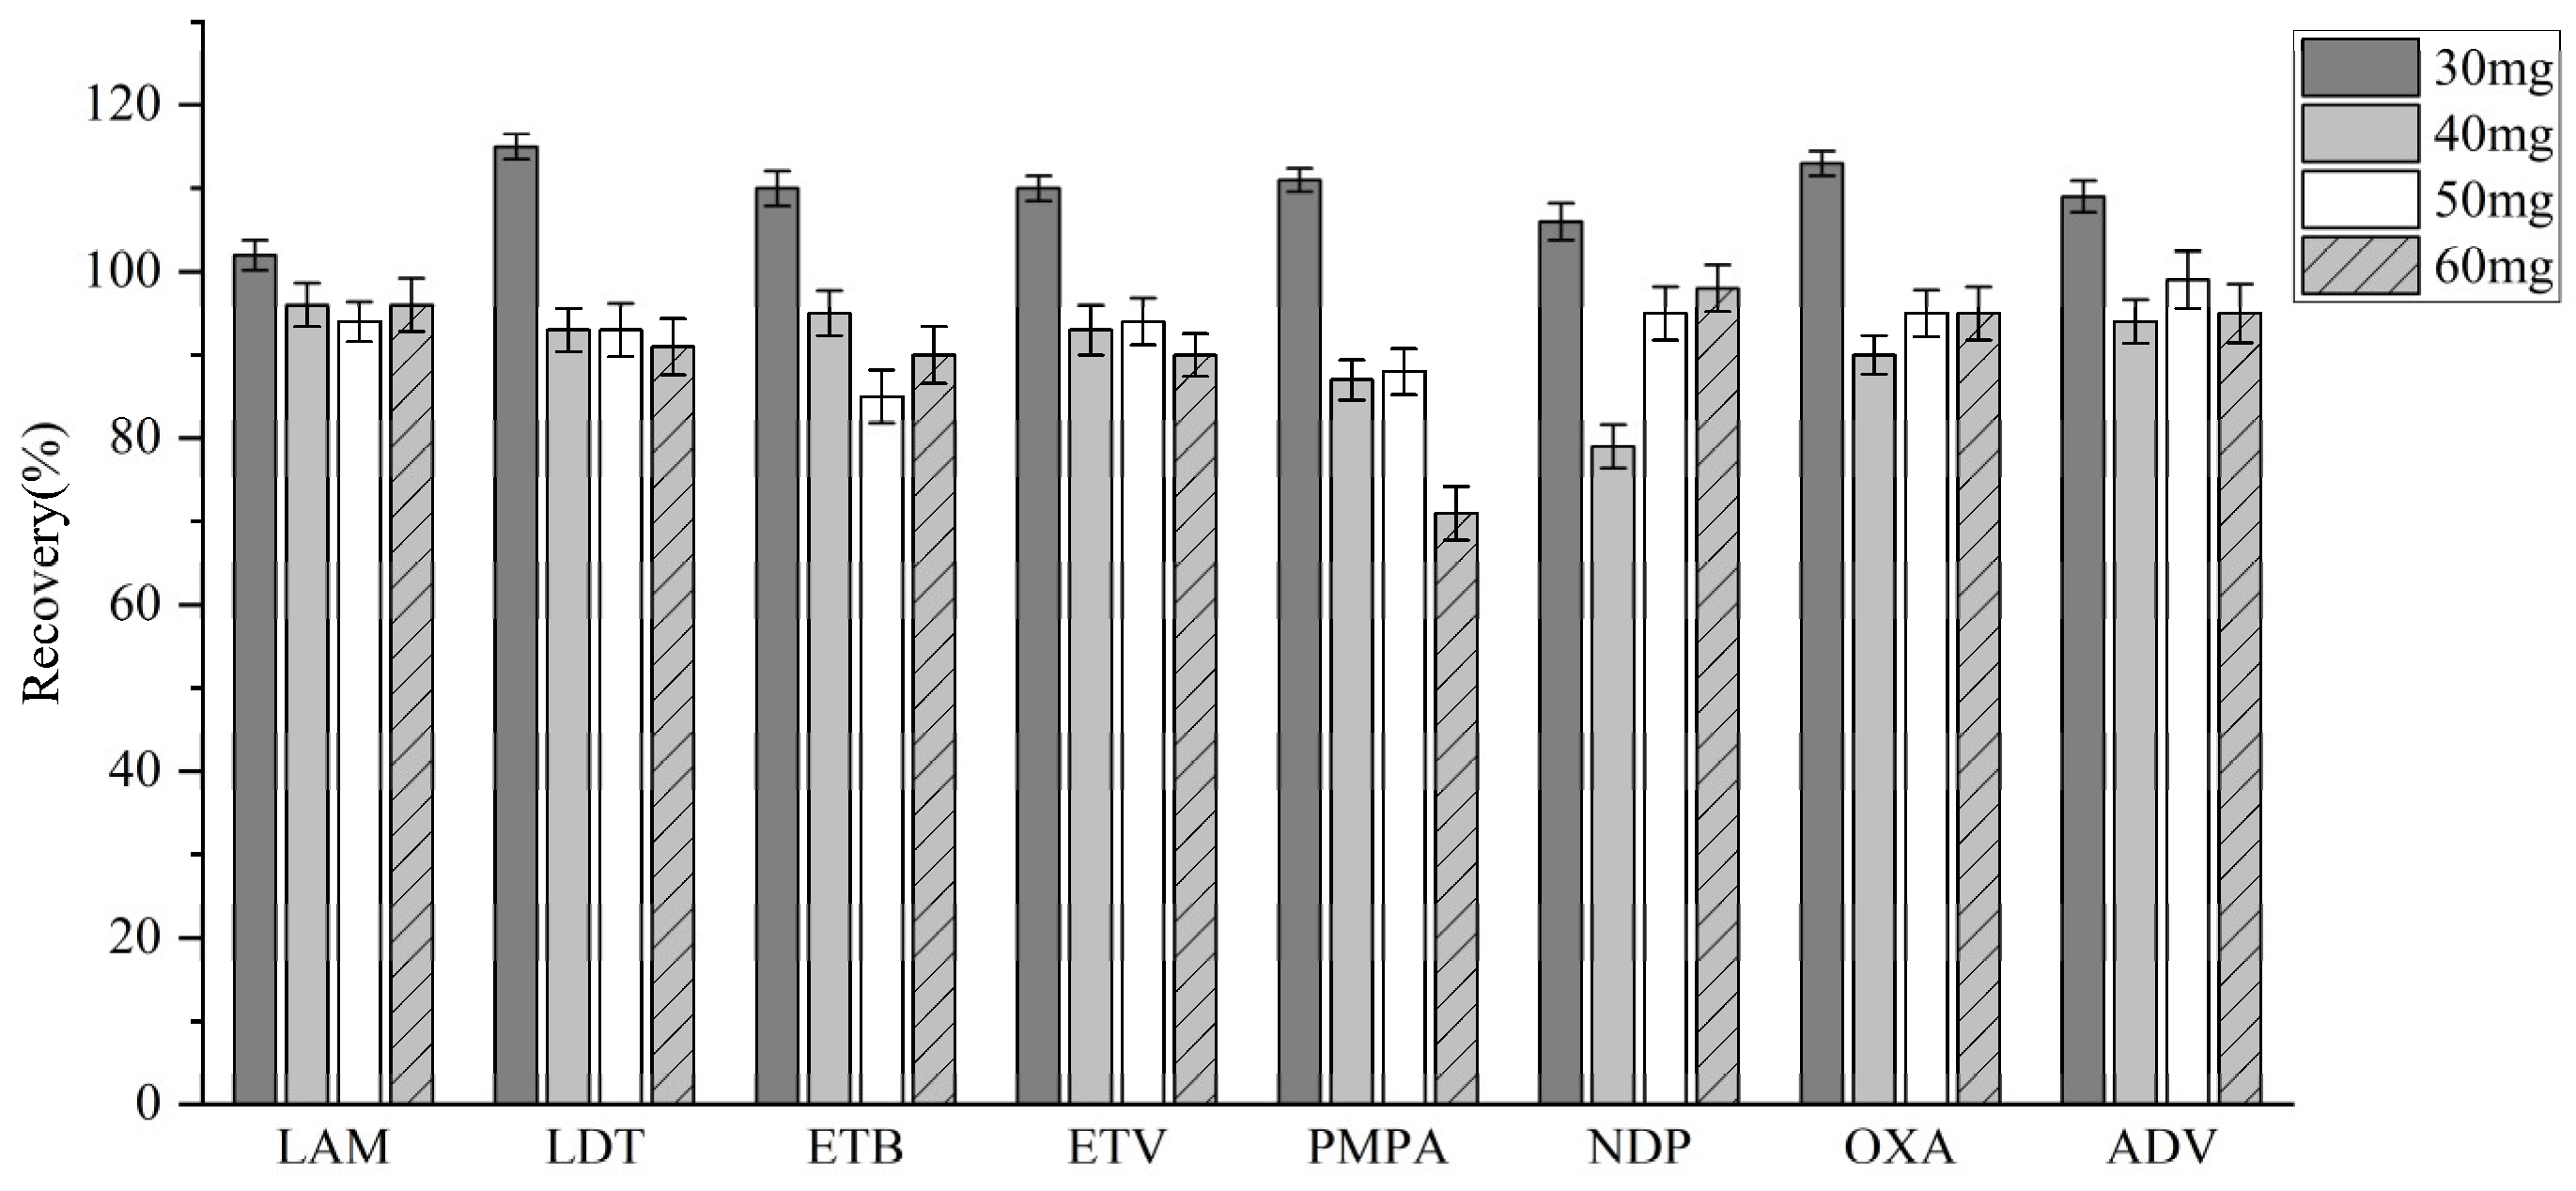
3.3.3. Adsorption Condition Optimization
4. Materials and Methods
4.1. Chemicals and Instruments
4.2. Chromatography
4.3. MS
4.4. Standard Preparation
4.5. Sample Pretreatment
4.6. Method Validation
4.7. Method Application
5. Conclusions
Author Contributions
Funding
Institutional Review Board Statement
Informed Consent Statement
Data Availability Statement
Conflicts of Interest
Abbreviations
| NRTIs | Nucleoside reverse transcriptase inhibitors |
| HCC | Hepatocellular carcinoma |
| LAM | Lamivudine |
| LDT | Telbivudine |
| ETB | Emtricitabine |
| ETV | Entecavir |
| PMPA | Tenofovir |
| NDP | Nedaplatin |
| OXA | Oxaliplatin |
| ADV | Adefovir dipivoxil |
References
- Roy, P.S.; Saikia, B.J. Cancer and cure: A critical analysis. Indian J. Cancer 2016, 53, 441–442. [Google Scholar] [CrossRef] [PubMed]
- Yang, J.D.; Hainaut, P.; Gores, G.J.; Amadou, A.; Plymoth, A.; Roberts, L.R. A global view of hepatocellular carcinoma: Trends, risk, prevention and management. Nat. Rev. Gastroenterol. Hepatol. 2019, 16, 589–604. [Google Scholar] [CrossRef] [PubMed]
- Brochard, T.; McIntyre, R.L.; Houtkooper, R.H.; Seluanov, A.; Gorbunova, V.; Janssens, G.E. Repurposing nucleoside reverse transcriptase inhibitors (NRTIs) to slow aging. Ageing Res. Rev. 2023, 92, 102132. [Google Scholar] [CrossRef] [PubMed]
- Aziz, M.; Aziz, H.; Waheed, Y.; Gill, M.L. Predictors of Therapeutic Outcome to Nucleotide Reverse Transcriptase Inhibitor in Hepatitis B Patients. Viral. Immunol. 2018, 31, 632–638. [Google Scholar] [CrossRef]
- Kao, J.H.; Asselah, T.; Dou, X.G.; Hamed, K. Telbivudine therapy for chronic hepatitis B: A journey to identify super-responders and to optimize treatment using the roadmap model. J. Gastroenterol. Hepatol. 2017, 32, 73–81. [Google Scholar] [CrossRef]
- Yu, Y.; Cui, X.; Zhao, J.; Jia, T.; Ren, B.; Zhang, X. Effect of Entecavir Combined with Adefovir Dipivoxil on Clinical Efficacy and TNF-α and IL-6 Levels in Patients with Hepatitis B Cirrhosis. J. Oncol. 2021, 2021, 9162346. [Google Scholar] [CrossRef]
- van Bömmel, F.; Berg, T. Antiviral therapy of chronic hepatitis B. Intervirology 2014, 57, 171–180. [Google Scholar] [CrossRef]
- Bai, L.; Gao, C.; Liu, Q.; Yu, C.; Zhang, Z.; Cai, L.; Yang, B.; Qian, Y.; Yang, J.; Liao, X. Research progress in modern structure of platinum complexes. Eur. J. Med. Chem. 2017, 140, 349–382. [Google Scholar] [CrossRef]
- Szefler, B.; Czeleń, P. Will the Interactions of Some Platinum (II)-Based Drugs with B-Vitamins Reduce Their Therapeutic Effect in Cancer Patients? Comparison of Chemotherapeutic Agents such as Cisplatin, Carboplatin and Oxaliplatin-A Review. Int. J. Mol. Sci. 2023, 24, 1548. [Google Scholar] [CrossRef]
- Ali, I.; Wani, W.A.; Saleem, K.; Haque, A. Platinum compounds: A hope for future cancer chemotherapy. Anticancer Agents Med. Chem. 2013, 13, 296–306. [Google Scholar] [CrossRef]
- Bai, Y.; Aodeng, G.; Ga, L.; Hai, W.; Ai, J. Research Progress of Metal Anticancer Drugs. Pharmaceutics 2023, 15, 2750. [Google Scholar] [CrossRef] [PubMed]
- Zhan, J.; Liu, Z.-X.; Peng, F.-K.; Zhang, W.-J.; Wen, M.-L.; Zeng, H.-Y. Progress in the study of reproductive toxicity of platinum-based antitumor drugs and their means of prevention. Front. Pharmacol. 2024, 15, 1327502. [Google Scholar]
- Kim, B.H.; Bradley, T.; Tai, J.; Budman, D.R. Hypersensitivity to oxaliplatin: An investigation of incidence and risk factors, and literature review. Oncology 2009, 76, 231–238. [Google Scholar] [CrossRef] [PubMed]
- Liu, Z.; Zhao, Z.; Ma, X.; Liu, S.; Xin, Y. Renal and bone side effects of long-term use of entecavir, tenofovir disoproxil fumarate, and tenofovir alafenamide fumarate in patients with Hepatitis B: A network meta-analysis. BMC Gastroenterol. 2023, 23, 384. [Google Scholar] [CrossRef]
- Cho, Y.Y.; Choi, Y.H.; Yu, S.J.; Cho, E.J.; Lee, J.H.; Kim, Y.J.; Yoon, J.H. Tenofovir and Entecavir Have Similar Renal Adverse Events on Hepatocellular Carcinoma Patients Treated with Transarterial Chemoembolization. J. Liver Cancer 2019, 19, 128–135. [Google Scholar] [CrossRef]
- Yang, Q. Clinical Efficacy and Incidence of Adverse Reactions of Entecavir Combined with Long-Acting Interferon in Treating Hepatitis B. J. Clin. Nurs. Res. 2023, 7, 41–46. [Google Scholar] [CrossRef]
- O’Dowd, P.D.; Sutcliffe, D.F.; Griffith, D.M. Oxaliplatin and its derivatives—An overview. Coord. Chem. Rev. 2023, 497, 215439. [Google Scholar] [CrossRef]
- Challa, B.R.; Awen, B.Z.; Chandu, B.R.; Rihanaparveen, S. LC-ESI-MS/MS method for the quantification of entecavir in human plasma and its application to bioequivalence study. J. Chromatogr. B Analyt. Technol. Biomed. Life Sci. 2011, 879, 769–776. [Google Scholar] [CrossRef]
- Xu, Z.L.; Li, C.J.; Qian, X.; Duan, H.; Zhou, J.; Zhang, Q.Q.; Dong, X.; Zhao, L. A validated LC-MS/MS method for determination of six Anti-SARS-CoV-2 drugs in plasma and its application for a pharmacokinetic study in rats. J. Chromatogr. B Analyt. Technol. Biomed. Life Sci. 2024, 1235, 124038. [Google Scholar] [CrossRef]
- Lentzas, A.; Venekamp, N.; Beijnen, J.H.; van Tellingen, O. Development and validation of an LC-MS/MS method for simultaneous quantification of eight drugs in plasma and brain: Application in a pharmacokinetic study in mice. J. Chromatogr. B Analyt. Technol. Biomed. Life Sci. 2024, 1247, 124308. [Google Scholar] [CrossRef]
- Antunes, M.; Simões, S.; Fonseca, S.; Franco, J.; Gallardo, E.; Barroso, M. Detection and quantification of selected cannabinoids in oral fluid samples by protein precipitation and LC-MS/MS. Forensic Sci. Int. 2024, 363, 112174. [Google Scholar] [CrossRef] [PubMed]
- Portilha-Cunha, M.F.; Alves, A.; Ribeiro, A.R.L.; Silva, A.M.T.; Norton, P.; Santos, M.S.F. Development and validation of a multicompound LLE-LC-MS/MS method for biomonitoring of hazardous medicinal products in urine of exposed workers. Toxicol. Lett. 2025, 403, 40–49. [Google Scholar] [CrossRef] [PubMed]
- Yao, J.S.T.; Ladner, Y.; Amin, N.’C.; Perrin, C. Salting-out assisted liquid-liquid extraction (SALLE): Principle, optimization, and applications in blood sample analysis. J. Pharm. Biomed. Anal. 2025, 257, 116720. [Google Scholar] [CrossRef] [PubMed]
- Fan, Y.; Shen, G.; Li, P.; Xi, X.; Wu, H.; Tian, H.; Lu, Y.; Yin, Z. A simple and automated online SPE-LC-MS/MS method for simultaneous determination of olanzapine, fluoxetine and norfluoxetine in human plasma and its application in therapeutic drug monitoring. RSC Adv. 2015, 5, 34342–34352. [Google Scholar] [CrossRef]
- Smidt, M.; Bastiani, M.F.; Hahn, R.Z.; de Lima Feltraco Lizot, L.; Bondan, A.P.; Peteffi, G.P.; Dos Santos, N.C.; da Costa, J.L.; Lanaro, R.; Linden, R. Determination of drugs of abuse and metabolites in plasma microsamples by LC-MS/MS after microQuEChERS extraction. Bioanalysis 2024, 16, 1055–1065. [Google Scholar] [CrossRef]
- U.S. Department of Health and Human Services, Food and Drug Administration, Center for Drug Evaluation and Research (CDER), Center for Veterinary Medicine (CVM). Bioanalytical Method Validation; Guidance for Industry. 2018. Available online: https://www.fda.gov/regulatory-information/search-fda-guidance-documents/bioanalytical-method-validation-guidance-industry (accessed on 16 October 2024).
- Wang, T.; Jin, C.; Jiang, W.; Zhao, T.; Xu, Y.; Li, H. Determination of five mTOR inhibitors in human plasma for hepatocellular carcinoma treatment using QuEChERS-UHPLC-MS/MS. J. Pharm. Biomed. Anal. 2023, 235, 115652. [Google Scholar] [CrossRef]
- Hou, Z.Y.; Yan, M.; Cai, H.L.; Deng, Y.; Wu, H.H.; Tang, Z.; Hu, X.Y.; Yang, X.D.; Zhang, B.K. Simple and rapid UPLC-MS/MS method for quantification of entecavir in human plasma: Application to a bioequivalence study. Int. J. Clin. Pharmacol. Ther. 2018, 56, 197–204. [Google Scholar] [CrossRef]
- Jiang, W.; Zhao, T.; Zhen, X.; Jin, C.; Li, H.; Ha, J. Rapid Determination of 9 Tyrosine Kinase Inhibitors for the Treatment of Hepatocellular Carcinoma in Human Plasma by QuEChERS-UPLC-MS/MS. J. Front. Pharmacol. 2022, 13, 920436. [Google Scholar] [CrossRef]

| Analyte | Linear Equation | Linear Range (ng/mL) | R2 | LODs (ng/ mL) | LOQs (ng/ mL) |
|---|---|---|---|---|---|
| Lamivudine | Y = 2.64 × 10⁻⁴X + 0.0478193 | 10–1000 | 0.998 | 2.281 | 7.60 |
| Telbivudine | Y = 1.03 × 10⁻⁴X + 0.0780841 | 10–1000 | 0.999 | 2.344 | 7.81 |
| Emtricitabine | Y = 5.68 × 10⁻³X + 0.00688369 | 10–1000 | 0.998 | 4.236 | 9.28 |
| Entecavir | Y = 1.11 × 10⁻⁴X + 0.0259589 | 10–1000 | 0.996 | 2.381 | 7.94 |
| Tenofovir | Y = 5.83 × 10⁻³X + 0.00739558 | 10–1000 | 0.9998 | 3.182 | 8.27 |
| Nedaplatin | Y = 1.18 × 10⁻³X + 0.0182244 | 1–100 | 0.997 | 0.089 | 0.30 |
| Oxaliplatin | Y = 7.67 × 10⁻³X + 0.0104116 | 1–100 | 0.9995 | 0.095 | 0.32 |
| Adefovir dipivoxil | Y = 2.22 × 10⁻³X + 0.00575538 | 1–100 | 0.997 | 0.152 | 0.50 |
| Analyte | Nominal Concentration (ng/mL) | Intra-Day | Inter-Day | ||
|---|---|---|---|---|---|
| RE (%) | RSD (%) | RE (%) | RSD (%) | ||
| Lamivudine | 10 | −3.27 | 5.44 | 6.74 | 9.19 |
| 25 | 3.52 | 1.87 | 2.48 | 1.02 | |
| 500 | 4.36 | 2.45 | 2.67 | 2.25 | |
| 800 | −4.23 | 5.56 | 2.46 | 6.72 | |
| Telbivudine | 10 | 2.18 | 6.42 | −3.26 | 7.87 |
| 25 | 4.62 | 7.88 | 5.74 | 8.66 | |
| 500 | −2.95 | 1.45 | −0.28 | 3.43 | |
| 800 | −3.36 | 3.70 | 3.84 | 7.04 | |
| Emtricitabine | 10 | 4.84 | 7.71 | 1.27 | 8.51 |
| 25 | −1.90 | 2.40 | 3.28 | 0.32 | |
| 500 | 6.30 | 3.03 | −2.80 | 5.40 | |
| 800 | 4.27 | 1.91 | 1.43 | 6.02 | |
| Entecavir | 10 | 5.07 | 8.43 | 3.06 | 7.52 |
| 25 | −2.46 | 1.25 | 1.21 | 4.40 | |
| 500 | −2.84 | 1.95 | 2.94 | 1.85 | |
| 800 | 6.28 | 3.64 | −0.94 | 6.05 | |
| Tenofovir | 10 | 2.37 | 3.08 | 2.74 | 5.27 |
| 25 | 5.78 | 6.22 | 3.81 | 5.83 | |
| 500 | −3.21 | 2.35 | 5.27 | 6.05 | |
| 800 | 7.36 | 8.09 | −4.06 | 6.39 | |
| Nedaplatin | 1 | 7.82 | 9.35 | 1.68 | 4.97 |
| 2 | 3.46 | 6.21 | 2.05 | 2.86 | |
| 50 | −5.32 | 8.90 | 1.36 | 4.82 | |
| 80 | 3.26 | 7.34 | −0.68 | 3.20 | |
| Oxaliplatin | 1 | −6.72 | 4.48 | −2.47 | 9.68 |
| 2 | −3.46 | 7.25 | 1.38 | 4.04 | |
| 50 | 5.43 | 9.17 | 2.44 | 1.06 | |
| 80 | 5.89 | 6.68 | 5.42 | 4.90 | |
| Adefovir dipivoxil | 1 | −3.72 | 1.73 | 5.28 | 4.19 |
| 2 | 4.58 | 5.61 | 3.81 | 7.01 | |
| 50 | 3.24 | 7.09 | 1.28 | 5.90 | |
| 80 | 1.36 | 2.52 | 2.34 | 1.89 | |
| Analyte | Nominal Concentration (ng/mL) | Matrix Effect (%) | Recovery (%) | ||
|---|---|---|---|---|---|
| Mean | RSD | Mean | RSD | ||
| Lamivudine | 25 | 93.45 | 3.84 | 101.65 | 7.49 |
| 500 | 110.49 | 9.87 | 93.06 | 2.77 | |
| 800 | 87.02 | 2.16 | 108.94 | 1.49 | |
| Telbivudine | 25 | 108.96 | 3.63 | 98.65 | 3.70 |
| 500 | 97.78 | 2.76 | 93.32 | 1.29 | |
| 800 | 101.72 | 6.11 | 96.92 | 2.15 | |
| Emtricitabine | 25 | 97.14 | 10.22 | 96.48 | 2.60 |
| 500 | 109.73 | 4.14 | 96.25 | 3.76 | |
| 800 | 92.90 | 1.60 | 91.37 | 5.46 | |
| Entecavir | 25 | 84.53 | 2.89 | 97.37 | 3.37 |
| 500 | 89.25 | 4.84 | 96.54 | 1.09 | |
| 800 | 92.11 | 1.54 | 98.36 | 2.46 | |
| Tenofovir | 25 | 104.19 | 1.31 | 106.57 | 2.03 |
| 500 | 99.66 | 3.84 | 91.21 | 3.29 | |
| 800 | 102.40 | 7.96 | 101.26 | 3.45 | |
| Nedaplatin | 2 | 97.70 | 1.48 | 90.41 | 8.03 |
| 50 | 97.37 | 3.20 | 92.16 | 1.16 | |
| 80 | 105.42 | 3.11 | 95.25 | 2.75 | |
| Oxaliplatin | 2 | 97.63 | 1.14 | 87.59 | 6.34 |
| 50 | 105.31 | 3.45 | 91.12 | 1.55 | |
| 80 | 87.51 | 7.60 | 97.70 | 2.65 | |
| Adefovir dipivoxil | 2 | 90.64 | 1.20 | 97.52 | 3.53 |
| 50 | 98.61 | 4.54 | 97.01 | 6.57 | |
| 80 | 96.18 | 2.98 | 103.39 | 2.63 | |
| Analyte | Nominal Concentration (ng/mL) | Recovery% (RSD%) | |||
|---|---|---|---|---|---|
| 25 °C/ 24 h | Autosampler (4 °C)/24 h | 3 Freeze–Thaw Cycles | −20 °C/7 Days | ||
| Lamivudine | 25 | 90.59 (2.21) | 91.37 (7.98) | 92.43 (9.94) | 90.60 (1.38) |
| 800 | 94.04 (1.57) | 98.95 (1.66) | 96.78 (9.65) | 95.89 (3.57) | |
| Telbivudine | 25 | 97.77 (6.74) | 96.03 (1.99) | 93.25 (3.81) | 92.84 (3.31) |
| 800 | 110.33 (8.75) | 98.49 (4.96) | 89.84 (7.91) | 93.45 (5.12) | |
| Emtricitabine | 25 | 107.86 (9.96) | 104.94 (9.42) | 102.32 (4.37) | 96.26 (1.26) |
| 800 | 103.93 (2.15) | 106.18 (2.44) | 104.75 (3.89) | 101.05 (1.35) | |
| Entecavir | 25 | 94.03 (1.47) | 92.85 (1.58) | 92.82 (9.28) | 95.69 (3.98) |
| 800 | 94.96 (4.28) | 94.66 (1.60) | 97.45 (6.27) | 97.35 (2.67) | |
| Tenofovir | 25 | 88.77 (2.25) | 96.33 (1.64) | 95.51 (1.32) | 96.82 (6.78) |
| 800 | 89.23 (2.90) | 93.84 (8.97) | 101.96 (2.71) | 92.56 (2.01) | |
| Nedaplatin | 2 | 94.18 (6.24) | 98.19 (4.44) | 94.58 (1.65) | 98.40 (10.78) |
| 80 | 92.47 (6.35) | 103.58 (2.57) | 98.13 (1.71) | 94.19 (4.69) | |
| Oxaliplatin | 2 | 95.29 (2.69) | 93.83 (3.98) | 96.89 (1.84) | 90.81 (3.09) |
| 80 | 94.38 (5.58) | 96.61 (2.12) | 92.63 (1.26) | 91.89 (1.21) | |
| Adefovir dipivoxil | 2 | 96.84 (1.03) | 95.77 (8.90) | 97.50 (2.59) | 96.73 (9.02) |
| 80 | 98.12 (1.63) | 98.60 (3.81) | 95.31 (3.04) | 91.34 (6.89) | |
| Compound | Precursor (m/z) | Product (m/z) | Collision Voltage (V) | RF Lens Voltage (V) | Retention Time (min) |
|---|---|---|---|---|---|
| Lamivudine | 230.05 | 95.0 a/112.0 | 13/38 | 30 | 0.77 |
| Carbamazepine | 237.1 | 192.1 a/194.2 | 20/24 | 68 | 0.69 |
| Telbivudine | 243.088 | 127.0 a/225.0 | 5/10 | 44 | 0.78 |
| Emtricitabine | 248 | 113.0 a/130.0 | 12/38 | 30 | 0.78 |
| Entecavir | 278.088 | 135.0 a/152.0 | 19/36 | 59 | 0.79 |
| Tenofovir | 288.1 | 176.0 a/270.0 | 19/26 | 90 | 0.80 |
| Nedaplatin | 304.125 | 212.3 a/287.0 | 12/22 | 61 | 0.73 |
| Oxaliplatin | 398.038 | 304.1 a/378.0 | 5/27 | 71 | 0.77 |
| Adefovir dipivoxil | 502.2 | 256.0 a/442.1 | 19/30 | 69 | 0.88 |
Disclaimer/Publisher’s Note: The statements, opinions and data contained in all publications are solely those of the individual author(s) and contributor(s) and not of MDPI and/or the editor(s). MDPI and/or the editor(s) disclaim responsibility for any injury to people or property resulting from any ideas, methods, instructions or products referred to in the content. |
© 2025 by the authors. Licensee MDPI, Basel, Switzerland. This article is an open access article distributed under the terms and conditions of the Creative Commons Attribution (CC BY) license (https://creativecommons.org/licenses/by/4.0/).
Share and Cite
Liu, Y.; Peng, J.; Liang, Y.; Li, Y.; Zhen, X.; Li, H. QuEChERS and UPLC-MS/MS-Based Quantification of Human Plasma of Eight Nucleoside Reverse Transcriptase Inhibitors and Platinum Anticancer Drugs for Hepatocellular Carcinoma. Molecules 2025, 30, 2204. https://doi.org/10.3390/molecules30102204
Liu Y, Peng J, Liang Y, Li Y, Zhen X, Li H. QuEChERS and UPLC-MS/MS-Based Quantification of Human Plasma of Eight Nucleoside Reverse Transcriptase Inhibitors and Platinum Anticancer Drugs for Hepatocellular Carcinoma. Molecules. 2025; 30(10):2204. https://doi.org/10.3390/molecules30102204
Chicago/Turabian StyleLiu, Yanan, Jiangning Peng, Yan Liang, Yilin Li, Xiaolan Zhen, and Hui Li. 2025. "QuEChERS and UPLC-MS/MS-Based Quantification of Human Plasma of Eight Nucleoside Reverse Transcriptase Inhibitors and Platinum Anticancer Drugs for Hepatocellular Carcinoma" Molecules 30, no. 10: 2204. https://doi.org/10.3390/molecules30102204
APA StyleLiu, Y., Peng, J., Liang, Y., Li, Y., Zhen, X., & Li, H. (2025). QuEChERS and UPLC-MS/MS-Based Quantification of Human Plasma of Eight Nucleoside Reverse Transcriptase Inhibitors and Platinum Anticancer Drugs for Hepatocellular Carcinoma. Molecules, 30(10), 2204. https://doi.org/10.3390/molecules30102204