Article

Electrospray–Mass Spectrometry-Guided Targeted Isolation of Indole Alkaloids from Leaves of Catharanthus roseus by Using High-Performance Countercurrent Chromatography

1
Research Institute of Forests and Rangelands, Agricultural Research, Education and Extension Organization (AREEO), Tehran 1496793612, Iran
2
Institute of Plant Biology, TU Braunschweig, Mendelssohnstrasse 4, 38106 Braunschweig, Germany
3
Institute of Food Chemistry, TU Braunschweig, Schleinitzstrasse 20, 38106 Braunschweig, Germany
*
Author to whom correspondence should be addressed.
Molecules 2025, 30(10), 2115; https://doi.org/10.3390/molecules30102115
Submission received: 7 March 2025 / Revised: 29 April 2025 / Accepted: 6 May 2025 / Published: 9 May 2025
(This article belongs to the Section Natural Products Chemistry)

Abstract

:
Electrospray mass spectrometry off-line profiling monitored the recovery of targeted indole alkaloids from a fortified crude extract of Catharanthus roseus (790 mg) using semi-preparative high-performance countercurrent chromatography (HPCCC) fractionation. Visualization of selected single-ion traces projected the HPCCC molecular weight elution profile. Experimental partition-ratio values KD and peak widths for detected metabolites were determined. Structural characterization of metabolites and co-elution effects were monitored in the scan range m/z 100–2000. In this study, the biphasic solvent system containing n-hexane–n-butanol–water with 0.5% ion-pair reagent trifluoro-acetic acid [1:1:2, v/v/v] was used based on partition ratio KD-value liquid chromatography–electrospray ionization–mass spectrometry (LC-ESI-MS) analysis prediction. The monitoring of target ions resulted in the isolation of six major concentrated indole alkaloids (akuammicine, catharanthine, perivine, vindoline, vindorosine, and 19R-vindolinine), which were fully elucidated by 1D and 2D nuclear magnetic resonance (NMR) spectroscopy.

Graphical Abstract

1. Introduction

Catharanthus roseus (L.) G. Don. (Madagascar periwinkle) from the family Apocynaceae is one of the best investigated medicinal plants due to the occurrence of a large variety of therapeutically valuable indole alkaloids (IAs). Aerial parts of the C. roseus contain between 0.2 and 1% of a mixture of around 130 different alkaloids, whereby the most abundant are monomeric alkaloids such as catharanthine and vindoline alkaloids [1,2,3,4]. The respective dimers of alkaloids are pharmaceutically used as standard anti-cancer chemotherapeutic drugs of the highest activity and result from the joining of two monomeric alkaloids by a C-C covalent linkage. The most well-known dimeric alkaloids, vinblastine and vincristine, are used in chemotherapy of leukemia and the treatment of Hodgkin’s lymphoma [1,2,3]. In addition to the natural dimeric forms of the plant alkaloids, some semi-synthetic derivatives like vinorelbine and vindesine synthesized from vinblastine cure different malignancies. Besides the natural and semi-synthesized dimeric alkaloids, the monomeric alkaloids of the plants containing ajmalicine, serpentine, yohimbine, and vindolicine have medicinal values and are used as anti-hypertensive and anti-neuroinflammatory agents, treatments for erectile dysfunction, and the development of antidiabetic therapeutics, respectively [4]. Due to the medicinal uses of the plant alkaloids and, subsequently, their commercial values, methods for extraction and solid-phase chromatographic purification are well-studied and used on large industrial scales [5].
Since 1970, all-liquid phase separation techniques such as countercurrent chromatography (CCC) have widely been employed as versatile and practical methodologies for the separation of natural products and also for lab-scale purifications of various alkaloid types [6,7,8,9]. CCC as a comprehensive all-liquid chromatography method is based on fast compound partitioning steps between immiscible biphasic solvent systems using a liquid mobile and a liquid stationary phase [9,10,11,12]. The separation devices are long polytetrafluorethylene tubes configured as coil columns and rotated in rapidly changing planetary gravitational fields.
The immense advantage of CCC methods is the scalability to transform a small laboratory machine application to a larger process scale [13,14,15], once a biphasic solvent system was optimized. Secondly, all metabolites being prone to fractionation are in a liquid solution and could be recovered without sample loss in the absence of chemisorptive effects, which are fundamental prerequisites for bioassay-guided isolation procedures.
The employed high-performance countercurrent chromatography (HPCCC) was operated at a maximum velocity of 1600 rpm, inducing approximately 90,000 phase mixing cycles per hour, leading to a separation depending on partition-ratio factor values KD of metabolites such as the targeted indole alkaloids.
In a previous study on C. roseus plant material, centrifugal partition chromatography (CPC) was performed by Renault et al. [16,17] to isolate pure indole alkaloids (IAs) by using the pH-zone refinement technique, initially developed by Yoichiro Ito [9,18]. This approach allows separating the highest crude extract loads on large laboratory or process-scale equipment, eluted by pH-change variations using acid–base gradients and separated by the compound-specific pKa values of the respective alkaloids [9,18].
In our HPCCC study on C. roseus, we evaluated several classical solvent systems and performed the separation solely using the strong polarity modulating activity of the ion-pair reagent trifluoroacetic acid to improve the separation of IA. To choose the suitable solvent system for this application, liquid chromatography–electrospray ionization–mass spectrometry (LC-ESI-MS) prediction analysis was performed to detect the semi-quantitative levels of target IA concentrations in the phase layer in so-called classical shake flask experiments [9]. Partition ratio KD values from 0.5 to 2.5 are recognized to be suitable for a successful separation [19]. This analytical evaluation approach using mass spectrometry enables the compound-specific detection and determination of KD values of target compounds. Six biphasic solvent system combinations were evaluated.
In general, CCC methodology is an all-liquid separation technique and completely omits the use of expensive solid-phase materials and, lately, their final disposal. Used solvents could be distilled in an azeotropic way and reconstituted to the original phase compositions by adding missing components to be used in the next CCC-separation batch for a sustainable recovery process.
The semi-preparative HPCCC separation of 790 mg crude IA extract using the elution/extrusion methodology [20] was monitored by off-line injections in the sequence of recovered fractions to an electrospray–ion trap–mass spectrometer (ESI-IT-MS/MS). This method enabled the location of target IA in the semi-preparative separation and led to a very exact fractionation process, as co-elution effects were visualized by specific selected ion traces. Further clean-up by classical solid-phase chromatography led to six pure IA for 1D/2D nuclear magnetic resonance spectroscopy (NMR) for entire structural elucidation.

2. Results and Discussion

2.1. Characterization of C. roseus Crude Extract by LC-ESI-MS Analysis

The aqueous TFA-acidified crude extract of Catharanthus roseus leaves was submitted to liquid–liquid solvent partitioning steps using a classical acid–base alkaloid extraction scheme [9,16,18]. Chloroform extraction removed residual lipophilic impurities from this crude C. roseus extract, and a 790 mg fortified sample of indole alkaloid (IA) contents resulted. LC–ESI–MS/MS analysis in the positive ionization mode of the extract of the aerial parts of C. roseus detected a complex mixture of minor and higher concentrated IAs (vindoline, catharanthine, cathavolinine, perivine, vindorosine, akuammicine, ajmalicine, and several uncharacterized components).

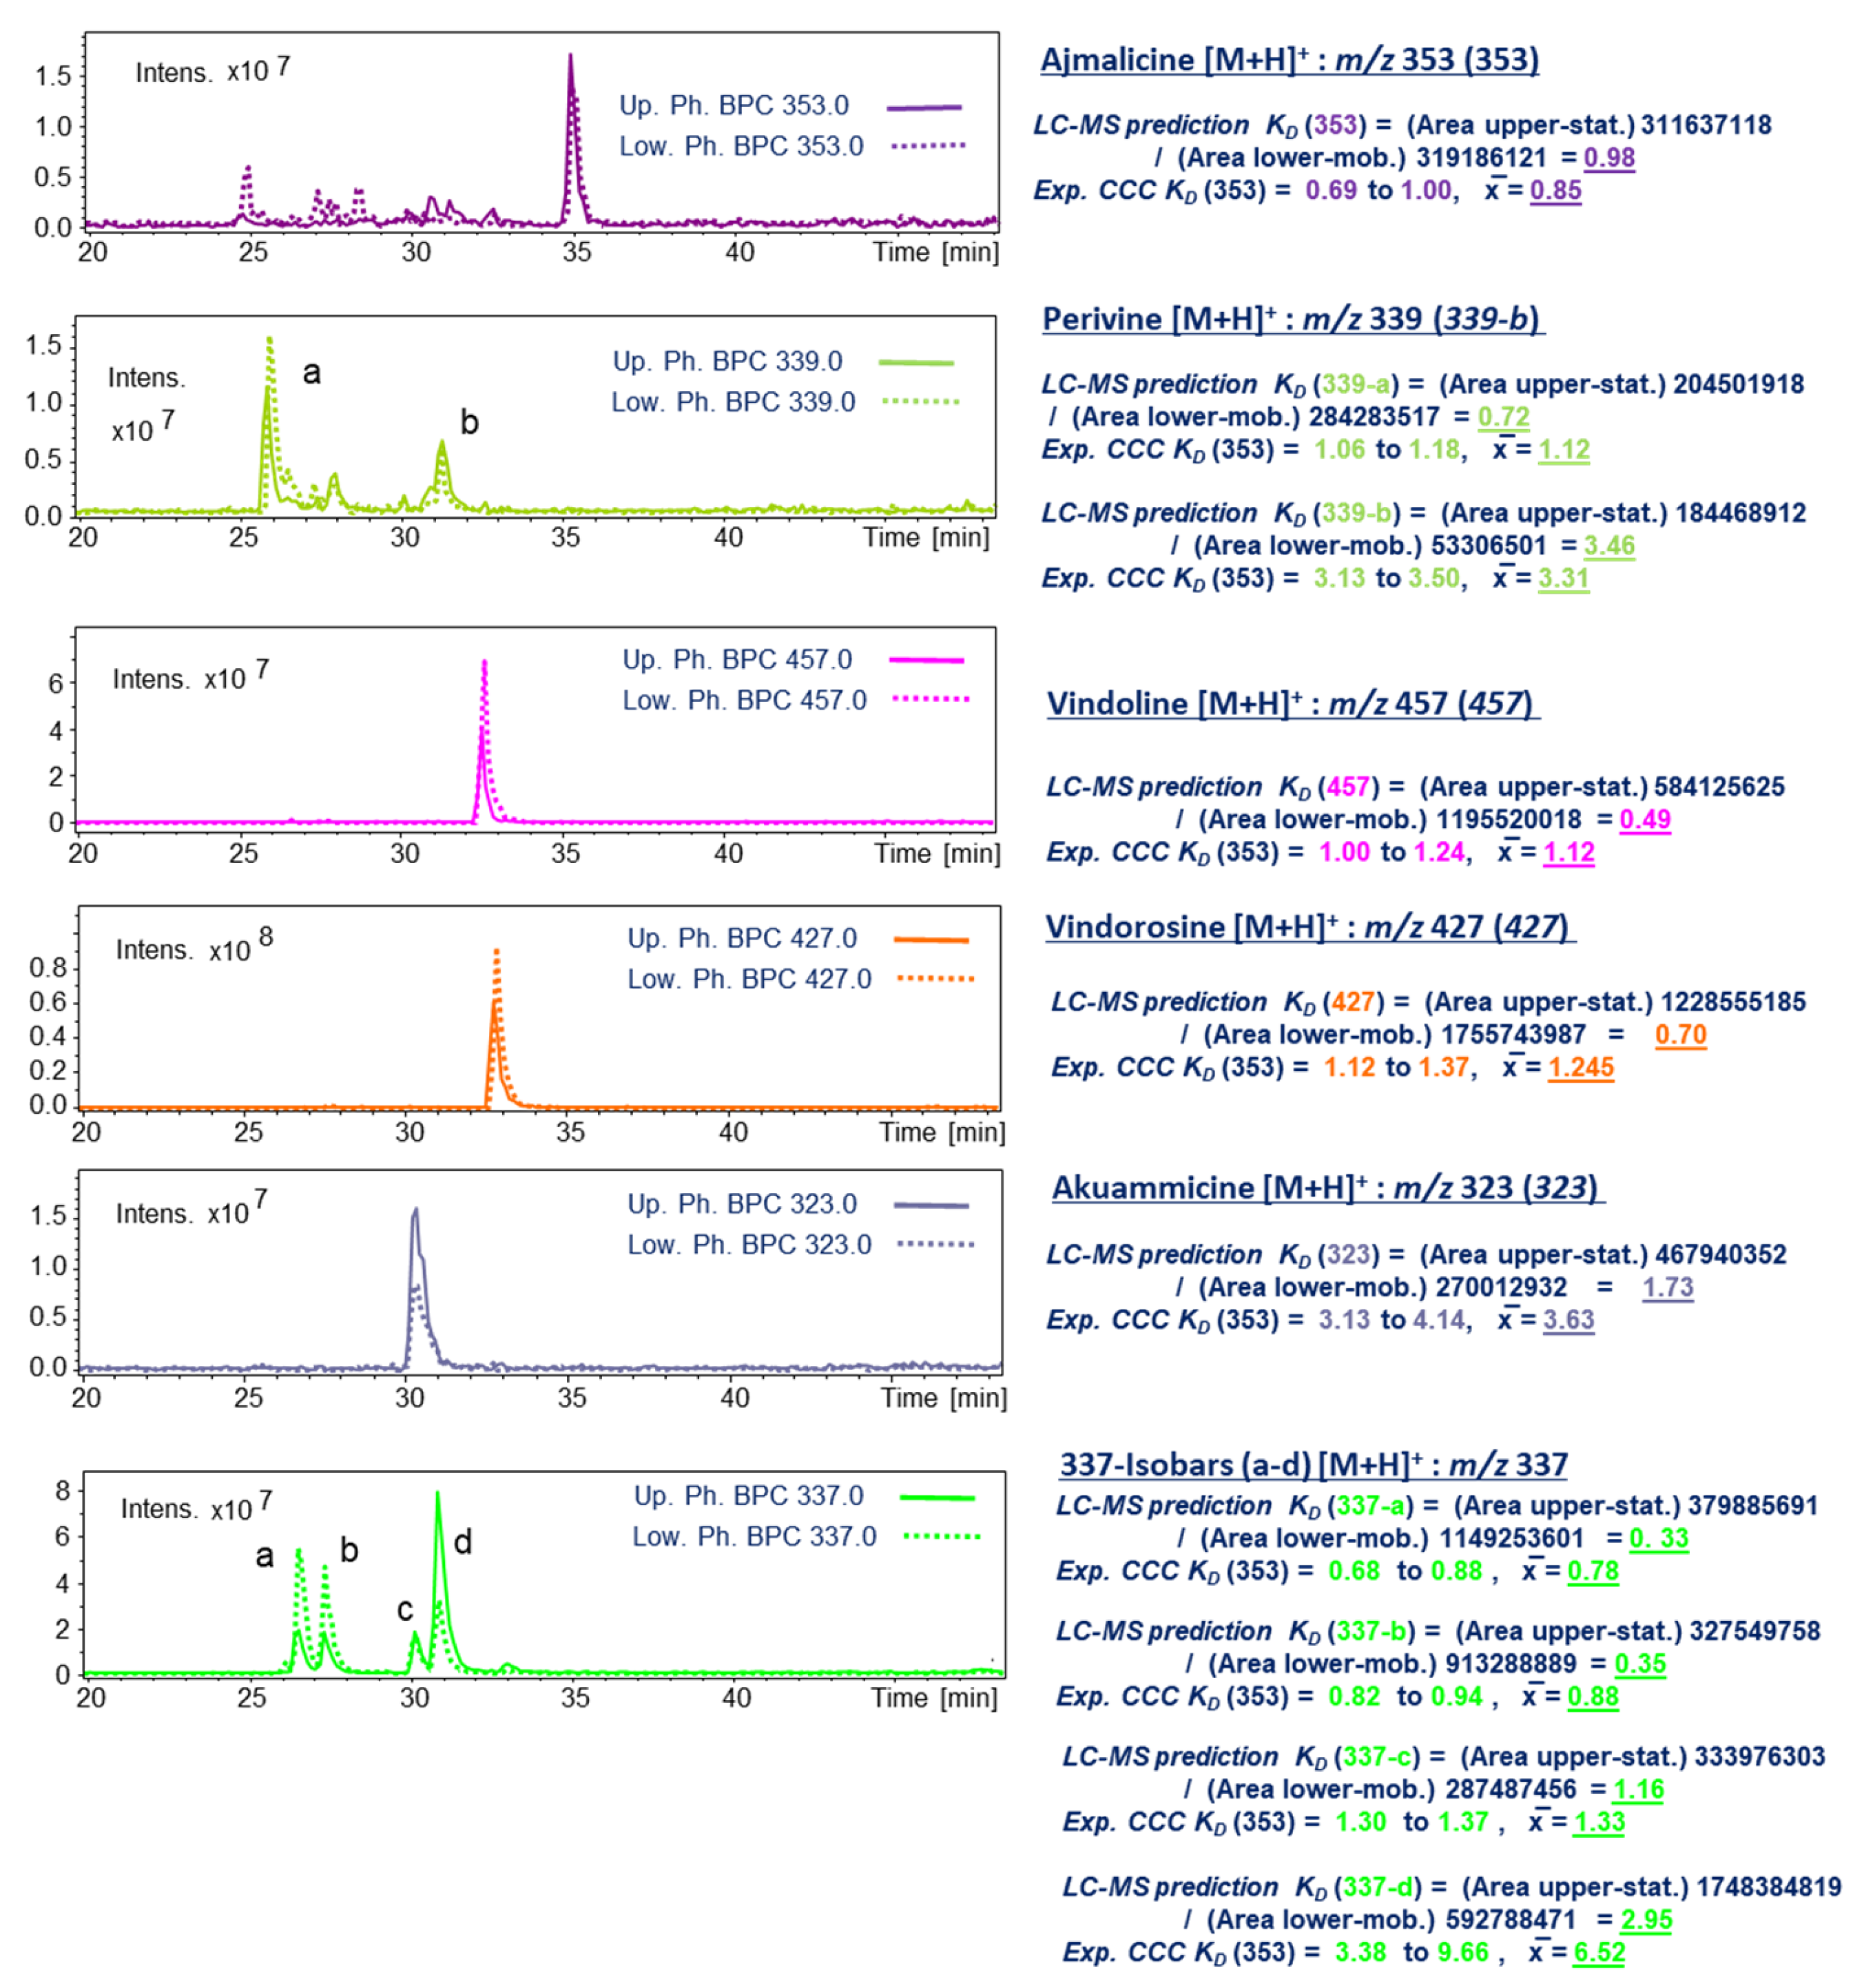
2.2. Solvent System Selection and KD Prediction of Target IAs on HPCCC Using LC-ESI-MS

The fortified C. roseus extract in IA content (10 mg) was dissolved for each shake-flask experiment [9] in the six selected biphasic solvent systems (SoSy) 1–6 for LC-ESI-MS evaluation of the target concentrations in phase layers. The determined area values from selected ion traces were used to determine the KD values for prediction of HPCCC (cf. Figure 1). The workflow of this evaluation is described in Section 3.4.
Solvent system (SoSy) 2–6 from different solvent system families were seen as not suitable for alkaloid extract (cf. Supplementary Figure S1), as the required KD-value ranges (0.5–2.5) were not reached, and the IAs were distributed dominantly either to the upper or lower phase layer [9,11,19].
SoSy1 (n-hexane–n-butanol–water, 1:1:2, v/v/v and addition of 5.0 mL/L TFA) was interpreted as the only suitable solvent system with KD values between 0.5 and 2.5 [19] (Figure 1). The bold printed lines displayed the selected LC-ESI-MS ion traces representing in all measurements the respective target compound intensities in the upper organic phase layer, and the dashed line resulted in the determined areas in the lower, more aqueous phase layer, respectively.
Ajmalicine with the ion trace [M + H]+ at m/z 353 resulted in a KD value of 0.98; lower concentrated isobars were not taken into account, but the peak distribution of all these signals suggested an earlier elution on HPCCC. As for these minors, the observed area values in the lower (mobile) phase layer appeared to be of higher intensity (using head-to-tail operation mode). The conducted HPCCC experiment resulted in a matching KD range (0.69–1.00) for the recovered preparative peak signal of ajmalicine (cf. Figure 1).
Perivine (339-a) ([M + H]+; m/z 339) and one lower concentrated isomer (339-b) gave values of 0.72 and 3.46, respectively. Indeed, 339-a was detected in HPCCC in the KD 1.06–1.18 range with an offset of ∆KD 0.4 from the LC-MS prediction. Furthermore, 339-b was detected similar to the prediction in the KD range 3.13–3.50 (cf. Figure 1).
A single peak for vindoline [M + H]+ (m/z 457) suggested, with KD 0.49, a more polar elution behavior and therefore earlier elution from the HPCCC device in the ‘head-to-tail’ mode. Not in accordance with the LC-ESI-MS prediction, HPCCC delivered 457 much later at KD 1.00–1.24 (cf. Figure 1).
The similar retention time as vindoline on C18-LC displayed vindorosine (m/z 427), but the KD value (0.70) was different and suggested a successful separation. However, in the HPCC experiment, vindorosine eluted in the KD range of 1.12–1.37, sufficiently separated from vindoline (Figure 2).
The selected ion trace for akuammicine [M + H]+ (m/z 323) at LC-Rt 30.5 min suggested a more polar character, but the KD-value prediction was 1.73, much higher than for vindoline and vindorosine. This occurrence suggested an unexpectedly higher lipophilicity on HPCCC and led to a very surprisingly high KD value of 3.13–4.14 in the semi-preparative experiment (recovery from extrusion mode) [20] (Figure 1 and Figure 2).
The selected ion trace at m/z 337 detected four major peaks on C18-LC with different retention times potentially related to 19R-vindolinine and catharanthine. Two isobars (337-a and 337-b) displayed lower KD values of 0.33 and 0.35 and suggested early elution from HPCCC. The metabolite 337-c was in the optimal range, and 337-d with KD 2.95 was predicted for recovery in the extrusion mode. Both 337-isobars 19R-vidolinine and catharanthine were recovered from HPCCC at KD 0.68–1.00 (elution mode) and 3.38–6.44 (extrusion mode), respectively.
Currently, the solvent system prediction by LC-MS is the experimental method of choice, as the partition ratio values KD of target compounds could be specifically determined by their relative concentrations in the biphasic solvent layers using the respective molecular weight data. This method is not always resulting in absolute matching to the CCC experiment, as the used extract amounts (e.g., 10 mg/2 mL) in the pre-evaluation are not reflecting the real situation of a semi-CCC separation with used concentrations of >500 mg/approx. 100 mL stationary phase volume (VS). Therefore, certain intermolecular effects could be initiated under higher concentrations, such as hydrogen-bond formations, e.g., between carboxylic acid functionalities, and as this sort of dimerization leads to a significant masking of the polar compound character, finally shifting the retention volumes VR on CCC.
Also, the existing TFA concentration during the CCC experiment and the ion-pair interaction with IAs are difficult to evaluate by predictive experiments. The above-mentioned matrix-background effects might be responsible for the observed offsets of LC-MS predicted to the ‘real’ CCC-experimental KD values of some certain IAs of this investigation.

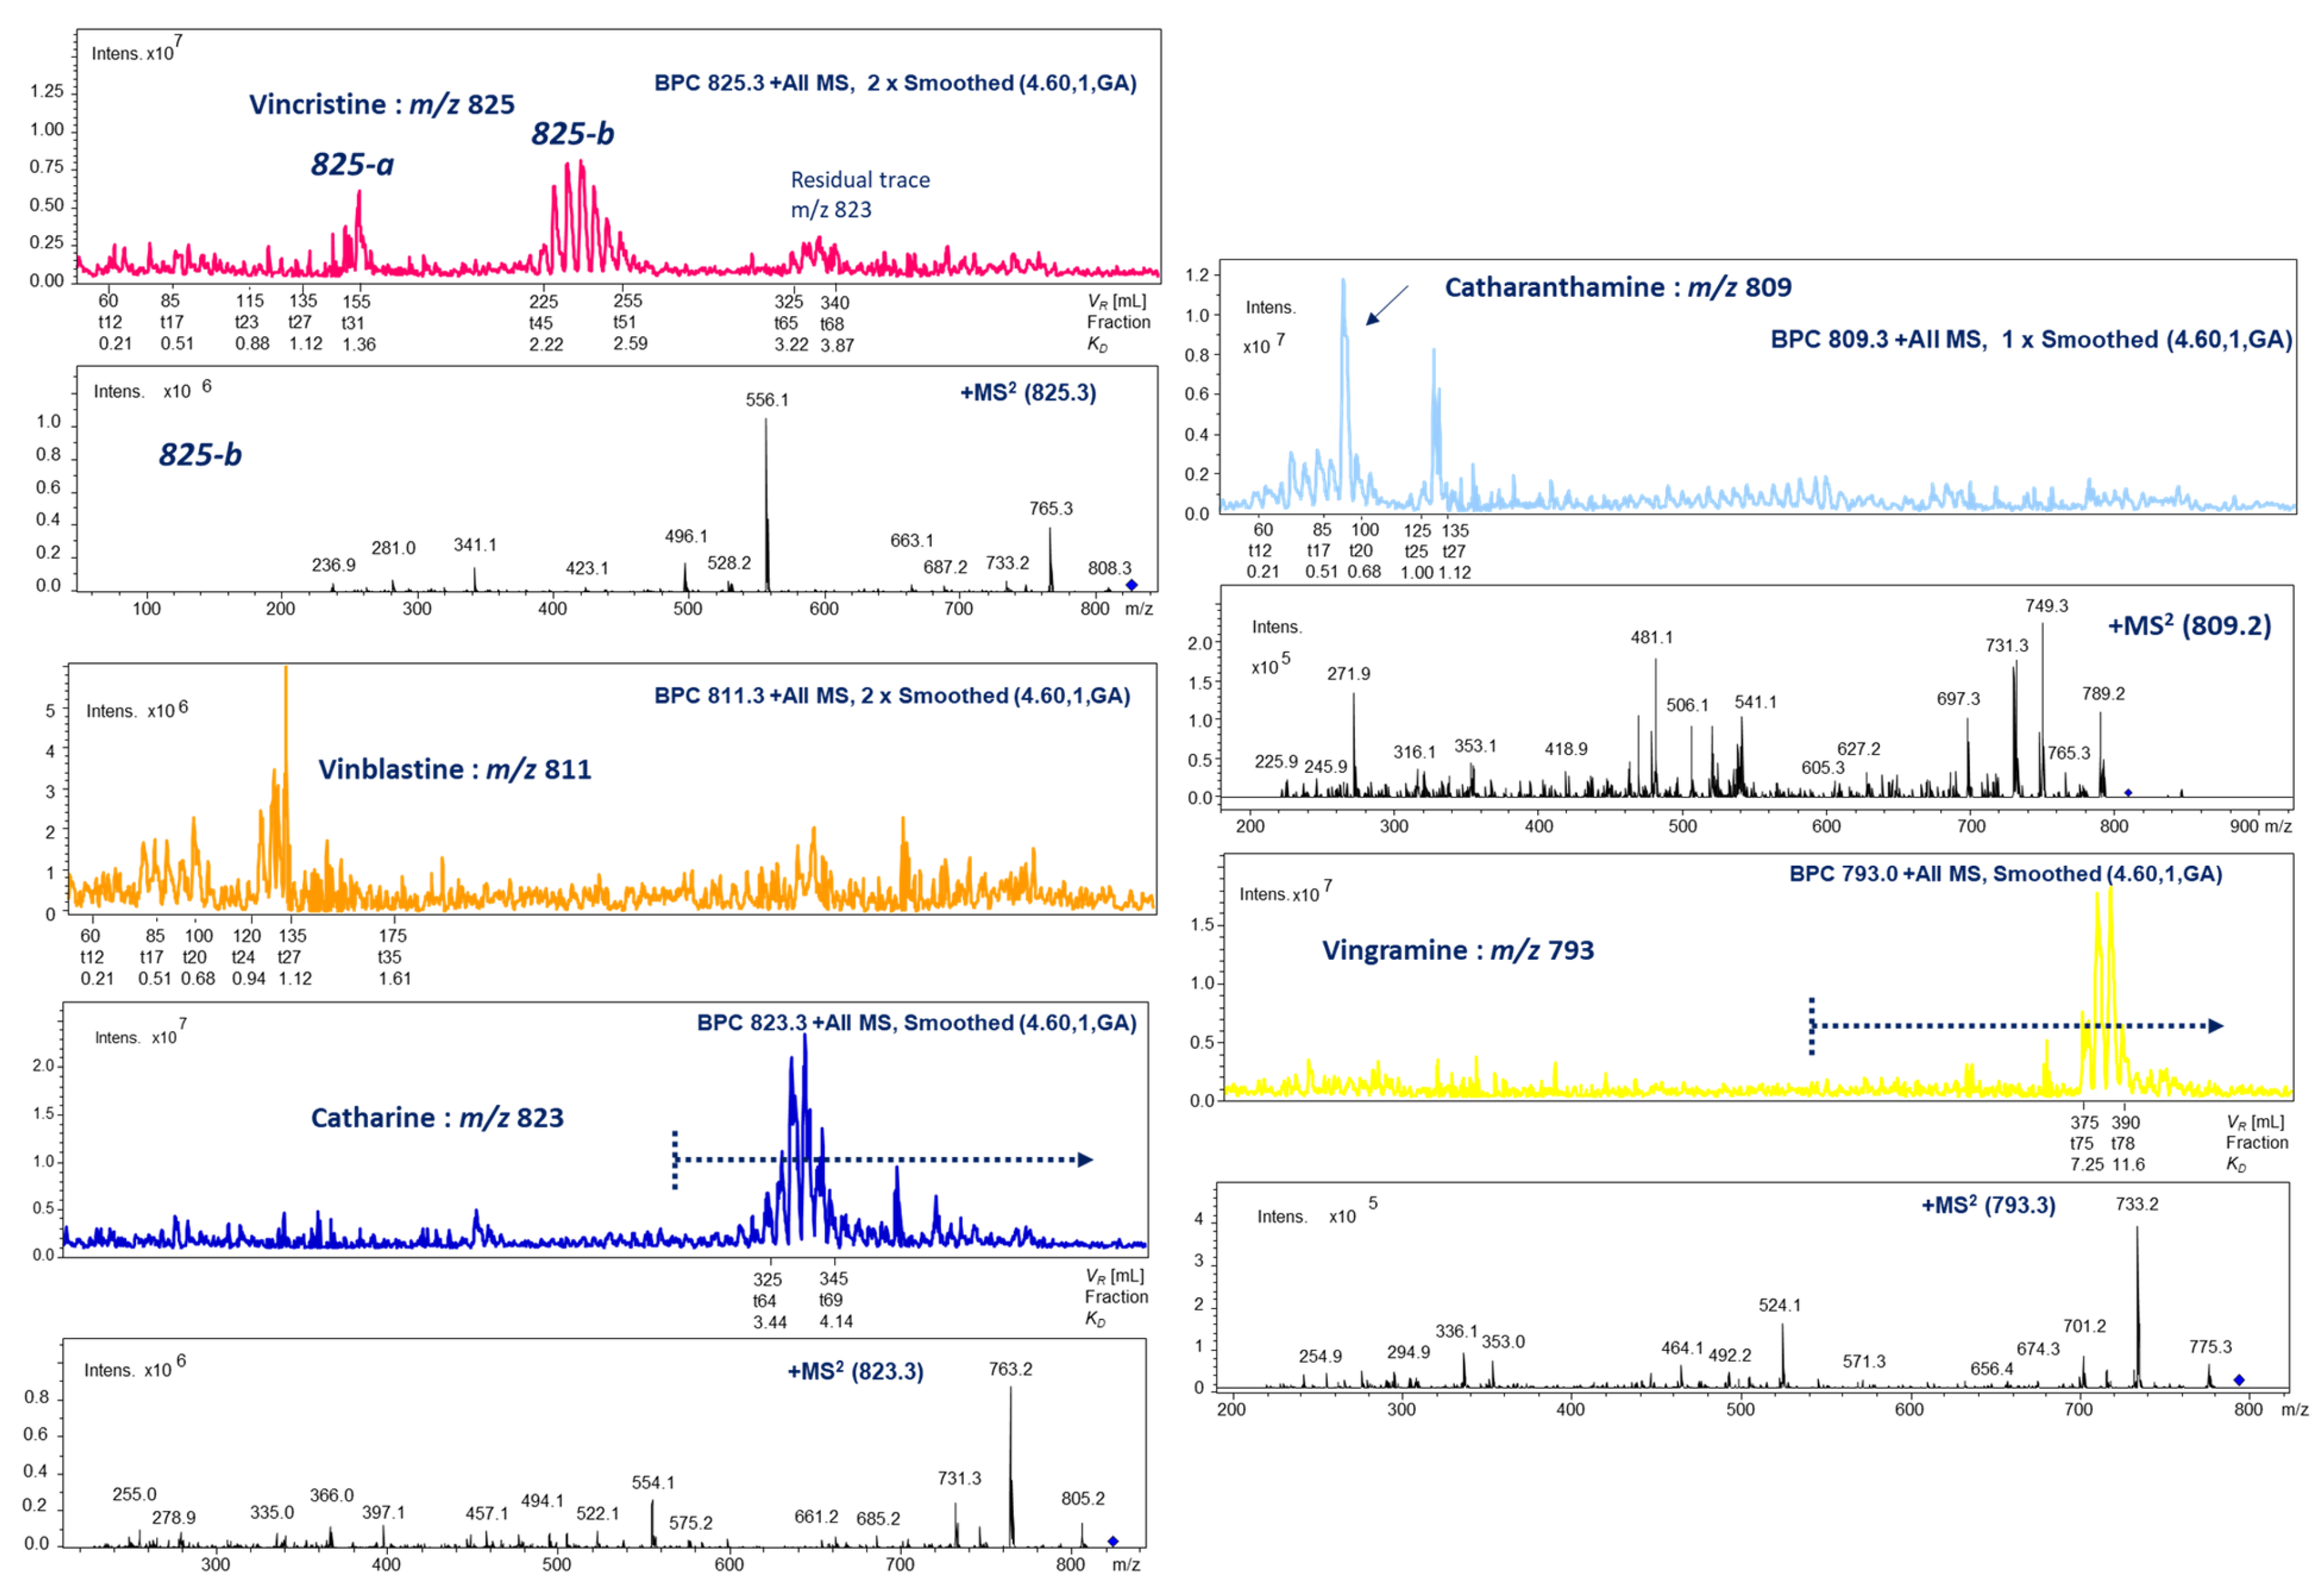
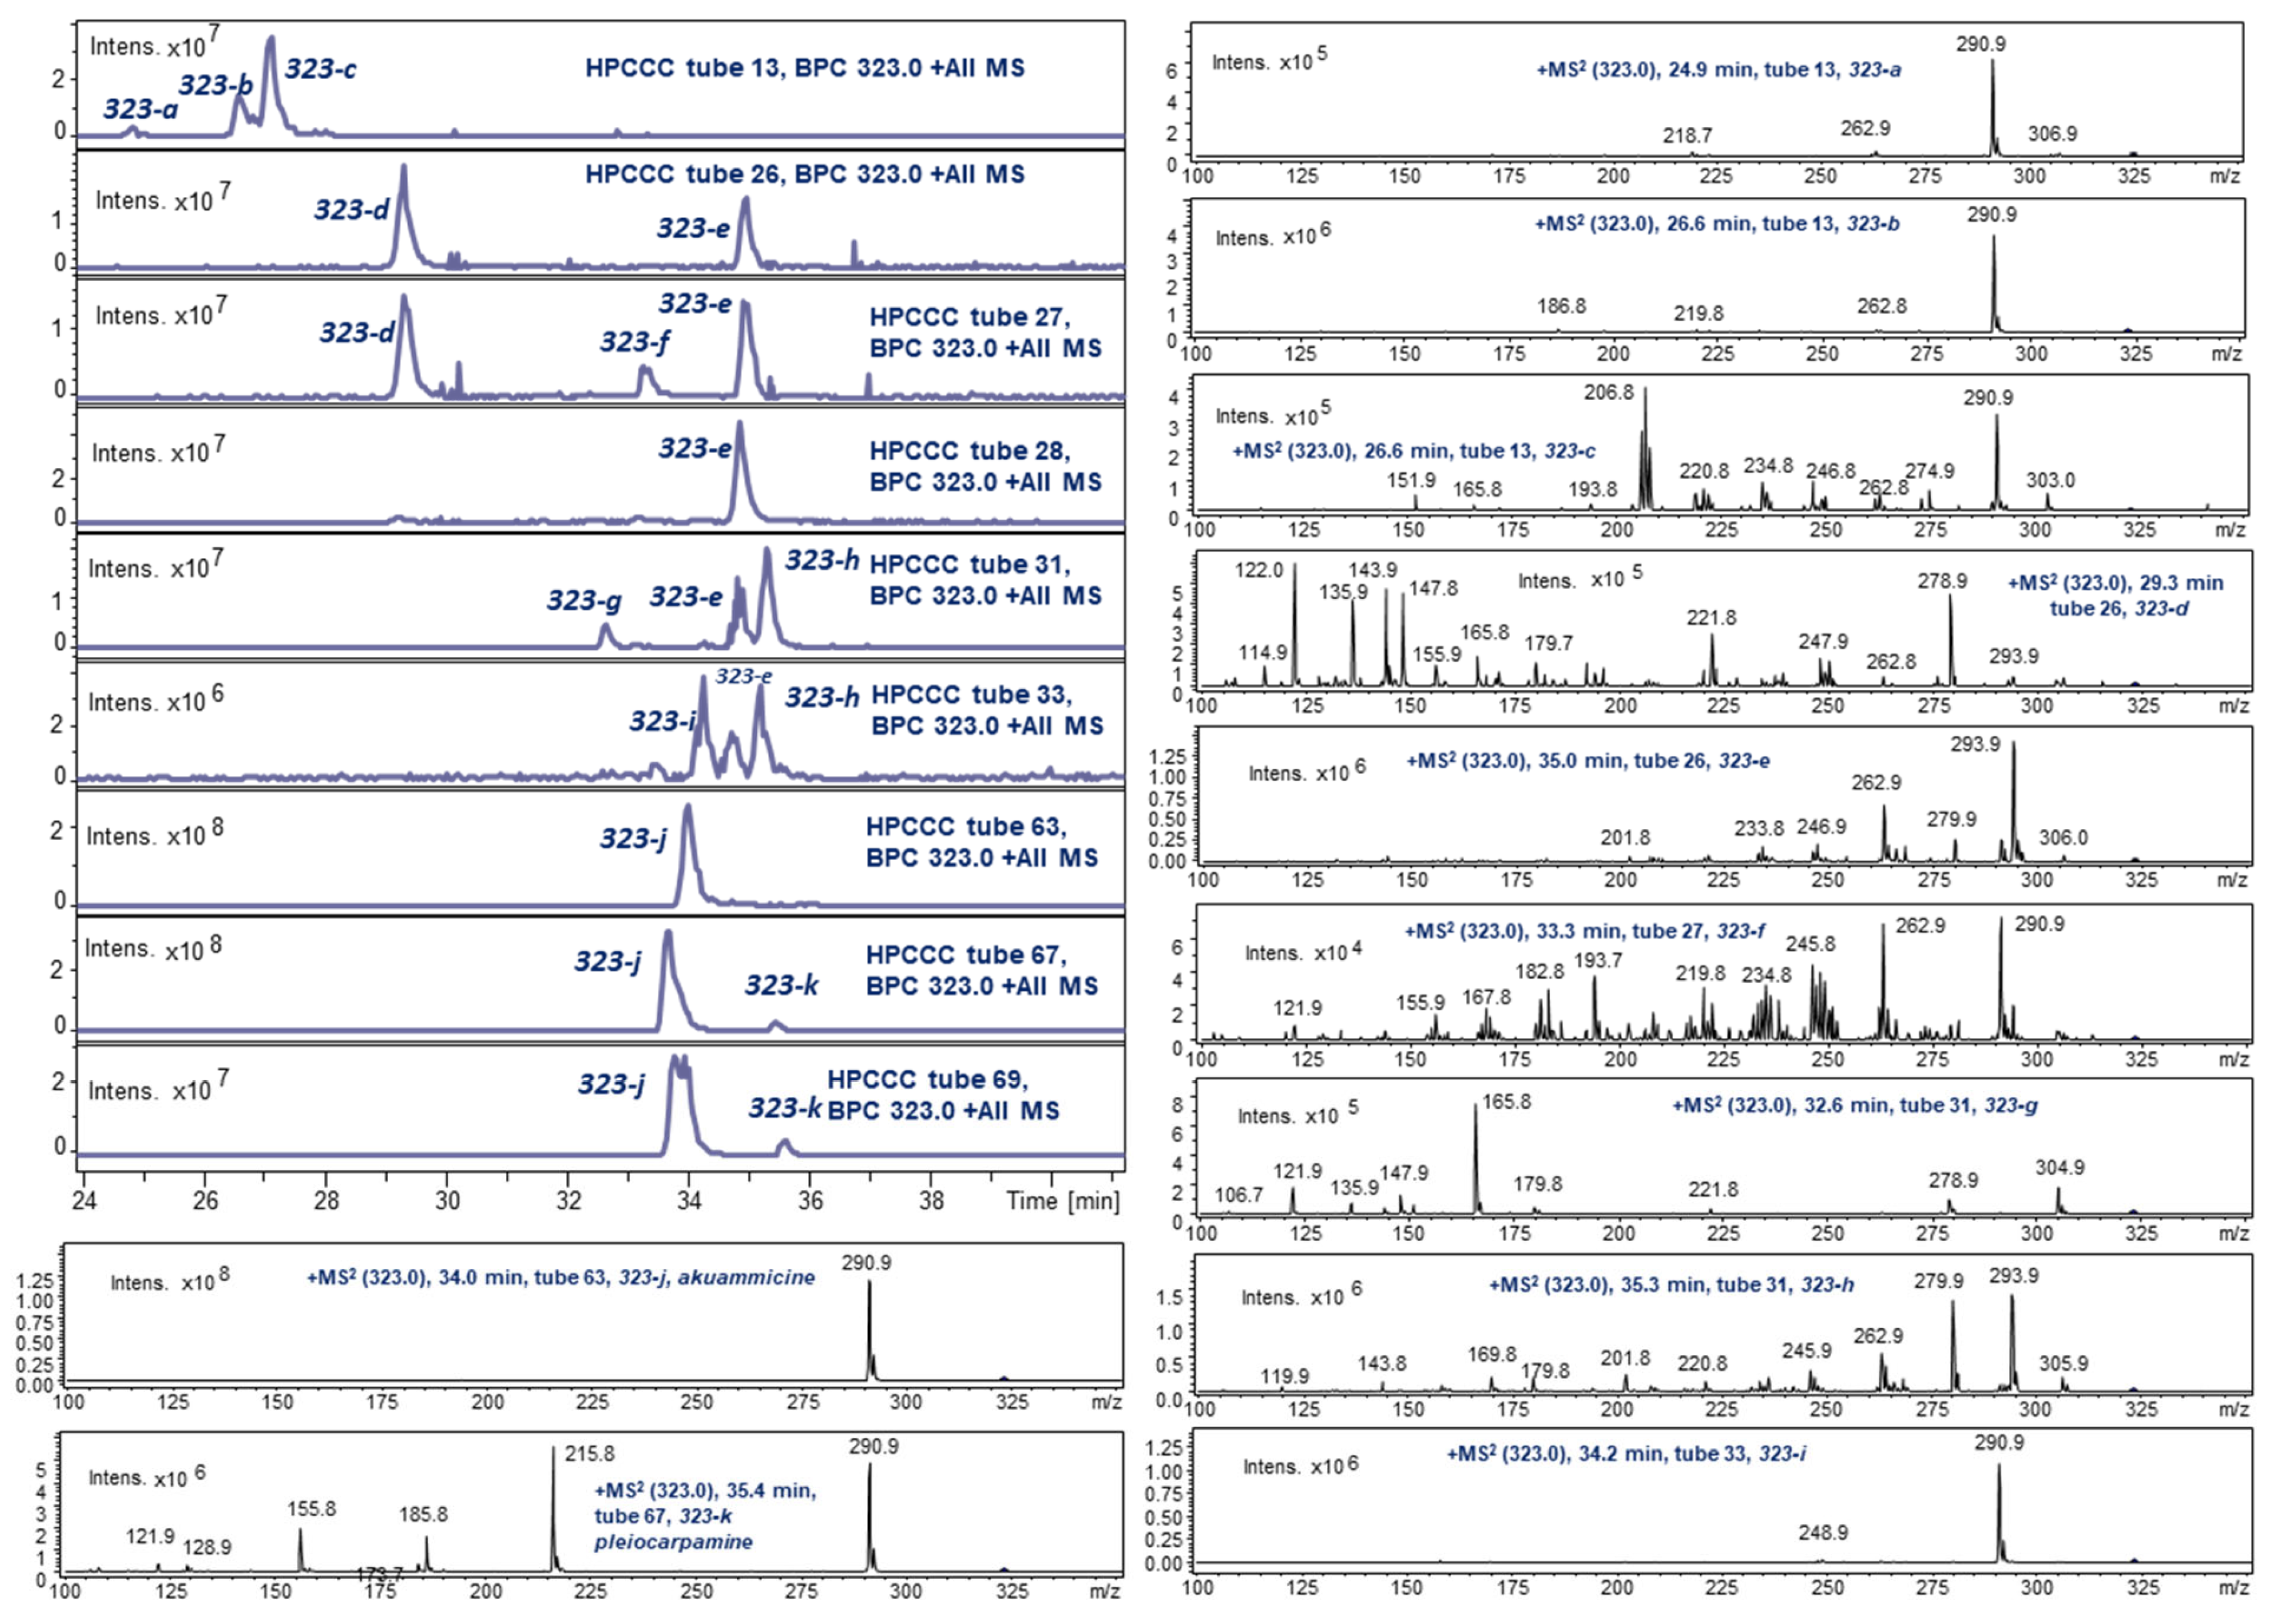
2.3. HPCCC Off-Line ESI-MS/MS Injection Profiles

The target monitoring of indole alkaloids (IAs) in C. roseus extract by hyphenation of semi-preparative HPCCC and off-line ESI-MS/MS injection profiling guided the fractionation process with high accuracy. Unintentional pooling of fractions with potentially separated metabolites will be omitted at an early stage as a direct view of the compositions of fractions is implemented. During the MS profiling, up to 10 precursor ions could be selected in an auto-MS/MS fragmentation process and already provided an extended data set for the characterization of co-eluting compounds. Therefore, tentative structural characterization of minor and potentially novel derivatives is of the greatest benefit in the isolation workflow [21,22,23,24].
However, a full structural characterization by 1D/2D NMR of target IA molecules required two further preparative fining steps by solid-phase column chromatography (cf. Supplementary Figure S10).
Even-numbered quasi-molecular ion signals [M + H]+ detected IAs in the positive ionization mode. As monitored by selected ion traces (Figure 2), the wide chromatographic distribution of separated IAs covered the complete elution and extrusion chapters of the HPCCC experiment [20].
The principal component, vindorosine (427), was seen with a rather strong tailing effect over a large KD-value range (1.12–1.98), whereby vindoline (457) co-eluted quite sharply in the range of some fractions (KD 1.00–1.24). The partial co-elution of vindoline with small interference into the high-intensity peak of vindorosine was not a problematic case. By use of the off-line ESI-MS profiling, the fractions in the HPCCC were specifically selected for the two target IAs, and solely pure vindoline and vindorosine were pooled for further clean-up steps and final 1D/2D NMR analysis. The tailing effect of vindorosine could be suspected to be related to a lack of TFA-ion-pair reagent at this stage of HPCCC due to a local high IA concentration.
In a very efficient way, so-called molecular weight isobars of IAs were fractionated, such as isomers of m/z 337, m/z 339, or m/z 323.
In the case of the selected target ion trace m/z 337, six recovery sections (337-a337-f) were defined by a retention volume VR or KD value and characterized by respective MS/MS fragmentation data (Figure 2). Vindolinine (337-b) and catharanthine (337-f) were finally fully elucidated by NMR experiments (cf. Section 2.5.6 and Section 2.5.3). The very different recovery ranges of the pair vindolinine (337-b) and catharanthine (337-f) were surprising, as both IAs carry as polar functional groups a single methyl-ester function.
The monitoring resulted for m/z 339 in one early elution-mode section (KD 1.06–1.18) and in late in the extrusion (KD 3.13–3.50), respectively. Moreover, 339-a was clearly identified as perivine (cf. Section 2.5.4).
Observation of target ions by off-line ESI-MS obviously revealed the existing co-elution effects (Figure 2). The recovery sequence of IAs from HPCCC (head-to-tail = reversed-phase mode) (Table 1) is certainly based on the substitution pattern influenced by functional groups. In Table 1, the sequence of HPCCC elution is given from IA1 to IA6. The presented functional groups do not reflect the experimentally detected order from elution/extrusion mode. Therefore, we assumed that specific stereochemical aspects of hindering and restricted access of the deprotonated ion-pair reagent trifluoroacetic acid anion (TFA) to some protonated and positively charged nitrogen positions need to be taken into account. The order of elution might also be influenced by intermolecular hydrogen-bonding effects and masking of polar functionalities (cf. Section 2.2). The free amino-functional group seemed to be of rather low influence to decrease the real lipophilic character of IAs (catharanthine and akuammicine) being recovered from HPCCC in the extrusion mode.
Figure 2. HPCCC off-line ESI-MS/MS injection profiling (m/z 100–2000) in the positive ionization mode of indole alkaloids from C. roseus. HPCCC chromatography scale displayed in KD values, collected tube fractions, and retention volume VR. The blue doted line in the MS-profile indicate the end of elution process and start of the extrusion-mode in the HPCCC experiment at switch volume VCM (290 mL). The blue arrows indicate the specific positions of close eluting 337-isobars in the HPCCC fractions.
Molecules 30 02115 g002
The first IA recovered with larger amounts from HPCCC was polar 19R-vindolinine (337-b) (Table 1), carrying one free amino function and one methyl-ester functionality, followed by vindoline (457) with lipophilic substitutions (-N-CH3 and -CH2-CH3), but strongly compensated by a polar hydroxy function. Slightly more lipophilic perivine (339-a) eluted sharply in the next tube (KD 1.06–1.18), showing the same substitution pattern as 337-b but presenting the ethyl-side chain function. Vindorosine (427) was the fourth IA in the elution sequence, and surprising was the lipophilic strength of the additional methoxy group compared to 457. However, akuammicine (323-j) with an identical substitution pattern to 337-b was recovered at high KD values from the lipophilic extrusion section. In catharanthine (337-f), a methyl-ester function was exchanged for a less polar carbonyl function. Overall, the free polar amino group seemed to have a low impact on decreasing lipophilicity, as already seen for 323-j.
Minor concentrated dimers of IAs (vincristine: m/z 825, vinblastine: m/z 811, catharine: m/z 823, catharanthamine: m/z 809, and vingramine: m/z 793) showing different chromatographic polarities on HPCCC were monitored by off-line ESI-MS/MS profiling. The relative concentration in fractions after HPCCC fortification appeared to be very low, assessed by detected ion counts, and finally preparative scale isolations failed. Important cytostatic drugs are the IA dimers vincristine and vinblastine, which are part of modern anti-tumor therapy (Figure 3).

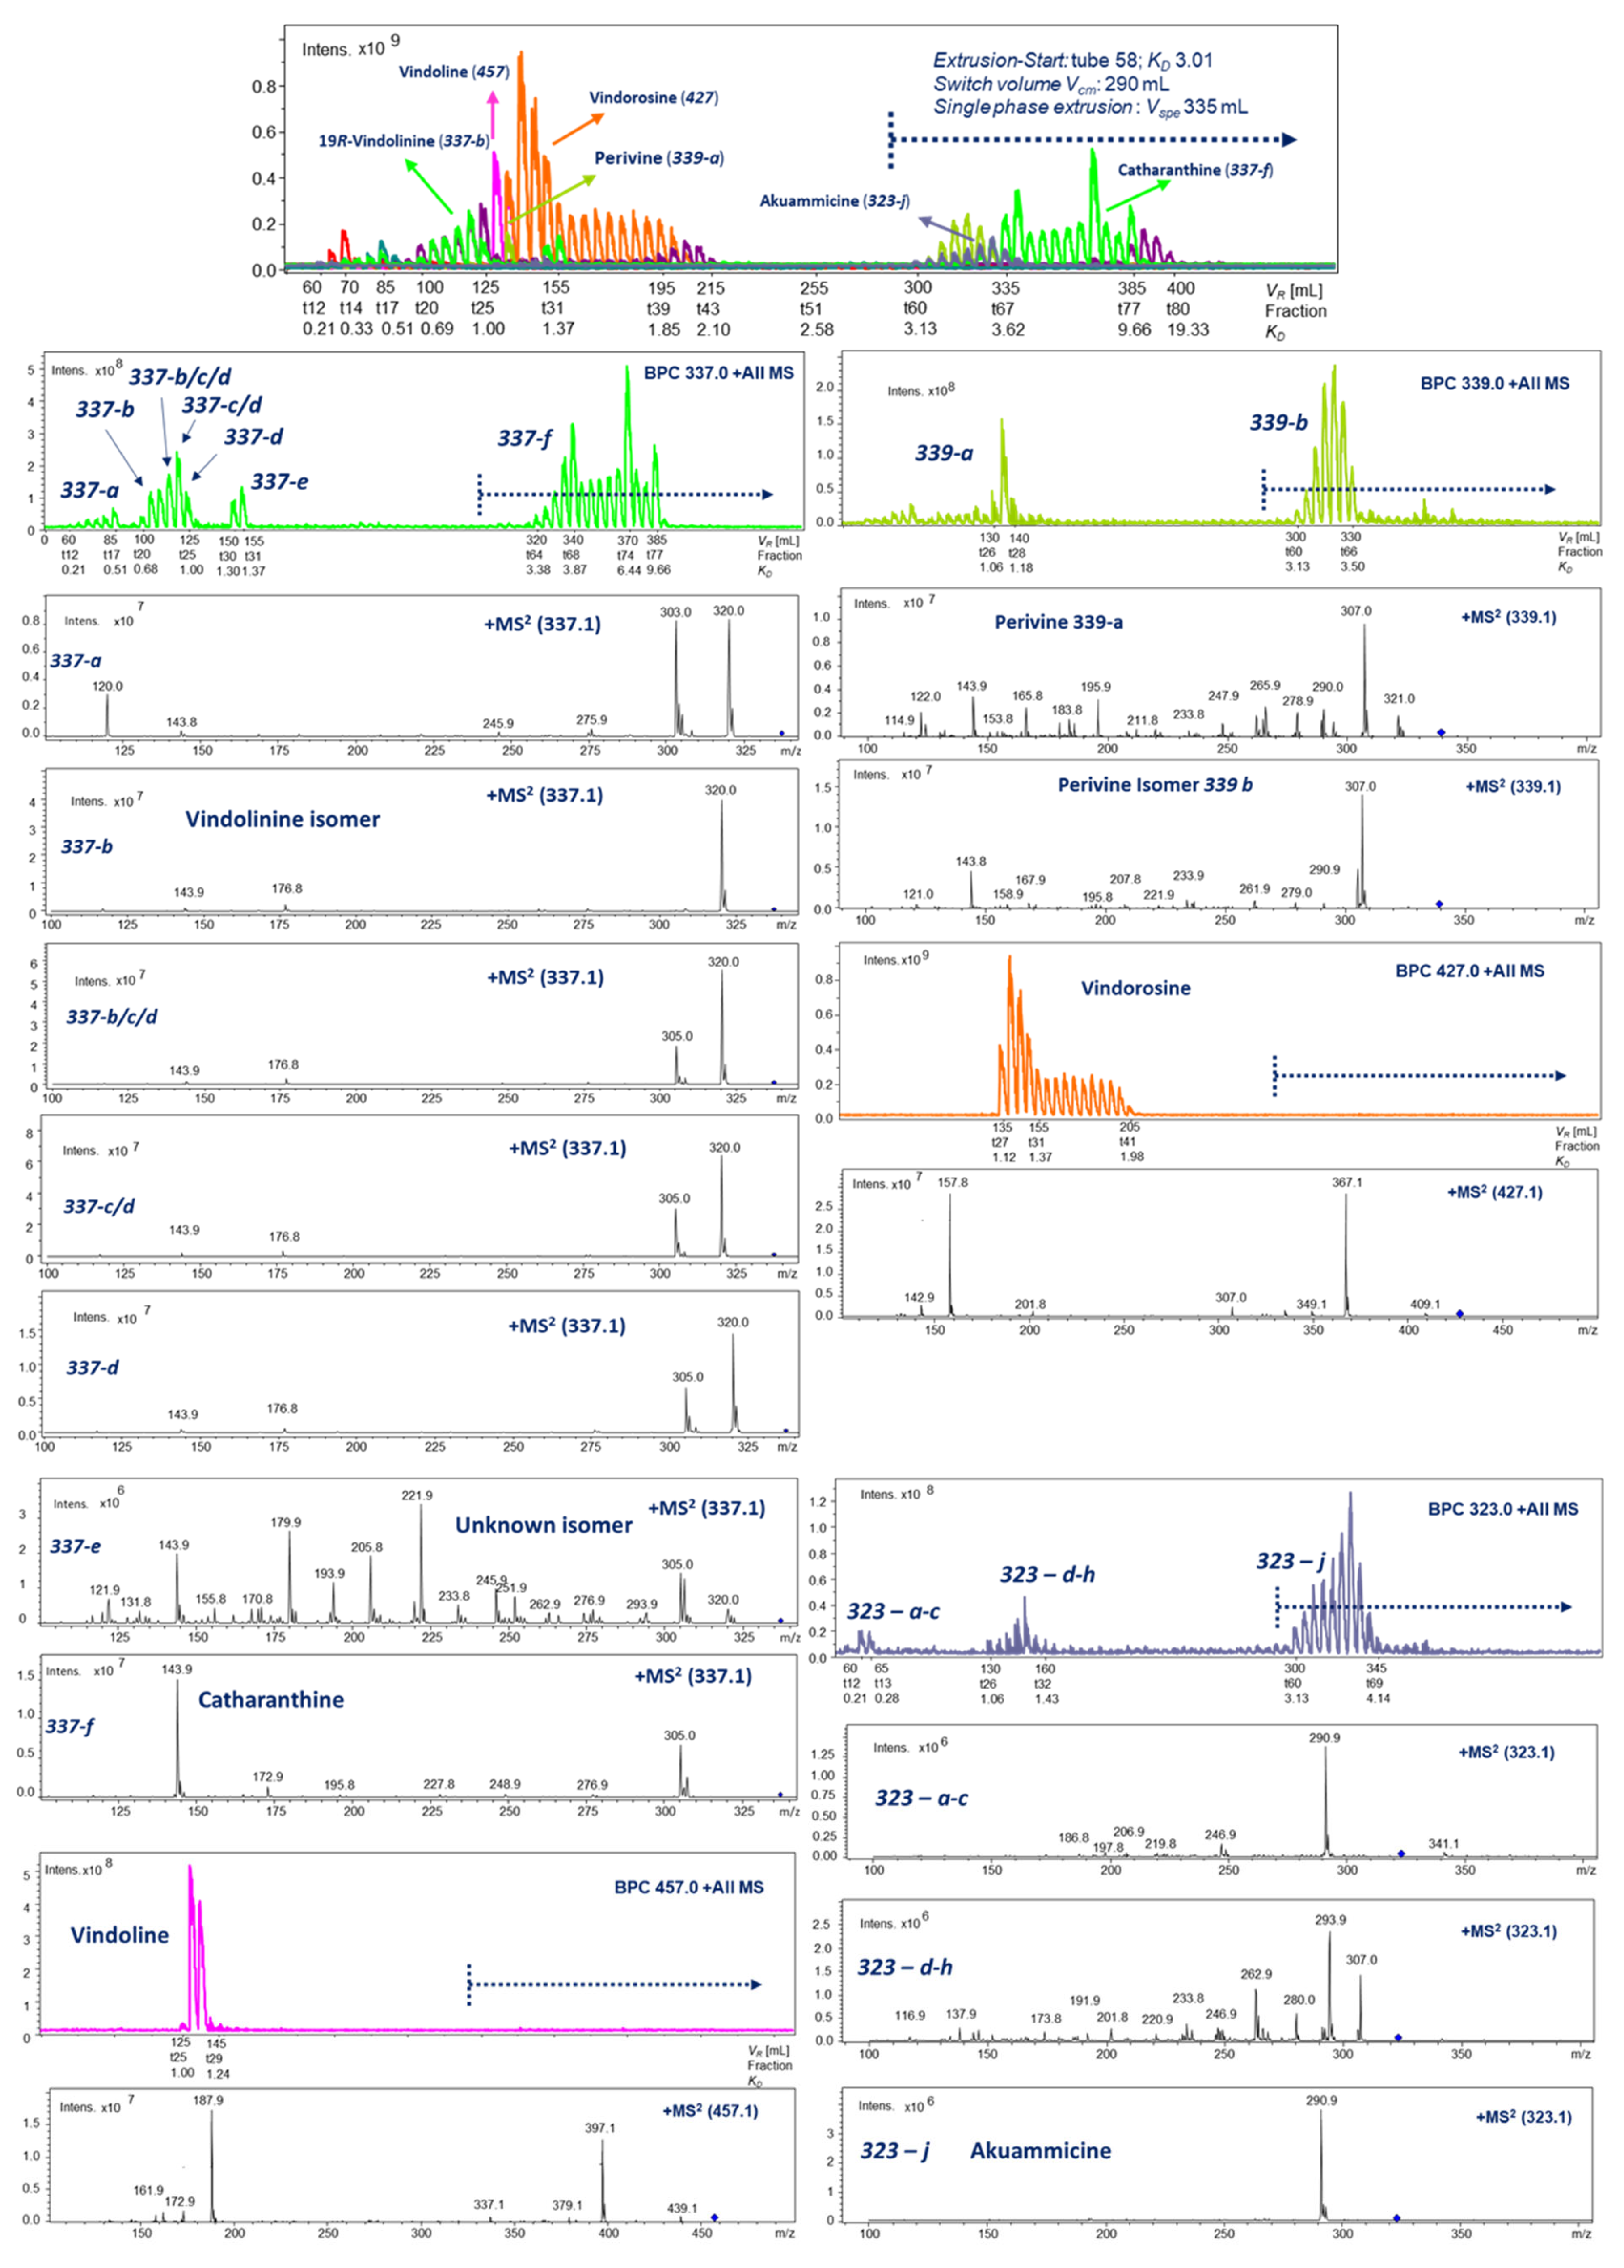
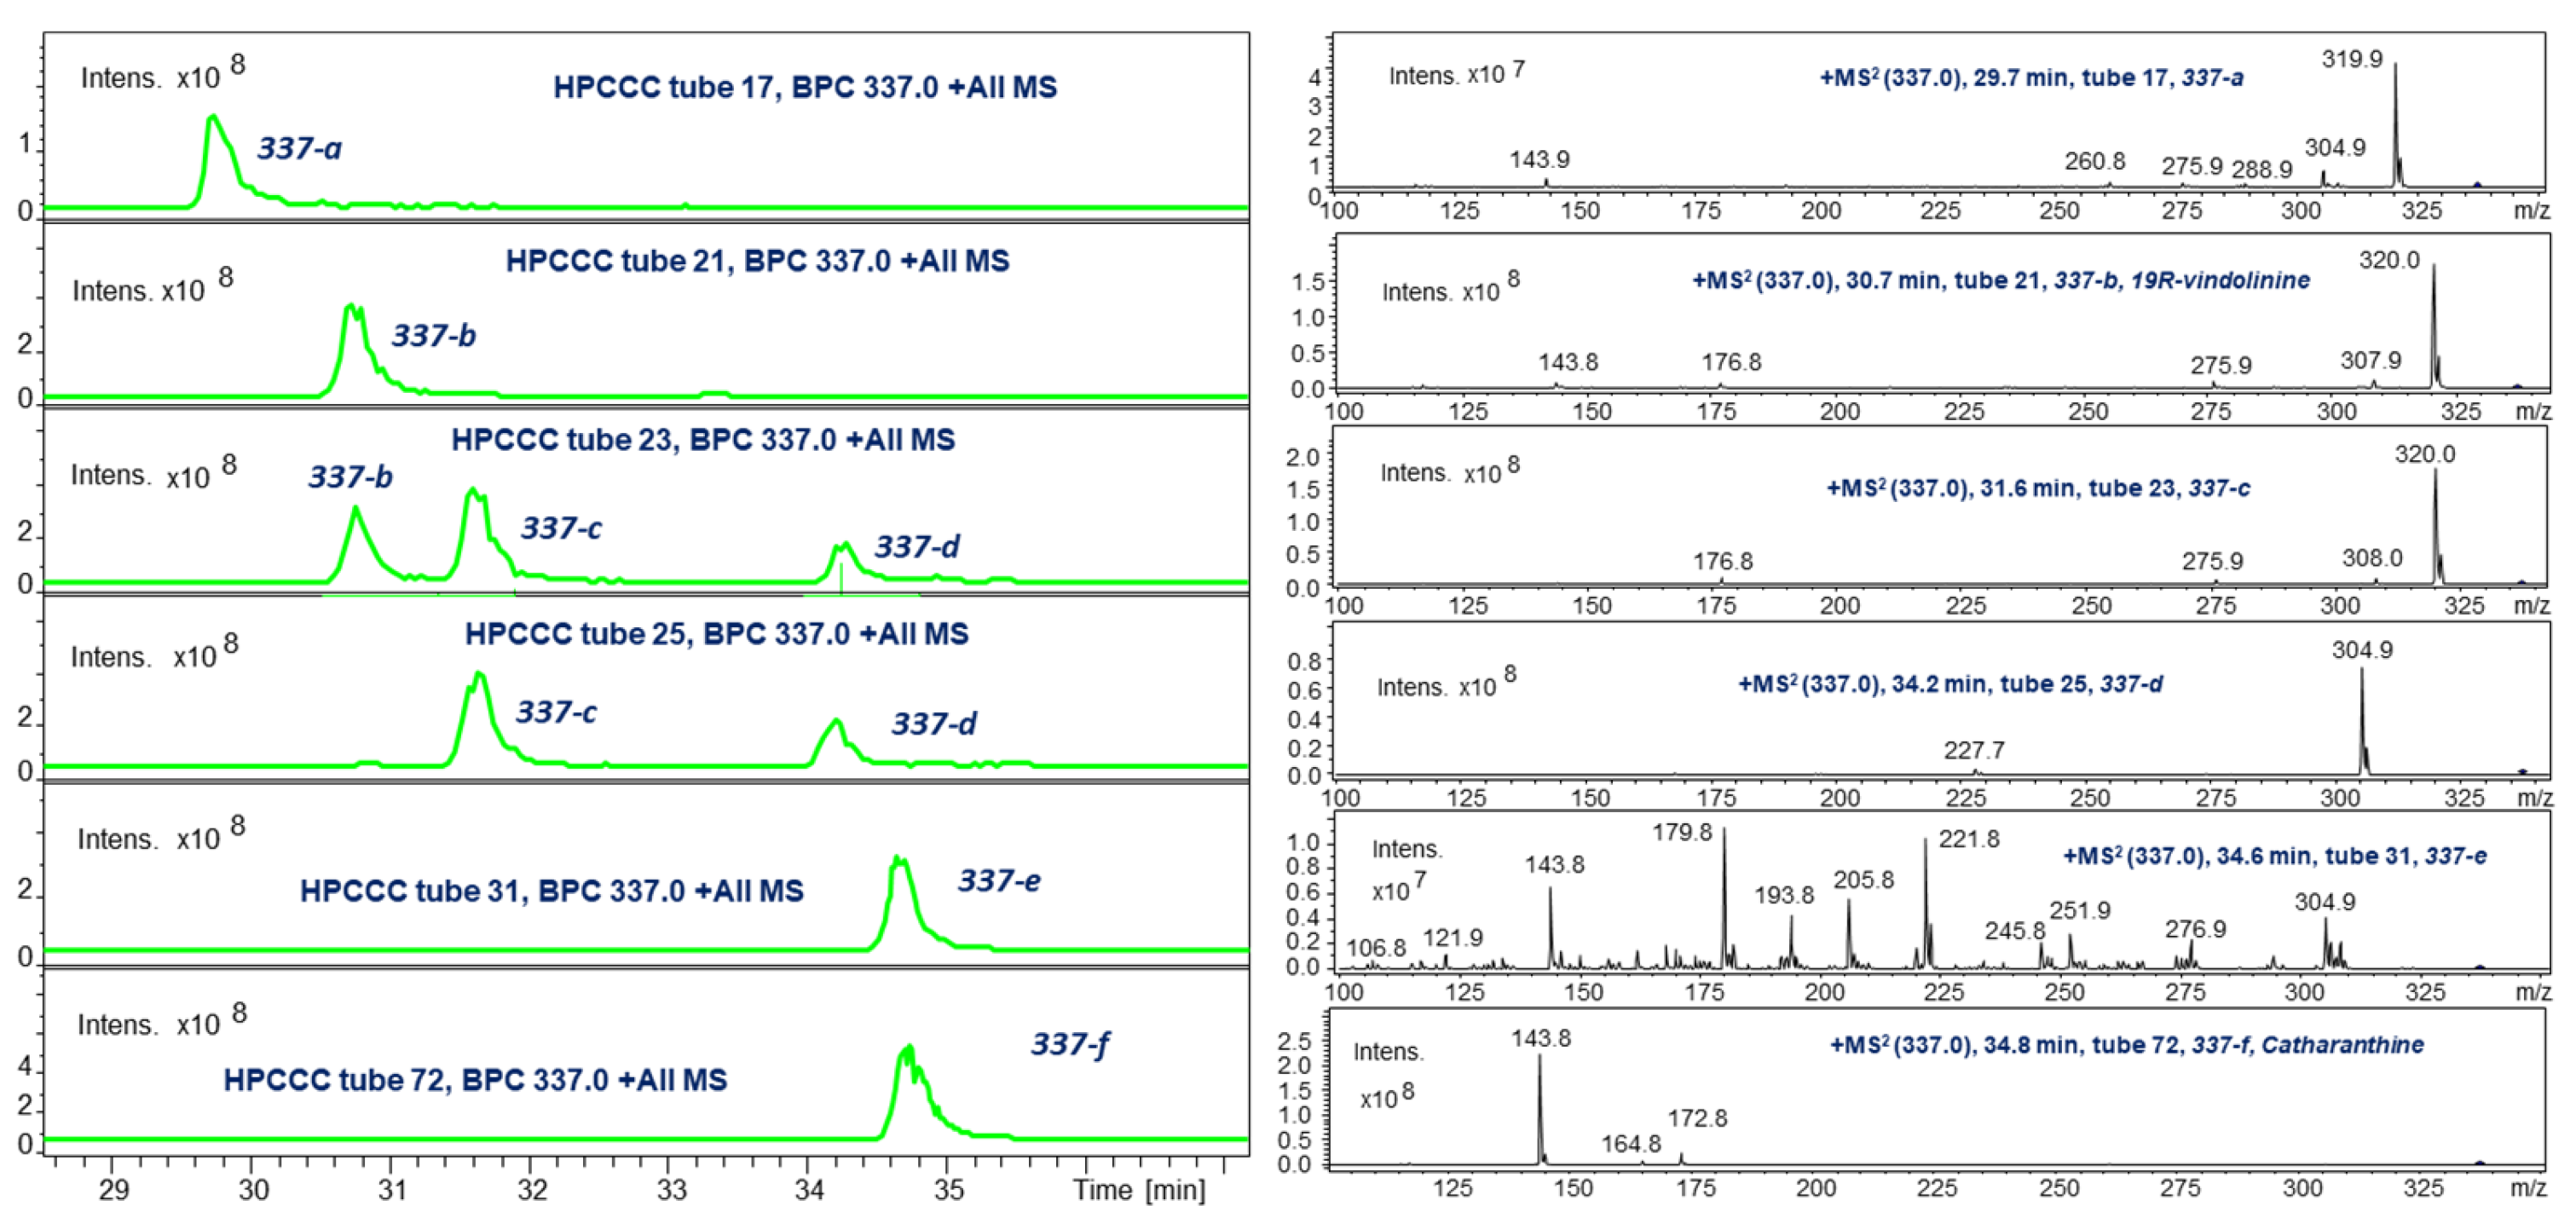
2.4. LC-ESI-MS of Selected HPCCC Fractions for Molecular Weight Isobar Monitoring

A 2D chromatographic approach on HPCCC-separated fractions using C18-LC-ESI-MS of some selected fractions revealed a much more complex picture of the existing IA isobars (Figure 4, Figure 5 and Figure 6). This re-chromatographic approach provided additional ESI-MS sensitivity to the detection limits with a deeper view to the diversity of isobars with m/z 337, m/z 339, and m/z 323. These target HPCCC fractions were selected on the data basis of the off-line ESI-MS injection profiling experiment (Figure 2).
In the case of m/z 337, the LC-ESI-MS (Figure 4) detected in the KD range (0.2–0.5, t17) a single compound (Rt 29.8 min, 337-a) with m/z 320 as the major MS/MS fragment. Already t21 in the range (KD 0.68–1.00) contained the completely separated 337-b (Rt 30.8 min). The contents of t23 revealed two more isobars, whereby the set 337-a/337-b/337-c displayed an absolutely identical MS/MS pattern (Figure 4). Moreover, 337-d (Rt 34.2 min) resulted in an MS/MS base peak at m/z 305, whereby the HPCCC KD range (1.30–1.37, t31) detected pure isobar 337-e of identical C18-LC retention time to 337-f. This last eluting IA was recovered as one of the most lipophilic compounds in extrusion mode. The MS/MS of 337-e appeared to be very complex and characteristic for this metabolite and seemed, with the ion m/z 144, to be connected to catharanthine 337-f, showing this respective base peak (cf. Section 2.5.3).
In the isobar monitoring of m/z 339 in the KD range (1.06–1.18, t27) of the elution mode (cf. Figure 2), a single peak was detected (30.0 min, 339-a) with a highly complex MS/MS fragment pattern. The higher abundant and potentially more concentrated recovery sections in the extrusion mode (KD 3.13–3.50) of the ESI-MS injection profile (Figure 2) were detected in tube fraction 61, four isobars (339-b to 339-e) (Figure 5), and showed in the analysis of fraction t66 in the declining slope of the HPCCC peak as the most abundant signal for 339-e, later NMR elucidated as perivine (cf. Section 2.5.4). Interestingly, isobar LC-ESI-MS/MS spectral data of 339-a and 339-e (cf. Figure 5) were quite similar, although the polarity-based recovery sections from HPCCC were completely different. All isobars displayed the base peak signal m/z 307 in the MS/MS experiment.
The ESI-MS off-line injection profile detected three principal sections of different polarities for the selected ion trace m/z 323 (KD 0.21–0.28; 1.06–1.43; 3.13–4.14) (Figure 6).
The 2D approach with LC-ESI-MS re-analysis separated and revealed the highest diversity of isobars for m/z 323 isobars. In the MS/MS, 323-a, b, c, f, i, j, and k displayed a strong fragment signal for m/z 291. After preparative column chromatography, purified 323-j was elucidated by 1D/2D NMR as akuammicine (cf. Section 2.5.5).

2.5. HPCCC Separation and 1D/2D NMR Structure Elucidation of Indole Alkaloids (IAs)

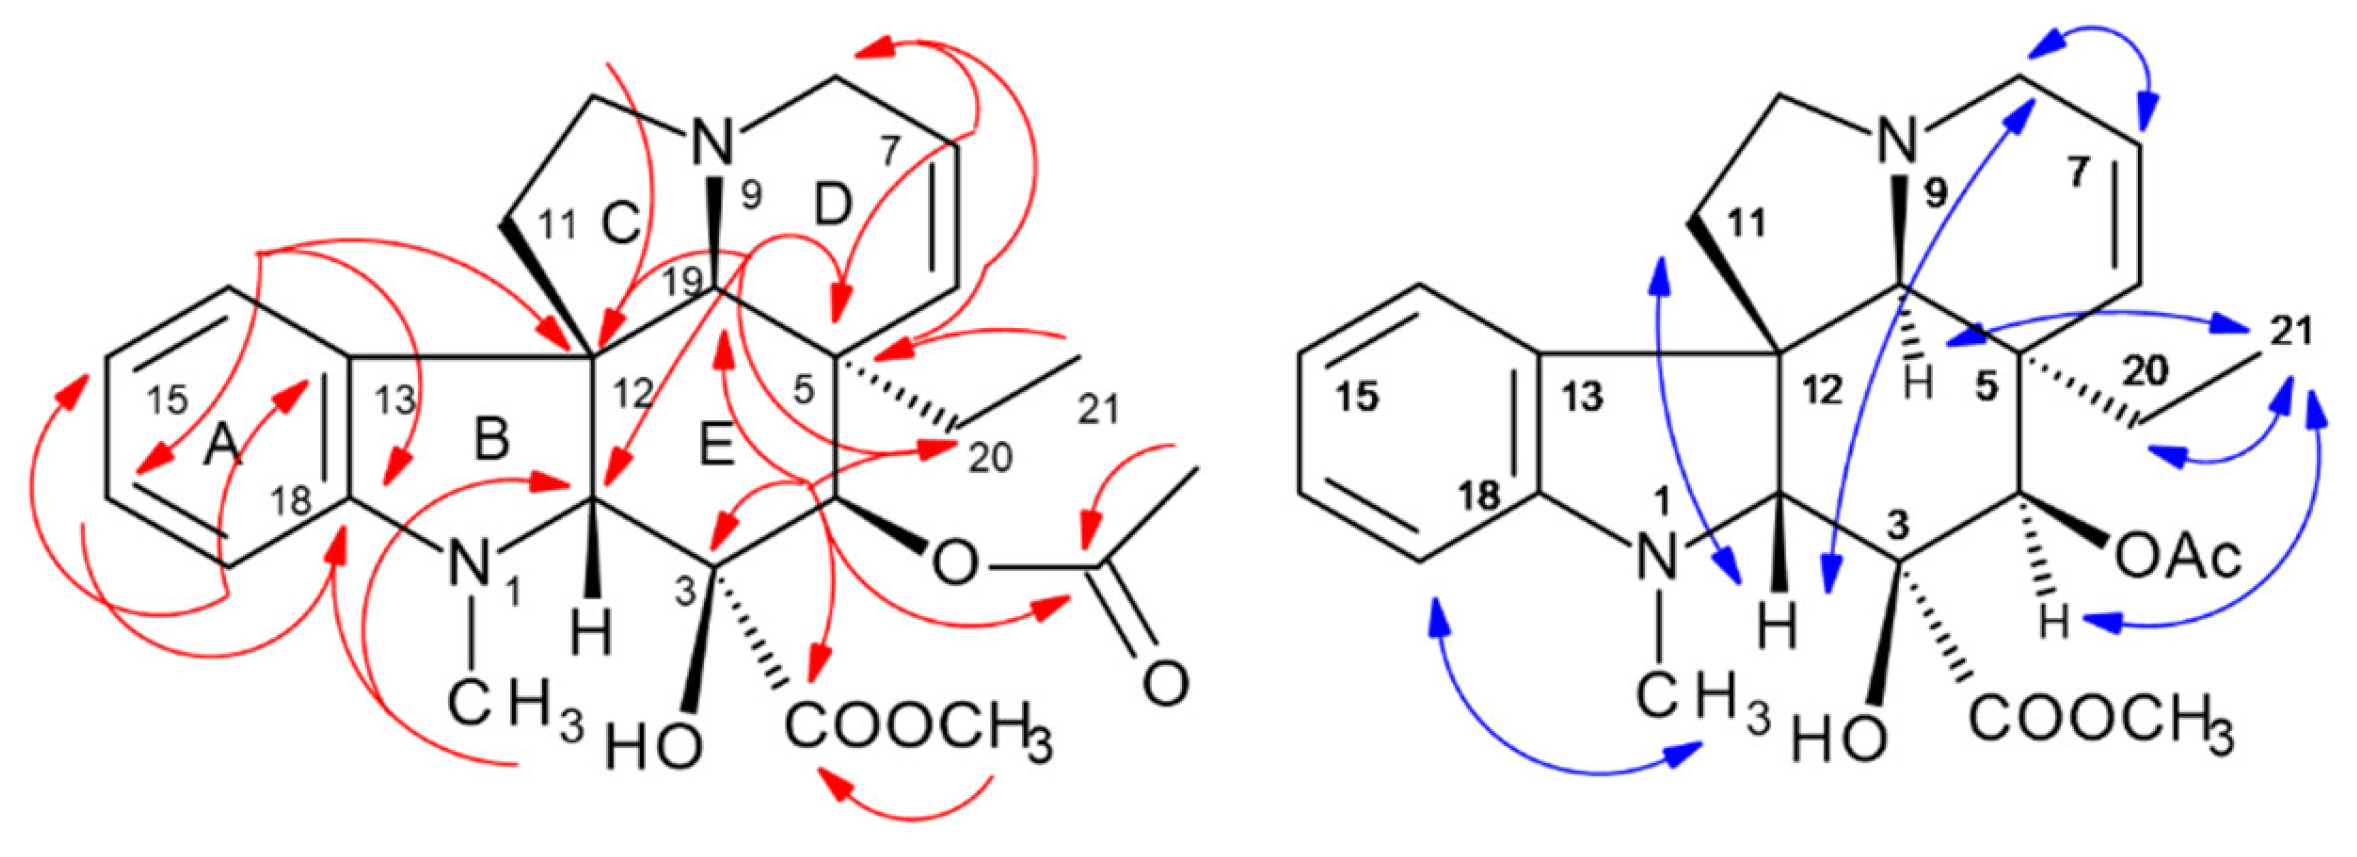
2.5.1. Vindorosine (427): (Syn. Demethyoxy-Vindoline, Vindolidine); [M + H]+: m/z 427

One of the principal indole alkaloids, vindorosine, was detected by a high signal intensity for the selected ion trace at m/z 427 in the off-line ESI-MS/MS HPCCC experiment (cf. Figure 2) of the fractions in the elution mode (KD 1.12–1.98, fractions t27-t42). Starting at the KD range of 1.37 (t31), the peak intensities from the MS profile indicated a strong tailing effect in the HPCCC. However, the LC-ESI-MS analysis of the respective fractions containing m/z 427 proved the existence of solely vindorosine and no isobars over this detected whole HPCCC elution range.
As the off-line MS injection profile (Figure 2) suggested a high purity of vindorosine, e.g., in fraction t28, 41 mg of it were recovered and directly used for 1D/2D NMR spectroscopic experiments. 13C-NMR spectra in CD3OD and also in C6D6 detected twenty-four resonances, including thirteen CH/CH3, four CH2, and seven quaternary signals (confirmed by DEPT135, phase-edited HSQC) (cf. Supplementary Table S1). In the HMBC, key long-range cross signals (cf. Figure 7, Supplementary NMR Figures S5 and S6) of protons in central structural positions, such as H-2 (δ 3.73 ppm), H-4 (δ 5.80), H-19 (δ 2.62 ppm), H-14 (δ 6.71 ppm), and H-17 (δ 6.21 ppm), elucidated the fusion and constitution of ring systems (A-E) of vindorosine (cf. Figure 7). The advantage of measuring in C6D6 was that H-4 (δ 5.80 ppm) and H-6 (5.12 ppm) did not overlap as in CD3OD (cf. Supplementary Table S1) and enabled a clear HMBC observation. Specific carbon resonances compared to literature data in C6D6 appeared to be conspicuous (for comparison reasons, the numbering system of Ishikawa et al. [25,26] and displayed 13C-δ-shift off-sets (∆ppm: +/− 1.8–2.8 ppm). However, a NOESY experiment confirmed the relative configurations of chiral centers in the isolated vindorosine, and the chiral centers were in absolute accordance with the methoxy-derivate vindoline (cf. Figure 7).
NOE effect sequences (seq.) were observed from the aromatic H-14 (δ 7.36 ppm). Seq. 1 (upper): led to H-15 over 16/17 → >N-CH3 → H-2 cross-over to H-11a → H-14.
The NOE-seq. 2, 3, and 4 were identical to the effects observed for vindoline (cf. below vindoline, Supplementary Table S1, Figure 8). All the observed through-space effects corroborated the known stereochemistry of vindorosine (cf. Supplementary Table S1, Supplementary NMR Figure S5). Potentially, observed δ-ppm value offsets could be correlated to differing concentrations and pH values of NMR probe solutions.

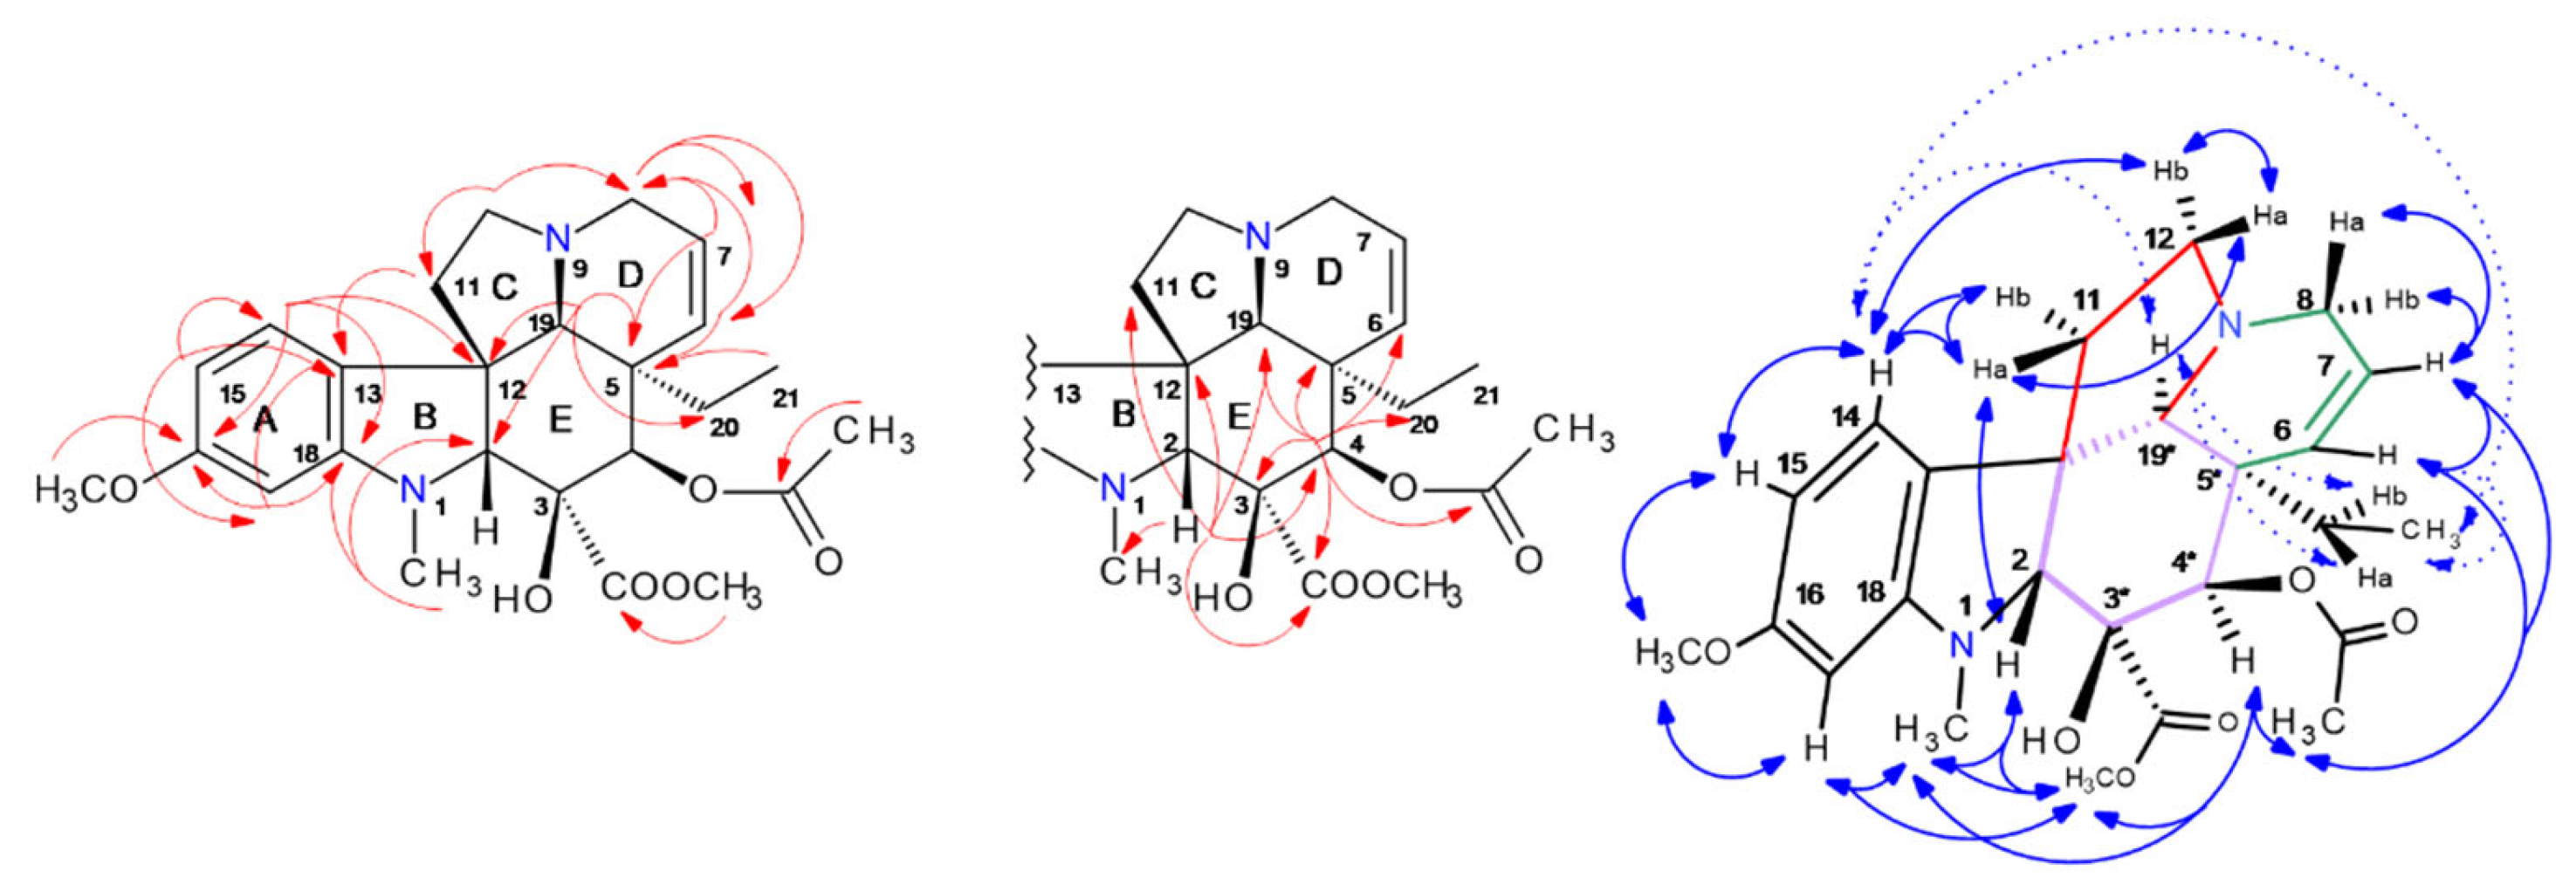
2.5.2. Vindoline (457): (Syn. Methoxy-Vindorosine); [M + H]+: m/z 457

Vindoline (457) was detected in the off-line ESI-MS profiling of HPCCC fractions in a rather narrow elution window (t25–t27, KD 1.00–1.24) (cf. Figure 2) using the selected ion trace for [M + H]+ at m/z 457.
The ESI-MS/MS from the MS-profile experiment displayed two strong fragment ions at m/z 397 and 188 (cf. Figure 2), consistent with analysis of a commercial reference and literature data [27].
Vindoline (457) is a methoxy derivative of the IA vindorosine (427) [4] (Figure 8), and for better comparison, the numbering system of Ishikawa [25] was used for IA-427. IA-457 displayed in the head-to-tail mode a lower retention volume than IA-427, explained by its approximate more polar character. The part of co-elution in t27 with vindorosine (Figure 2) was not problematic, as most of IA-427 was eluted in later fractions. Although a quite low selectivity factor value was determined (α 1.38) from the HPCCC experiment, this chromatography situation was not problematic, as the major concentrated IA-427 with strong tailing was the second eluting metabolite. Retention time values from LC-ESI-MS indicated that vindoline (Rt 36.5 min) and vindorosine (Rt 36.8 min) would be a highly problematic IA pair to be separated by preparative C18-LC.
HPCCC fractions t26–27 were cleaned by preparative C18-HPLC to remove poly-disperse background material, and then IA-457 was used for 1D/2D NMR (cf. Supplementary NMR Figure S9). 13C-/DEPT135-NMR detected 25 carbons (four CH2, eight CH, five CH3, and eight quaternary resonances) [28]. The combination of HSQC and HMBC (Supplementary Table S1, Figure 8) unambiguously determined the constitution of vindoline (457). Singlet proton resonances H-2 (δ 3.72 ppm), H-19 (δ 3.58), and H-4 (δ 5.43) were valuable ‘bridge points’ with indicative 2,3J-HC long-range signals for elucidation of ring-system connections (Figure 8). Comparing the data of 427 and vindoline (457), stronger 13C-NMR δ-shift differences were solely seen for the aromatic ring due to the methoxy-substitution, and smaller shifts for C-2 and 12 supported the consistency of all steric centers in both IAs.
The analysis of all observed NOESY correlation signals confirmed the stereochemical centers (C-3/4/5/19) with their orientations known from X-ray analysis of the vindoline system in the IA dimer vincristine (syn: leurocristine) [29].
Vindoline NOE effects were presented for visualization in an upper and a lower molecular plane (Figure 8). In this approach, the starting point for observation of NOE effect sequences (seq.) was the aromatic H-14 (δ 7.21 ppm). Seq. 1 (upper) (bold blue arrows): led to H-15 → aromatic -OCH3 → >N-CH3 → H-2 crossing over the indole to H-11a → H-14. Seq. 2 branched at H-2 → -COOCH3 → H-4 → -COCH3 → H-6 → H-7 → H-8a/b. Seq. 3 connected H-11a to H-12a/b and back to H-14. In seq. 4, the lower plane (dashed blue) was seen from H-14 → H-19 → ethyl protons H-20a/b connecting to seq. 2 and directly from H-14 to 21-CH3 due to conformational orientation (cf. Supplementary Table S1, Figure 8).
In the off-line ESI-MS/MS profile of HPCCC fractions (Figure 2), as well as in the LC-ESI-MS/MS analysis of the individual CCC fractions, solely one compound was detected, indicating the complete absence of any m/z 457 isobaric metabolites. The ESI-MS/MS data of vindoline (457) with the most potent fragment ions at m/z 188 and 397 were in perfect accordance with Kumar et al. [30].

2.5.3. Catharanthine (337-f): [M + H]+ m/z 337

Catharanthine (337-f)—a major concentrated alkaloid with a C16-C21 bond (resulting in the displayed bridged rigid ring system of a type II indole system (iboga alkaloid) (cf. Figure 9) [5]. IA-337-f was detected in the off-line ESI-MS experiment with [M + H]+ at m/z 337 in the extrusion process of HPCCC (t64–78, KD 3.38–11.6). The identity, the occurrence of 337-f as a single metabolite, and the absence of respective isobars were proven by LC-C18-ESI-MS analysis and MS/MS fragmentation pattern showing the principal fragment ions m/z 305 and 144 with intensities according to literature [3].
The lipophilicity of 337-f is due to missing polar substitutions (hydroxyl function), much higher compared to vindoline and vindorosine. Interestingly, akuammicine (fractions t60–69) appeared to be less lipophilic than catharanthine, although the amount of polarity-influencing groups seemed to be equal.
Catharanthine was solely purified by HPCCC, and 23 mg were directly used from t74 for 1D/2D NMR experiments, whereby 13C/DEPT135-NMR detected 21 carbon atoms (five CH2, seven CH, two CH3, and seven quaternary C).
The constitution of 337-f was clarified by HSQC, HMBC, COSY, and NOESY (cf. Supplementary Table S1, Figure 9). Indicative 2,3J-HC long-range correlations in the HMBC, such as from H-5/6/9/15/21/14/15/16, determined the bicyclic system (Figure 9, Supplementary NMR Figure S2). The experiment in CDCl3 with strong correlation signals from proton >NH-1 provided helpful information for structural assignment in the HMBC and NOESY experiments. A key correlation position for observation of a large set of 2,3J-HC cross-signals was proton-signal δ 4.88 ppm at the C-21 chiral center.
Catharanthine contains three stereochemical centers (C-14/16/21), whereby 14S is characteristic of this iboga-type alkaloid [5]. The ring system connections and the stereochemical arrangements (Figure 9) were determined by NOESY cross signals. NOE effects were seen in two molecular planes (upper and lower).
Also in this case of 337-f, NOE correlation sequences for stereochemical analysis were detected, e.g., seen from aromatic H-9 (δ 7.49 ppm) to H-6a/6b → H-5a → H-21 methylester CH3-22, and NH-1 → CH3-18 characterizing the upper molecular field (bold arrows). NOE observations for the lower plane equally start from H-9 → H-6b → H-3b → 3a → H-14 → H-15, and then back to the upper plane (CH2-19 and CH3-18), closing up to the NOE bridgehead H-21 (δ 4.88 ppm). (cf. Supplementary NMR Figure S2, Figure 9). Signal overlappings in the 1H-NMR of H-5b (δ 3.43) and 6a (δ 3.41 ppm) prevented the precise analysis of NOESY and COSY correlations. As confirmed by NOESY, isolated catharanthine is a rigid tricyclic indole alkaloid from the 14S series (whereby most of the iboga alkaloids belong to 14R) [5].
A more extensive set of ‘337 isobars’ was detected in the elution range of HPCCC (Figure 2, cf. selected ion trace m/z 337 and respective MS/MS data compilation)—one of these metabolites was isolated and identified as 19R-vindolinine (337-b) (cf. Section 2.5.6). All IA (337-a 337-e) compounds in the fractions t13 to t23 displayed a much more polar chromatographic elution behavior than catharanthine (337-f). However, on analytical C18-HPLC, all fractions t24/25 and t30/31 displayed similar retention times compared with catharanthine. Therefore, head-to-tail mode-HPCCC (reversed phase mode) and LC-C18 displayed complementary separation characteristics. These 337 isobars would have barely been fractioned solely by the use of a preparative C18-HPLC chromatographic separation.
The MS/MS fragmentation of isobars 337-a337-d was very similar; only the unknown IA 337-e and catharanthine displayed differences in the pattern (cf. Figure 2 and Figure 4, selected ion trace m/z 337).

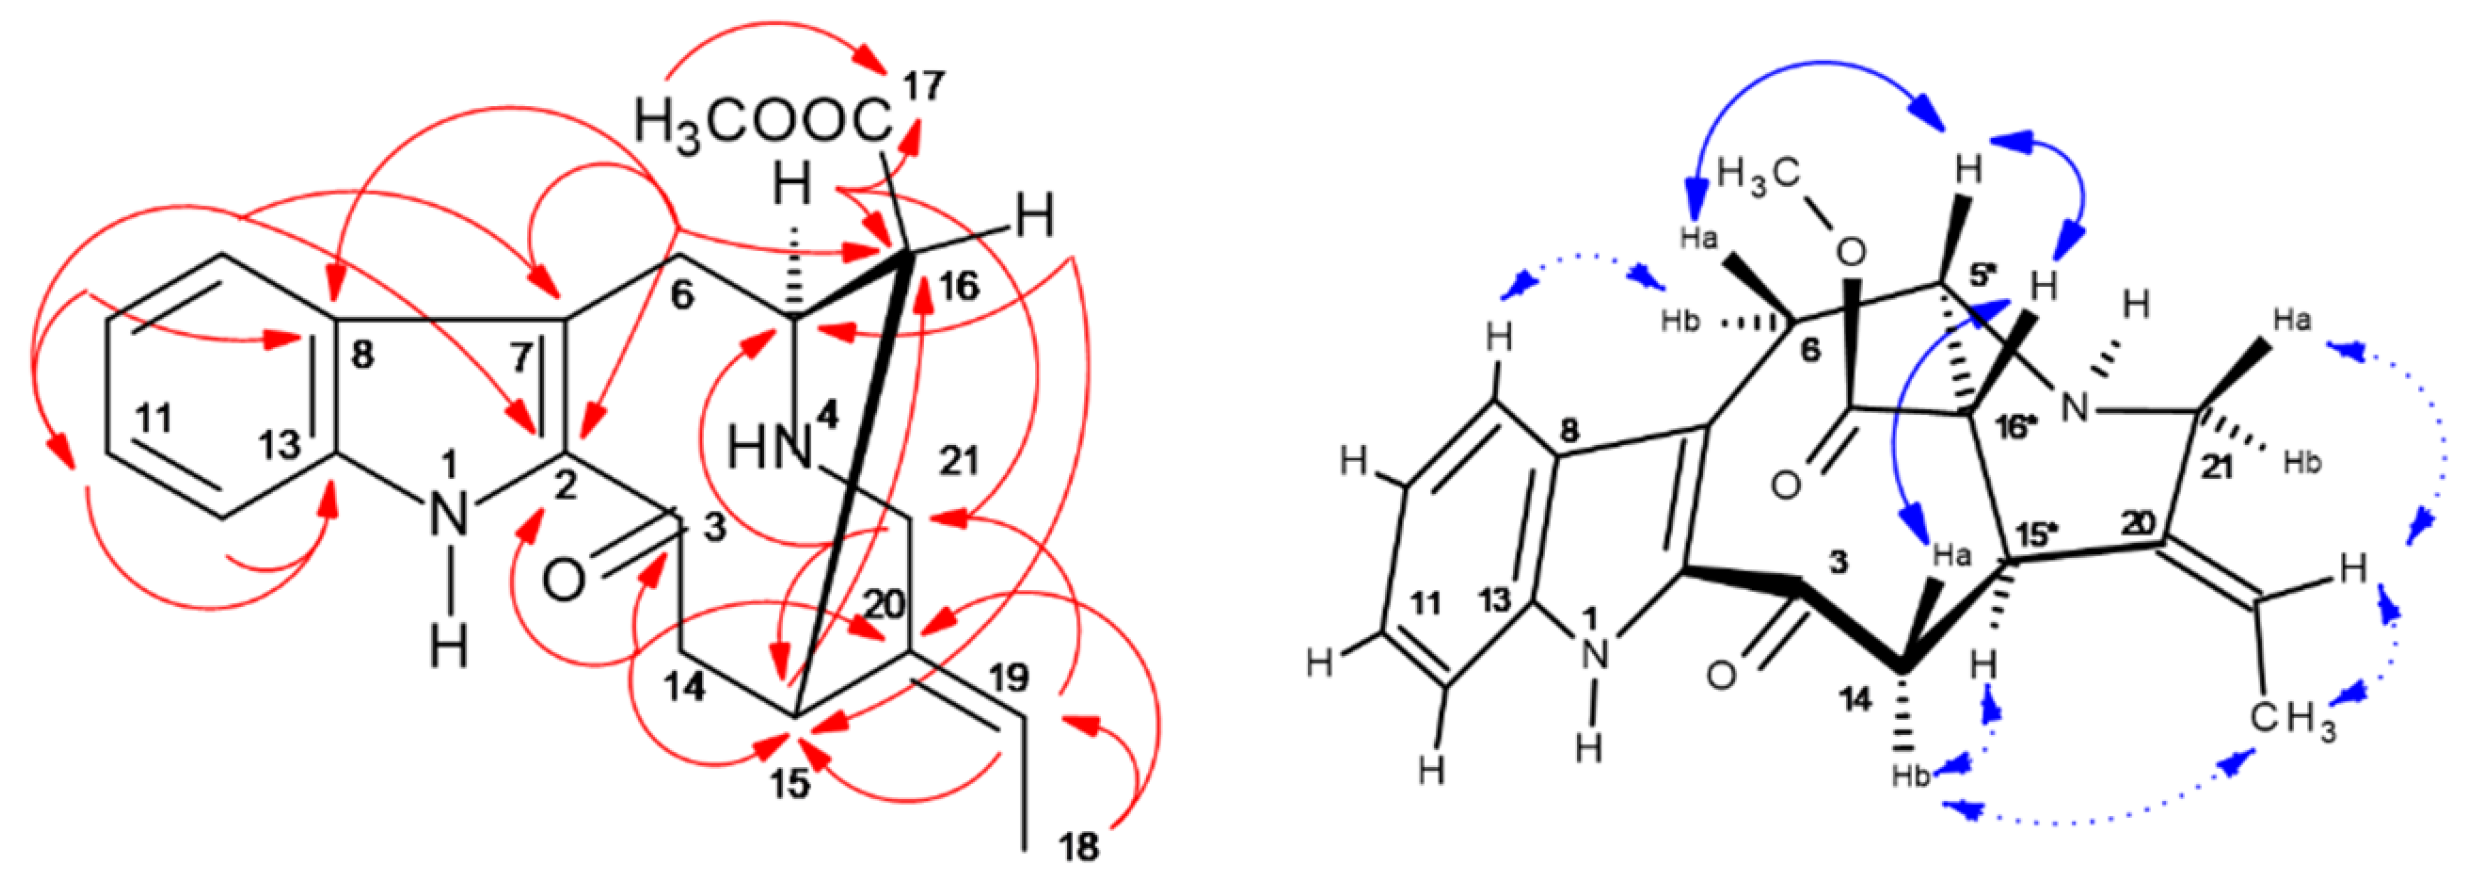
2.5.4. Perivine (339-a): [M + H]+ m/z 339

Perivine (339-a) was traced by the selected single ion trace at m/z 339 in the HPCCC/ESI-MS off-line profile (Figure 2) in a narrow recovery range (fractions t26–28, KD 1.06–1.18). The principal compound, vindorosine (427), co-eluted. In consecutive steps, perivine was cleaned by C18-HPLC and SiO2-column chromatography from the most concentrated target fraction, t27.
13C/DEPT135-NMR detected 20 carbons consisting of three CH2, eight CH, two CH3, and seven quaternary resonances. HSQC, HMBC, and COSY (cf. Supplementary Table S1) unambiguously determined the constitution of 339-a. 2,3J-HC correlations in the HMBC from H-5/6/14/15/16 elucidated the carbon resonances in the bicyclic system (cf. Supplementary NMR Figure S4, Figure 10).
The EI-MS of 339-a with [M]+ at m/z 338 displayed the base peak ion m/z 166 and lower intensity ions at m/z 130, 172, and 279, and these ions were in good accordance with the literature [2]. HR-ESI-MS (pos. mode) resulted in [M + H]+ at m/z 339.17032 ([C20H22O3N2 + H]+, calc. 339.17319, −∆m/z 0.003 ppm), and indicative fragment ions m/z 124 (C7H10O1N1), 166 (C9H12O2N1), 196 (C10H14O3N1), 279 (C18H19O1N2), and 307 (C19H19O2N2) were investigated for element sum formulas [31], and MS/MS data already had been derived from off-line ESI-MS/MS low-resolution profile (cf. Figure 2) [2].
Perivine contains three stereochemical centers (cf. Figure 10), which had been elucidated by observed NOESY cross signals. Protons located in the ‘upper’ molecular plane (Figure 10, cf. Supplementary NMR Figure S4) were seen by consecutive NOE effects due to close spatial distance H-6a (δ 3.76 ppm) → H-5 (δ 2.90 ppm) → H-14a (δ 3.55 ppm), and on the ‘lower’ plane with the NOE-seq.: H-21a (δ 3.76 ppm) → H-19 (δ 5.81 ppm) → CH3-18 (δ 1.81 ppm) → H-14b (δ 2.68 ppm) → H-15 (δ 3.88 ppm) (Figure 10). In the HPCCC extrusion section (KD 3.14–3.50), one further 339-isobar was detected, but preparative isolation failed (cf. Figure 2).

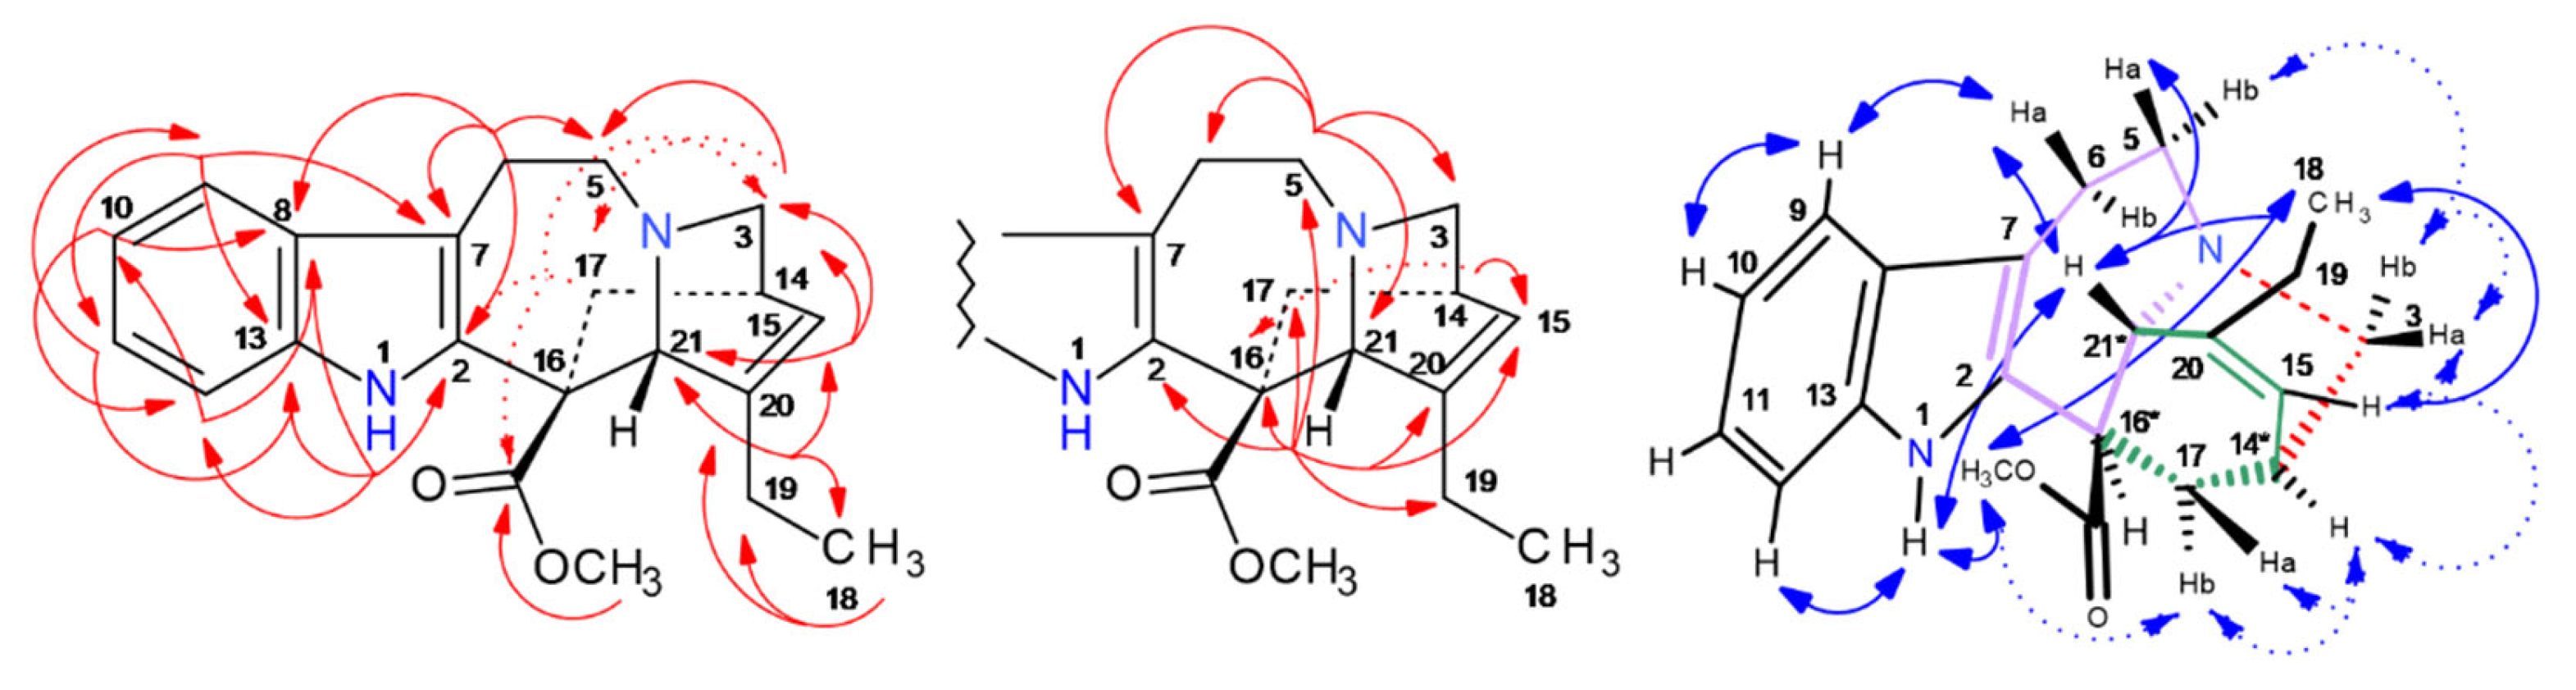
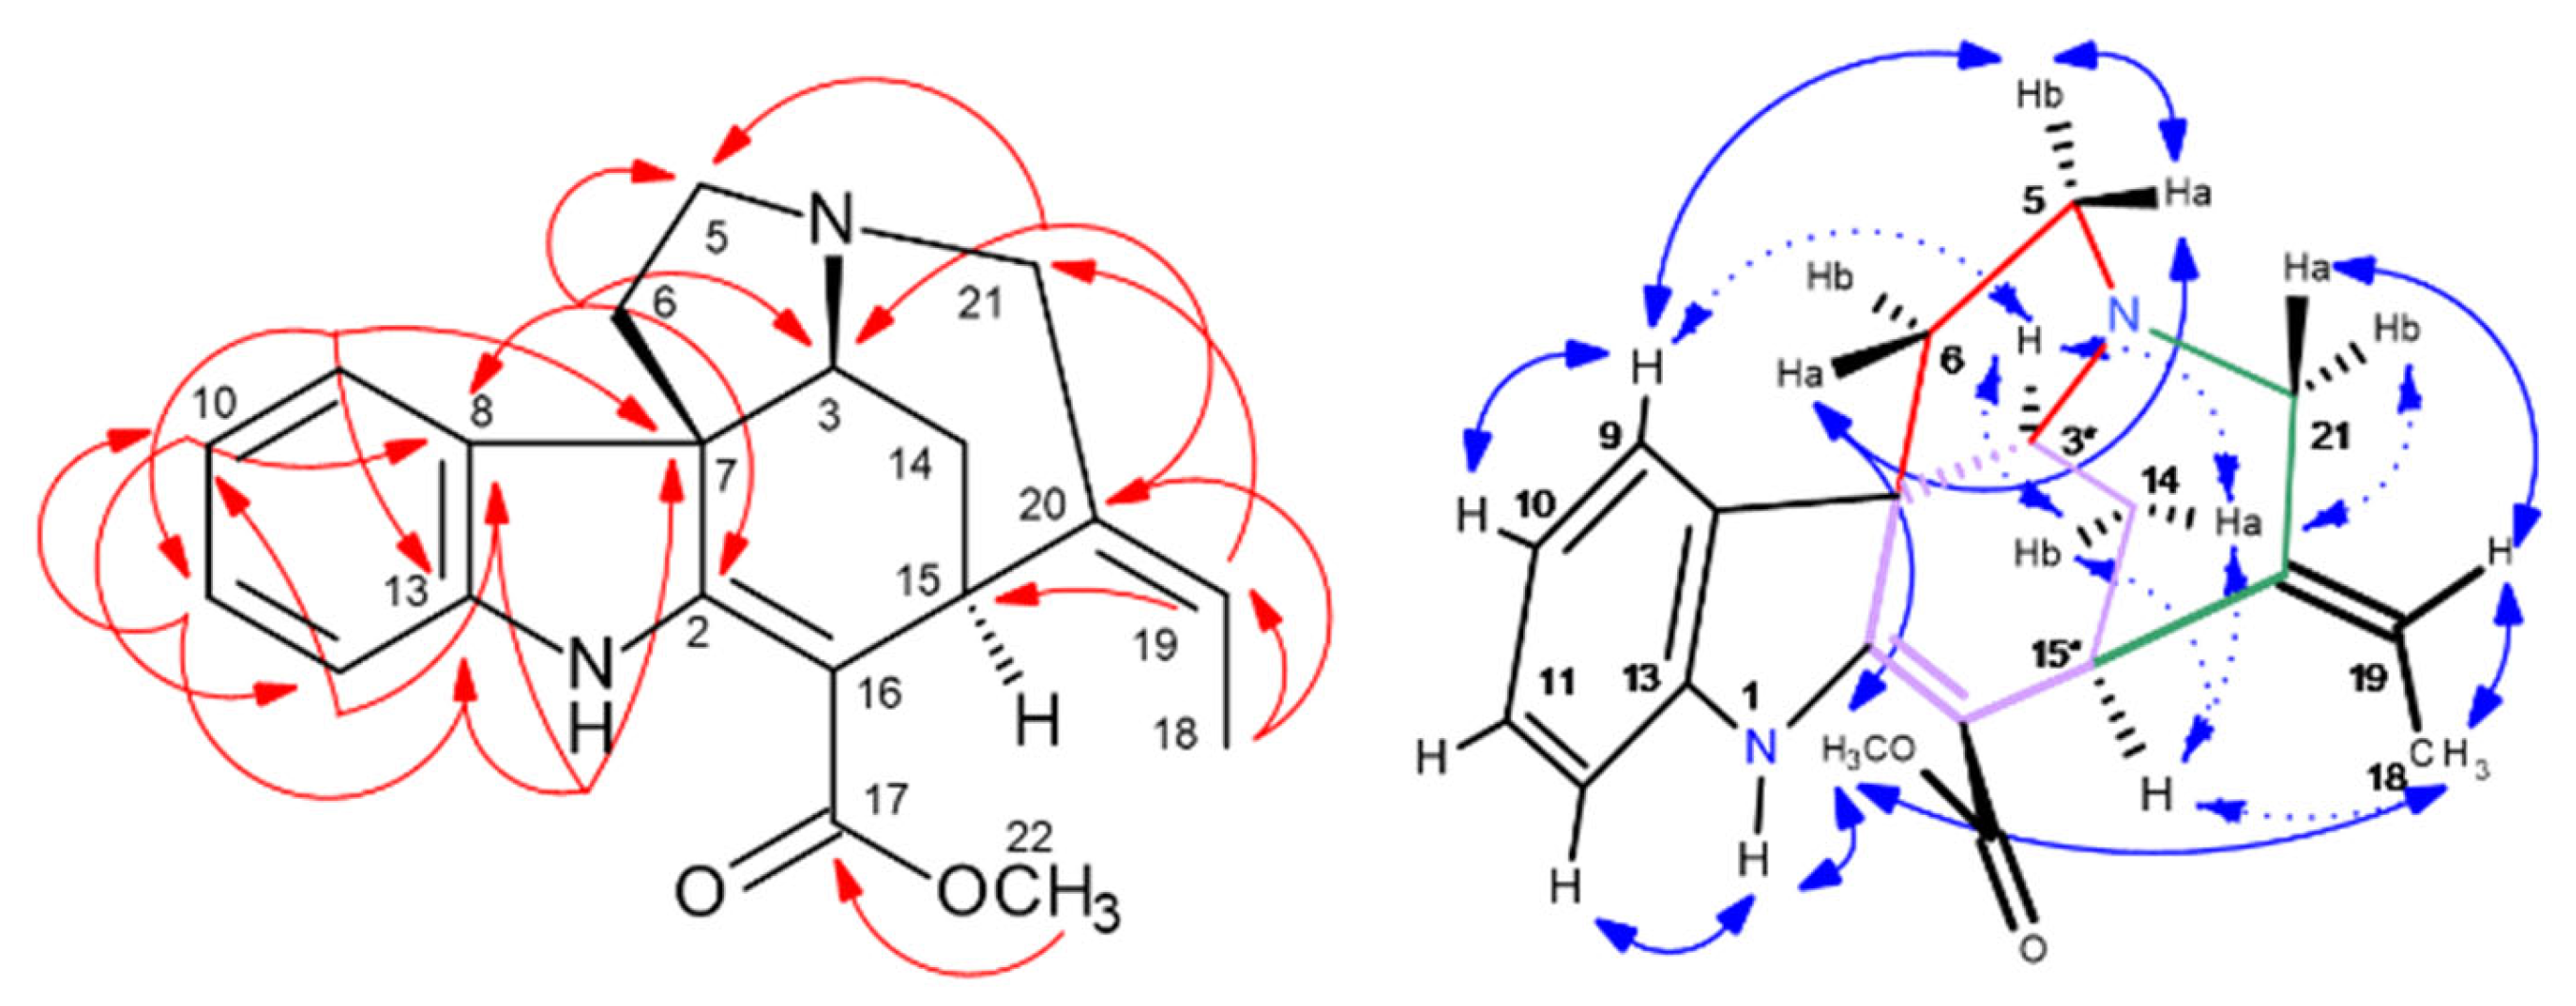
2.5.5. Akuammicine (323-j): ([M + H]+: m/z 323

Akuammicine was detected in the off-line ESI-MS/MS profile by the selected single ion trace [M + H]+ at m/z 323 during HPCCC-extrusion (fractions t60–69, KD 3.13–4.14) (Figure 2).
The major fractions from the HPCCC (t60–62; KD 3.13–4.14) were used for chromatographic clean-up (preparative C18-HPLC and SiO2-CC).
During short-time storage of the purified fraction in the solvent mixture of SiO2-CC, color-less crystals of akuammicine formed and were submitted to X-ray analysis in previous work by Yahyazadeh et al. [32]. Results of constitution and stereochemical properties were in absolute accordance with the published formula [5].
Purified akuammicine (1.5 mg) was used for 1D/2D NMR analysis (cf. Supplementary Table S1 and Supplementary NMR Figure S3). 13C-NMR detected 20 carbons (four CH2, seven CH, two CH3, and seven quaternary resonances). HSQC, HMBC, and COSY (cf. Supplementary Table S1, Figure 11) unambiguously determined the constitution of 323-j. Akuammicine contains three stereochemical carbon positions (C-3/7/15) (Figure 11), and these findings were confirmed by observed NOESY cross signals for the through-space proton connectivity. Upper (bold blue arrows) and lower (dashed arrows) molecular planes are displayed in Figure 11. The consecutive correlation sequences of NOE-seq. starting from aromatic H-9 (δ 7.39 ppm) to H-5b/5a → H-6a → methylester CH3-22 → NH-1 → H-12 defined the upper molecular field (bold arrows). NOE observations for the lower plane equally start from H-9 → H-3 → H-14a/b → H-15 → CH3-18. The CH3-18 function is a kind of bridgehead connecting over CH3-22 to the described upper layer and also a second upper region (H-19 and H-21a) (cf. Supplementary Table S1, Figure 11). A large number of molecular weight 323-isomers with strongly increased polarity compared to 323-j were seen in the elution areas t12–13 (KD 0.21–0.28) and t26–32 (KD 1.06–1.43). Especially, the similar MS/MS fragmentation pattern of 323-j to 323-a and 323-b was of interest, suggesting a molecular coherence (cf. Figure 2 and Figure 6). Principal IA 323 isobars could be strictamine, cochrovicine, 12-methoxy-vincamine, pericyclivine, and pleiocarpamine.

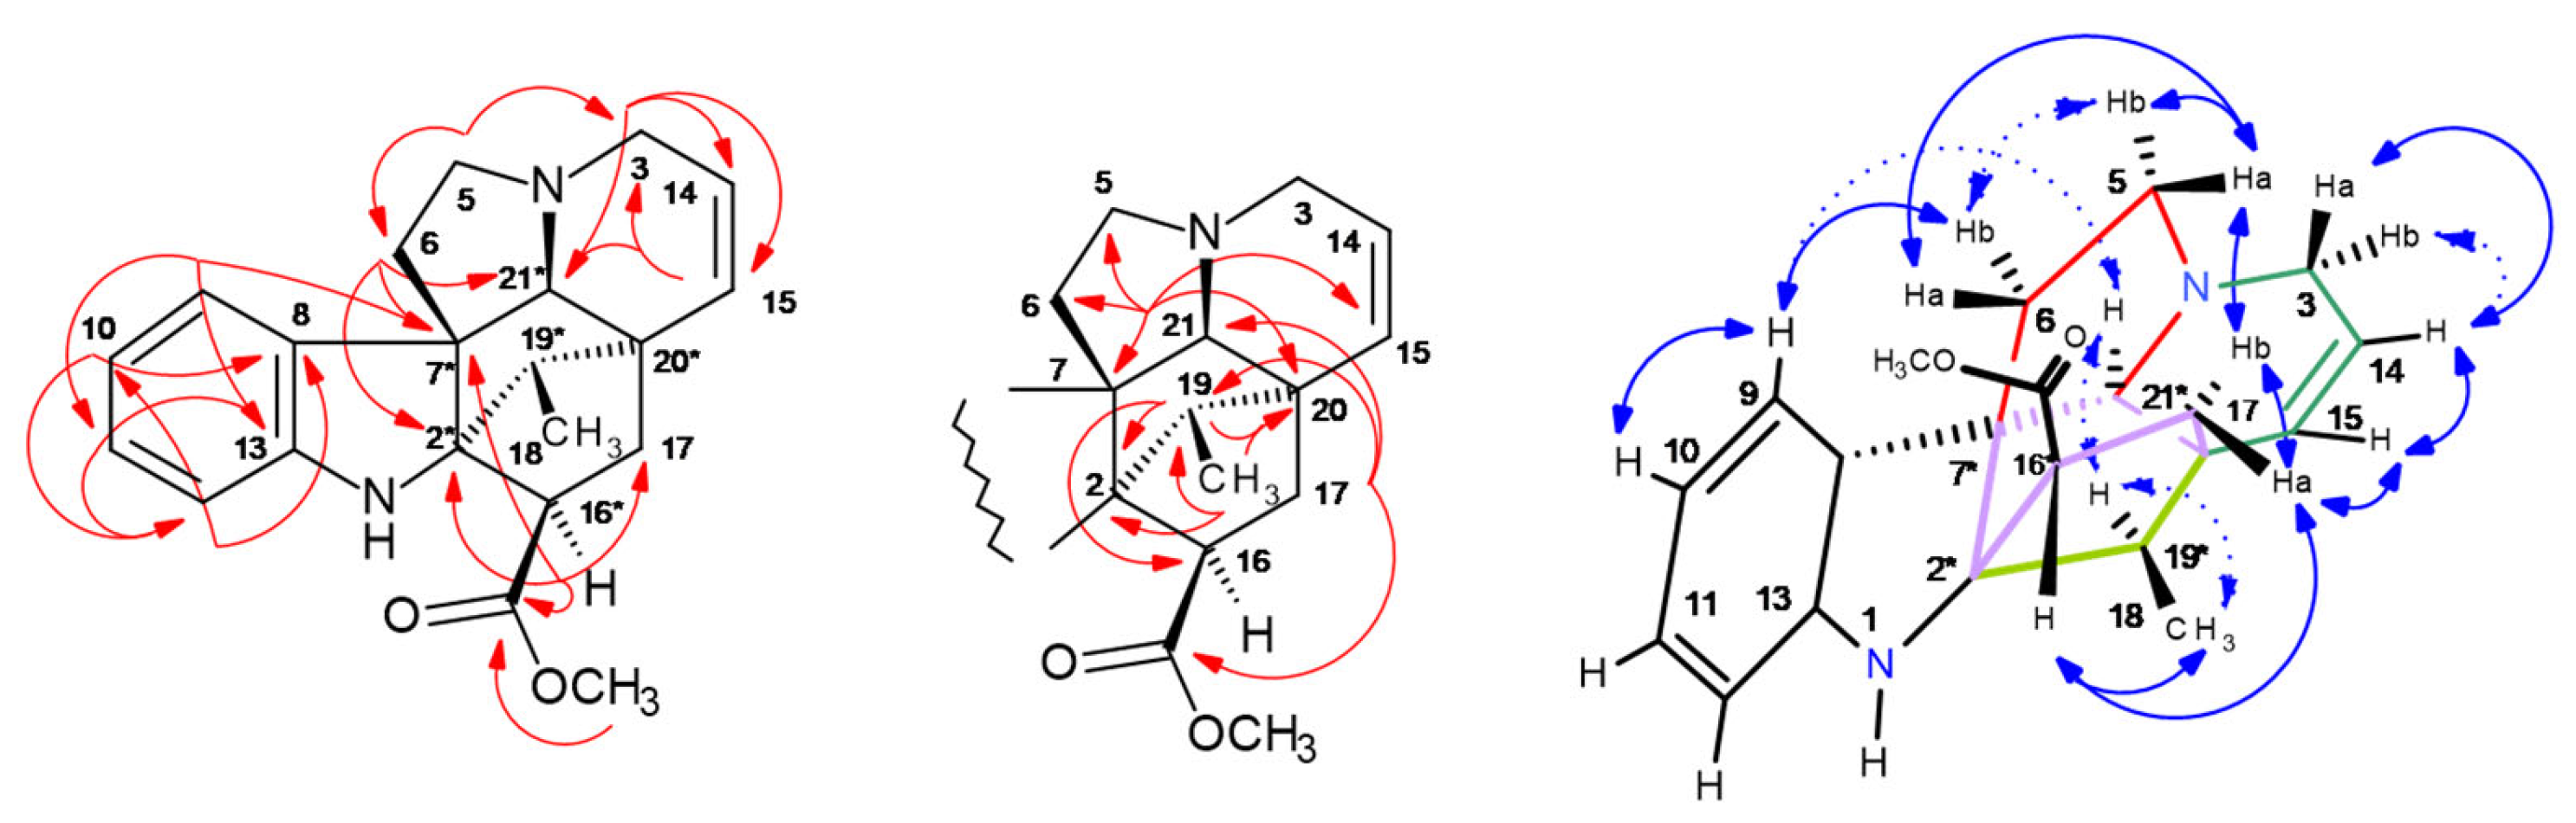
2.5.6. 19R-Vindolinine (337-b): [M + H]+, m/z 337

Vindolinine [33] was detected in the off-line ESI-MS/MS profiling of HPCCC fractions (t20–25, KD 0.68–1.00) by the single ion trace at m/z 337 at low retention volumes VR and KD values (0.68–1.00) (Figure 2) [29]; therefore, it acted as a quite polar compound in the reversed-phase operation mode (head-to-tail compared to the molecular weight isobar catharanthine recovered in the extrusion mode (cf. Section 2.5.3). In this fractionation section, several isobars with m/z 337 co-eluted and were later specifically detected by LC-ESI-MS/MS analysis (Figure 4). Results from the HPCCC/ESI-MS/MS profile already visualized that the fragment spectral data (base peak ions m/z 320, 305) were different from catharanthine (337-f) and indicated similar data to vindolinine or the 19S-epimer [34]. For cleanup, HPCCC fractions t23–t25 were selected based on ESI-MS profile data for preparative C18-HPLC and SiO2-CC and subsequent 1D/2D NMR analysis.
The 13C-/DEPT135-NMR detected 21 carbon atoms (four CH2, nine CH, two CH3, and six quaternary C). HSQC, HMBC, COSY, and NOESY experiments in CD3OD solvent resulted in structure 337-b (cf. Supplementary Table S1, Figure 12) and full chemical shift assignments. 2,3J-HC long-range correlations in the benzene ring deduced the indole system, and further cross-signals H-3/5/6/15/21 determined the hexa–hydro-indolizine partial structure (cf. Supplementary NMR Figure S7, Figure 12). The bicyclic skeleton bridge from C-2 to C-20 was seen by protons H-19 (δ 2.16 ppm) and 18-CH3 (δ 1.11 ppm) to C-2 (δ 82.8 ppm), further C-20 (δ 45.8 ppm). The singlet signal H-21 (δ 3.82 ppm) was in a bridgehead position, seeing the connectivities to C-5/6/7/15/20.
Vindolinine, containing six chiral centers (C-2, 7, 16, 19, 20, and 21), was described before by four diastereomers (19R, 19S, 16-epi-19R, and 16-epi-19S) [35]. For comparison of stereochemical properties, vindolinine was re-measured in CDCl3 (cf. Supplementary NMR Figure S8), whereby data for 19R-vindolinine matched more precisely.
19R-vindolinine stereochemistry was investigated (cf. Supplementary Table S1) by NOESY correlations. Also, in this particular case, indicative NOE effects were seen in two molecular planes (upper and lower, as displayed in Figure 12).
Consecutive NOE-seq. were seen from aromatic H-9 (δ 7.18 ppm) to H-6b → H-6a → H-17b → H-17a (characterized upper molecular field—bold arrows). Observation of correlations from H-17a (δ 2.06 ppm) to chiral H-16 and 18-CH3 confirmed the 19R-stereochemistry, as this methyl group would not be detectable by a NOE in a 19S-configuration of the methyl function in the bicyclic, and also the 16-epi-form was excluded as all protons (H-17a, H-16, and 18-CH3) were in very close spatial proximity. H-17a and 18-CH3 were detected from H-15 → H-14 → H-3a/b. The double bond proton H-15 (δ 6.47 ppm) was characterized by the sequence in the lower molecular field to H-19 → H-21 → H-9. The NOESY results completely corroborated the NMR assignments for 19R-vindolinine (337-b).

3. Materials and Methods

3.1. Plant Materials

The seedlings of Catharanthus roseus var. Nirvana Pink Blush were obtained from the ornamental plant grower ‘Gärtnerei Volk GmbH Pflanzenhandel’ (Braunschweig, Germany). The plant seedlings were planted in equal 0.5 L pots containing 330 g using a mixture of standard garden soil and sand (2:1) and grown outside from June to July 2015.

3.2. Reagents

For alkaloid extraction, double distilled water and trifluoroacetic acid (TFA) (Sigma-Aldrich Chemie GmbH, Deisenhofen, Germany) were used. Solvent systems for HPCCC separations were composed of HPLC-grade solvents, ultra-clean laboratory water (NANO pure Diamond Analytical, pore size 0.2 µm, Wilhelm Werner GmbH, Leverkusen, Germany), n-hexane (LC–MS-grade, Fisher Scientific, Loughborough, UK), n-butanol, chloroform, and NaOH (Carl Roth Chemicals, Karlsruhe, Germany).
Acetonitrile for LC-MS analysis and for the ESI-MS/MS off-line injection profile with make-up solvent mixture was mass-spectrometry grade (Honeywell Speciality Chemicals Seelze GmbH, Seelze, Germany), and propionic acid (Sigma-Aldrich Chemie GmbH, Deisenhofen, Germany) for the elimination of strong TFA ion signal suppression in mass spectrometry [36].
Solvent systems for preparative HPLC separations were composed of HPLC-grade solvents, ultra-clean laboratory water (Wilhelm Werner GmbH, Leverkusen, Germany), MeOH (LC–MS-grade, Fisher Scientific, Loughborough, UK), and TFA as an ion-pair reagent for HPCCC (Sigma-Aldrich Chemie GmbH, Deisenhofen, Germany). For semi-preparative silica gel column chromatography separation, dichloromethane, methanol, and n-hexane (LC–MS-grade, Fisher Scientific, Loughborough, UK) and ammonia solution (25%) (HPLC LiChropur, Merck, Darmstadt, Germany) were employed.
Solvents for NMR spectroscopy were CD3OD (99.95% D), CDCl3 (99.95% D), and C6D6 (99.95%) from Deutero GmbH (Kastellaun, Germany) and internal standard TMS (Sigma-Aldrich, Deisenhofen, Germany).

3.3. Preparation of Alkaloid-Enriched Extracts from the Aerial Plant of C. roseus

Aerial plant parts were harvested, shock-frozen in liquid nitrogen, and stored at −20 °C. After gentle lyophilization by freeze-drying, the dried tissue material was powdered by a bead mill instrument (Mixer Mill MM, Retsch, Hann, Germany) at a vibrational frequency of 25 Hz for 1 min. Furthermore, 125 g of dried powder was immersed in 2 L of water adjusted to pH 2 by TFA, homogenized by a T-25 digital Ultra-Turrax (IKA, Staufen i. Breisgau, Germany) at maximum speed (25,000 rpm for 10 min), and shaken overnight for extraction. Plant particles were centrifuged off (30 min, 8000 rpm) (Hermle Labortechnik GmbH, Wehingen, Germany). The acidic extract was lyophilized and yielded 23 g of dried extract that was re-dissolved in 1 L of chloroform. A 1 L solution of NaOH (100 mM, pH = 12.8) was added, and the mixture was vigorously mixed for alkaloid extraction. The phases were centrifuged (8000 rpm for 15 min), and the chloroform phase was dried by immersing the flask of chloroform phase in liquid nitrogen and freeze-drying overnight at −85 °C/1.0 mbar (model: Christ Beta 2–8 LD plus, Martin Christ Gefriertrocknungsanlagen GmbH, Osterode i. Harz, Germany) in −60 °C overnight for indole alkaloid (IA) recovery and resulted in 790 mg of an IA=fortified sample.

3.4. Solvent System Selection by Prediction of Partition Ratio KD Values in the Biphasic HPCCC Solvent System Phase Layers by LC-ESI-MS

The suitable biphasic HPCCC solvent system for the separation of C. roseus alkaloids was selected based on partition-ratio factor KD determination using selected single ion traces of targeted indole alkaloids (IAs) to assess the specific distributions in the biphasic phase layers, routinely measured by LC-ESI-MS analysis of aliquot volumes taken from the shake-flask experiments with the tested solvent systems [9] (cf. Figure 1). Exemplified, integration of one target selected ion trace delivers area counts (A) for the upper- and lower-layer concentrations, respectively. These are used for the KD-value equation (head-to-tail operation mode: KD = Area (upper layer)/Area (lower layer)). In general, KD values of target metabolites should range between 0.5 and 2.5 [11,19].
The procedure of solvent systems evaluation was performed in small shake flask experiments of the respective chosen HPCCC solvent systems by peak area integrations from LC-ESI-MS (cf. above).
For this KD-prediction purpose, 10 mg of the dried Catharanthus crude extract was added to the biphasic solvent systems and investigated in the shake-flask assays [5]. These systems consisted of three to four solvent components, with solvent system SoSy1 (n-hexane–n-butanol–water with 1:1:2, v/v/v and addition of 5.0 mL/L TFA), SoSy2 (n-hexane–n-butanol–water 1:1:2, v/v/v and some droplets of ammonia solution 25%), SoSy3 (n-hexane–methanol–ethanol–water 6:5:4:5, v/v/v/v), SoSy4 (n-hexane–ethyl acetate–methanol–water 3:7:5:5 v/v/v/v), SoSy5 (n-butanol–acetonitrile–water 4:1:5 v/v/v), and SoSy6 (n-hexane–ethanol–water 6:5:1 v/v/v). The most suitable solvent system was SoSy1, based on the determined target compound partition ratio values (cf. Figure 1, cf. Supplementary Figure S1).

3.5. Semi-Preparative Elution–Extrusion HPCCC and Peripheral Devices

Alkaloids from C. roseus were separated on a high-performance multilayer coil planet J-type HPCCC centrifuge (Spectrum, Dynamic Extractions, Gwent, UK) with two self-balanced coil bobbins and a ß-value range of 0.52–0.86 (equation: ß = coil radius r/revolution radius R) [19]. Two semi-preparative tube column systems (62.5 mL, 1.6 mm bore size i.d.) made of polytetrafluoroethylene (PTFE) were connected in series to yield a total coil column volume VC of 125 mL. The separation was performed in the head-to-tail (reversed phase) mode with the denser aqueous phase layer as the mobile phase using the evaluated solvent system SoSy1 (water–n-hexane–n-butanol 2:1:1, v/v/v with an addition of TFA 5.0 mL/L as the ion-pair reagent TFA) applying the elution–extrusion approach [20]. The head-end of the coil configuration was located at the periphery of the coils. The separation was performed at the machine’s maximum velocity of 1600 rpm (g-force level 243). The liquid cooling thermostat (RC6, Lauda Dr. Wobser GmbH & Co. KG, Lauda-Königshofen, Germany) connected to the HPCCC kept the operation temperature constantly at 25 °C using. After equilibration of the different solvent volumes in a 2.5 L separatory funnel, the two-phase layers were separated shortly before use. These freshly prepared solvent layers were pumped for the separation with a preparative LC pump (solvent delivery system, K-501, Knauer Wissenschaftliche Geräte GmbH, Berlin, Germany). The hydrodynamic equilibrium with the respective stationary phase retention—Sf—was determined at 1600 rpm and delivery of mobile phase at a flow rate of 5.0 mL/min.
For the calculation of Sf, the volume of mobile phase take-upVM—was determined (50 mL), which is equivalent to a stationary phase volume—vs. (75 mL) at the starting time of the HPCCC experiment, resulting in an Sf value of 60.0%. These values were corrected by the external volumes of the periphery tubings (7 mL) and led to a corrected Sf value of 65.6%.
The crude fortified IA crude sample (cf. alkaloid extract Section 3.3.) was injected after reaching the hydrodynamic equilibrium of the HPCCC columns.
The fortified indole alkaloid extract (790 mg) sample was dissolved in 2.5 mL aliquot volumes of the two-phase layers of SoSy1, filtered over a Chromafil Xtra GF-100/25 fiberglass membrane disk filter (1 µm pore size, 25 mm i.d., Macherey & Nagel, Düren, Germany), and injected through a 5.0 mL sample loop to the separation column by a manual low-pressure sample injection valve (Rheodyne, Cotati, CA, USA).
UV single-wavelength detection was conducted at λ 254 nm with a K-2501 UV detector (Knauer Wissenschaftliche Geräte GmbH, Berlin, Germany). The fraction collector SuperFrac with type B racks (Pharmacia, Uppsala, Sweden) collected fractions during the elution and extrusion process in intervals of 1 min.
The elution mode of the HPCCC experiment was run until tube fraction 58 (Figure 2), equivalent to a switching volume VCM of 290 mL, and the respective KD value (3.01) to start the extrusion mode until fraction t93. The chromatographic scale was converted to a KD-based axis as described [22,23,24].
Aliquots of the collected HPCCC fractions of every fraction from elution and extrusion were directly filled, in the sequence of collection, into HPLC vials as preparation for the off-line metabolite elution profiling experiment. Furthermore, 100 μL of each fraction was transferred and diluted with 1.4 mL of methanol (LC-MS grade) and used for sequential ESI-MS/MS injections (cf. Section 3.6.1 and Section 3.6.2).

3.6. Off-Line ESI-MS/MS Injection Analysis for Semi-Preparative HPCCC Indole-Alkaloid Profiling

3.6.1. General Procedures

For target-guided detection monitoring of indole alkaloids separated by a semi-preparative HPCCC experiment, aliquot volumes from the recovered fractions from the elution and extrusion modes were injected off-line in the sequence of recovery to an ESI-MS/MS-IT mass spectrometer (HCT-Ultra ETD II, Bruker Daltonics, Bremen, Germany).
This approach projected the semi-preparative HPCCC separation by a mass-spectrometric profile using single ion traces of selected molecular weights (ESI positive ionization mode) and guided the accurate fractionation process of the indole alkaloids.
A programmable external autosampler system (AS-2000A, Merck-Hitachi, Tokyo, Japan) was used for the off-line ESI-MS profiling. The injected fractions were delivered to the MS device by a 1.5 m long capillary (peak tubing, 1/16 in. × 0.030 in.) by a classical binary HPLC pump (G1312A, 1100 Series, Agilent, Waldbronn, Germany) using a makeup solvent mixture (flow rate: 0.5 mL/min, H2O/ACN—50:50, v/v, and 1.0% propionic acid additive). Less volatile propionic acid was used instead of formic acid to compensate for the strong signal-quenching effects of residual TFA from the injected HPCCC samples. This polar makeup solvent was evaluated for effective transfer of indole alkaloids from the autosampler to the ESI-MS device to result in clear signal shapes with low width and a regular Gaussian bell shape (Figure 2). Intensity evaluations were performed by fast pre-injection experiments of selected fractions in order to determine correct injection volumes. Every fraction from the HPCCC runs (elution and extrusion mode) was sequentially injected, and data were collected in a single data file. The interval for re-occurring injections was 2 min. Every observed injection signal corresponded to one injected vial from the HPCCC experiments displaying the full molecular weight information of ionized compounds. Mass values of selected ion traces were annotated with different colors for better visual determination. Over the detected signals of one single mass, a so-called hull curve could be constructed to give an equivalent view to a full on-line HPCCC-ESI-MS hyphenation experiment. In total, for monitoring of elution and extrusion modes, 83 fractions were injected in the sequence of recovery.

3.6.2. ESI-MS/MS Parameter Settings

Off-Line ESI-MS/MS

The best sensitivity for indole alkaloid detection was seen for positive ionization mode, resulting solely in [M + H]+ quasi-molecular ion species. The scan range was set from m/z 100 to 2000, and rapid ‘Ultra’ mode (scan rate 26,000 m/z per sec.) was chosen. Drying gas nitrogen (flow rate 10.0 L/min, 320 °C), and nebulizer pressure was set to 60 psi.
Ionization voltage HV capillary was setto −3500 V; HV end plate was offset to −500 V; trap drive was set to 55.7; octopole RF amplitude was set to 187.1 Vpp; lens 2 was set to −60.0 V; Cap Ex was set to +115.0 V; max. accumulation time was set to 200 ms; averages were at 3 spectra; trap drive level at 100%; target mass range at m/z 500; compound stability at 80%; Smart ICC target at 100,000; and the functions of ICC charge control and the smart parameter settings were activated.
For the generation of auto-MS/MS data, the 7 most intense ion precursor signals were selected for MS/MS fragmentation at an amplitude of 1.0 V.

LC-ESI-MS/MS

For HPCCC solvent system evaluation and semi-quantitative assessment of target distribution in the phase layers, LC-ESI-MS/MS was used in the positive ESI-MS ionization mode. This method was also used for the analysis of specific HPCCC fractions to monitor the distribution of various unidentified isobars, e.g., [M + H]+ m/z 339, m/z 337, and m/z 323 (cf. Section 2.4).
LC-gradient conditions were as follows: A C18-HPLC column, ProntoSil C18Aq column (5 μm, 250 × 2.0 mm, Knauer, Berlin, Germany) with a flow rate of 0.25 mL/min, was used. Solvent A: nanopure water/formic acid 98:2 (v/v); solvent B: acetonitrile/formic acid 98:2 (v/v). Gradient conditions were as follows: 0 min (1% B), 20 min (20% B), 35 min (50% B), 45 min (100% B), 55 min (100% B), 60 min (1% B), and 65 min (1% B). ESI-MS-MS parameter settings were as follows: the drying gas of choice was nitrogen (flow 11.0 L/min, 350 °C) and the nebulizer pressure was set to 60 psi. ESI-MS/MS ionization parameters (pos. mode) were as follows: capillary at -3500 V, end plate offset at −500 V, capillary exit at +121 V, target mass range at m/z 500, compound stability at 100%, trap drive level at 100%, ICC target at 100,000, max. accumulation time at 200 ms, ICC charge control on, scan range at m/z 100–2000, threshold auto MS/MS at 10,000, and MS/MS at fragmentation amplitude at 1.0 V.

3.7. Drying of HPCCC Fractions for Preparative Clean-Up

Subsequent to the sampling process for the off-line injection ESI-MS/MS profile, all recovered HPCCC fractions from the elution and extrusion processes were gently dried with a SpeedVac Plus concentrator equipped with a rotor for the used fraction collector tubes (SC210A and refrigerated vapor trap RVT 400, Thermo Savant, Holbrook, NY, USA).

3.8. Calculation of KD Scale of HPCCC Experiment

The HPCCC time-dependent elution–extrusion scale from the ESI-MS injection profile (cf. Figure 2) was converted by the calculated elution or retention volumes VR into the respective partition ratio values KD. The conversion of CCC separation times into a KD-based scale delivers solvent-system-specific constants to compare experimental results generated on different CCC devices, such as during scale-up studies. Accurate calculation of appropriate KD values of the specifically detected metabolites of the HPCCC separation and stationary phase retention SF was corrected by the machine’s extra column volumes VExt (e.g., periphery tubings). The KD calculation workflow was described in detail by Tran et al. [23] and Grecco et al. [22].

3.9. Preparative RP18-HPLC

The selected HPCCC fractions were pooled on behalf of results from the off-line ESI-MS/MS profiling and TLC results and then re-chromatographed by preparative RP18-HPLC (Wellchrom K-1001, Knauer Gerätebau Berlin, Germany) using a C18 column (Prontosil C18Aq, 25 × 250 mm) and an isocratic flow rate of 4.5 mL/min (acetonitrile/water, 60:40 with 1% TFA). Alkaloids were monitored using a UV detector (Wellchrom K-2600, Knauer Gerätebau, Berlin, Germany) at λ 254, 280, and 300 nm (cf. separation scheme Supplementary Figure S10).

3.10. Open-Column (CC-SiO2) Separation and TLC Analysis

The amber-colored HPLC fractions were finally purified by SiO2 column chromatography (Merck, Darmstadt, Germany) using ethyl acetate/n-hexane/ethanol/25% aqueous ammonia (100/5/5/3) to yield pure alkaloids, detected by thin-layer chromatography (TLC) (SiO2 60 F254, Merck, Darmstadt, Germany) using this solvent system and visualization by alkaloid-sensitive Dragendorff spray reagent (cf. separation scheme in Supplementary Figure S10).

3.11. NMR

1D (1H, 13C, and DEPT135) and 2D NMR spectroscopy (HSQC phase-edited, HMBC, 1H/1H-COSY, and 1H/1H-NOESY) were recorded on a 300 MHz spectrometer (FT 300, Bruker Biospin, Rheinstetten, Germany) at ambient temperature (295K).
Chemical shifts in the 1H were referenced to TMS (δ: 0.00 ppm), and the 13C to the respective solvent signals (cf. Supplementary Table S1, Supplementary Figure S1). Samples were measured in CD3OD, CDCl3, and C6D6 (cf. Supplementary Figures S2–S9).

4. Conclusions

In the present study, on indole alkaloid recovery from a Catharanthus roseus crude extract, all-liquid countercurrent chromatography (HPCCC) separation was applied and combined with mass-spectrometric guided off-line ESI-MS/MS target profiling. This approach was an effective and powerful hyphenation to fractionate and trace IAs in a semi-preparative process of 790 mg of fortified extract and finally led to six purified compounds, i.e., (19R)-vindolinine, akuammicine, perivine, catharanthine, vindoline, and vindorosine. These recovered IAs were fully elucidated and confirmed by 1D/2D NMR experiments.
The principal aim of sensitive ESI-MS/MS monitoring was to generate a molecular weight profile of IAs and visualize the chromatography on the basis of mass values covering the complete HPCCC separation process for the sections of elution and extrusion modes. Therefore, unintentional mixing of already purified metabolites by false pooling of fractions was prevented, and exact ranges of chromatographic co-elution regions were determined using selected single ion traces and were expressed by partition-ratio values. Target fractions were clearly identified, as well as unknown or very minor concentrated isobaric metabolites. The diverse distributed recovery ranges on HPCCC of molecular weight isobars, e.g., m/z 337, such as the pair—19R-vindolinine and catharanthine—were clearly traced. We propose that a further increase in the TFA ion-pair reagent concentration in the biphasic solvent system will positively influence the HPCCC resolution of target IAs in this study and might reduce the observed tailing effect of vindorosine.
The HPCCC separation appeared to be more efficient than preparative C18-HPLC, as this would have been problematic, as already analytical C18-LC retention time differences were rather small. Isobars of m/z 323 were nicely fractionated, and one major compound was cleaned to result in akuammicine. Also, the IA pair, vindoline (457) and vindorosine (427), were pre-fractionated by HPCCC, and this process compensated for difficulties of low retention time differences on preparative C18-HPLC. Chromatographic key values, such as compound-specific and also biphasic solvent-dependent partition ratio KD values, were determined and could be used as valuable separation parameters for future scale-up or optimization of the whole IA recovery process. The complexity of IAs in the C. roseus extract was enormously high; two further downstream purification steps were required and led to the pure and NMR-suitable samples.
Overall, the complementary separation characteristics of the all-liquid HPCCC technique and classic column chromatography in their combination resulted in an efficient workflow for IA purification. In our case, the mass-spectrometric profiling was conducted on semi-preparative HPCCC scale but could easily be used to work in a process of larger laboratory CCC or centrifugal partition chromatography (CPC) recovery scales [22]. Also, IA dimers of Catharanthus with strong anti-tumor activity, such as vincristine, were detected by the off-line ESI-MS monitoring process in respective HPCCC fractions. However, as very minor concentrated compound fractions resulted, a further cleanup to recover amounts (mg) for NMR failed. The respective KD values were determined and could be used directly for high-load preparative recovery CCC studies, although this would require larger IA concentrations to perform a reasonable scale-up for recovery of vincristine and vinblastine, still being a very important part of the portfolio of treatments of modern anti-tumor therapy. Overall, the monomeric IA precursors currently being used for the semi-synthesis of vincristine and vinblastine could be effectively recovered by all-liquid HPCCC methods.

Supplementary Materials

The following supporting information can be downloaded at: https://www.mdpi.com/article/10.3390/molecules30102115/s1. Figure S1: Solvent system evaluation SoSy 2–6. Figures S2–S9 (NMR S2–S9): 1D/2D NMR original spectral data. Figure S10: Chromatography separation scheme of IAs. Table S1: Compiled 1D/2D NMR data of recovered and elucidated IAs.

Author Contributions

M.Y. and G.J. designed the experiments; M.Y. and G.J. conducted chromatographic separations (HPCCC and solid-phase CC); G.J. recorded NMR and ESI-MS data; M.Y. and G.J. used software tools for NMR and MS data analysis; M.Y. and G.J. performed data visualization and curation; M.Y. planted and harvested C. roseus; M.Y. and G.J. performed writing—original draft preparation; M.Y., D.S., and G.J. performed reviewing and editing; M.Y. and D.S. were responsible for project administration. All authors have read and agreed to the published version of the manuscript.

Funding

This research received no external funding.

Institutional Review Board Statement

Not applicable.

Informed Consent Statement

Not applicable.

Data Availability Statement

Original data files are available and access to them can be requested.

Acknowledgments

We gratefully acknowledged the access to analytical machine infrastructure at the Institute of Food Chemistry (head of department: Peter Winterhalter).

Conflicts of Interest

The authors declare no conflicts of interest.

Abbreviations

HPCCCHigh-performance countercurrent chromatography
CPCCentrifugal partition chromatography
TLCThin-layer chromatography
LC-ESI-MSLiquid chromatography–electrospray–mass-spectrometry
IAs Indole alkaloids
NMRNuclear magnetic resonance spectroscopy
DEPT135Distortionless enhancement by polarization transfer
HSQCHetero single-quantum transfer
HMBCHetero multiple-bond correlation
COSYCorrelation spectroscopy
NOESYNuclear Overhauser-effect spectroscopy

References

  1. Boiteau, P.; Allorge-Boiteau, L. Plantes Médicinales de Madagascar: Cinquante-Huit Plantes Médicinales Utilisées Sur Le Marché de Tananarive (Zoma) à Madagascar; KARTHALA Editions: Paris, France, 1993; pp. 1–135. [Google Scholar]
  2. Tariq Afta, M.N.; Khan, M.M.A. Catharanthus roseus—Current Research and Future Prospects; Springer: Cham, Switzerland, 2017; pp. 1–424. [Google Scholar]
  3. Van der Heijden, R.; Jacobs, D.I.; Snoeijer, W.; Hallard, D.; Verpoorte, R. The Catharanthus alkaloids: Pharmacognosy and biotechnology. Curr. Med. Chem. 2004, 11, 607–628. [Google Scholar] [CrossRef] [PubMed]
  4. Almagro, L.; Fernández-Pérez, F.; Pedreño, M.A. Indole alkaloids from Catharanthus roseus: Bioproduction and their effect on human health. Molecules 2015, 20, 2973–3000. [Google Scholar] [CrossRef] [PubMed]
  5. Buckingham, J.; Baggaley, K.H.; Roberts, A.D.; Szabo, L.F. Dictionary of Alkaloids, 2nd ed.; CRC Press: Boca Raton, FL, USA, 2010; pp. 1–2374. [Google Scholar]
  6. Cannell, R.J.P. James McAlpine, Separation by high-speed countercurrent chromatography. In Methods in Biotechnology 4:  Natural Products Isolation; Humana Press: Totowa, NJ, USA, 1998; pp. 247–259. [Google Scholar]
  7. Berthod, A. Separation and purification of natural products (medicinal herbs) by high-speed countercurrent chromatography. In Countercurrent Chromatography—The Support-Free Liquid Stationary Phase; Barcelo, D., Ed.; Elsevier: Amsterdam, The Netherlands, 2002; Chapter 8; Volume 38, pp. 201–260. [Google Scholar]
  8. Marston, A.; Hostettmann, K. Developments in the application of counter-current chromatography to plant analysis. J. Chromatogr. A 2006, 1112, 181–194. [Google Scholar] [CrossRef]
  9. Ito, Y. Golden rules and pitfalls in selecting optimum conditions for high-speed counter-current chromatography. J. Chromatogr. A 2005, 1065, 145–168. [Google Scholar] [CrossRef] [PubMed]
  10. Pauli, G.F.; Pro, S.M.; Friesen, J.B. Countercurrent separation of natural products. J. Nat. Prod. 2008, 71, 1489–1508. [Google Scholar] [CrossRef]
  11. Ito, Y.; Conway, W.D. High-speed countercurrent chromatography. CRC Crit. Rev. Anal. Chem. 1986, 17, 65–143. [Google Scholar] [CrossRef]
  12. Conway, W.D.; Petroski, R.J. Modern Countercurrent Chromatography. Conway, W.D., Petroski, R.J., Eds.; American Chemical Society: Washington, DC, USA, 1995; pp. 1–238. [Google Scholar]
  13. Sutherland, I.; Ignatova, S.; Hewitson, P.; Janaway, L.; Wood, P.; Edwards, N.; Harris, G.; Guzlek, H.; Keay, D.; Freebairn, K.; et al. Scalable technology for the extraction of pharmaceutics (STEP): The transition from academic knowhow to industrial reality. J. Chromatogr. A 2011, 1218, 6114–6121. [Google Scholar] [CrossRef]
  14. Yuan, Y.; Wang, B.; Chen, L.; Luo, H.; Fisher, D.; Sutherland, I.A.; Wei, Y. How to realize the linear scale-up process for rapid purification using high-performance counter-current chromatography. J. Chromatogr. A 2008, 1194, 192–198. [Google Scholar] [CrossRef]
  15. das Neves Costa, F.; Neves Vieira, M.; Garrard, I.; Hewitson, P.; Jerz, G.; Guimarães Leitão, G.; Ignatova, S. Schinus terebinthifolius countercurrent chromatography (Part II): Intra-apparatus scale-up and inter-apparatus method transfer. J. Chromatogr. A 2016, 1466, 76–83. [Google Scholar] [CrossRef]
  16. Renault, J.-H.; Nuzillard, J.-M.; Le Crouérour, G.; Thépenier, P.; Zèches-Hanrot, M.; Le Men-Olivier, L. Isolation of indole alkaloids from Catharanthus roseus by centrifugal partition chromatography in the pH-zone refining mode. J. Chromatogr. A 1999, 849, 421–431. [Google Scholar] [CrossRef]
  17. Kotland, A.; Chollet, S.; Diard, C.; Autret, J.-M.; Meucci, J.; Renault, J.-H.; Marchal, L. Industrial case study on alkaloids purification by pH-zone refining centrifugal partition chromatography, J. Chromatogr. A 2016, 1474, 59–70. [Google Scholar] [CrossRef]
  18. Ito, Y. pH-zone-refining counter-current chromatography: Origin, mechanism, procedure and applications. J. Chromatogr. A 2013, 1271, 71–85. [Google Scholar] [CrossRef] [PubMed]
  19. Friesen, B.J.; Pauli, G.F. GUESS—A Generally Useful Estimate of Solvent Systems for CCC. J. Liq. Chromatogr. Relat. Technol. 2005, 28, 2777–2806. [Google Scholar] [CrossRef]
  20. Berthod, A.; Ruiz-Angel, M.J.; Carda-Broch, S. Elution-extrusion countercurrent chromatography. Use of the liquid nature of the stationary phase to extend the hydrophobicity window. Anal. Chem. 2003, 75, 5886–5894. [Google Scholar] [CrossRef] [PubMed]
  21. Jerz, G.; Elnakady, Y.A.; Braun, A.; Jäckel, K.; Sasse, F.; Al Ghamdi, A.A.; Omar, M.O.M.; Winterhalter, P. Preparative mass-spectrometry profiling of bioactive metabolites in Saudi-Arabian propolis fractionated by high-speed countercurrent chromatography and off-line atmospheric pressure chemical ionization mass-spectrometry injection. J. Chromatogr. A 2014, 1347, 17–29. [Google Scholar] [CrossRef]
  22. Grecco, S.S.; Letsyo, E.; Tempone, A.G.; Ghilardi Lago, J.H.; Jerz, G. Electrospray mass-spectrometry guided target isolation of neolignans from Nectandra leucantha (Lauraceae) by high performance- and spiral-coil countercurrent chromatography. J. Chromatogr. A 2019, 1608, 460422. [Google Scholar] [CrossRef]
  23. Thi Tran, T.M.; Nguyen Thanh, B.; Moussa-Ayoub, T.E.; Rohn, S.; Jerz, G. Profiling of polar metabolites in fruits of Opuntia stricta var. dillenii by ion-pair high-performance countercurrent chromatography and off-line electrospray mass-spectrometry injection. J. Chromatogr. A 2019, 1601, 274–287. [Google Scholar]
  24. Surup, F.; Thi Tran, T.M.; Pfütze, S.; Budde, J.; Moussa-Ayoub, T.E.; Rohn, S.; Jerz, G. Opuntisines, 14-membered cyclopeptide alkaloids from fruits of Opuntia stricta var. dillenii isolated by high-performance countercurrent chromatography. Food Chem. 2021, 334, 127552. [Google Scholar]
  25. Ishikawa, H.; Elliot, G.I.; Velcicky, J.; Choi, Y.; Boger, D.L. Total Synthesis of (−)- and ent-(+)-Vindoline and Related Alkaloids. J. Am. Chem. Soc. 2006, 128, 10596–10612. [Google Scholar] [CrossRef]
  26. Ruszkowska, J.; Chrobak, R.; Maurin, J.K.; Czarnocki, Z. Vindoline and 16-demethoxyvindoline: Two Catharanthus-derived alkaloids. Acta Cryst. 2004, C60, o377–o380. [Google Scholar] [CrossRef]
  27. Wenkert, E.; Cochran, D.W.; Hagaman, E.W.; Schell, F.M.; Neuss, N.; Katner, A.S.; Potier, P.; Kan, C.; Plat, M.; Koch, M.; et al. Carbon-13 nuclear magnetic resonance spectroscopy of naturally occurring substances. XIX. Aspidosperma alkaloids. J. Am. Chem. Soc. 1973, 95, 4990–4995. [Google Scholar] [CrossRef] [PubMed]
  28. Zhou, H.; Tai, Y.; Sun, C.; Pan, Y. Rapid identification of Vinca alkaloids by direct-injection electrospray ionisation tandem mass spectrometry and confirmation by high-performance liquid chromatography–mass spectrometry. Phytochem. Anal. 2005, 16, 328–333. [Google Scholar] [CrossRef] [PubMed]
  29. Moncrief, J.W.; Lipscomb, W.N.J. Structures of leurocristine (vincristine) and vincaleukoblastine. X-ray analysis of leurocristine methiodide. J. Am. Chem. Soc. 1965, 87, 4963–4964. [Google Scholar] [CrossRef]
  30. Kumar, S.; Bajpai, V.; Singh, A.; Kumar, B. Identification, characterization and distribution of terpene indole alkaloids in ethanolic extracts of Catharanthus roseus using high-performance liquid chromatography/electrospray ionization quadrupole time-of-flight tandem mass spectrometry and the study of their geographical variation. Rapid Commun. Mass Spectrom. 2018, 32, 319–332. [Google Scholar]
  31. Balsevich, J.; Hogge, L.R.; Berry, A.J.; Games, D.E.; Mylchreest, I.C. Analysis of indole alkaloids from leaves of Catharanthus roseus by means of supercritical fluid chromatography/mass spectrometry. J. Nat. Prod. 1988, 51, 1173–1177. [Google Scholar] [CrossRef]
  32. Yahyazadeh, M.; Jerz, G.; Selmar, D.; Winterhalter, P.; Jones, P. Crystal structure of akuammicine, an indole alkaloid from Catharanthus roseus. Acta Cryst. Sect. E 2017, E73, 1658–1661. [Google Scholar] [CrossRef] [PubMed]
  33. Ahond, A.; Janot, M.-M.; Langlois, N.; Lukacs, G.; Potier, P.; Rasoanaivo, P.; Sangare, M.; Neuss, N.; Plat, M.; Men, J.L.; et al. On the structure of vindolinine. J. Am. Chem. Soc. 1974, 96, 633–634. [Google Scholar] [CrossRef]
  34. He, L.; Yang, L.; Tan, R.; Zhao, S.; Hu, Z. Enhancement of vindoline production in suspension culture of the Catharanthus roseus cell line C20hi by light and methyl jasmonate elicitation. Anal. Sci. 2011, 27, 1243–1248. [Google Scholar] [CrossRef]
  35. Ur-Rahman, A.; Bashir, M.; Kaleem, S.; Fatima, T. 16-Epi-19S-vindolinine, Catharanthus roseus. Phytochemistry 1983, 22, 1021–1023. [Google Scholar] [CrossRef]
  36. Keever, J.; Voyksner, R.D.; Tyczkowska, K.L. Quantitative determination of ceftiofur in milk by liquid chromatography–electrospray mass spectrometry. J. Chromatogr. A 1998, 794, 57–62. [Google Scholar] [CrossRef]
Figure 1. HPCCC solvent system evaluation of SoSy 1 (n-hexane/n-butanol/aqueous 0.5% TFA) by LC-ESI-MS (pos. ion mode) for principal IAs of C. roseus. Bold line: compound concentration in upper (stationary) phase; dashed line: concentration in lower (mobile) phase. Monitoring of selected single ion traces of ajmalicine (m/z 353), perivine isobars 339-a/b (m/z 339), vindoline (m/z 457,) vindorosine (m/z 427), akuammicine (m/z 323), and molecular weight isobars 337-a to 337-d.
Molecules 30 02115 g001
Figure 3. HPCCC off-line ESI-MS/MS injection profiling (m/z 100–2000) of low-concentrated indole alkaloid dimers (positive ionization mode): vincristine, vinblastine (low intensity, no MS/MS), catharine, catharanthamine, and vingramine. The blue doted line indicate the start of the extrusion-mode—switch volume VCM (290 mL) with late detection of IA-dimers m/z 823 and m/z 793 in the HPCCC experiment.
Molecules 30 02115 g003
Figure 4. LC-ESI-MS monitoring of m/z 337 isobars in HPCCC fractions.
Molecules 30 02115 g004
Figure 5. LC-ESI-MS monitoring of m/z 339 isobars in HPCCC fractions.
Molecules 30 02115 g005
Figure 6. LC-ESI-MS monitoring of m/z 323 isobars in HPCCC fractions.
Molecules 30 02115 g006
Figure 7. 2,3J-HC long-range correlations (HMBC) (red color), and 1H/1H-NOESY of vindorosine (427) (blue).
Molecules 30 02115 g007
Figure 8. 2,3J-HC long-range correlations (HMBC) (red color), and 1H/1H-NOESY of vindoline (457) (blue) with upper plane in bold arrows. Asterix * for chiral centers.
Molecules 30 02115 g008
Figure 9. 2,3J-HC long-range correlations (HMBC) (red color) and 1H/1H-NOESY of catharanthine (337-f) (blue) with upper plane in bold arrows. Asterix * for chiral centers.
Molecules 30 02115 g009
Figure 10. 2,3J-HC long-range correlations (HMBC) (red color) and 1H/1H-NOESY of perivine (339-a) (blue) with upper plane in bold arrows. Asterix * for chiral centers.
Molecules 30 02115 g010
Figure 11. 2,3J-HC long-range correlations (HMBC) (red color), and 1H/1H-NOESY of akuammicine (323-j) (blue) with upper plane in bold arrows. Asterix * for chiral centers.
Molecules 30 02115 g011
Figure 12. 2,3J-HC long-range correlations (HMBC) (red color) and 1H/1H-NOESY of 19R-vindolinine (337-b) (blue) with upper plane in bold arrows. Asterix * for chiral centers.
Molecules 30 02115 g012
Table 1. IA-elution sequence (IA1 to IA6) on HPCCC (head-to-tail mode) based on functional groups (specific formulas of IAs cf. Section 2.5).
119R-Vindolinine (337-b)-NH-COOCH3
2Vindoline (457)-N-CH3-COOCH3-OH-OAc-CH2-CH3
3Perivine (339-a)-NH-COOCH3 -CH2-CH3
4Vindorosine (427)-N-CH3-COOCH3-OH-OAc-CH2-CH3-O-CH3
5Akuammicine (323-j)-NH-COOCH3
6Catharanthine (337-f)-NH-CO-OH-OAc-CH2-CH3
Disclaimer/Publisher’s Note: The statements, opinions and data contained in all publications are solely those of the individual author(s) and contributor(s) and not of MDPI and/or the editor(s). MDPI and/or the editor(s) disclaim responsibility for any injury to people or property resulting from any ideas, methods, instructions or products referred to in the content.

