
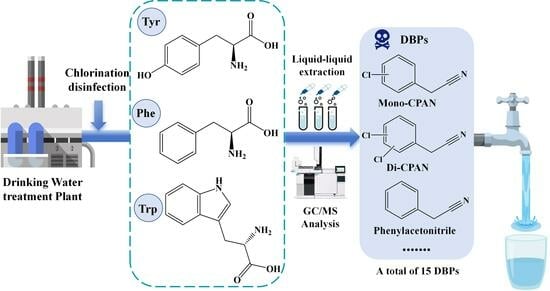
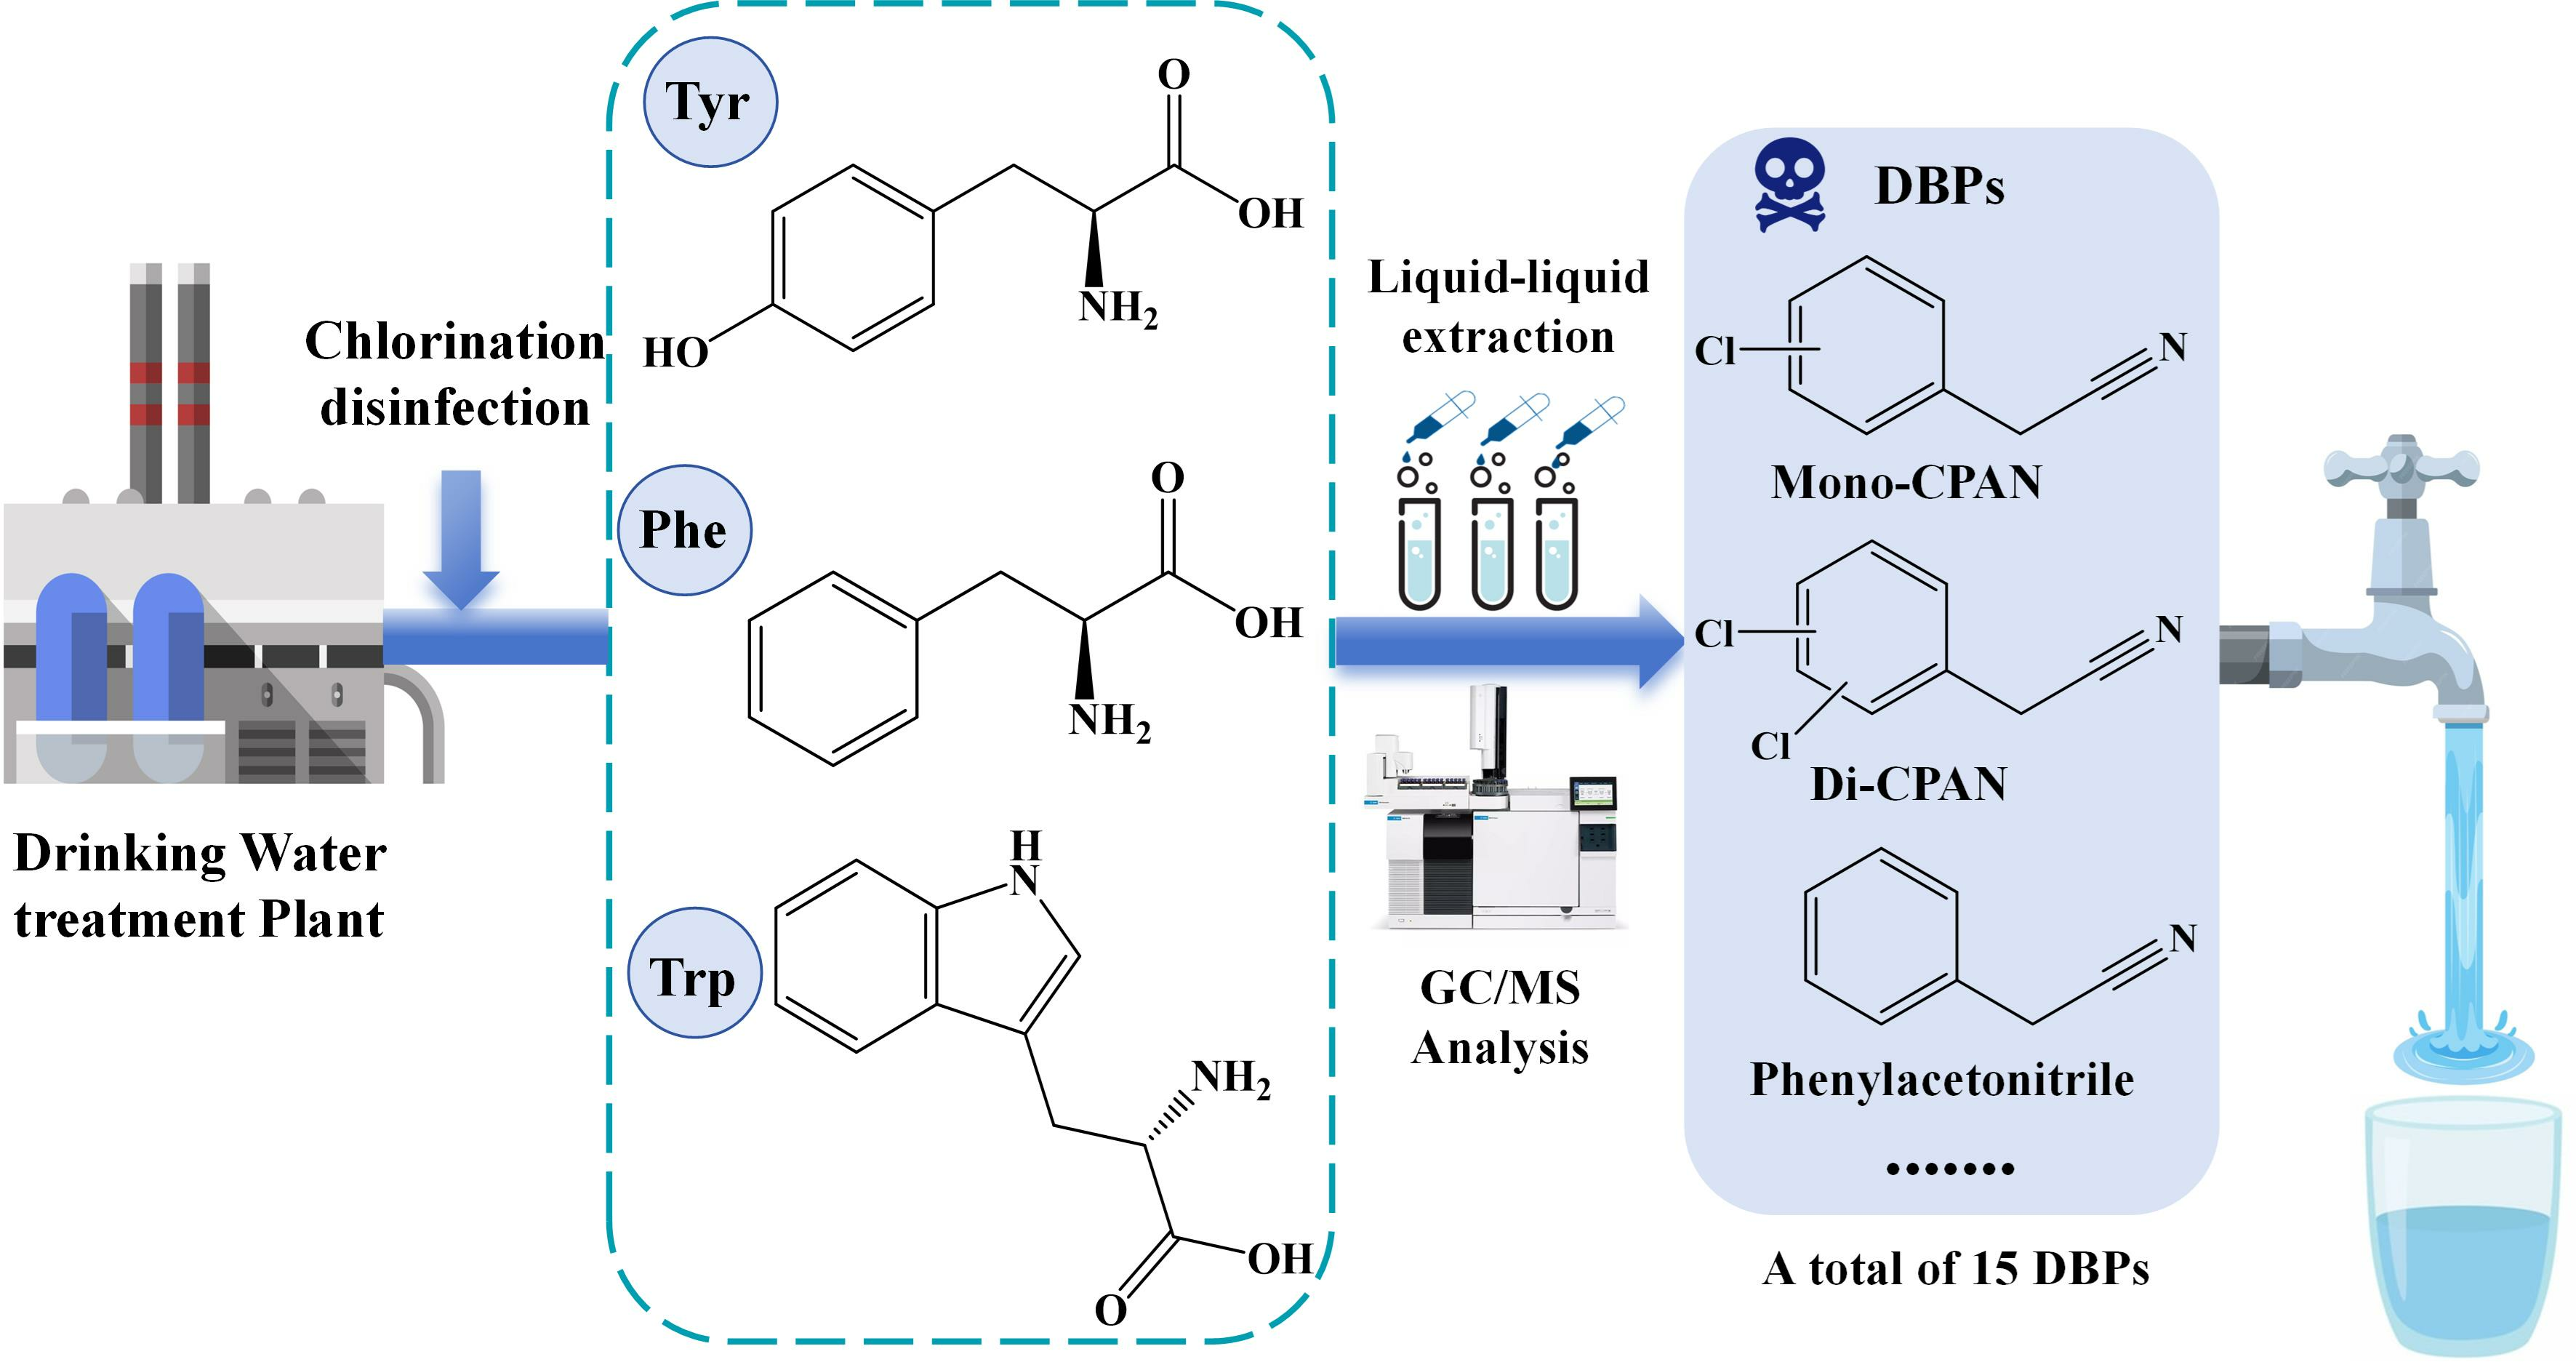
Chlorination of Aromatic Amino Acids: Elucidating Disinfection Byproducts, Reaction Kinetics, and Influence Factors

 , , ,
, , ,
Abstract
1. Introduction
2. Results and Discussion
2.1. Identification of the Chlorination DBPs of Three Aromatic AAs
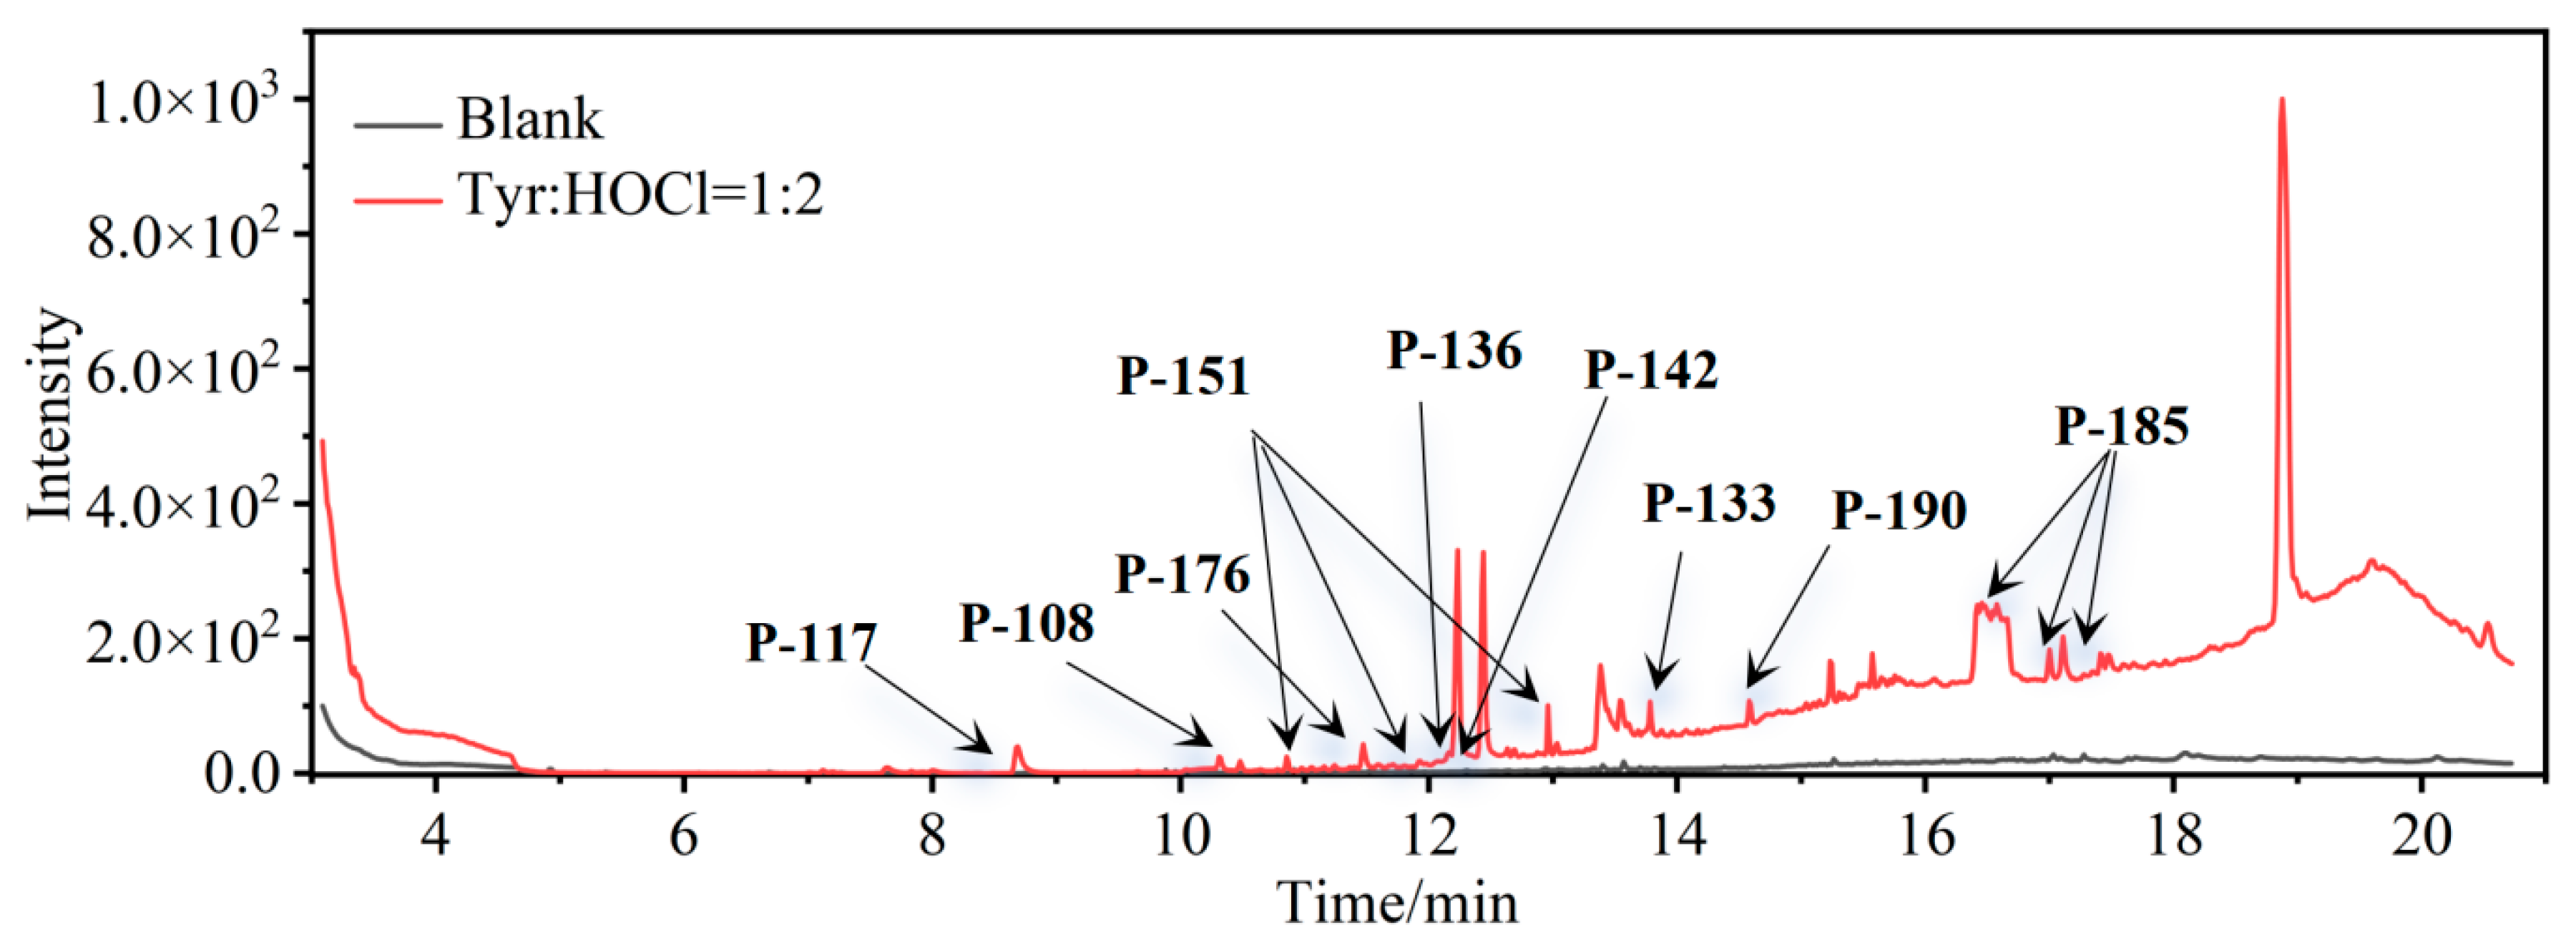
2.1.1. DBPs of Tyr Chlorination
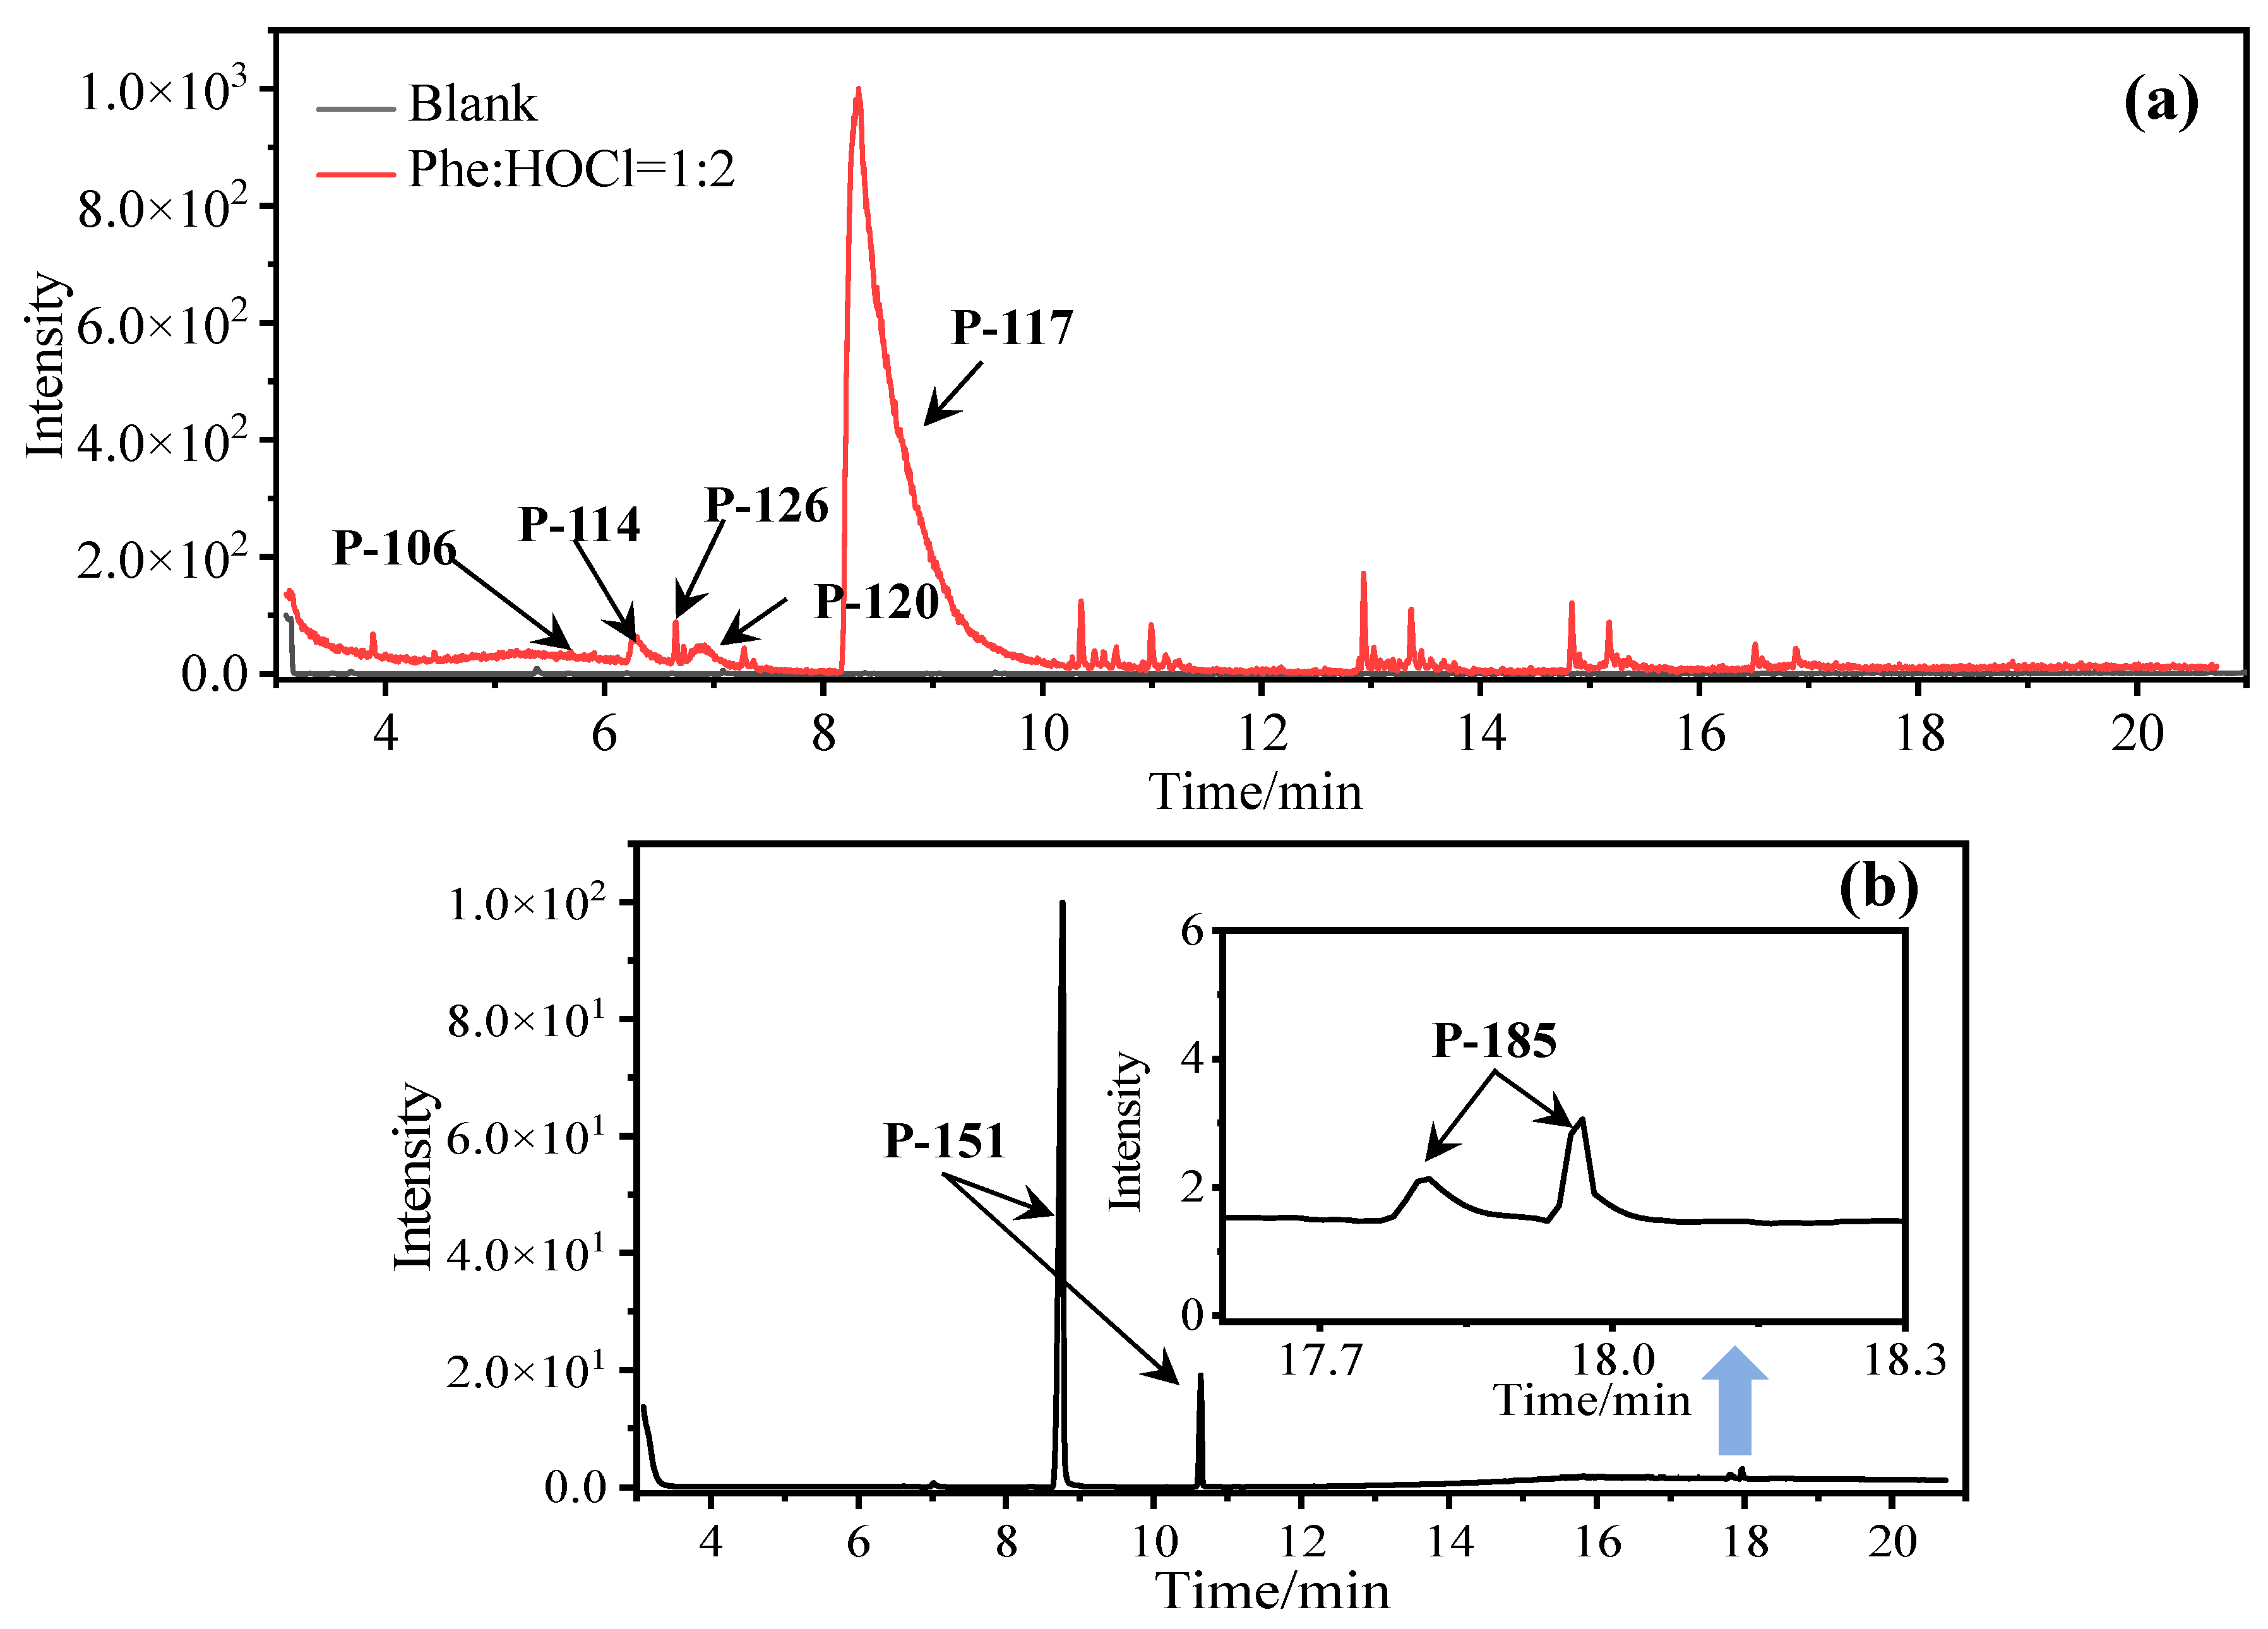
2.1.2. DBPs of Phe Chlorination
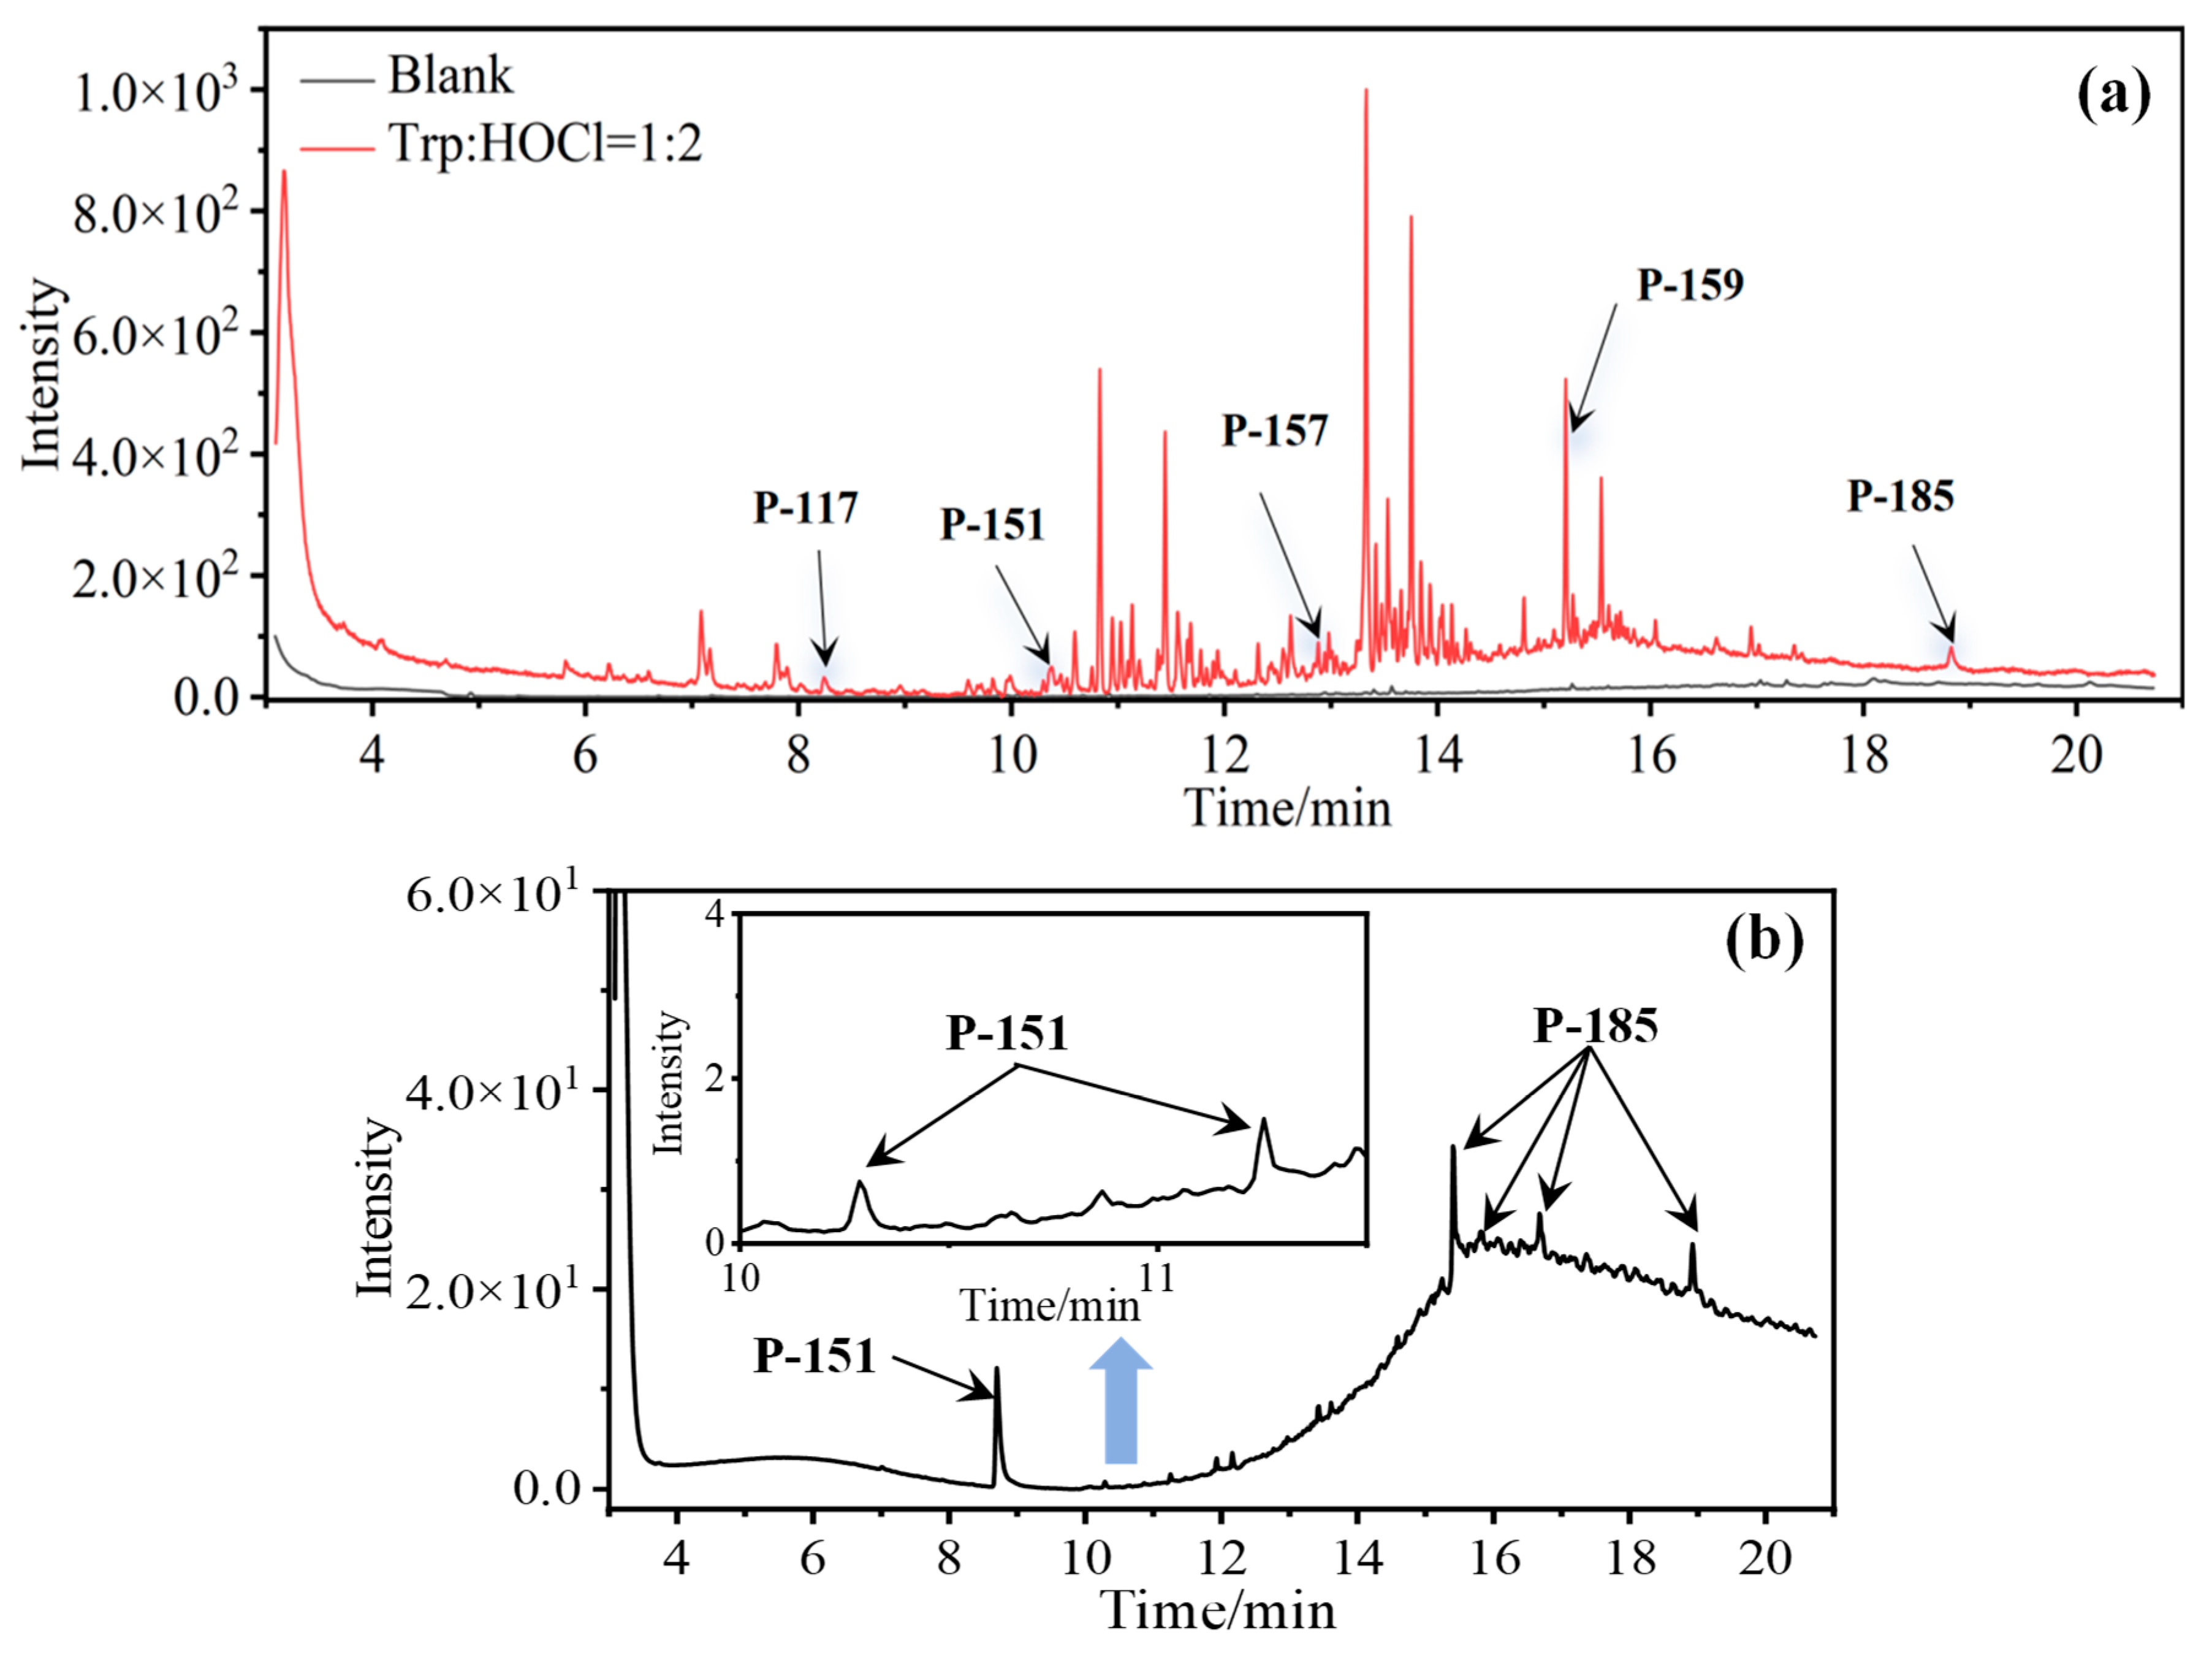
2.1.3. DBPs of Trp Chlorination
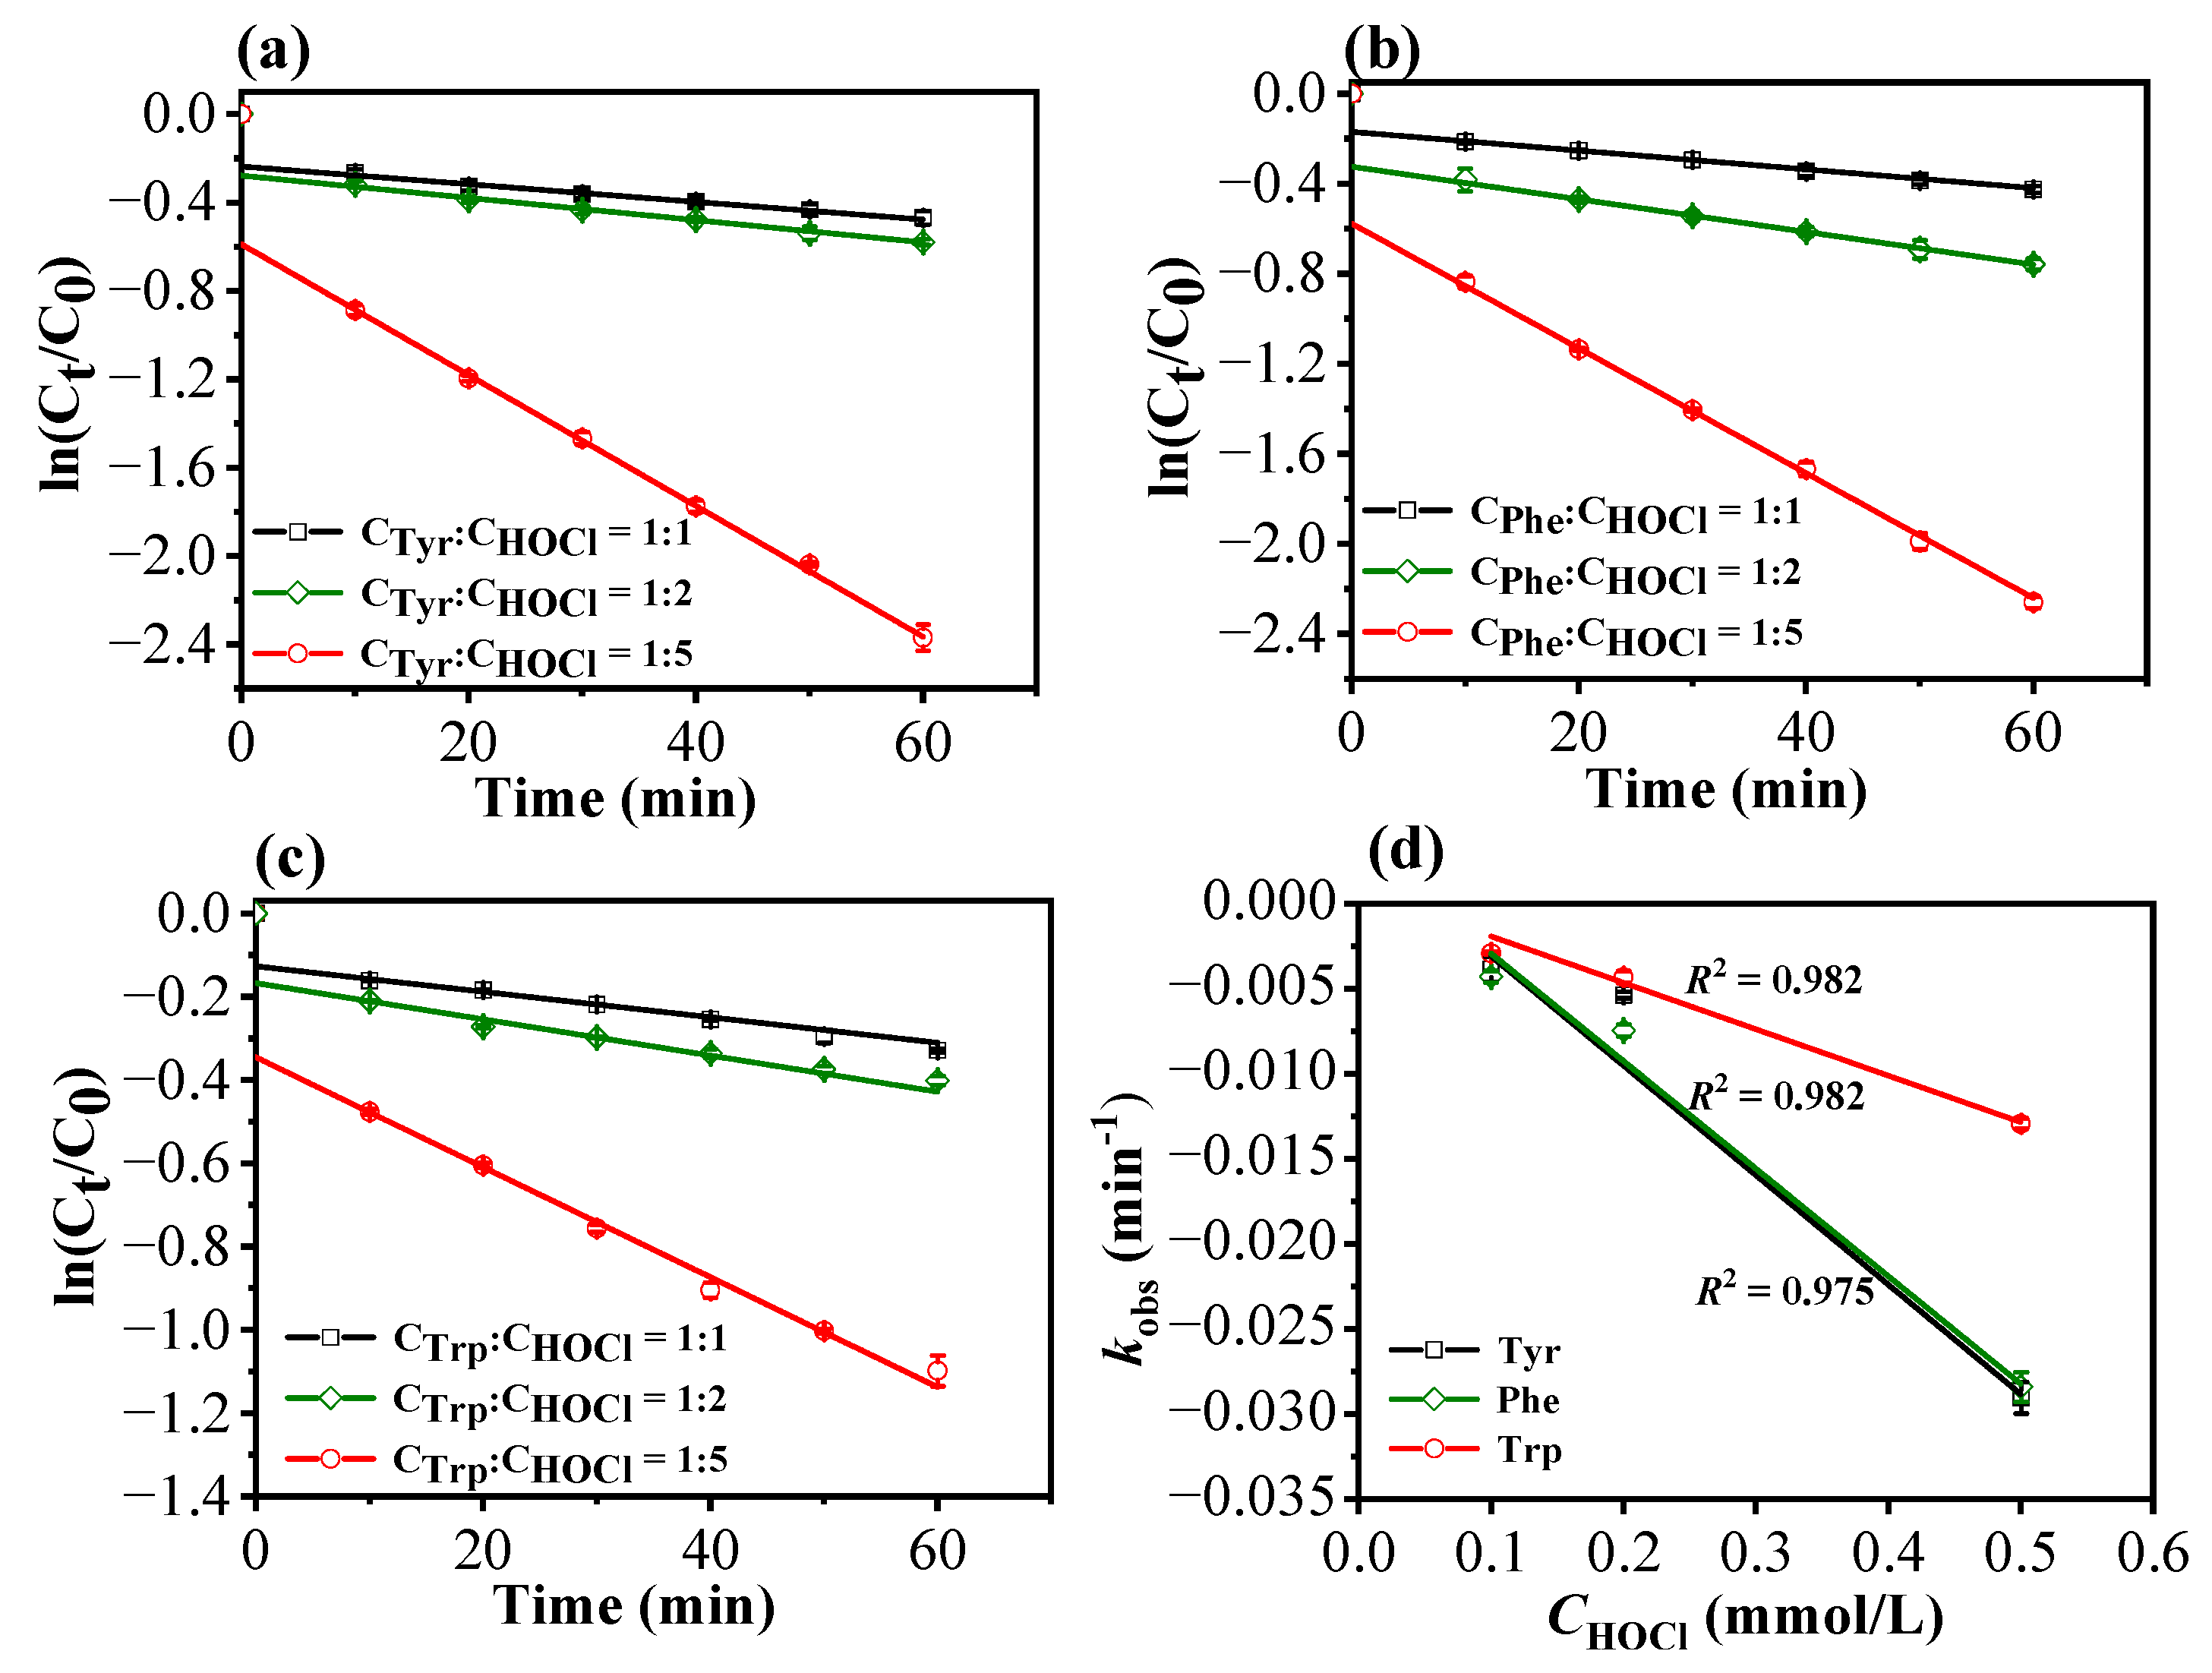
2.2. Kinetics of Chlorination for Three Aromatic AAs
2.2.1. Kinetics of Chlorination Reactions at Various Available Chlorine Concentrations
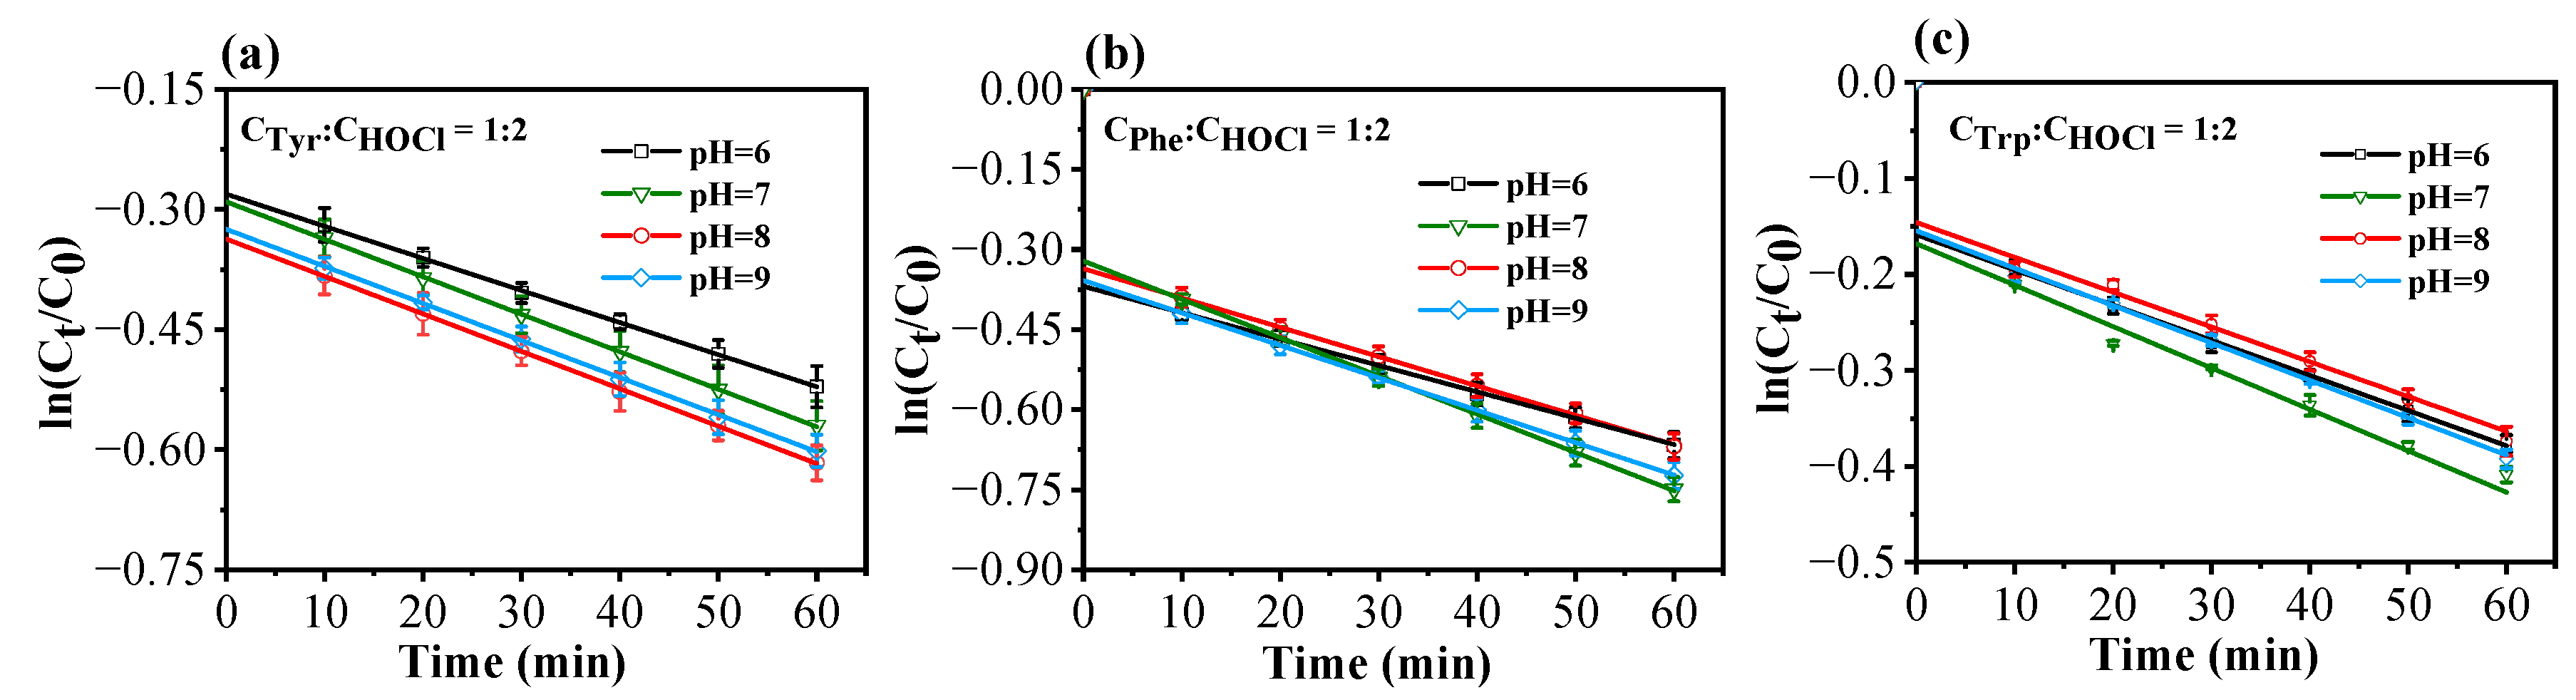
2.2.2. Kinetics of Chlorination Reactions at Various pH Levels
3. Materials and Methods
3.1. Chemicals
3.2. Experimental Procedures
3.2.1. Experiments on Chlorination of Tyr, Phe, and Trp
3.2.2. Kinetics of the Chlorination Reaction of Tyr, Phe, and Trp
3.3. Instrument Conditions and Analysis Methods
4. Conclusions
Author Contributions
Funding
Institutional Review Board Statement
Informed Consent Statement
Data Availability Statement
Conflicts of Interest
References
- Uyak, V.; Ozdemir, K.; Toroz, I. Seasonal variations of disinfection by-product precursors profile and their removal through surface water treatment plants. Environ. Sci. Technol. 2008, 390, 417–424. [Google Scholar] [CrossRef] [PubMed]
- Bolyard, M.; Fair, P.S.; Hautman, D.P. Occurrence of chlorate in hypochlorite solutions used for drinking water disinfection. Environ. Sci. Technol. 1992, 26, 1663–1665. [Google Scholar] [CrossRef]
- Scott, J.P.; Ollis, D.F. Integration of chemical and biological oxidation processes for water treatment: Review and recommendations. Environ. Prog. 1995, 14, 88–103. [Google Scholar] [CrossRef]
- Bakire, S.; Yang, X.Y.; Ma, G.C.; Wei, X.X.; Yu, H.Y.; Chen, J.R.; Lin, H.J. Developing predictive models for toxicity of organic chemicals to green algae based on mode of action. Chemosphere 2018, 190, 463–470. [Google Scholar] [CrossRef] [PubMed]
- Singer, P.C. Humic substances as precursors for potentially harmful disinfection by-products. Water Sci. Technol. 1999, 40, 25–30. [Google Scholar] [CrossRef]
- Bellar, T.A.; Lichtenberg, J.J.; Kroner, R.C. The occurrence of organohalides in chlorinated drinking waters. J. Am. Water Works Assoc. 1974, 66, 703–706. [Google Scholar] [CrossRef]
- Rook, J.J. Formation of haloforms during chlorination of natural waters. Water Treat. Exam. 1972, 23, 234–246. [Google Scholar]
- Costet, N.; Villanueva, C.; Jaakkola, J.; Kogevinas, M.; Cantor, K.P.; King, W.D.; Lynch, C.F.; Nieuwenhuijsen, M.J.; Cordier, S. Water disinfection by-products and bladder cancer: Is there a European specificity? A pooled and meta-analysis of European case–control studies. J. Occup. Environ. Med. 2011, 68, 379–385. [Google Scholar] [CrossRef] [PubMed]
- Manasfi, T.; De, M.M.; Di, G.C.; Coulomb, B.; Boudenne, J. Assessing the genotoxicity of two commonly occurring byproducts of water disinfection: Chloral hydrate and bromal hydrate. Mutat. Res.-Genetic. Toxicol. Environ. Mutagen. 2017, 813, 37–44. [Google Scholar] [CrossRef]
- Amin, M.M.; Hashemi, H.; Bovini, A.M. A review on wastewater disinfection. Int. J. Environ. Health Eng. 2013, 2, 22. [Google Scholar]
- Collivignarelli, M.C.; Abbà, A.; Benigna, I.; Sorlini, S.; Torretta, V. Overview of the Main Disinfection Processes for Wastewater and Drinking Water Treatment Plants. Sustainability 2018, 10, 86. [Google Scholar] [CrossRef]
- Zarrelli, A.; DellaGreca, M.; Parolisi, A.; Iesce, M.R.; Cermola, F.; Temussi, F.; Isidori, M.; Lavorgna, M.; Passananti, M.; Previtera, L. Chemical fate and genotoxic risk associated with hypochlorite treatment of nicotine. Sci. Total Environ. 2012, 426, 132–138. [Google Scholar] [CrossRef] [PubMed]
- Qin, F.; Zhao, Y.Y.; Zhao, Y.; Boyd, J.M.; Li, X.F. A toxic disinfection by-product, 2,6-dichloro-1,4-benzoquinone, identified in drinking water. Angew. Chem. Int. Ed. 2010, 122, 802–804. [Google Scholar] [CrossRef]
- Pan, Y.; Zhang, X.R. Four groups of new aromatic halogenated disinfection byproducts: Effect of bromide concentration on their formation and speciation in chlorinated drinking water. Environ. Sci. Technol. 2013, 47, 1265–1273. [Google Scholar] [CrossRef] [PubMed]
- Zhao, Y.; Qin, F.; Boyd, J.M.; Anichina, J.; Li, X.F. Characterization and determination of chloro- and bromo-benzoquinones as new chlorination disinfection byproducts in drinking water. Anal. Chem. 2010, 82, 4599–4605. [Google Scholar] [CrossRef] [PubMed]
- Zhai, H.; Zhang, X.R.; Zhu, X.; Liu, J.; Ji, M. Formation of brominated disinfection byproducts during chloramination of drinking water: New polar species and overall kinetics. Environ. Sci. Technol. 2014, 48, 2579–2588. [Google Scholar] [CrossRef] [PubMed]
- Yang, M.T.; Zhang, X.R. Comparative developmental toxicity of new aromatic halogenated DBPs in a chlorinated saline sewage effluent to the marine polychaete Platynereis dumerilii. Environ. Sci. Technol. 2013, 47, 10868–10876. [Google Scholar] [CrossRef]
- Du, H.; Li, J.; Moe, B.; McGuigan, C.F.; Shen, S.; Li, X.F. Cytotoxicity and oxidative damage induced by halobenzoquinones to T24 bladder cancer cells. Environ. Sci. Technol. 2013, 47, 2823–2830. [Google Scholar] [CrossRef]
- Wagner, E.D.; Plewa, M.J. CHO cell cytotoxicity and genotoxicity analyses of disinfection by-products: An updated review. Environ. Sci. Technol. 2017, 58, 64–76. [Google Scholar] [CrossRef]
- Zhang, D.; Bond, T.; Krasner, S.W.; Chu, W.; Pan, Y.; Xu, B.; Yin, D. Trace determination and occurrence of eight chlorophenylacetonitriles: An emerging class of aromatic nitrogenous disinfection byproducts in drinking water. Chemosphere 2019, 220, 858–865. [Google Scholar] [CrossRef]
- Zhang, D.; Chu, W.; Yu, Y.; Krasner, S.W.; Pan, Y.; Shi, J.; Yin, D.; Gao, N. Occurrence and stability of chlorophenylacetonitriles: A new class of nitrogenous aromatic DBPs in chlorinated and chloraminated drinking waters. Environ. Sci. Technol. Lett. 2018, 5, 394–399. [Google Scholar] [CrossRef]
- Thurman, E.M. Organic Geochemistry of Natural Waters; Martinus Nijhoff/Dr. W. Junk: Dordrecht, The Netherlands, 1985; pp. 181–213. [Google Scholar]
- Westerhoff, P.; Mash, H.J.J. Dissolved organic nitrogen in drinking water supplies: A review. J. Water Supply Res. Technol.-Aqua 2002, 51, 415–448. [Google Scholar] [CrossRef]
- Lee, W.; Westerhoff, P.; Croue, J.P. Dissolved organic nitrogen as a precursor for chloroform, dichloroacetonitril n-nitrosodimethylamine, and trichloronitromethane. Environ. Sci. Technol. 2007, 41, 5485–5490. [Google Scholar] [CrossRef] [PubMed]
- Reckhow, D.A.; MacNeill, A.L.; Platt, T.L.; MacNeill, A.L.; McClellan, J.N. Formation and Degradation of Dichloroacetonitrile in Drinking Waters. J. Water Supply Res. Technol.-AQUA 2001, 50, 1–13. [Google Scholar] [CrossRef]
- Chen, J.; Gan, G.; Pan, X.; Wu, H.; Hong, H.; Liang, Y. Trihalomethanes and haloacetic acids formation upon chlorination of typical amino acids. Environ. Chem. 2018, 37, 216–222. [Google Scholar]
- Srivastav, A.L.; Patel, N.; Chaudhary, V.K. Disinfection by-products in drinking water: Occurrence, toxicity and abatement. Environ. Pollut. 2020, 267, 115474. [Google Scholar] [CrossRef]
- Zhang, D.; Bond, T.; Li, M.; Dong, S.; Pan, Y.; Du, E.; Chu, W. Ozonation treatment increases chlorophenylacetonitrile formation in downstream chlorination or chloramination. Environ. Sci. Technol. 2021, 55, 3747–3755. [Google Scholar] [CrossRef] [PubMed]
- Beltrán, F.J. Ozone Reaction Kinetics for Water and Wastewater Systems; CRC Press: Boca Raton, FL, USA, 2003; pp. 227–276. [Google Scholar]
- Zhang, T.; Xu, B.; Wang, A.; Cui, C. Degradation kinetics of organic chloramines and formationof disinfection by-products during chlorination of creatinine. Chemosphere 2018, 195, 673–682. [Google Scholar] [CrossRef]
- Jiao, M.; Luo, Y.; Zhang, F.; Wang, L.; Chang, J.; Croué, J.P.; Zhang, T. Transformation of 6PPDQ during disinfection: Kinetics, products, and eco-toxicity assessment. Water Res. 2024, 250, 121070. [Google Scholar] [CrossRef] [PubMed]
- Hu, C.Y.; Zhang, J.C.; Lin, Y.L.; Ren, S.C.; Zhu, Y.Y.; Xiong, C.; Wang, Q.B. Degradation kinetics of prometryn and formation of disinfection by-products during chlorination. Chemosphere 2021, 276, 130089. [Google Scholar] [CrossRef]
- Sharma, V.K.; Sohn, M. Reactivity of chlorine dioxide with amino acids, peptides, and proteins. Environ. Chem. Lett. 2012, 10, 255–264. [Google Scholar] [CrossRef]
- Shah, A.D.; Mitch, W.A. Halonitroalkanes, halonitriles, haloamides, and N-nitrosamines: A critical review of nitrogenous disinfection byproduct formation pathways. Environ. Sci. Technol. 2012, 46, 119–131. [Google Scholar] [CrossRef] [PubMed]


| Source of DBPs | Compound | Proposed Structure | Characteristic Ion | Match |
|---|---|---|---|---|
| Chlorination DBPs of Tyr | P-108 |  | 51, 77, 108 | 88.6% |
| P-176 | 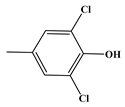 | 77, 141, 176 | 92.0% | |
| P-136 |  | 77, 107, 136 | 86.7% | |
| P-142 |  | 77, 107, 142 | 91.4% | |
| P-133 | 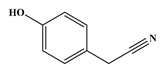 | 78, 106, 133 | 90.4% | |
| P-190 | 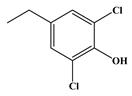 | 77, 155, 190 | 89.1% | |
| Chlorination DBPs of Phe | P-120 | 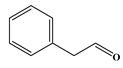 | 65, 91, 120 | 95.5% |
| P-106 | 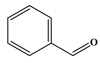 | 51, 77, 106 | 96.7% | |
| P-114 |  | 77, 112, 114 | 82.4% | |
| P-126 | 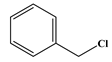 | 91, 126 | 92.5% | |
| Chlorination DBPs of Trp | P-157 | 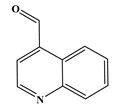 | 75, 129, 157 | 93.1% |
| P-159 | 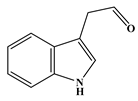 | 103, 130, 159 | 90.8% | |
| Common DBPs of three aromatic AAs | P-117 | 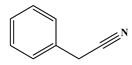 | 90, 117 | 92.5% |
| P-151 | 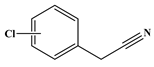 | 89, 116, 151 | 87.9% | |
| P-185 | 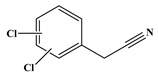 | 89, 150, 185 | 87.6% |
| Tyr:HOCl | P-136 | P-108 | P-142 | P-190 | P-176 | P-117 | P-133 | P-151 | P-185 |
|---|---|---|---|---|---|---|---|---|---|
| 2:1 | √ | √ | |||||||
| 1:1 | √ | √ | √ | √ | √ | √ | |||
| 1:2 | √ | √ | √ | √ | √ | √ | √ | √ | √ |
| 1:5 | √ | √ | √ | √ | √ | √ | √ | √ | √ |
| 1:10 | √ | √ | √ | √ | √ | √ | √ | √ | √ |
| Phe:HOCl | P-106 | P-120 | P-114 | P-126 | P-117 | P-151 | P-185 |
|---|---|---|---|---|---|---|---|
| 2:1 | √ | √ | |||||
| 1:1 | √ | √ | √ | √ | √ | √ | |
| 1:2 | √ | √ | √ | √ | √ | √ | √ |
| 1:5 | √ | √ | √ | √ | √ | √ | √ |
| 1:10 | √ | √ | √ | √ | √ | √ | √ |
| Trp:HOCl | P-157 | P-159 | P-117 | P-151 | P-185 |
|---|---|---|---|---|---|
| 2:1 | √ | √ | |||
| 1:1 | √ | √ | √ | √ | |
| 1:2 | √ | √ | √ | √ | √ |
| 1:5 | √ | √ | √ | √ | √ |
| 1:10 | √ | √ | √ | √ | √ |
| Chlorination | Tyr | Phe | Trp | |||
|---|---|---|---|---|---|---|
| R2 | kobs (min−1) | R2 | kobs (min−1) | R2 | kobs (min−1) | |
| CAA:CHOCl = 1:1 | 0.987 | −3.655 × 10⁻³ | 0.997 | −4.254 × 10⁻³ | 0.999 | −2.901 × 10⁻³ |
| CAA:CHOCl = 1:2 | 0.994 | −5.412 × 10⁻³ | 0.998 | −7.373 × 10⁻³ | 0.989 | −4.540 × 10⁻³ |
| CAA:CHOCl = 1:5 | 0.999 | −2.986 × 10⁻² | 0.998 | −2.809 × 10⁻² | 0.996 | −1.333 × 10⁻² |
| Chlorination CAA:CHOCl = 1:2 | Tyr | Phe | Trp | |||
|---|---|---|---|---|---|---|
| R2 | kobs (min−1) | R2 | kobs (min−1) | R2 | kobs (min−1) | |
| pH = 6.0 | 0.998 | −4.089 × 10⁻³ | 0.997 | −4.841 × 10⁻³ | 0.998 | −3.714 × 10⁻³ |
| pH = 7.0 | 0.994 | −4.767 × 10⁻³ | 0.999 | −7.094 × 10⁻³ | 0.979 | −4.448 × 10⁻³ |
| pH = 8.0 | 0.998 | −4.590 × 10⁻³ | 0.998 | −5.539 × 10⁻³ | 0.989 | −3.874 × 10⁻³ |
| pH = 9.0 | 0.997 | −4.550 × 10⁻³ | 0.998 | −5.985 × 10⁻³ | 0.996 | −3.989 × 10⁻³ |
| AAs | Flow Rate | Injection Volume | Elution Gradient | Excitation Wavelength | Temperature |
|---|---|---|---|---|---|
| Tyr | 0.4 mL/min | 30 μL | 4% B, 96% A, 0–4 min | 280 nm | 20 °C |
| Phe | 0.6 mL/min | 30 μL | 6% B, 94% A, 0–4 min | 210 nm | 35 °C |
| Trp | 0.6 mL/min | 30 μL | 10% B, 90% A, 0–4 min | 230 nm | 35 °C |
Disclaimer/Publisher’s Note: The statements, opinions and data contained in all publications are solely those of the individual author(s) and contributor(s) and not of MDPI and/or the editor(s). MDPI and/or the editor(s) disclaim responsibility for any injury to people or property resulting from any ideas, methods, instructions or products referred to in the content. |
© 2024 by the authors. Licensee MDPI, Basel, Switzerland. This article is an open access article distributed under the terms and conditions of the Creative Commons Attribution (CC BY) license (https://creativecommons.org/licenses/by/4.0/).
Share and Cite
Chen, Z.; Chen, B.; Shen, H.; Li, X.; Zhou, C.; Ma, G.; Wei, X.; Wang, X.; Yu, H. Chlorination of Aromatic Amino Acids: Elucidating Disinfection Byproducts, Reaction Kinetics, and Influence Factors. Molecules 2024, 29, 1879. https://doi.org/10.3390/molecules29081879
Chen Z, Chen B, Shen H, Li X, Zhou C, Ma G, Wei X, Wang X, Yu H. Chlorination of Aromatic Amino Acids: Elucidating Disinfection Byproducts, Reaction Kinetics, and Influence Factors. Molecules. 2024; 29(8):1879. https://doi.org/10.3390/molecules29081879
Chicago/Turabian StyleChen, Zhenyi, Bangyu Chen, Hui Shen, Xunlin Li, Chen Zhou, Guangcai Ma, Xiaoxuan Wei, Xueyu Wang, and Haiying Yu. 2024. "Chlorination of Aromatic Amino Acids: Elucidating Disinfection Byproducts, Reaction Kinetics, and Influence Factors" Molecules 29, no. 8: 1879. https://doi.org/10.3390/molecules29081879
APA StyleChen, Z., Chen, B., Shen, H., Li, X., Zhou, C., Ma, G., Wei, X., Wang, X., & Yu, H. (2024). Chlorination of Aromatic Amino Acids: Elucidating Disinfection Byproducts, Reaction Kinetics, and Influence Factors. Molecules, 29(8), 1879. https://doi.org/10.3390/molecules29081879