Article

Cellulose–Amine Porous Materials: The Effect of Activation Method on Structure, Textural Properties, CO2 Capture, and Recyclability

by
Sarah Krupšová
1 and
Miroslav Almáši
2,*
1
Novy PORG Gymnasium, Pod Krcskym lesem 25, CZ-142 00 Prague, Czech Republic
2
Department of Inorganic Chemistry, Faculty of Science, Pavol Jozef Safarik University, Moyzesova 11, SK-040 01 Kosice, Slovakia
*
Author to whom correspondence should be addressed.
Molecules 2024, 29(5), 1158; https://doi.org/10.3390/molecules29051158
Submission received: 5 February 2024 / Revised: 22 February 2024 / Accepted: 4 March 2024 / Published: 5 March 2024

Abstract

:
CO2 capture via physical adsorption on activated porous carbons represents a promising solution towards effective carbon emission mitigation. Additionally, production costs can be further decreased by utilising biomass as the main precursor and applying energy-efficient activation. In this work, we developed novel cellulose-based activated carbons modified with amines (diethylenetriamine (DETA), 1,2-bis(3-aminopropylamino)ethane (BAPE), and melamine (MELA)) with different numbers of nitrogen atoms as in situ N-doping precursors. We investigated the effect of hydrothermal and thermal activation on the development of their physicochemical properties, which significantly influence the resulting CO2 adsorption capacity. This process entailed an initial hydrothermal activation of biomass precursor and amines at 240 °C, resulting in C+DETA, C+BAPE and C+MELA materials. Thermal samples (C+DETA (P), C+BAPE (P), and C+MELA (P)) were synthesised from hydrothermal materials by subsequent KOH chemical activation and pyrolysis in an inert argon atmosphere. Their chemical and structural properties were characterised using elemental analysis (CHN), infrared spectroscopy (IR), scanning electron microscopy (SEM), and thermogravimetric analysis (TG). The calculated specific surface areas (SBET) for thermal products showed higher values (998 m2 g−1 for C+DETA (P), 1076 m2 g−1 for C+BAPE (P), and 1348 m2 g−1 for C+MELA (P)) compared to the hydrothermal products (769 m2 g−1 for C+DETA, 833 m2 g−1 for C+BAPE, and 1079 m2 g−1 for C+MELA). Carbon dioxide adsorption as measured by volumetric and gravimetric methods at 0 and 25 °C, respectively, showed the opposite trend, which can be attributed to the reduced content of primary adsorption sites in the form of amine groups in thermal products. N2 and CO2 adsorption measurements were carried out on hydrothermal (C) and pyrolysed cellulose (C (P)), which showed a several-fold reduction in adsorption properties compared to amine-modified materials. The recyclability of C+MELA, which showed the highest CO2 adsorption capacity (7.34 mmol g−1), was studied using argon purging and thermal regeneration over five adsorption/desorption cycles.

1. Introduction

The rapidly rising production of anthropogenic carbon dioxide has been a major factor related to global climate change for the last few decades. CO2, which accounts for 75% of total greenhouse gases (GHGs) [1], has experienced an increase in concentrations throughout the entire timeframe, with the current concentration surpassing 421 ppm [2]. This has resulted in the production of irreversible changes to the planet’s biosphere, such as global warming, rising temperatures, acidification of oceans, and more frequent occurrences of extreme weather events, which are responsible for alterations in water resource availability [3], decreased biodiversity due to extinction of species [4], and forced displacements of populations due to climate-driven externalities [5]. All of this significantly exacerbates the quality of life in both developing and developed countries [6,7,8]. Therefore, the effective mitigation of atmospheric carbon dioxide has become the main focus of attention.
Post-combustion capture of CO2 (PCC) from flue gas has potential for mitigating carbon emissions. The process consists of separating carbon dioxide from the emissions produced during the combustion of fossil fuels [9]. In order to achieve extraction, liquid or solid sorbents with high affinity to CO2 molecules are utilised [10,11]. In general, the CO2 capture step of PCC technology accounts for approximately 70% of the system’s total cost [12]. Thus, the selection of an effective sorbent with a low production price is of vital importance. However, currently applied PCC technology is not economically viable due to the use of amine scrubbing, which suffers from low recyclability [13], as well as to energy-inefficient operation due to the presence of water, which possesses high specific heat capacity and contributes to the corrosion of vessels [14].
Therefore, developing efficient, ecological, and low-cost CO2 capture materials is urgently required. Porous materials such as activated carbons [15,16], carbon nanotubes [17,18], covalent–organic frameworks [19,20], metal–organic frameworks [21,22,23,24], zeolites [25,26,27], mesoporous silicas [28,29,30], and natural materials based on nanoporous shales, limestones, and foams [31,32,33,34] stand out as promising frontiers in the quest for effective carbon capture and storage technologies. Recently, sorbents based on activated porous carbons (APC) have received increased interest because of their unique physio-chemical properties, such as high surface area [35,36], tunable pore distribution [37], and the possibility of chemical modification for enhanced affinity to CO2 molecules [38,39,40]. Additionally, their low isosteric heat of adsorption allows for effective regeneration after CO2 adsorption and enables them to resist moisture, making APCs more economically and energetically feasible in industrial CO2 capture. Furthermore, their production cost can be further decreased by utilising biomass as the primary precursor. Chemical or physical activations are frequently used methods to develop effective APCs with high porosity. Hence, our research aimed to develop novel biomass-based activated carbons with low production cost and investigate the effect of hydrothermal and thermal activation methods on the development of their textural properties, which largely influence the material’s CO2 adsorption capacity.
Amine modification of porous materials is a widely explored strategy to enhance carbon dioxide storage capacity, particularly in the context of carbon capture and storage technologies. Amine functionalisation involves introducing amine groups (-NH2) onto the surface of porous materials. This modification imparts specific chemical interactions with CO2 molecules, leading to increased adsorption capacity [41,42]. Various types of carbonaceous materials with a high CO2 storage capacity can be listed, such as nitrogen-doped microporous carbons containing the benzoxazine moieties PAEBZ-A and PAMBZ-A (SBET = 960 and 464 m2 g−1) [43], amine-modified graphene oxide (SBET = 1772 m2 g−1) [44], N-doped carbon derived from polypyrrole (SBET = 1521 m2 g−1) [45], and biomass-derived carbon-based material from date waste (SBET = 2367 m2 g−1) [46], with CO2 adsorption capacities of 31.69 wt. %, 20.24 wt. %, 8.90 wt. %, 7.16 wt. %, and 6.40 wt. %, respectively, at 0 °C and 1 bar.
Herein, APCs samples based on cellulose as the primary precursor doped with N-containing modifiers (diethylenetriamine (DETA), 1,2-bis(3-aminopropylamino)ethane (BAPE), and melamine (MELA)) were synthesised via facile single-step hydrothermal and two-step hydrothermal-thermal activation methods (see Figure 1). The prepared APCs were entitled as C+N, where N refers to the type of amine used for N-doping modification and C is carbon. Additionally, activated carbons prepared from the same precursor and N-doping modifier but through a different activation method are differentiated by the symbol (P), denoting the involvement of pyrolysis in the material’s synthesis. The compositions, structures, and CO2 capture properties of all the materials were studied by CHN elemental analysis, infrared spectroscopy (IR), thermogravimetric analysis (TG), scanning electron microscopy (SEM), nitrogen adsorption, and CO2 adsorption, while the recyclability was studied by temperature/gas purging-programmed CO2 adsorption. It has been observed that the degree of porosity, specific surface area, and amine content can be well-tuned by selection of the activation method. In contrast, the chemical composition and CO2 capture ability depend vastly on the chemical structure; hence, N-doping modifiers are applied in the synthesis. C+MELA (P) showed superior pore volume and SBET surface area, equaling 0.628 cm3 g−1 and 1348 m2 g−1, respectively. However, the most effective material for CO2 capture under varying temperatures (0 and 25 °C) was C+MELA, which attained the highest CO2 adsorption capacity of 7.34 mmol g−1 at 0 °C and 1 bar and 4.64 mmol g−1 at 25 °C and 1 bar.

2. Results and Discussion

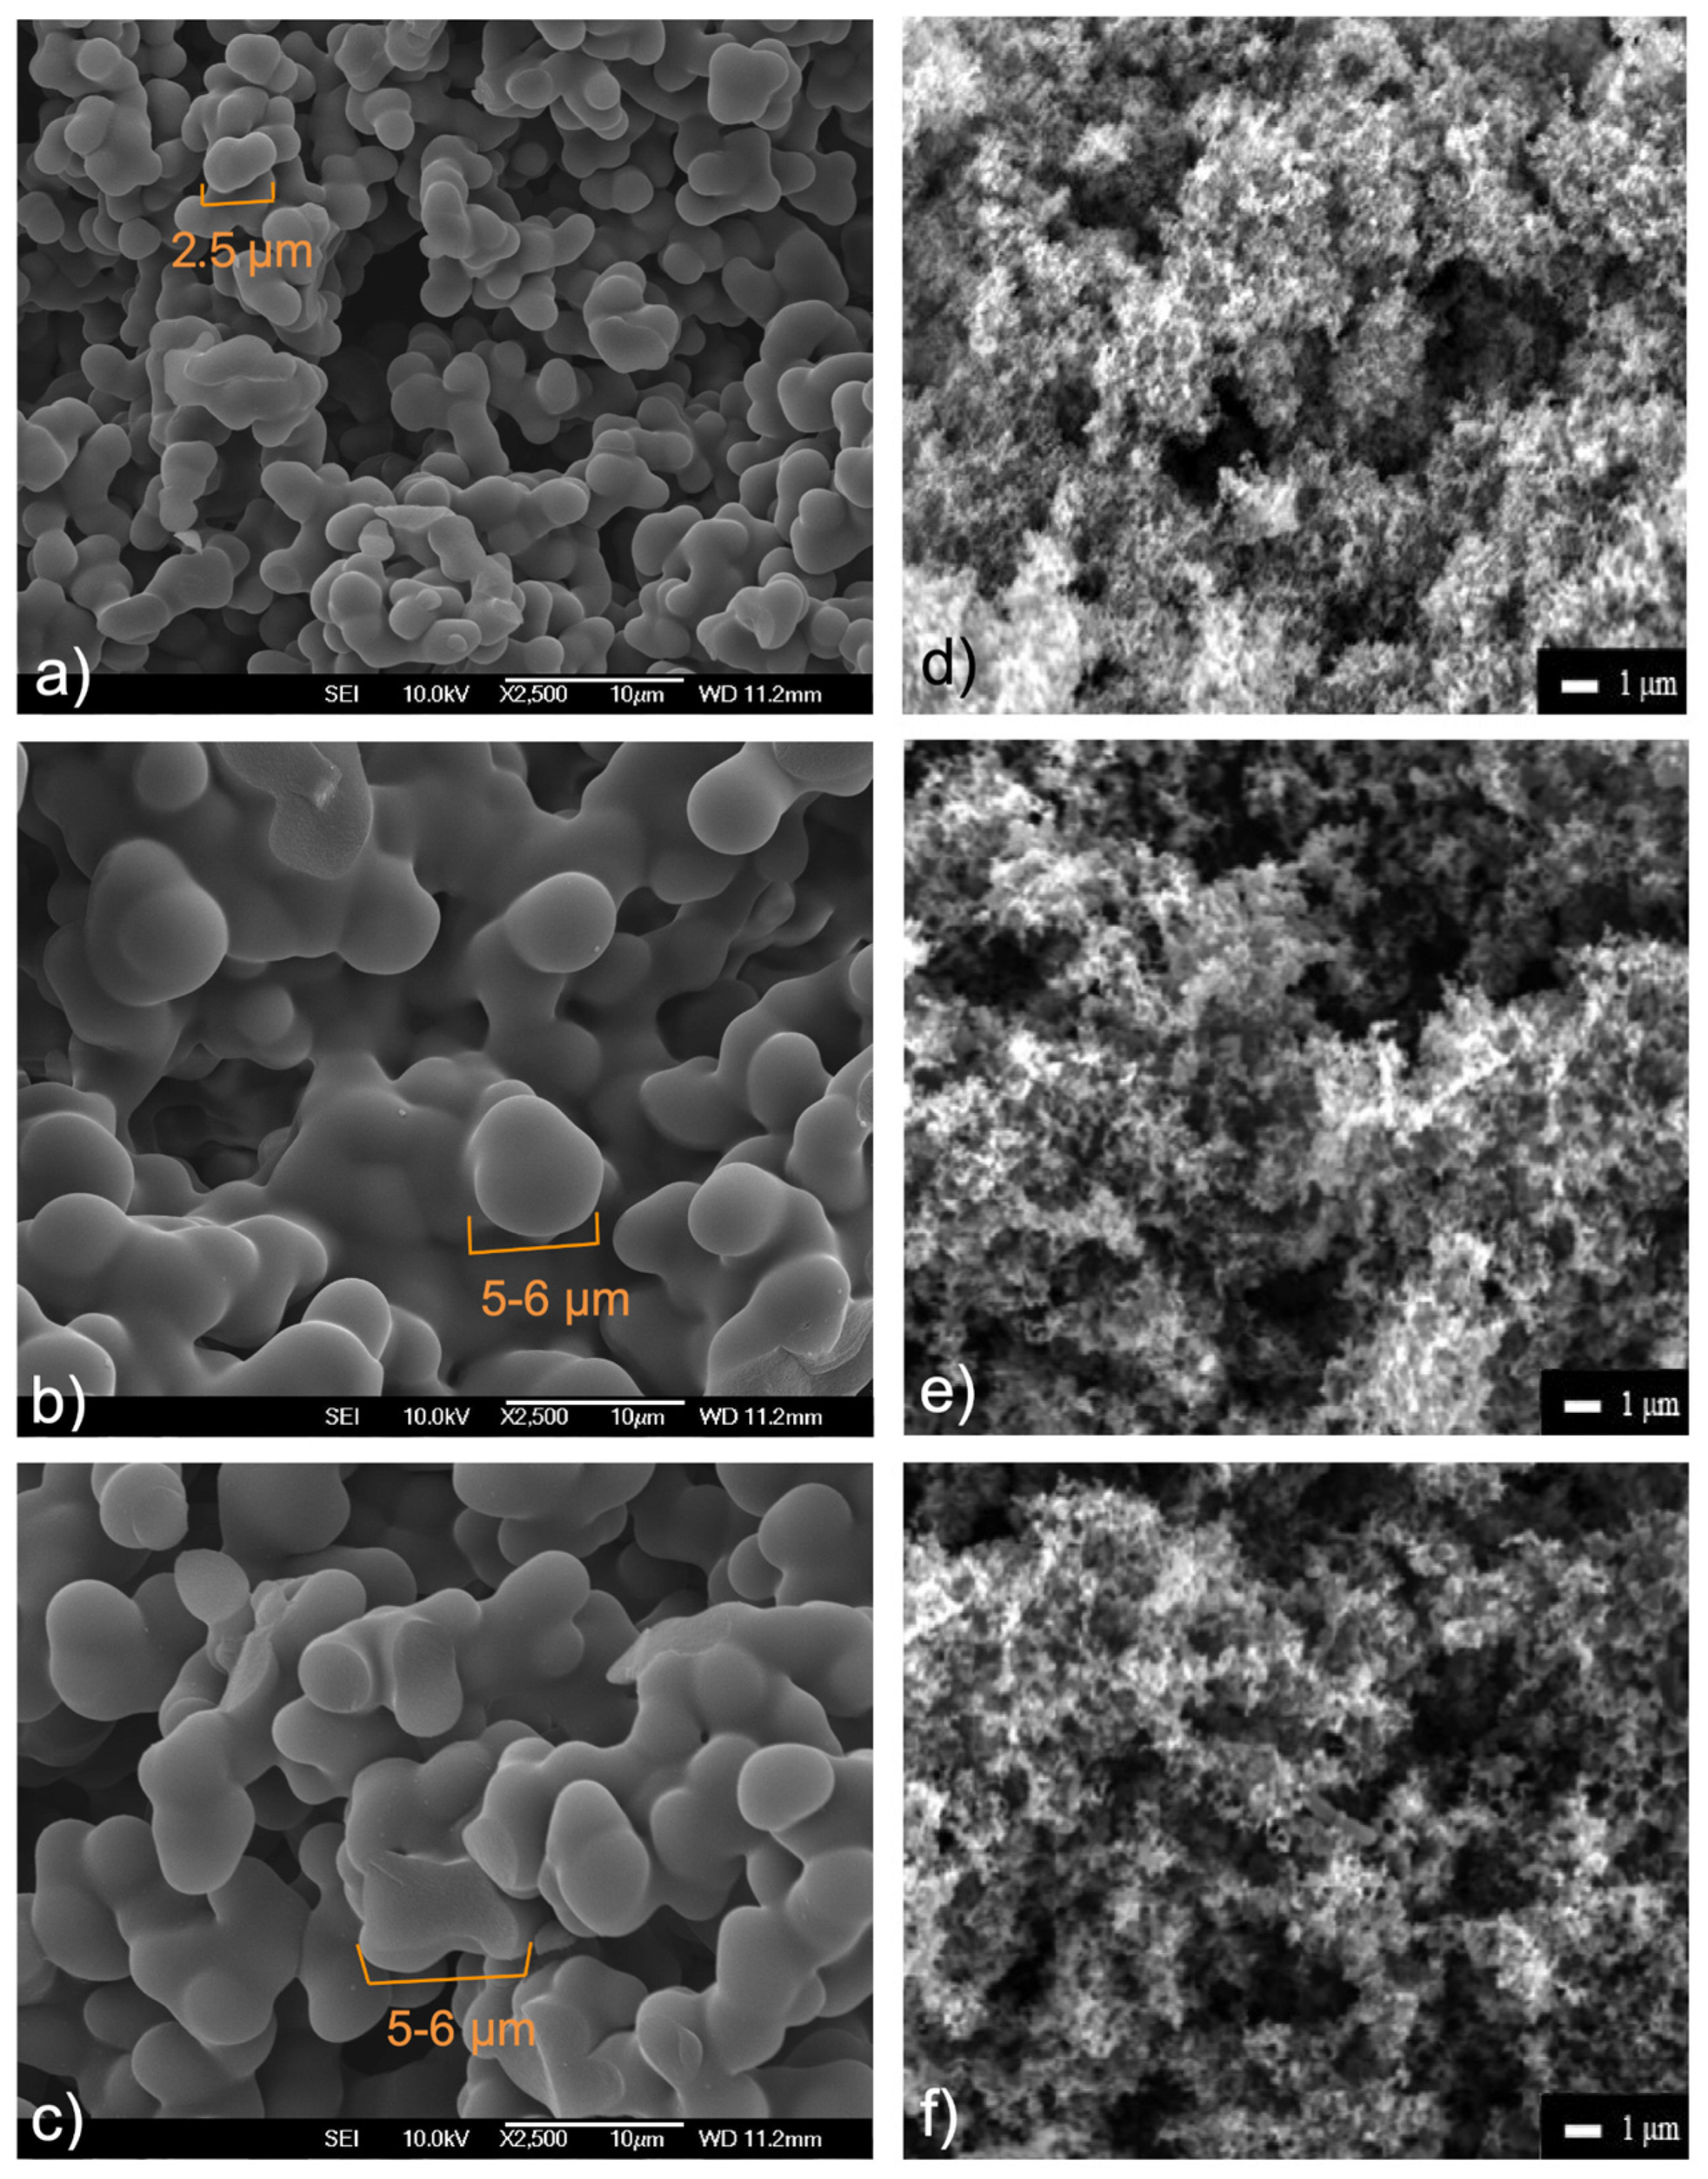
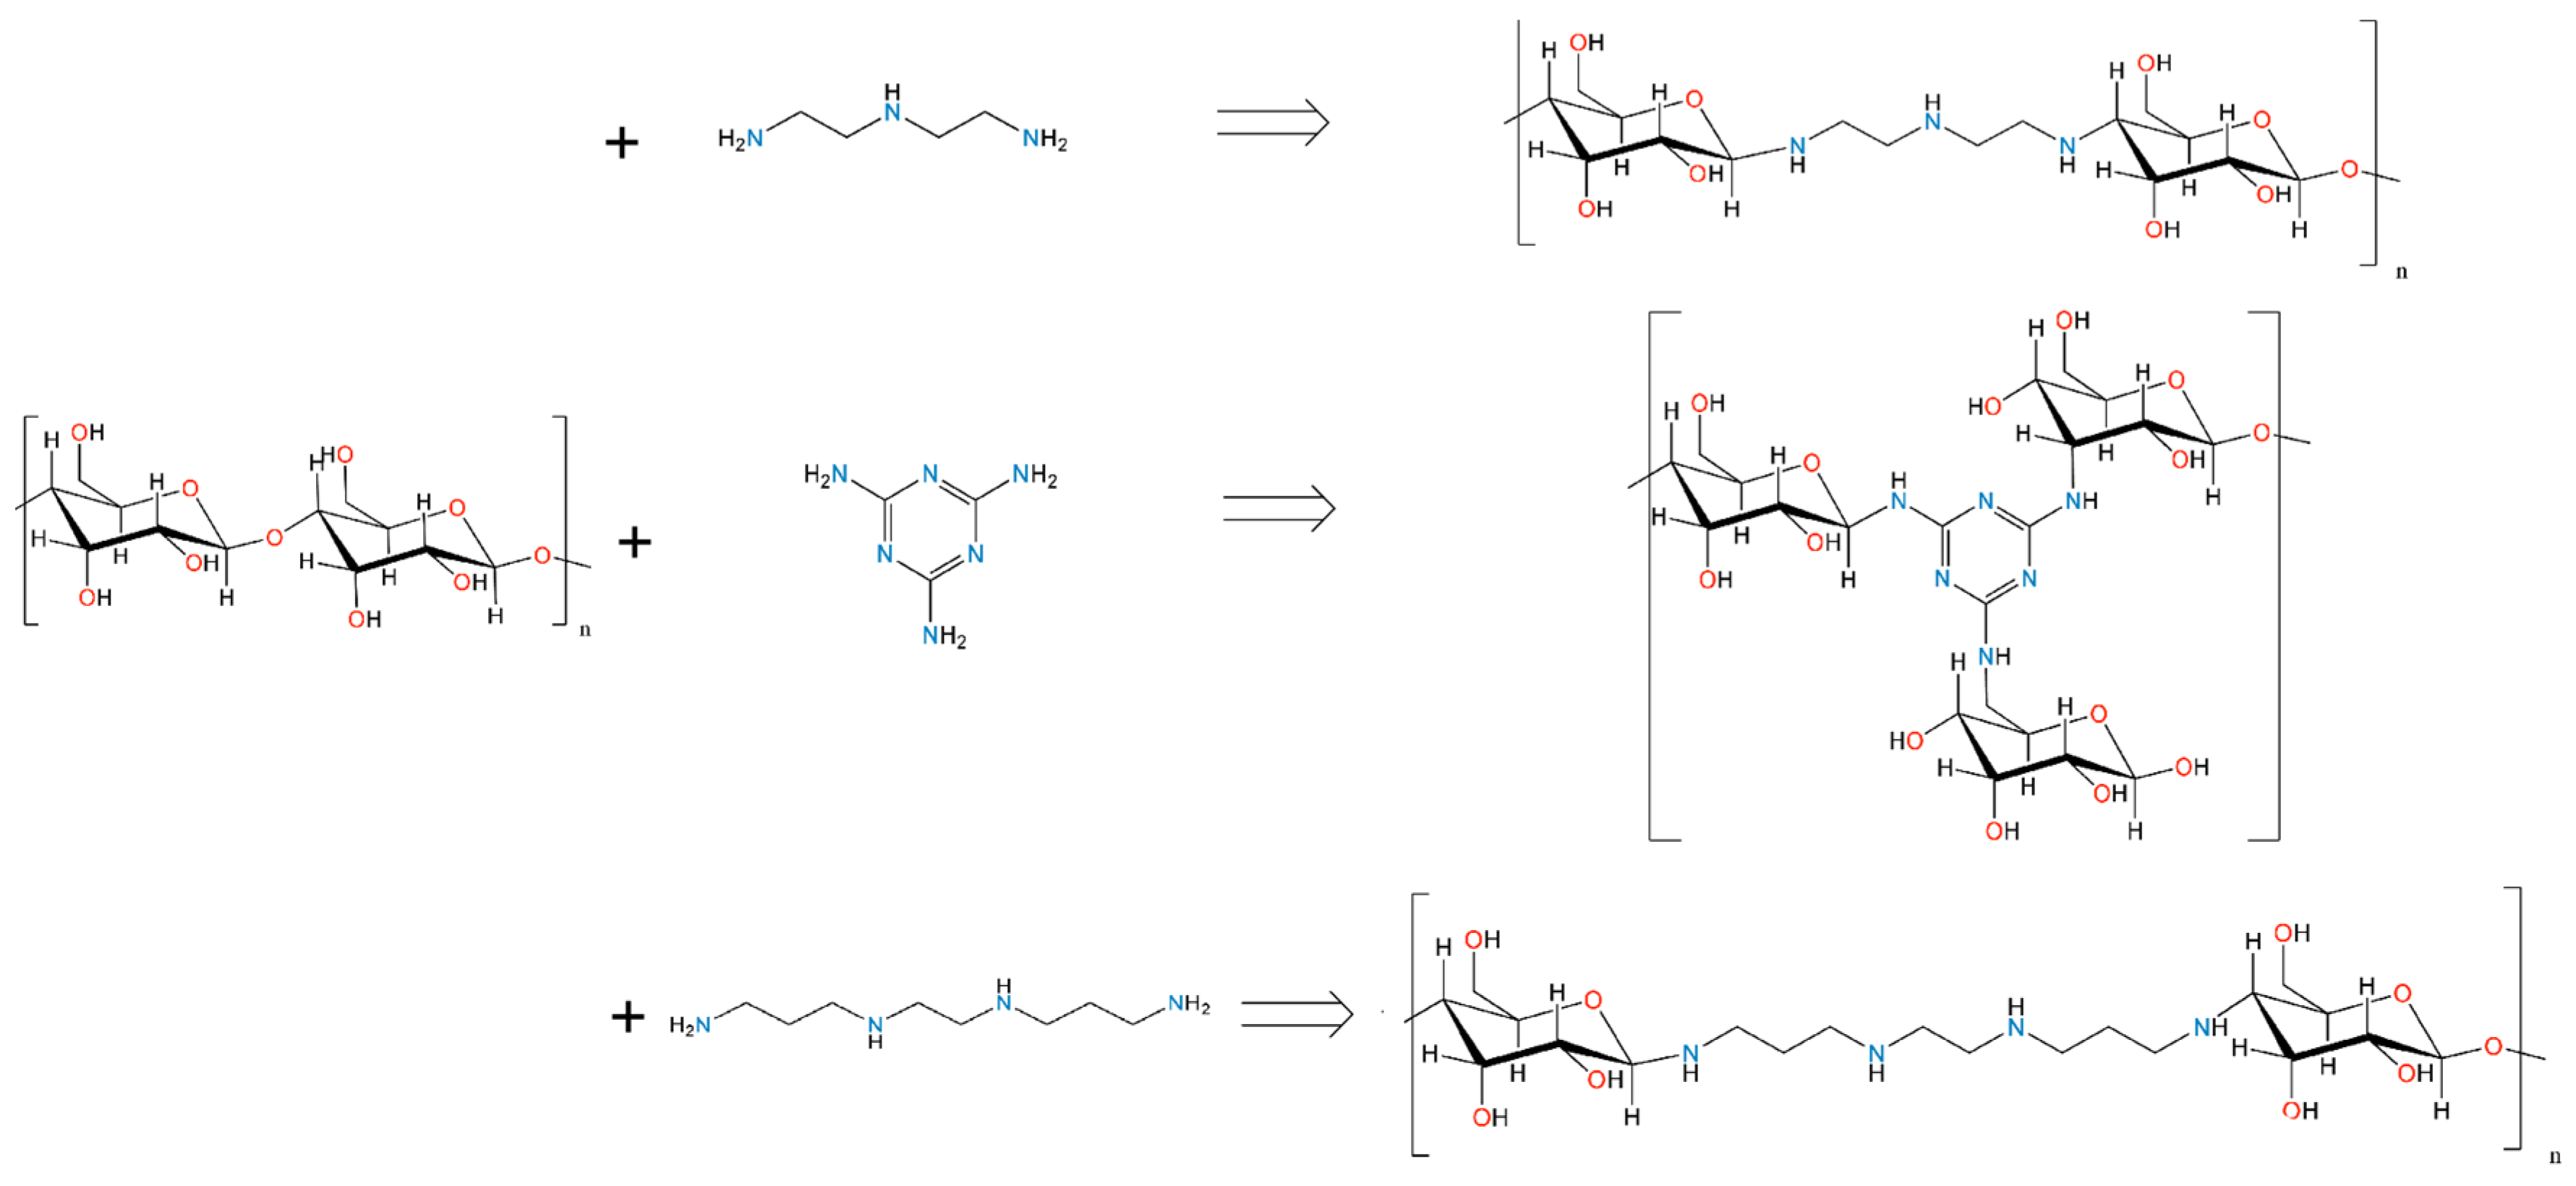
2.1. Composition and Structural Characterisation

The elemental composition of the prepared APCs in wt. % is summarised in Table 1. In hydrothermal samples, the nitrogen content is in the range of 6.5–12.6 wt. % and increases depending on the nitrogen content in the amine used (DETA = 3 × N, BAPE = 4 × N, and MELA = 6 × N). As indicated by the data, pyrolysis of the samples (P) led to significant enhancement of the carbon matrix as well as to a considerable decrease of the wt. % composition of hydrogen, nitrogen, and oxygen in the structures. In particular, the reduction in N content suggests a significant loss of amine functional groups during the pyrolysis step. This can be attributed mainly to the high activation temperature applied during pyrolysis, which led to the release of small inorganic molecules (NH3, H2O, CO2, CO) from the structure of porous materials.
SEM images (Figure 2) with magnification 2500× were used to evaluate the morphologies of the prepared samples. The hydrothermal products (see Figure 2a–c) display regular spherical morphologies with smooth surfaces, which are directly linked to the particle size (~2.5 μm for C+MELA, ~5–6 μm for C+BAPE, and ~5–6 μm for C+DETA) and shape of the used amines. As seen in Figure 2d–f, thermal activation led to irregular fibrous structures with smaller particle sizes, which can be attributed to both the activating agent and the thermal treatment. While KOH activation led to the development of porosity via pitting and channelling [47], high thermal activation resulted in the loss of volatile matter, causing the formation of voids, which significantly enhanced the degree of porosity and created a well-developed porous matrix observable in the thermal samples.

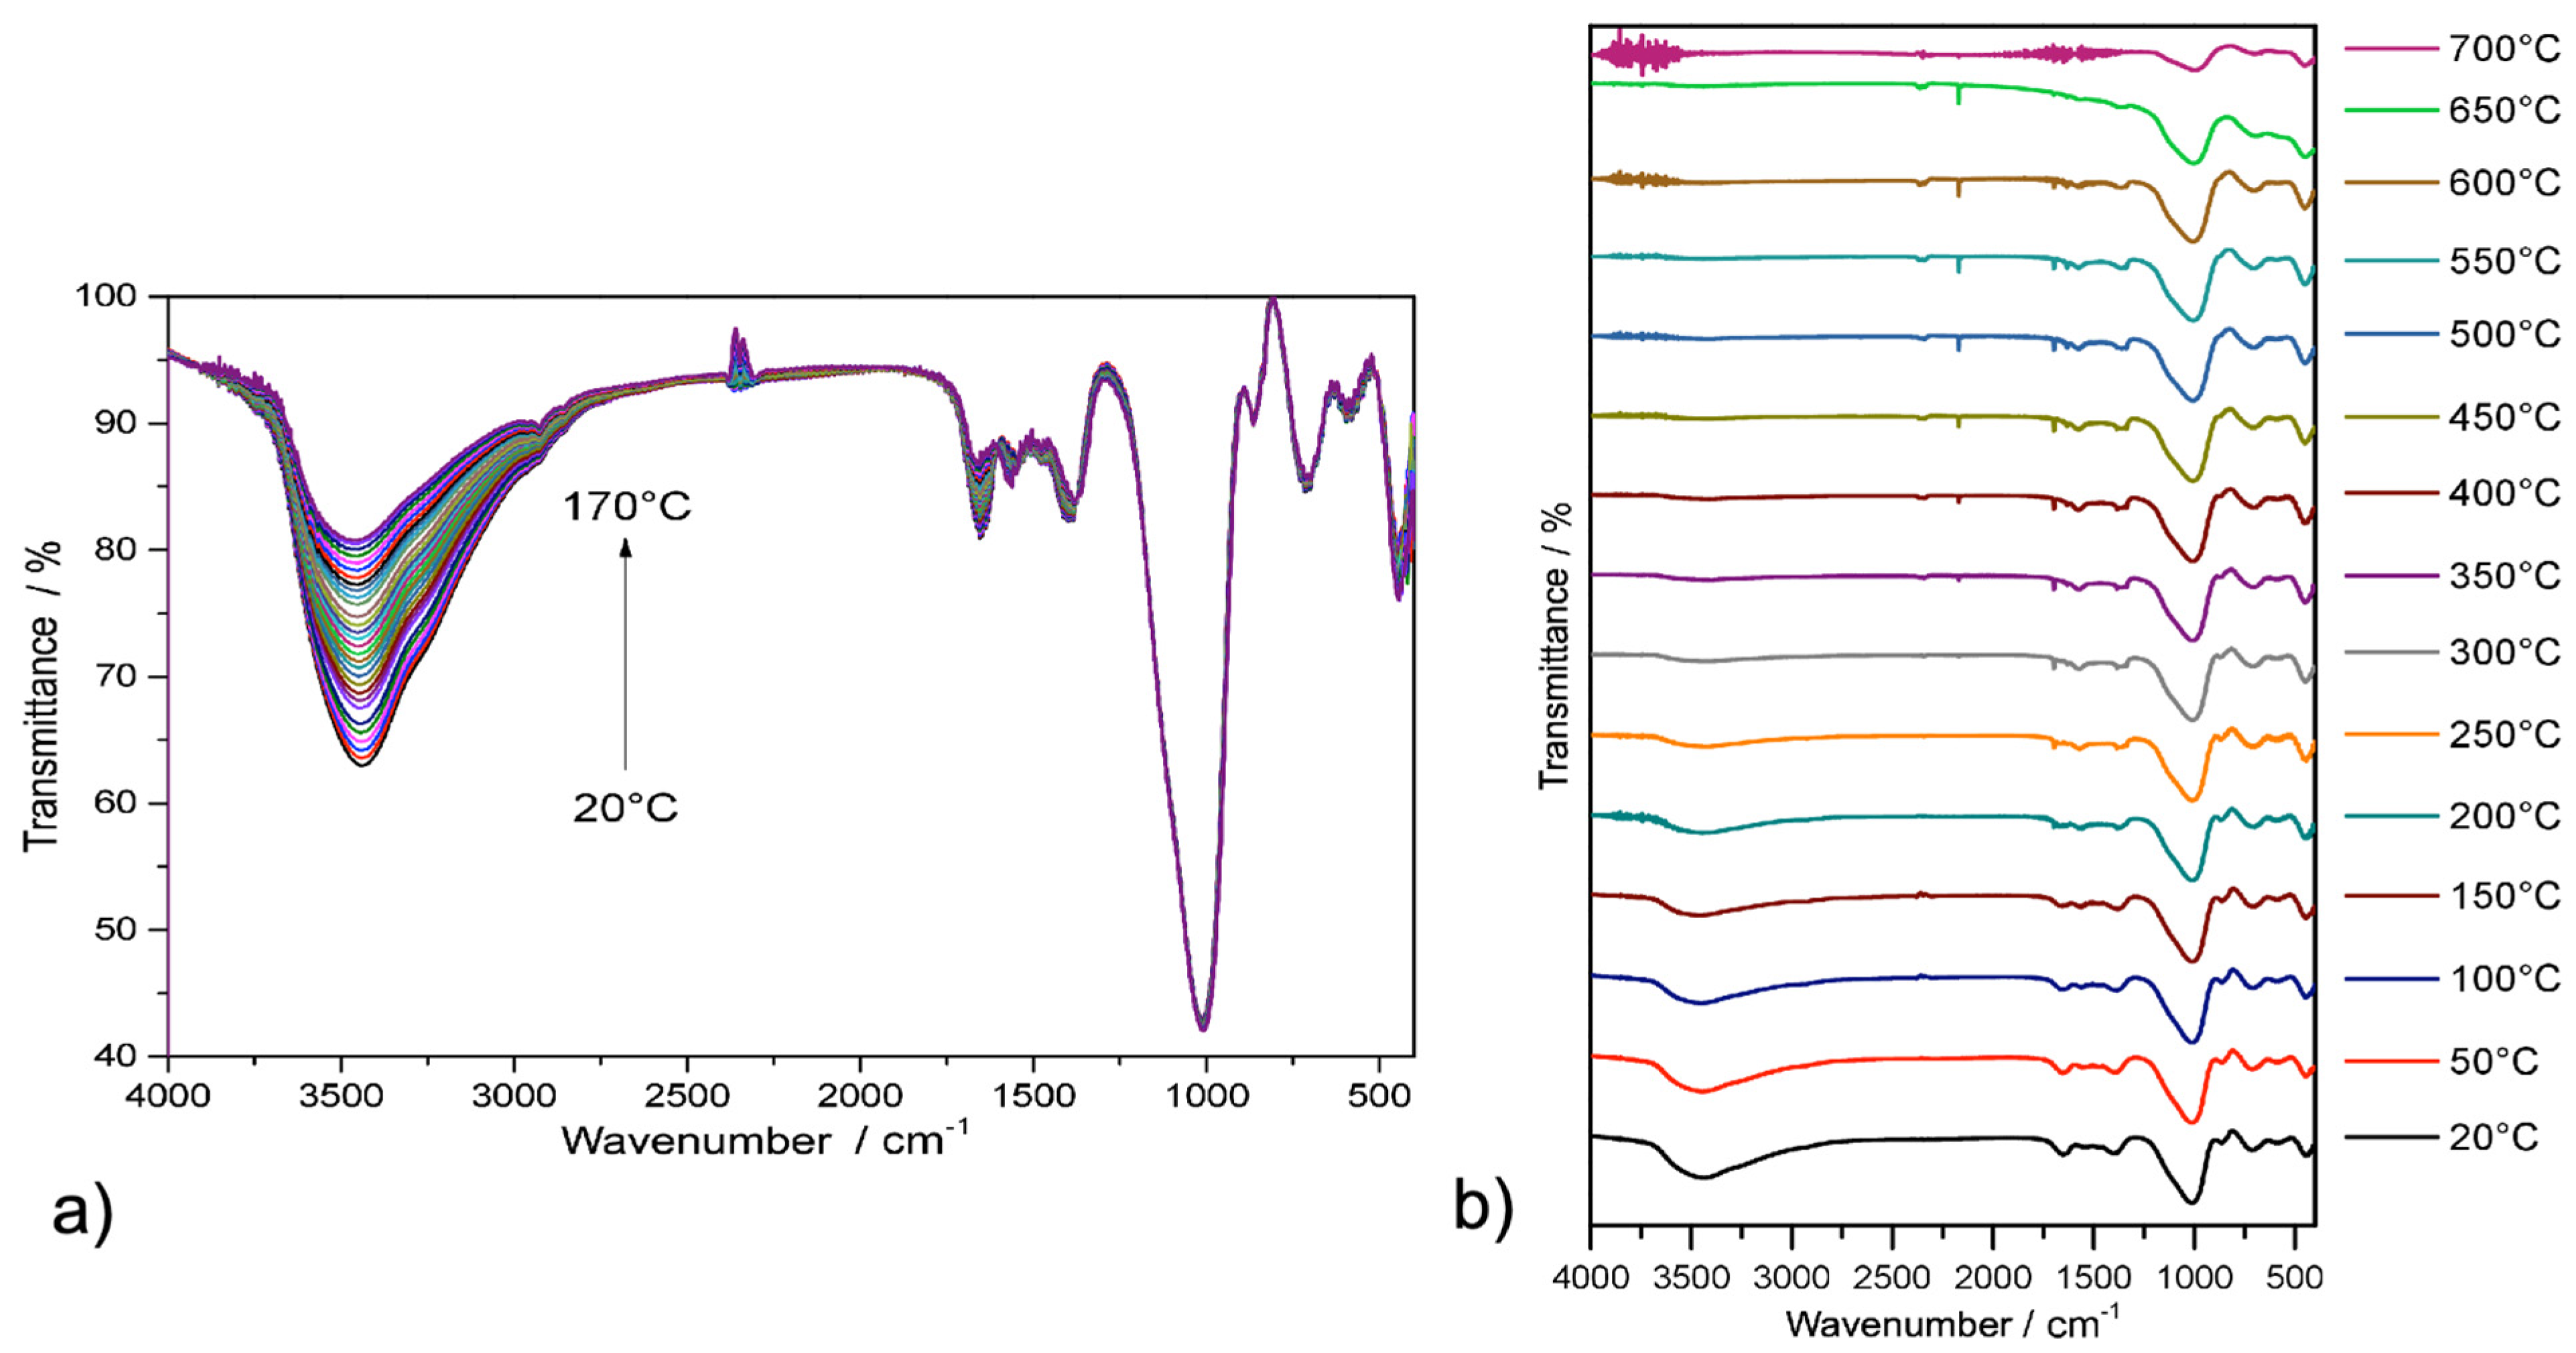
2.2. Spectroscopic Analysis

The presence of cellulose and amines in the hydrothermal products was identified by infrared spectroscopy (IR). The IR spectra of the compounds at ambient temperature are shown in Figure 3. The list of the characteristic adsorption bands with corresponding individual vibrations, together with the specific wavenumber values, is provided in Table 2.
In all prepared materials, the successful binding of amine to cellulose can be observed in the form of adsorption bands corresponding to ν(NH) vibrations with values of 3328 cm−1 for C+MELA, 3184 cm−1 for C+DETA, and 3180 cm−1 for C+BAPE. The reaction between the main precursor and amines was confirmed by vibrations corresponding to ν(C-O) of cellulose at 1052 cm−1, 1022 cm−1 (C+MELA), 1062 cm−1, 1036 cm−1 (C+DETA), and 1055 cm−1, 1031 cm−1 (C+BAPE). In all materials, the presence of wavenumbers in the ranges of 2876–2962 cm−1 and 2812–2898 cm−1 was observed, which respectively correspond to asymmetric and symmetric ν(CH2)aliph vibrations and confirm the presence of cellulose in hydrothermal materials. In the IR spectrum of C+MELA, the wavenumbers for ν(NH) shifted to lower values, i.e., 3184 cm−1 and 3130 cm−1, indicating the formation of intermolecular hydrogen bonds between melamine molecules.
Characteristic absorption bands belonging to amine functional groups were not observed in the IR spectra of the pyrolysed materials (see Figure 3 and Table 2), which is in good agreement with the results of the CHN analysis showing N content below 1 wt. % in all thermal products. Wavenumbers of 991 cm−1 (C+MELA (P)), 977 cm−1 (C+BAPE (P)), and 992 cm−1 (C+DETA (P)) were observed in the spectra of the pyrolysed materials, suggesting the presence of deformation γ(CCH) vibrations.
Infrared spectroscopy with gradual heating in the temperature range of 20–170 °C (see Figure 4a) with 5 °C increment (in situ measurements) and 20–700 °C with an increment of 50 °C (step-by-step heating in an oven; see Figure 4b) was used to investigate the thermal stability of the C+DETA sample. Initially, the desolvation process of water in the compound occurred, as indicated by a change in the intensity of ν(OH) vibration located at ~3500 cm−1 that decreased with increasing temperature (see Figure 4a). From Figure 4b, it is possible to observe the complete release of water upon heating to 250 °C, when the broad absorption ν(OH) band can no longer be observed. At 350 °C, a significant decrease in the wavenumbers of ν(NH2) and ν(NH) was recorded, indicating the decomposition of diethylenetriamine (DETA). Subsequently, a gradual decrease in the wavenumbers of ν(C-O) vibrations was observed in the temperature range of 350–700 °C, proving the release of cellulose. Therefore, the thermal decomposition of the prepared materials proceeds first by dehydration, followed by the decomposition of the amine, and finally by the release of cellulose.

2.3. Thermal Stability

The thermal stability of the prepared compounds was investigated by thermogravimetric analysis (TG) in the temperature range of 20–700 °C. Thermoanalytical curves measured in an air atmosphere are shown in Figure 5, and data on the thermal stability of compounds, stability after dehydration, and mass loss in individual temperature intervals are summarised in Table S1 in Supplementary Materials. after subtraction of mass changes corresponding to solvents, normalised TG curves (see Figure 5c) [48] were used to calculate the empirical formulas of the prepared materials and thereby determine the amount of bound amine in hydrothermal samples.
As indicated in Figure 5a, TG curves of hydrothermal samples consist of three notable mass decreases, which, based on the results from IR spectroscopy with gradual heating (see Section 2.2), can be attributed to water, amine, and cellulose, respectively. C+DETA showed thermal stability up to 43.5 °C, after which a water loss of 5.0 wt. % occurred. In the temperature range of 115.2–265.3 °C, no significant thermal decomposition or mass decrease was observed, indicating the stability of the material after dehydration. Another mass decrease of 22.1 wt. % was recorded in the temperature range of 265.3–332.3 °C, which can be attributed to the release of diethylenetriamine. In the last phase of the thermal decomposition (332.3–508.9 °C) the mass change was 72.9 wt. %, which can be attributed to the decomposition of cellulose in the material. The empirical formula for C+DETA was calculated and identified as C1DETA1.
Material C+BAPE displayed the highest thermal stability up to a temperature of 53.8 °C, after which a mass decrease to 8.5 wt. % was recorded. This weight change corresponded to the release of water, after which the material acquired a stable dehydrated state up to a temperature of 134.1 °C, when the release of 1,2-bis(3-aminopropylamino)ethane was observed in the form of a mass loss of 25.4 wt. %. In the last temperature interval of 341.4–542.2 °C the decomposition of cellulose was observed, causing a decrease in mass of 66.1 wt. %. Thus, the empirical formula of the C+BAPE compound was determined to be C1BAPE0.76.
As seen in Table S1 in Supplementary Materials, C+MELA showcased thermal stability up to 39.9 °C, followed by the decomposition of water by 11.1 wt. % up to 163.3 °C. The thermal decomposition of melamine occurred in the second temperature interval (163.3–315.7 °C), as indicated by a mass decrease of 20.4 wt. %. Subsequently, a mass change of 68.5 wt. % was determined in the third temperature interval (380.1–517.4 °C), which can be assigned to the final decomposition of cellulose. Based on the aforementioned mass losses, the empirical formula of the C+MELA compound was computed to be C1MELA0.83.
TG curves for the thermal samples are shown in Figure 5b. As indicated in Table S1 in Supplementary Materials, the decomposition of the thermal compounds initially proceeded by dehydration of the products in the first step, which was accompanied by weight losses of 9.1 wt. %, 10.7 wt. %, and 8.2 wt. % for C+DETA (P), C+BAPE (P), and C+MELA (P), respectively. Subsequently, the dehydrated compounds acquired thermal stability up to a temperature of 283.5 °C for C+DETA (P), 291.6 °C for C+BAPE (P), and 300.0 °C for C+MELA (P). The decomposition of the porous structures of the materials occurred in two mass losses in a wider temperature interval up to 700 °C, which is higher than in the case of hydrothermal products. However, due to the undefined composition of the materials caused by the further development of the carbon matrix during pyrolysis (see Section 3.3), it was not possible to assign individual weight losses clearly.

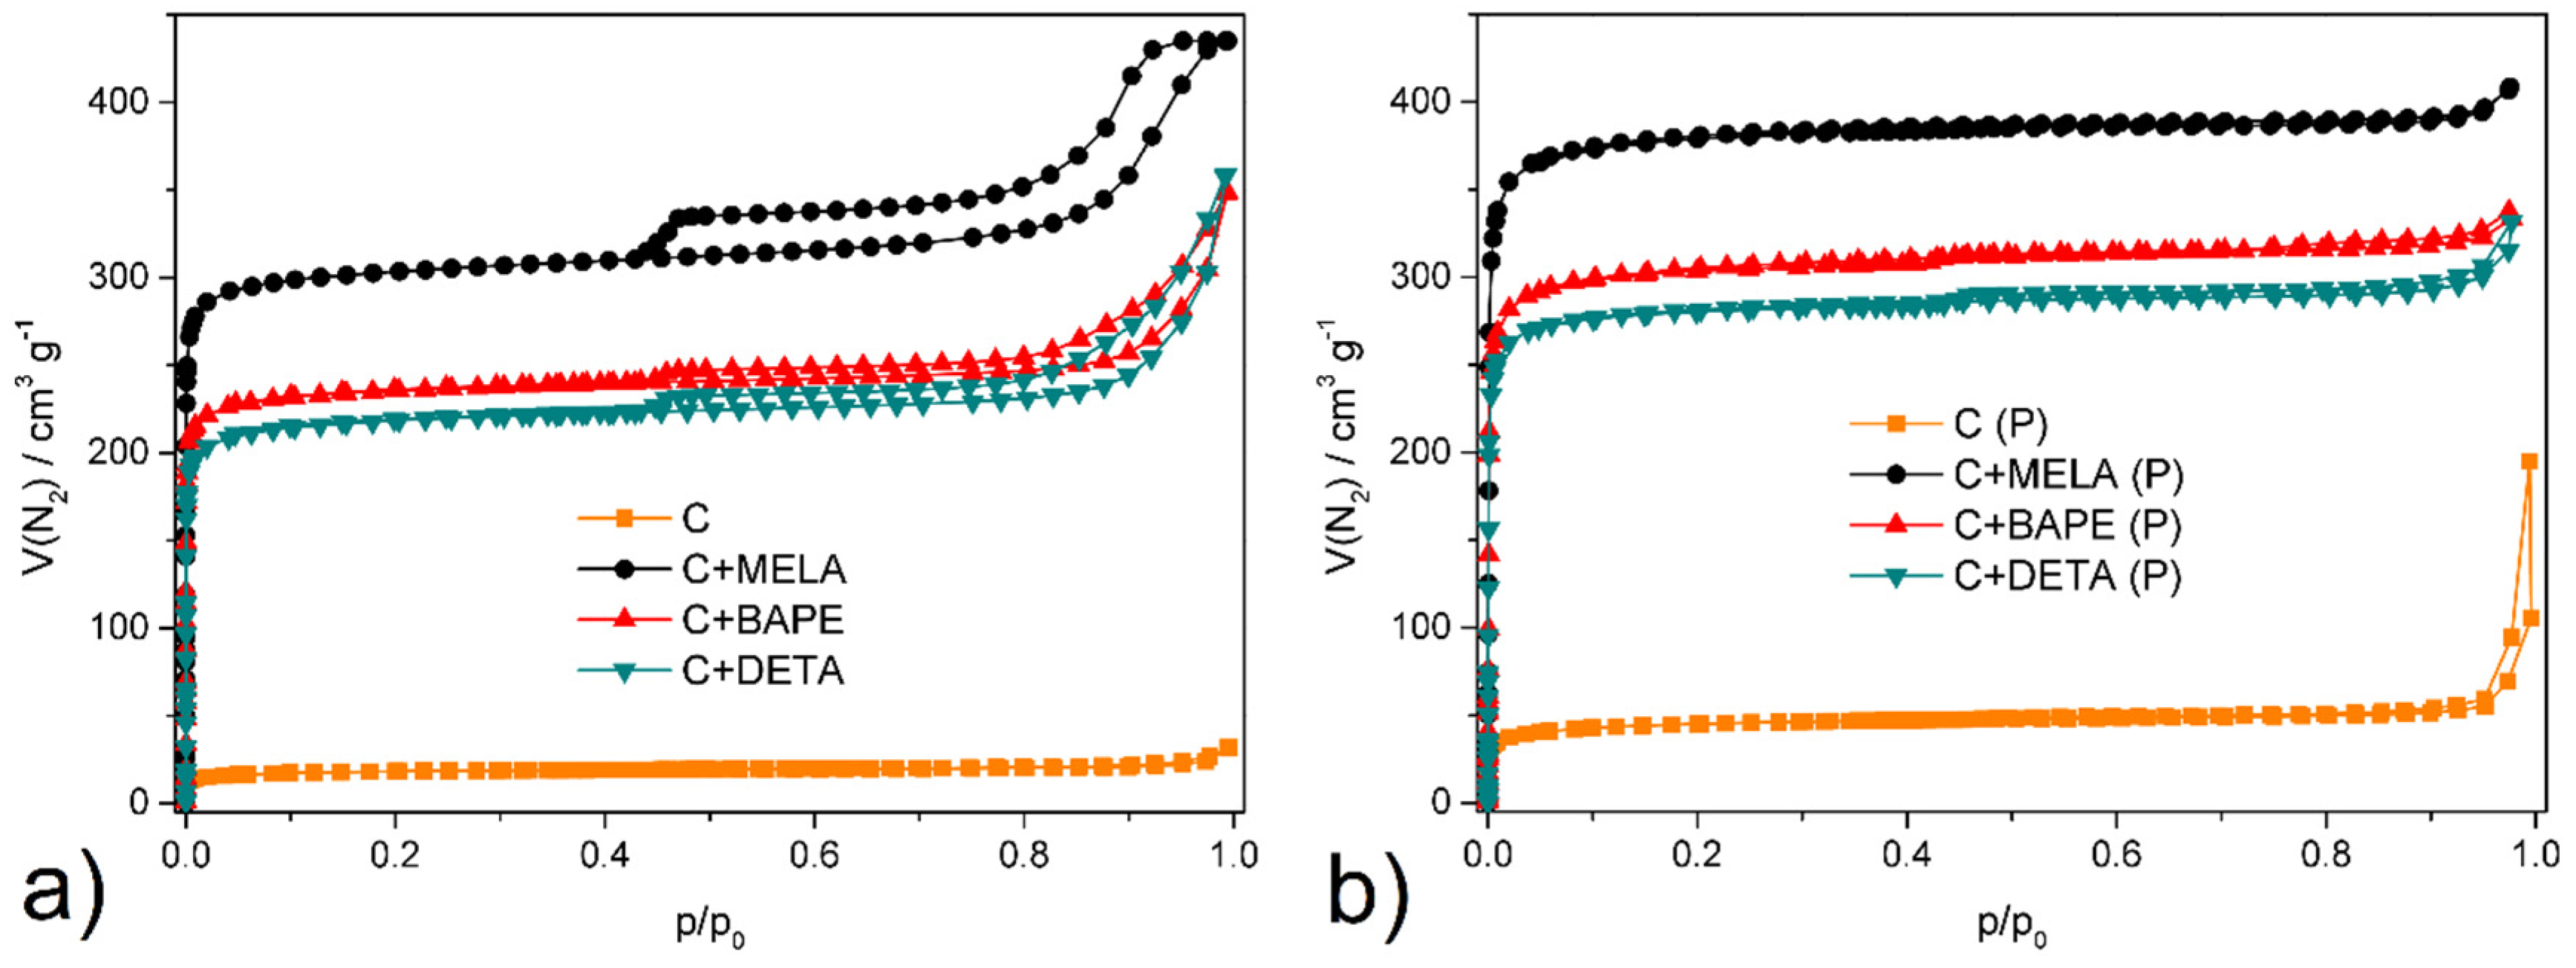
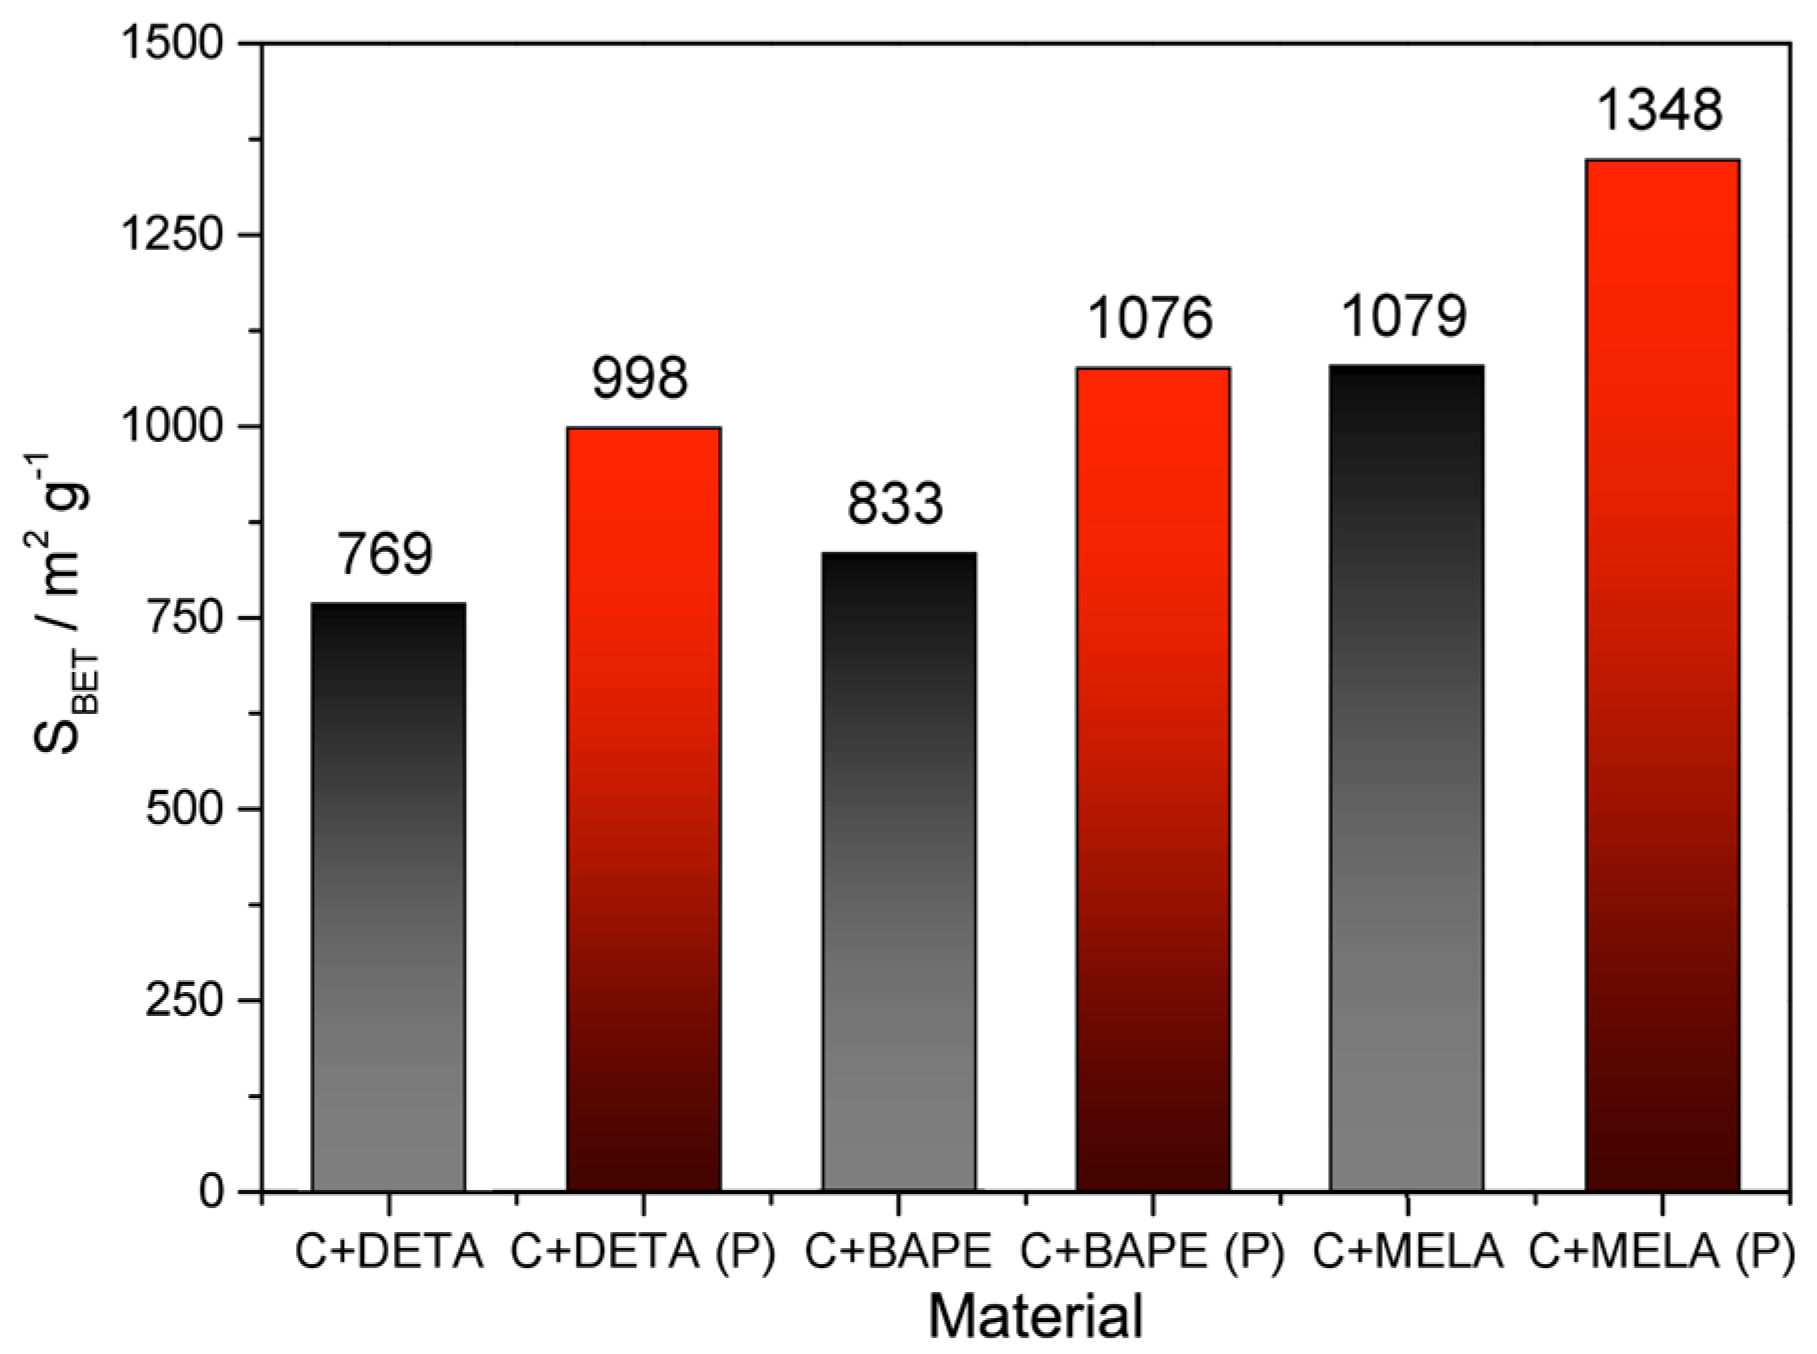
2.4. Textural Properties
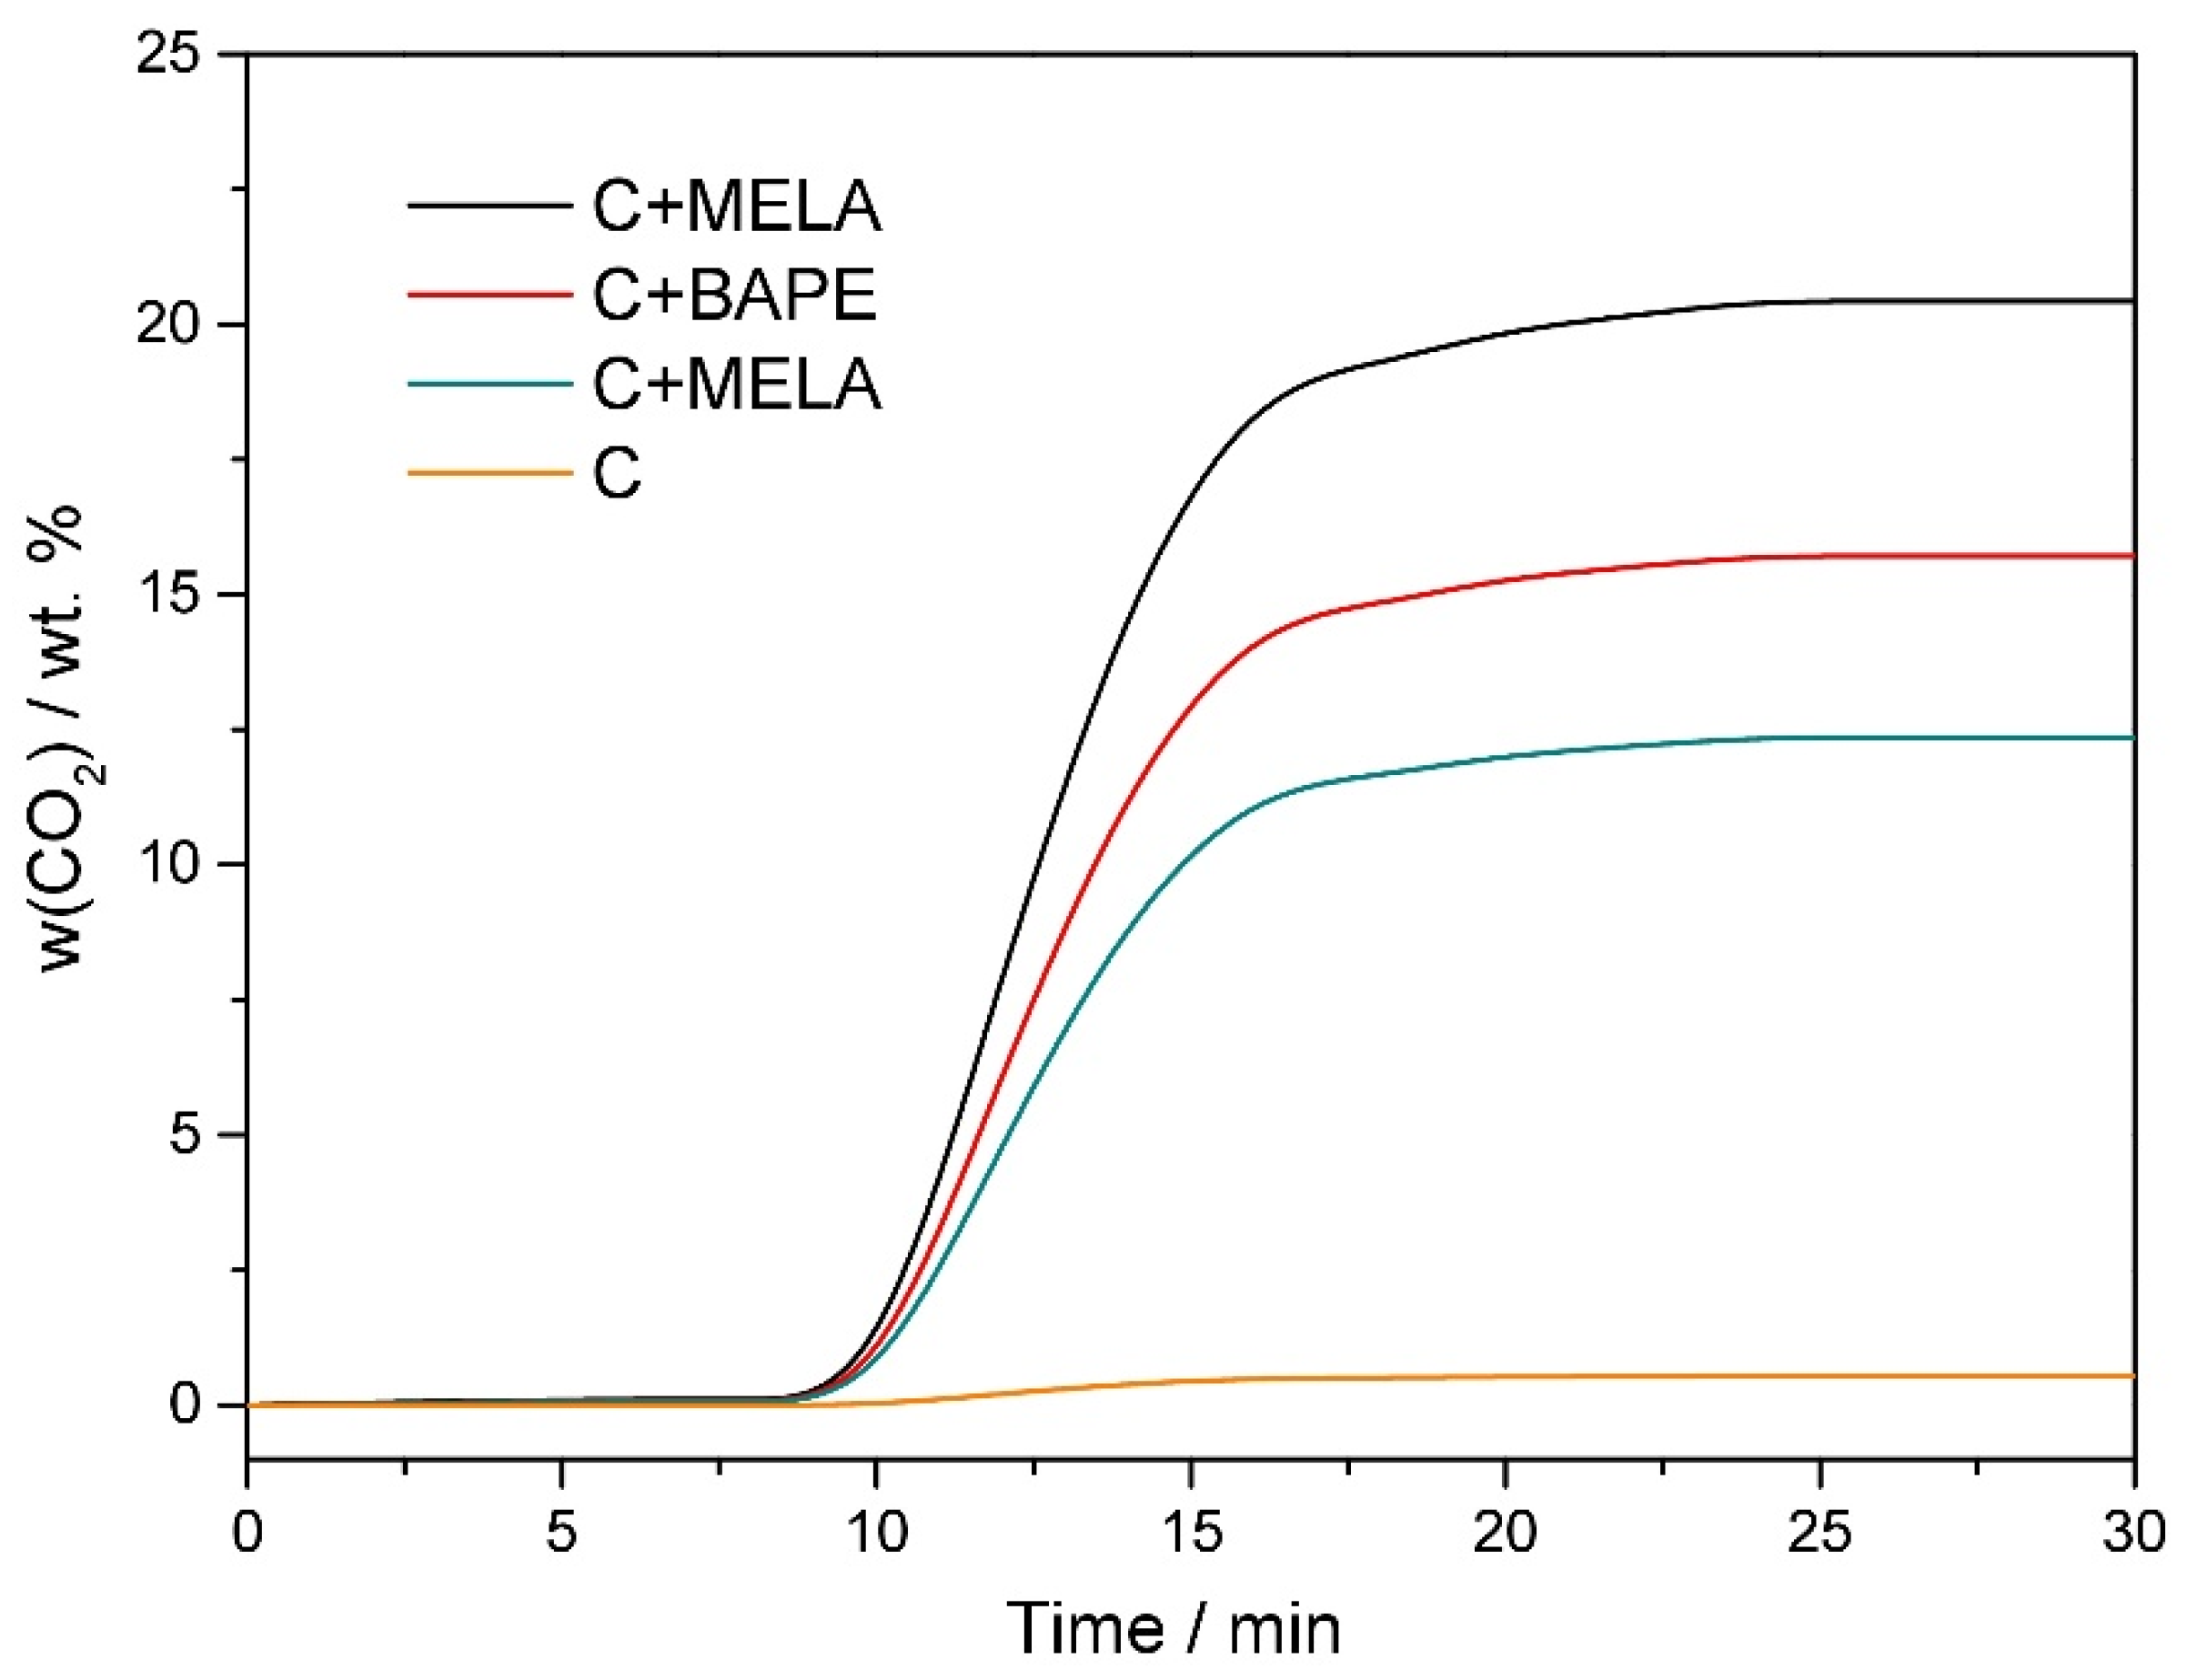
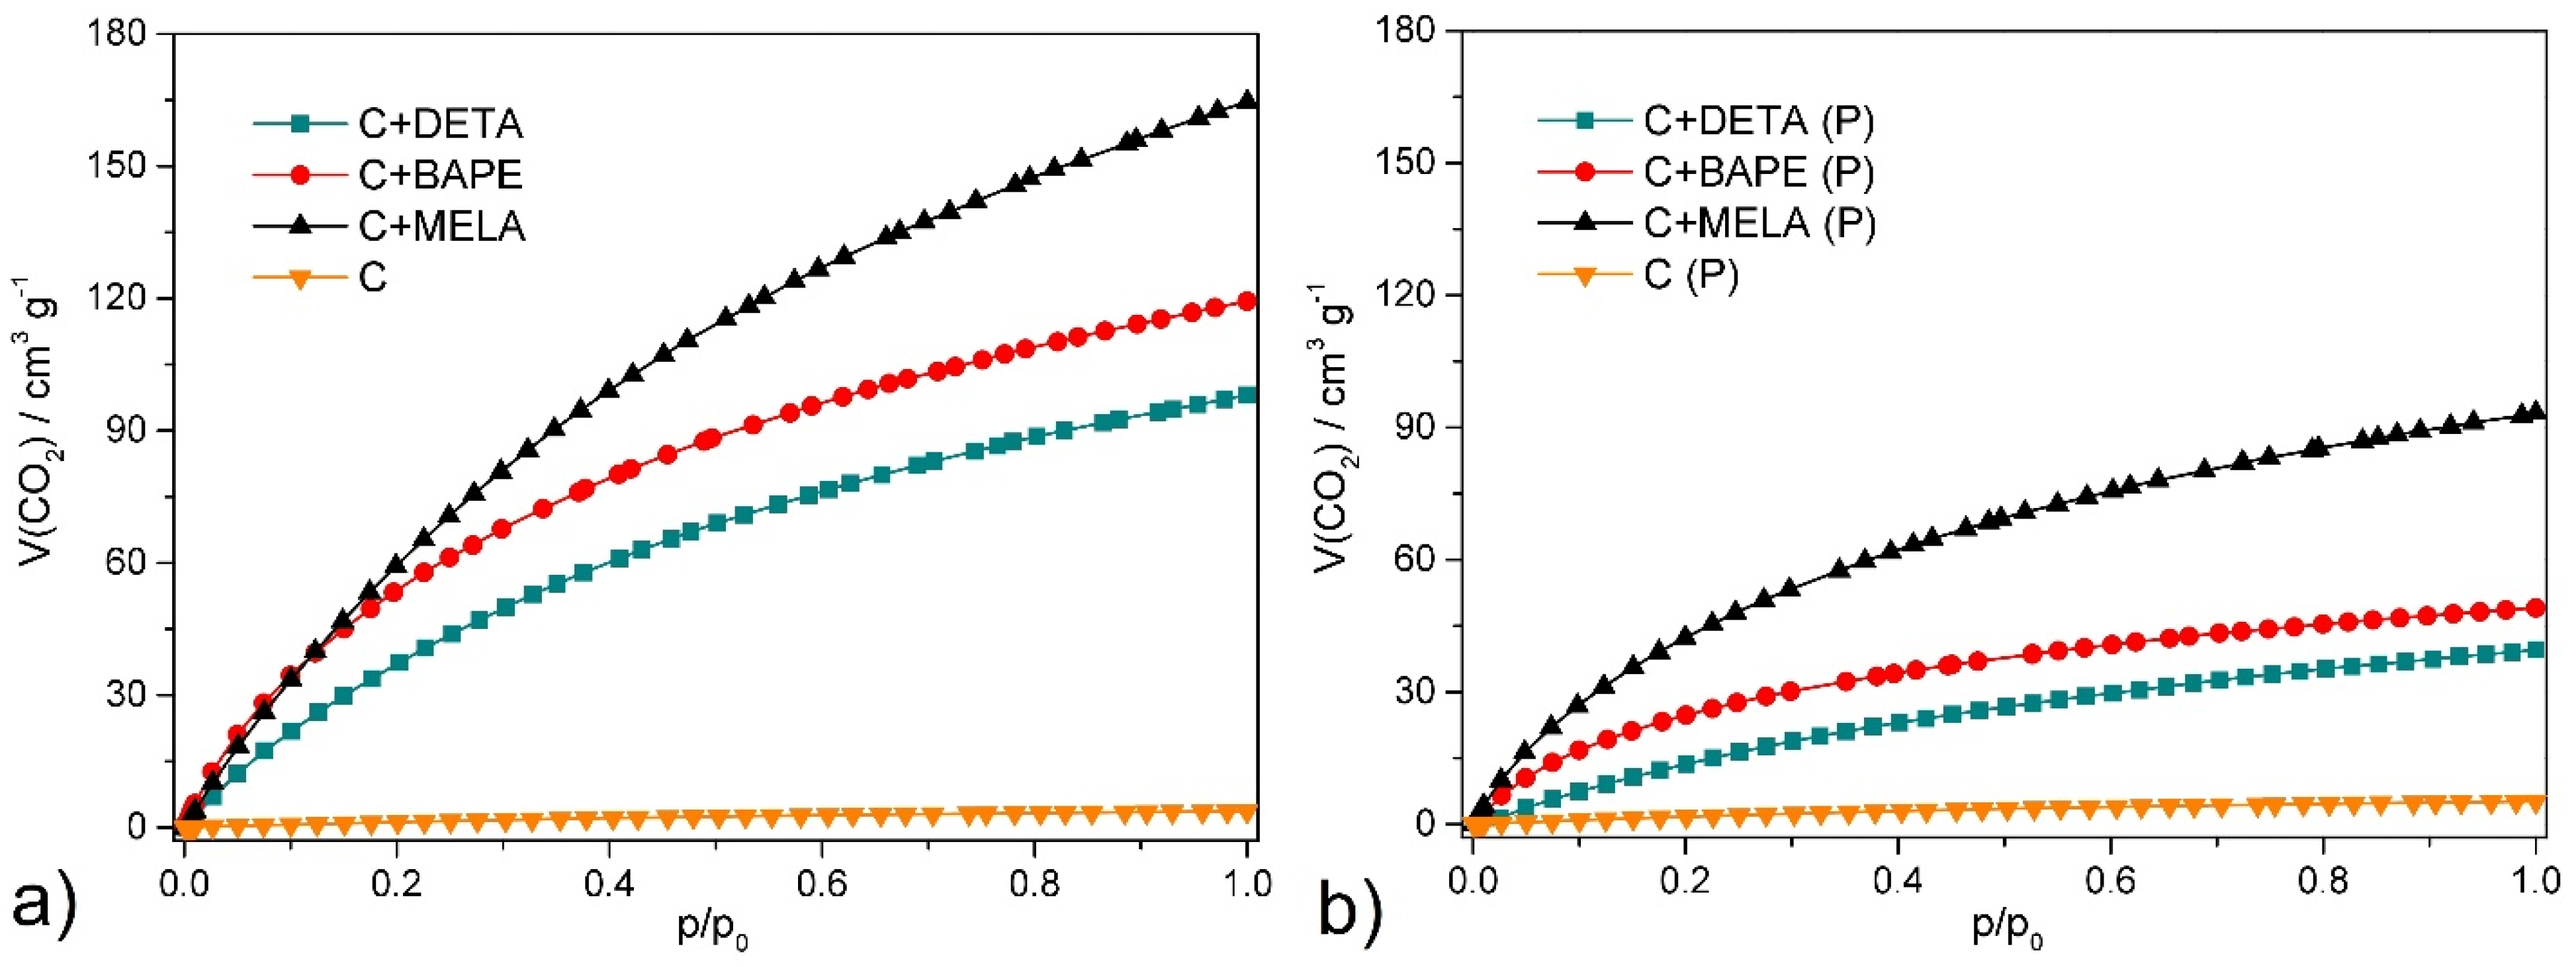
In order to evaluate the porosity and textural properties of the prepared APCs, N2 adsorption/desorption measurements were carried out at −196 °C and in a relative pressure range of 0–1. The values for specific surface areas were determined by the BET method, and pore volumes were calculated using NLDFT.
As seen in Figure 6a, N2 adsorption/desorption isotherms for hydrothermal products can be classified as type I with H5 hysteresis, which indicates reversible micropore filling followed by multilayer physisorption [49]. These observations suggest that the adsorption of hydrothermal products proceeds predominantly on the non-microporous part of the sorbent. As indicated in Figure 6b, N2 isotherms for thermal products can be classified as type I, with H4 hysteresis caused by capillary condensation of nitrogen in mesopores [50]. Such loops are characteristic of chemically activated carbonaceous materials and suggest well-developed micro- and mesoporosity of the APCs prepared via thermal activation [51,52].
In terms of BET surface areas (SBET) and pore volumes (Vp, see Table 3), more enhanced degrees of porosity were observed on the thermal samples, with the highest values of 1348 m2 g−1 and 0.628 cm3 g−1 being reported on melamine-containing material, followed by samples doped with 1,2-bis(3-aminopropylamino)ethane (1076 m2 g−1; 0.502 cm3 g−1) and diethylenetriamine (998 m2 g−1; 0.488 cm3 g−1). This can be attributed mainly to KOH chemical activation promoting the formation of micro- and mesoporous-activated carbon [53]. The hydrothermal samples displayed well-developed porosity as well, with smaller surface areas compared to the pyrolysed products. The most significant values were observed on melamine APC (1079 m2 g−1; 0.511 cm3 g−1), followed by 1,2-bis(3-aminopropylamino)ethane (833 m2 g−1; 0.473 cm3 g−1) and diethylenetriamine (769 m2 g−1; 0.378 cm3 g−1). Therefore, it can be concluded that, in terms of textural properties, thermal activation led to a significant enhancement of specific surface area values, as seen in Figure 7 and Table 3.
For comparison, hydrothermal (C) and thermal (C (P)) cellulose were prepared without the addition of amine under the same synthetic conditions. As can be seen from Figure 6, the prepared compounds adsorbed only small amounts of nitrogen, and the determined surface areas of 32 m2 g−1 for C and 121 m2 g−1 for C (P) are several times lower than for the amine-modified materials. The obtained values of SBET for both materials are comparable with the cellulosic materials reported in [54]. The described results confirm that amines effectively cross-link the polymeric chains of cellulose during synthesis, which leads to the formation of materials with more developed porosity and better textural properties (see comparison in Table 3).

2.5. CO2 Adsorption

All prepared APCs were subjected to CO2 adsorption at 0 °C at 1 bar. The values of adsorbed carbon dioxide volume in cm3 g−1, amount of adsorbed CO2 in mmol g−1, and weight percent in wt. % are summarised in Table 4. The corresponding CO2 adsorption isotherms of the hydrothermal and thermal products are depicted in Figure 8. The isotherms were identified as type I according to the IUPAC classification [55]. As indicated in Figure 8, the CO2 uptake generally increases at higher adsorption pressure. Despite lower values of specific surface area and pore volume, the hydrothermal products displayed higher adsorption capacity, which suggests a nonlinear relationship between BET surface area and adsorption capacity for the prepared biomass-based activated carbons. The high CO2 uptake of the hydrothermal products can be attributed to their high amine (nitrogen) content, as indicated by CHN/O analysis (see Table 1), which serve as the main adsorption sites for CO2 molecules [56,57]. The highest adsorption capacity of 32.3 wt. % was recorded on melamine-containing hydrothermal APC (C+MELA), which represents one of the highest CO2 uptakes measured on biomass-derived APCs yet reported in the literature (see Table 5 for comparison). High respective adsorption capacities of 23.46 wt. % and 19.28 wt. % were measured for C+BAPE and C+DETA as well.
In terms of CO2 uptake improvement, the prepared activated carbons can be ranked in the following order: C+MELA (32.30 wt. %) > C+BAPE (23.46 wt. %) > C+DETA (19.28 wt. %) > C+MELA (P) (18.31 wt. %) > C+BAPE (P) (9.64 wt. %) > C+DETA (P) (7.75 wt. %). In the hydrothermal and thermal samples (see Table 4), the following trend among the two carbons can be observed: the adsorption capacity increases with the increasing number of amine groups (nitrogen atoms) in the formula of amine used as an in situ N-modifying agent. This proves that the CO2 uptake is dependent on the basicity of the materials, which significantly contributes to the polarisation of the non-polar (but with quadrupole moment 14.3 × 1040 C m2) and slightly acidic CO2 molecules [58]. This was further confirmed by adsorption measurements of carbon dioxide on hydrothermal (C) and pyrolysed (C (P)) cellulose, for which the resulting CO2 adsorption capacities were 0.17 wt. % and 0.23 wt. %, respectively, at 0 °C and 1 bar (see Figure 8 and Table 4). The opposite trend was observed for these materials; thus, the pyrolysed material showed better CO2 adsorption properties than the hydrothermal product. This observation can be explained by the absence of primary absorption sites for CO2 in the form of amine groups. In such materials, an almost linear relationship between the specific surface area (SBET) and CO2 adsorption capacity is often observed, i.e., the amount of CO2 adsorbed increases as the SBET value increases [59].
Table 5. Summary of CO2 adsorption capacity measured on selected biomass-derived APCs at 0 °C and 1 bar.
Precursor of APCsActivation Activating Agent Activation Method SBET
(m2 g−1)
Adsorption Capacity at 0 °C and 1 Bar (mmol)References
Peanut shell charchemicalKOHhomogenisation17137.25[60]
Black locust chemicalKOHimpregnation 20647.19[61]
Fern Leaves chemicalKOH/CO2impregnation 9376.77[62]
Pine ConechemicalKOH impregnation 17876.57[63]
Arundo donax chemicalKOHhomogenisation 11226.30[64]
Pomegranate peelschemicalKOHimpregnation 5856.03[65]
Rice husk chemicalKOHhomogenisation14865.83[66]
Coconut ShellchemicalCO2impregnation 13275.60[67]
Sugarcane bagassechemicalLiOHhomogenisation11495.50[68]
Palm sheath chemicalKOHhomogenisation 10525.28[69]
In addition to the volumetric method described above, the CO2 capture ability of the materials was measured by the gravimetric method at 25 °C, with the obtained results shown in Figure 9. Only hydrothermal samples were subjected to these measurements, as they displayed higher CO2 adsorption capacity compared to the thermal materials. The hydrothermal APCs were initially thermally activated at 110 °C under an inert argon atmosphere and subsequently cooled to 25 °C. Upon introducing CO2 gas flow (20 cm3 min−1) after 7 min of the experiment, a rapid mass increase was observed due to the capture of CO2 molecules by the amine active sites of the modified samples or their pores. The total amount of adsorbed CO2 was 20.43 wt. % for C+MELA, 15.72 wt. % for C+BAPE, 12.36 wt. % for C+DETA, and 0.64 wt. % for C. It should be noted that the obtained values from thermogravimetric CO2 adsorption are lower compared to the values from the volumetric method. This can be attributed to the temperature difference under which experiments proceeded (0 °C for the volumetric and 25 °C for the gravimetric methods). Because the adsorption phenomenon is an exothermic process, the amount of adsorbed gas generally decreases with increasing temperature. The temperature of 25 °C was intentionally chosen to test the material’s applicability for CO2 capture under standard and real conditions.
As seen in Figure 9, a significant mass increase in the samples could be observed in the 7–15 min range upon exposure to CO2 gas, suggesting successful adherence of CO2 molecules to the surface of APCs. The increase in weight occurs from the seventh minute of the experiment because in the time interval 0–7 min the flow of argon was turned on, then the supply of Ar was turned off and the flow of gaseous carbon dioxide was turned on (time interval 7–30 min). It is possible to observe from the thermogravimetric adsorption curves that equilibrium was reached after 15 min of constant CO2 flow, as indicated by the flat plateau.

2.6. Recyclability

The recyclability of C+MELA, the material which displayed the highest carbon dioxide adsorption capacity of 32.3 wt. % at 0 °C and 1 bar and 20.43 wt. % at 25 °C, was investigated via thermal regeneration at 110 °C (Figure 10a) and argon purging (Figure 10b). The sample showed high recyclability in both cases and retained a constant adsorption capacity (20.43 wt. %) after five adsorption/desorption cycles.
The material was regenerated entirely through thermal regeneration at 110 °C, as indicated by a mass residue of zero on the TG curve (see Figure 10a). In the case of argon purging realised at 25 °C, the compound showed high retainability leading to only partial regeneration of the sample, as indicated by a partial residue (~7 wt. %) in the desorption process (see Figure 10b). This can be attributed to the formation of carbamates caused by the reactions between the primary/secondary amines on the surface of the APC and the CO2 molecules, resulting in the formation of covalent bonds (chemisorption).
The sorption process can be divided into physisorption and chemisorption. During physisorption, adsorbates interact with the surface of adsorbent through weaker intermolecular interactions. During chemisorption, the adsorbate chemically reacts with the adsorbent to form a strong covalent bond. In C+MELA, both processes proceed simultaneously. Chemisorption of CO2 took place on amine groups under formation of carbamates, whereas physisorption occurred on the sample’s porous surface (1079 m2 g−1). Thermal regeneration at 110 °C managed to both completely remove the physisorbed/chemisorbed CO2 molecules from the pores and decompose carbamates, resulting in complete desorption of CO2. On the other hand, argon purging did not provide sufficiently strong energy flow to break the covalent bonds in carbamates. However, though insufficient to remove chemisorbed CO2 molecules, it was able to remove the physisorbed CO2 from the pores. For this reason, the TG curve in Figure 10b shows a partial residue (approx. 7 wt. %), which can be attributed to the mass of chemically bonded CO2 to melamine molecules within the C+MELA framework.

3. Experimental

3.1. Materials

Microcrystalline cellulose (99% pure; Central Chem, Charlotte, NA, USA) was used as the primary precursor for the synthesis of activated porous carbons. Diethylenetriamine (99% pure; Fisher Scientific, Waltham, MA, USA), 1,2-bis(3-aminopropylamino)ethane (94% pure; Sigma Aldrich, St. Louis, MO, USA), and melamine (99% pure; Sigma Aldrich) were employed as N-doping modifiers. KOH pellets (95% pure), KBr (≥99%; Sigma Aldrich), and HCl solution (35%; Central Chem) were used during the chemical activation.

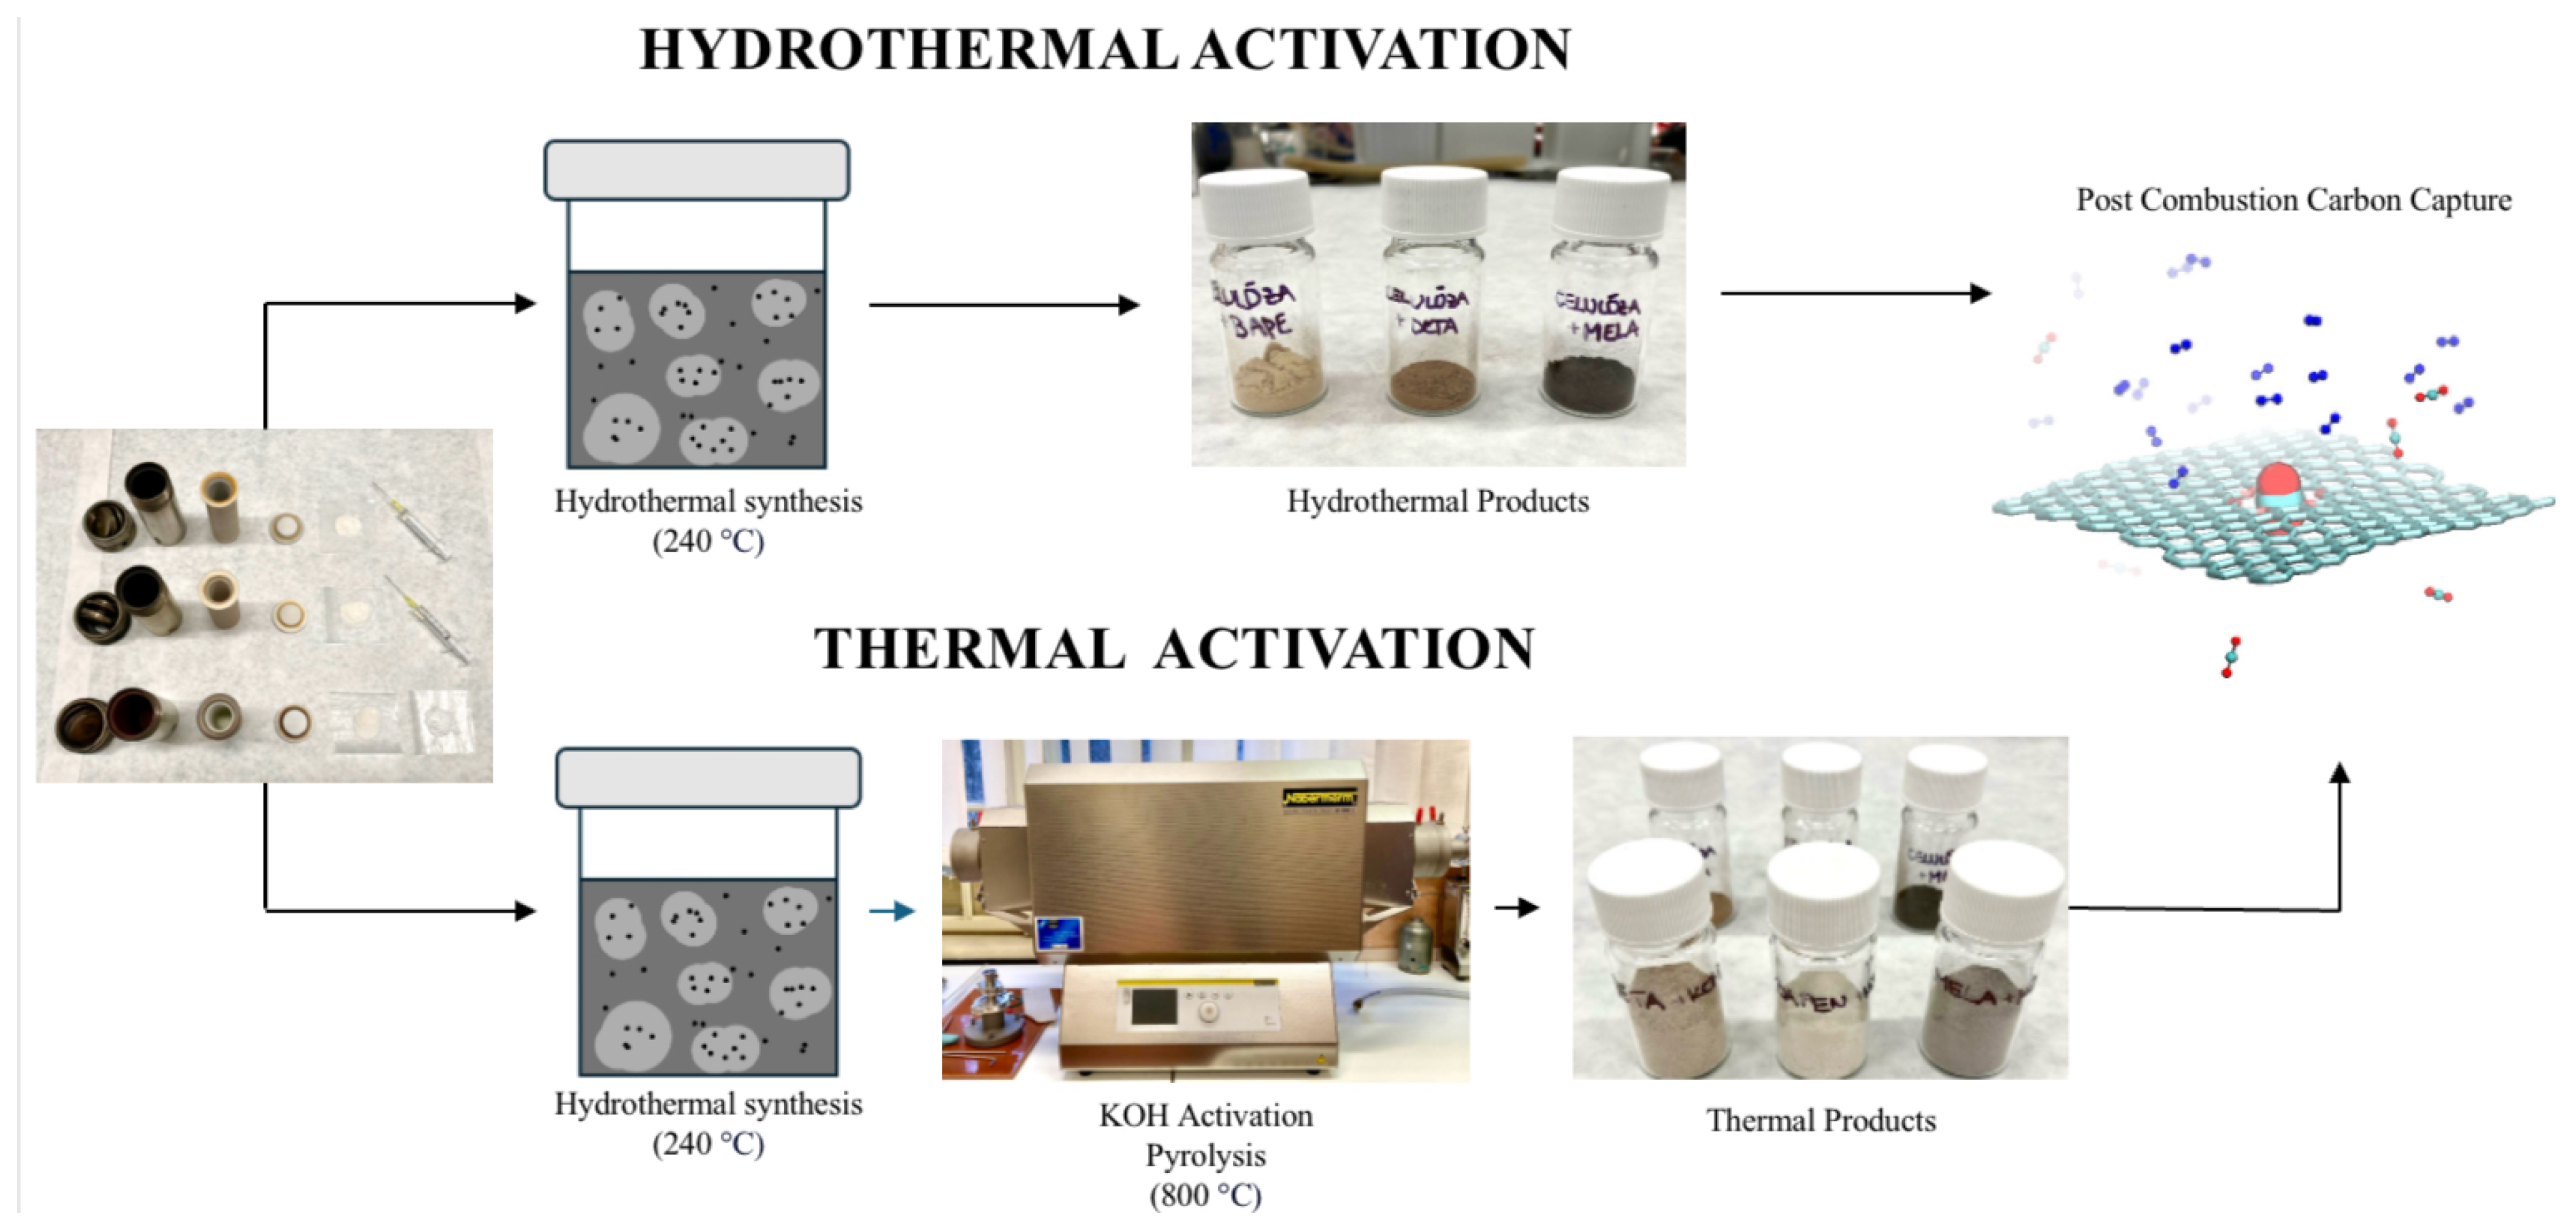
3.2. Preparation of Hydrothermal Activated Carbons

Figure 11 illustrates the synthesis of cellulose–amine porous materials. Hydrothermal samples (see Figure 1, up) were prepared by mixing 1.3 g (8.02 mmol) of microcrystalline cellulose and 1.3 g of certain amines (diethylenetriamine (DETA) 12.60 mmol, 1,2-bis(3-aminopropylamino)ethane (BAPE) 7.46 mmol, and melamine (MELA) 10.31 mmol), which were placed in lined steel Parr autoclaves with 45 mL volume. Then, 27 mL of deionised water (DI) was added to the autoclaves using a pipette. The reaction vessels were sealed and placed into an oven to undergo hydrothermal activation at 240 °C for 8 h at a heating rate of 3 °C min−1 with subsequent cooling at 1 °C min−1. After cooling, the suspensions were washed with DI water using the Büchner funnel and dried at 120 °C in the oven overnight. The resulting hydrothermal products were denoted as C+DETA, C+BAPE, and C+MELA, yielding 0.49 g, 0.86 g, and 1.03 g, respectively.

3.3. Preparation of Pyrolysed Activated Carbons

The synthesis of thermal products consisted of the same initial hydrothermal activation and drying process as described above, followed by KOH chemical activation and pyrolysis (see Figure 1 down). For each sample, 0.9 g of potassium hydroxide was transferred to a pestle and mortar, where it was manually homogenised and mixed with 0.3 g of hydrothermal product in a 3:1 mass ratio. The prepared mixture was then placed into ceramic crucibles and transferred to an insulated tube furnace (Nabertherm), where the mixtures were pyrolysed under an inert gaseous environment (Ar) at 800 °C and heating rate of 3 °C min−1. This temperature was maintained for 1 h, after which the samples were cooled to the ambient temperature. After thermo-chemical treatment, the materials were washed with DI water multiple times to remove KOH residue and then mixed with diluted HCl solution. This purification process consisted of the following steps. Initially, the prepared materials were mixed with 40 mL of DI water, transferred to a plastic vial, and placed in the centrifuge. The liquid and solid phases of the suspension were separated at 3500 rpm for 10 min. Subsequently, the materials were mixed with 40 mL of deionised water and neutralised with a small amount of HCl solution until a neutral pH was attained. Solid materials were filtered using a Büchner funnel and dried at 80 °C for 18 h. The prepared products were ground and denoted in the study as C+DETA (P), C+BAPE (P), C+MELA (P).

3.4. Characterisation of Activated Porous Carbons

The chemical composition of the compounds was determined using a CHN/O elemental analyser (Vario MICRO, Elemental Analysensysteme GmbH, Langenselbold, Germany). The oxygen content was calculated for each sample as the difference between 100% and the weight percentage sum of C, H, and N elements.
The chemical composition of the prepared APCs was studied by infrared spectroscopy at room temperature after gradually heating the compounds to selected temperatures (50, 100, 150, 200, 250, 300, 350, 400, 450, 500, 550, 600, 650 and 700 °C) using an Avatar 6700 FT-IR spectrometer in the range of wavenumbers 4000–400 cm−1. The samples were prepared as KBr tablets with a mass ratio of 1/100 (compound/KBr) and measured using the transmission technique. Before measurements were taken, KBr was dried at 700 °C to remove water moisture from the compound. KBr tablets were heated to the selected temperatures for 10 min for heating IR spectroscopy, then cooled to ambient temperature and measured. For each spectrum, 32 repetitions of scans were recorded with a resolution of 4 cm−1. The infrared spectra of the materials at room temperature were measured on the same instrument using the ATR (attenuated total reflectance) technique by the method of reflection on a diamond crystal. For each spectrum, 64 repetitions of scans were recorded with a resolution of 4 cm−1.
Thermal stability was investigated by thermogravimetry (TG) in an air atmosphere (60 cm3 min−1) with a heating rate of 10 °C min−1 and in a temperature range of 20–700 °C. Prior to the measurements, the samples were manually homogenised using pestle and mortar and then transferred to corundum (Al2O3) crucibles. TG curves were measured with a STA 449 F3 Jupiter Thermal Analyzer (Netzsch, Germany). The weights of the analysed samples were in the range of 10–20 mg.
Morphological aspects of the prepared products were studied using a field emission scanning electron microscope (JEOL JSM-7000F, Peabody, MA, USA). The powdered samples were compressed into cylindrical tablets and attached to the metal holder. The materials were then inserted into a microscope and evacuated. Subsequently, images of the materials with a magnification of 2500 were collected.
Textural properties of the prepared APCs were investigated by nitrogen adsorption/desorption measurements at −196 °C on an ASAP 2020 Plus analyser (Micromeritics, GA, USA) within a N2 relative pressure (p/p0) range of 10−5—1. Prior to the experiments, the samples were outgassed for 12 h under vacuum at 150 °C. Their porosity was evaluated by obtaining the Brunauer–Emmett–Teller specific surface area (SBET) [70] and respecting Rouquerols’s consistency criteria [55,71]. Pore size distributions were calculated by fitting the experimental adsorption data with the NLDFT (Non-Local Density Functional Theory) adsorption kernel.
The CO2 uptake of the prepared materials was evaluated on an ASAP 2020 Plus analyser (Micromeritics) and a STA 449 F3 Jupiter Thermal Analyzer via volumetric and thermogravimetric analysis at 0 and 25 °C, respectively, using high-purity CO2 (99.9995%) purchased from the Linde Gas Company. Degassing of materials and measurement of CO2 adsorption by the volumetric method was performed as described above for N2 adsorption/desorption measurements. After volumetric measurements, thermogravimetric experiments were carried out with the same already degassed samples; therefore, a lower activation temperature was applied. Prior to thermogravimetric measurements, the samples were thermally activated at 110 °C and subsequently cooled under argon atmosphere to 25 °C. During the thermogravimetric measurements, the flow rate of CO2 and Ar was 20 cm−3 min−1. The setup of the experiment was as follows: in the time interval 0–7 min, the flow of argon was turned on; in seventh minute, the supply of Ar was turned off; and in the time interval 7–30 min, the flow of carbon dioxide was turned on.
The recyclability of the sample with the highest CO2 adsorption capacity (C+MELA) was investigated in five adsorption/desorption measurement cycles using argon purging and thermal regeneration. In thermal regeneration, the sample was first saturated with pure CO2 gas (20 cm−3 min−1) during the adsorption process; then, during the desorption, the material was thermally activated at 110 °C. Because thermal regeneration is considered energetically demanding, the material’s recyclability was investigated using argon purging (20 cm−3 min−1), during which the sample was exposed to the flow of pure CO2 gas during adsorption and subsequently purged with Ar gas during the desorption process.

4. Conclusions

In this work, the effect of the activation method on the development of the physicochemical properties and CO2 adsorption capacity of activated porous carbons was investigated. It was found that while thermal activation led to significant enhancement of the textural properties of the materials, high activation temperatures applied during pyrolysis resulted in a notable decrease in the content of amines (nitrogen), which in turn led to weakened affinity for CO2 molecules, resulting in lower adsorption capacity. On the other hand, one-step hydrothermal activation resulted in the development of highly porous products with significantly greater CO2 adsorption capacities at temperatures of both 0 and 25 °C. Therefore, it can be concluded that hydrothermal activation represents a promising approach to addressing the environmental and economic impacts associated with the synthesis of biomass-based porous materials for CO2 capture.
The highest CO2 adsorption capacity of 32.3 wt. % was reported on melamine-containing activated carbon (C+MELA) at 0 °C and 1 bar. In addition to effective capturing ability, this sample displayed a well developed porous matrix, low production cost, and high recyclability, which in the case of application for large-scale CO2 capture can significantly reduce industrial expenses related to material purchase and waste regulation.
In summary, the application of biomass cellulose precursor and N-doping modifiers with high nitrogen content enabled the preparation of APC sorbents with remarkable CO2-capturing ability and recyclability. The newly developed C+MELA APC synthesised through a facile one-step hydrothermal method outperformed many of the high-performing activated-carbon sorbents reported in the literature in terms of selective CO2 capture. Additionally, this sample displayed a high level of sustainability and regenerability, which can significantly lower the cost of the post-combustion capture process. Therefore, this study presents a new approach to the preparation of solid-based CO2 capture materials and demonstrates that the proper selection of precursor, modifiers, activation method, and synthesis conditions is vital for the development of effective, low-cost, and recyclable CO2 adsorbents.

Supplementary Materials

The following supporting information can be downloaded at: https://www.mdpi.com/article/10.3390/molecules29051158/s1, Table S1: The identification of notable mass decreases of the hydrothermal APCs in particular temperature intervals.

Author Contributions

S.K.: conceptualization, data curation, formal analysis, investigation, methodology, validation, writing—original draft; M.A.: conceptualization, data curation, formal analysis, funding acquisition, investigation, project administration, methodology, supervision, validation, writing—original draft, writing—review and editing. All authors have read and agreed to the published version of the manuscript.

Funding

This work was funded by the following projects: APVV SK-CZ-RD-21–0068 and LUASK22049 (INTER-EXCELLENCE II, MŠMT).

Data Availability Statement

The data presented in this study are available in article and Supplementary Materials.

Acknowledgments

The present work was performed by Sarah Krupšová as part of the student scientific work in the laboratories and under supervision of Miroslav Almáši at the Pavol Jozef Šafárik University in Košice, Slovak Republic.

Conflicts of Interest

The authors report no potential conflicts of interest.

References

  1. Langsdorf, S.; Löschke, S.; Möller, V.; Okem, A.; Rama, B.; Belling, D.; Dieck, W.; Götze, S.; Kersher, T.; Mangele, P.; et al. Climate Change 2022: Impacts, Adaptation and Vulnerability; Working Group II Contribution to the Sixth Assessment Report of the Intergovernmental Panel on Climate Change; Cambridge University Press: Cambridge, UK, 2022; Volume 1. [Google Scholar] [CrossRef]
  2. Masson-Delmotte, V.; Zhai, P.; Pirani, A.; Connors, S.; Péan, C.; Chen, Y.; Goldfarb, L.; Gomis, M.; Matthews, J.; Berger, S.; et al. The Physical Science Basis Working Group I Contribution to the Sixth Assessment Report of the Intergovernmental Panel on Climate Change Edited By. In Climate Change 2021 The Physical Science Basis; Cambridge University Press: Cambridge, UK, 2021; Volume 2. [Google Scholar] [CrossRef]
  3. Rousset, N. The Impact of Climate Change, Water Security and the Implications for Agriculture. China Perspect. 2007, 2007, 30–38. [Google Scholar] [CrossRef]
  4. Bellard, C.; Bertelsmeier, C.; Leadley, P.; Thuiller, W.; Courchamp, F. Impacts of Climate Change on the Future of Biodiversity. Ecol. Lett. 2012, 15, 365–377. [Google Scholar] [CrossRef]
  5. Ofori, D.O.; Bandauko, E.; Kutor, S.K.; Odoi, A.; Asare, A.B.; Akyea, T.; Arku, G. A Systematic Review of International and Internal Climate-Induced Migration in Africa. Sustainability 2023, 15, 16105. [Google Scholar] [CrossRef]
  6. Hasaba, S. The Impact of Climate Change in the Developing World: Where Developing Countries Are Positioned in Climate Change Discussions. Int. J. Clim. Chang. Impacts Responses 2012, 3, 41–52. [Google Scholar] [CrossRef]
  7. Alo, A.O.; Baines, R.; Conway, J.; Cannon, N. The Impacts of Climate Change on Agriculture in Developing Countries: A Case Study of Oyo State, Nigeria. Int. J. Clim. Chang. Impacts Responses 2017, 9, 1–21. [Google Scholar] [CrossRef]
  8. Chinowsky, P.; Hayles, C.; Schweikert, A.; Strzepek, N.; Strzepek, K.; Schlosser, C.A. Climate Change: Comparative Impact on Developing and Developed Countries. Eng. Proj. Organ. J. 2011, 1, 67–80. [Google Scholar] [CrossRef]
  9. Bandilla, K.W. Carbon Capture and Storage. Future Energy 2020, 669–692. [Google Scholar] [CrossRef]
  10. Raganati, F.; Miccio, F.; Ammendola, P. Adsorption of Carbon Dioxide for Post-Combustion Capture: A Review. Energy Fuels 2021, 35, 12845–12868. [Google Scholar] [CrossRef]
  11. Almáši, M.; Zeleňák, V.; Gyepes, R.; Zauška, L.; Bourrelly, S. A Series of Four Novel Alkaline Earth Metal-Organic Frameworks Constructed of Ca(ii), Sr(ii), Ba(ii) Ions and Tetrahedral MTB Linker: Structural Diversity, Stability Study and Low/High-Pressure Gas Adsorption Properties. RSC Adv. 2020, 10, 32323–32334. [Google Scholar] [CrossRef] [PubMed]
  12. Azmi, N.Z.M.; Buthiyappan, A.; Raman, A.A.A.; Patah, M.F.A.; Sufian, S. Recent Advances in Biomass Based Activated Carbon for Carbon Dioxide Capture—A Review. J. Ind. Eng. Chem. 2022, 116, 1–20. [Google Scholar] [CrossRef]
  13. Meng, F.; Meng, Y.; Ju, T.; Han, S.; Lin, L.; Jiang, J. Research Progress of Aqueous Amine Solution for CO2 Capture: A Review. Renew. Sustain. Energy Rev. 2022, 168, 112902. [Google Scholar] [CrossRef]
  14. Rochelle, G.T. Thermal Degradation of Amines for CO2 Capture. Curr. Opin. Chem. Eng. 2012, 1, 183–190. [Google Scholar] [CrossRef]
  15. Kim, C.; Talapaneni, S.N.; Dai, L. Porous Carbon Materials for CO2 Capture, Storage and Electrochemical Conversion. Mater. Rep. Energy 2023, 3, 100199. [Google Scholar] [CrossRef]
  16. Zelenková, G.; Zelenka, T.; Almáši, M.; Soldánová, M. Graphene as a Promising Additive to Hierarchically Porous Carbon Monoliths for Enhanced H2 and CO2 Sorption. J. CO2 Util. 2023, 68, 102371. [Google Scholar] [CrossRef]
  17. Gao, Y.; He, X.; Mao, K.; Russell, C.K.; Toan, S.; Wang, A.; Chien, T.; Cheng, F.; Russell, A.G.; Zeng, X.C.; et al. Catalytic CO2 Capture via Ultrasonically Activating Dually Functionalised Carbon Nanotubes. ACS Nano 2023, 17, 8345–8354. [Google Scholar] [CrossRef] [PubMed]
  18. Flores, M.C.; De Souza Figueiredo, K.C. Asymmetric Oxygen-functionalised Carbon Nanotubes Dispersed in Polysulfone for CO2 Separation. J. Appl. Polym. Sci. 2022, 140, e53303. [Google Scholar] [CrossRef]
  19. Li, H.; Dilipkumar, A.; Abubakar, S.; Zhao, D. Covalent Organic Frameworks for CO2 Capture: From Laboratory Curiosity to Industry Implementation. Chem. Soc. Rev. 2023, 52, 6294–6329. [Google Scholar] [CrossRef] [PubMed]
  20. Das, N.; Paul, R.; Chatterjee, R.; Shinde, D.B.; Lai, Z.; Bhaumik, A.; Mondal, J. Tuning of Microenvironment in Covalent Organic Framework via Fluorination Strategy promotes Selective CO2 Capture. Chem. Asian J. 2023, 18, e202200970. [Google Scholar] [CrossRef]
  21. Garg, A.; Almáši, M.; Bednarčík, J.; Sharma, R.; Rao, V.S.; Panchal, P.; Jain, A.; Sharma, A. Gd(III) Metal-organic Framework as an Effective Humidity Sensor and its Hydrogen Adsorption Properties. Chemosphere 2022, 305, 135467. [Google Scholar] [CrossRef] [PubMed]
  22. Almáši, M.; Zeleňák, V.; Gyepes, R.; Zukal, A.; Čejka, J. Synthesis, Characterisation and Sorption Properties of Zinc(II) Metal–organic Framework Containing Methanetetrabenzoate Ligand. Colloids Surf. A Physicochem. Eng. Asp. 2013, 437, 101–107. [Google Scholar] [CrossRef]
  23. Király, N.; Capková, D.; Gyepes, R.; Vargová, N.; Kazda, T.; Bednarčík, J.; Yudina, D.; Zelenka, T.; Čudek, P.; Zeleňák, V.; et al. Sr(II) and Ba(II) Alkaline Earth Metal–Organic Frameworks (AE-MOFs) for Selective Gas Adsorption, Energy Storage, and Environmental Application. Nanomaterials 2023, 13, 234. [Google Scholar] [CrossRef]
  24. Capková, D.; Kazda, T.; Čech, O.; Király, N.; Zelenka, T.; Čudek, P.; Sharma, A.; Hornebecq, V.; Straková Fedorková, A.; Almáši, M. Influence of Metal-Organic Framework MOF-76(Gd) Activation/Carbonisation on the Cycle Performance Stability in Li-S Battery. J. Energy Storage 2022, 51, 104419. [Google Scholar] [CrossRef]
  25. Cavallo, M.; Dosa, M.; Porcaro, N.G.; Bonino, F.; Piumetti, M.; Crocellà, V. Shaped Natural and Synthetic Zeolites for CO2 Capture in a Wide Temperature Range. J. CO2 Util. 2023, 67, 102335. [Google Scholar] [CrossRef]
  26. Boer, D.G.; Langerak, J.; Pescarmona, P.P. Zeolites as Selective Adsorbents for CO2 Separation. ACS Appl. Energy Mater. 2023, 6, 2634–2656. [Google Scholar] [CrossRef]
  27. Fatemeh Bahmanzadegan; Mahyar Ashourzadeh Pordsari; Ghaemi, A. Improving the Efficiency of 4A-Zeolite Synthesised from Kaolin by Amine Functionalization for CO2 Capture. Sci. Rep. 2023, 13, 12533. [Google Scholar] [CrossRef]
  28. Borcănescu, S.; Popa, A.; Verdeş, O.; Suba, M. Functionalized Ordered Mesoporous MCM-48 Silica: Synthesis, Characterization and Adsorbent for CO2 capture. Int. J. Mol. Sci. 2023, 24, 10345. [Google Scholar] [CrossRef]
  29. Bisht, M.; Bhawna, B.; Singh, B.; Pandey, S. Deep Eutectic Solvent-modified Mesoporous Silica for CO2 Capture: A New Generation of Hybrid Sorbents. J. Mol. Liq. 2023, 384, 122203. [Google Scholar] [CrossRef]
  30. Zeleňák, V.; Badaničová, M.; Halamová, D.; Čejka, J.; Zukal, A.; Murafa, N.; Goerigk, G. Amine-Modified Ordered Mesoporous Silica: Effect of Pore Size on Carbon Dioxide Capture. Chem. Eng. J. 2008, 144, 336–342. [Google Scholar] [CrossRef]
  31. Krzyżak, A.; Habina-Skrzyniarz, I.; Machowski, G.; Mazur, W. Overcoming the Barriers to the Exploration of Nanoporous Shales Porosity. Microporous Mesoporous Mater. 2020, 298, 110003. [Google Scholar] [CrossRef]
  32. Pan, C.; Song, Y.; Wang, J.; Zhan, S.; Unluer, C.; Ruan, S. Unlocking the Role of Recycled Aggregates in the Performance Enhancement and CO2 Capture of Reactive Magnesia Cement Formulations. Cem. Concr. Res. 2023, 168, 107148. [Google Scholar] [CrossRef]
  33. Marques, L.M.; Mota, S.M.; Teixeira, P.; Pinheiro, C.I.C.; Matos, H.A. Ca-Looping Process Using Wastes of Marble Powders and Limestones for CO2 Capture from Real Flue Gas in the Cement Industry. J. CO2 Util. 2023, 71, 102450. [Google Scholar] [CrossRef]
  34. Lv, Q.; Zhou, T.; Luan, Y.; Zheng, R.; Guo, X.; Wang, X.; Hemmati-Sarapardeh, A. A Green Aqueous Foam Stabilized by Cellulose Nanofibrils and Camellia Saponin for Geological CO2 Sequestration. J. Clean. Prod. 2023, 406, 136980. [Google Scholar] [CrossRef]
  35. Rahma, N.A.; Kurniasari, A.; Pambudi, Y.D.S.; Bintang, H.M.; Zulfia, A.; Hudaya, C. Characteristics of Corncob-Originated Activated Carbon Using Two Different Chemical Agent. IOP Conf. Ser. Mater. Sci. Eng. 2019, 622, 012030. [Google Scholar] [CrossRef]
  36. Ahmed, A.S.; Alsultan, M.; Sabah, A.A.; Swiegers, G.F. Carbon Dioxide Adsorption by a High-Surface-Area Activated Charcoal. J. Compos. Sci. 2023, 7, 179. [Google Scholar] [CrossRef]
  37. Phothong, K.; Tangsathitkulchai, C.; Lawtae, P. The Analysis of Pore Development and Formation of Surface Functional Groups in Bamboo-Based Activated Carbon during CO2 Activation. Molecules 2021, 26, 5641. [Google Scholar] [CrossRef] [PubMed]
  38. Shafeeyan, M.S.; Daud, W.M.A.W.; Houshmand, A.; Shamiri, A. A Review on Surface Modification of Activated Carbon for Carbon Dioxide Adsorption. J. Anal. Appl. Pyrolysis 2010, 89, 143–151. [Google Scholar] [CrossRef]
  39. Sreńscek-Nazzal, J.; Kiełbasa, K. Advances in Modification of Commercial Activated Carbon for Enhancement of CO2 Capture. Appl. Surf. Sci. 2019, 494, 137–151. [Google Scholar] [CrossRef]
  40. Abuelnoor, N.; AlHajaj, A.; Khaleel, M.; Vega, L.F.; Abu-Zahra, M.R.M. Activated Carbons from Biomass-Based Sources for CO2 Capture Applications. Chemosphere 2021, 282, 131111. [Google Scholar] [CrossRef] [PubMed]
  41. Hack, J.; Maeda, N.; Meier, D.M. Review on CO2 Capture Using Amine-Functionalised Materials. ACS Omega 2022, 7, 39520–39530. [Google Scholar] [CrossRef] [PubMed]
  42. Zaker, A.; Hammouda, S.B.; Sun, J.; Wang, X.; Li, X.; Chen, Z. Carbon-based Materials for CO2 Capture: Their Production, Modification and Performance. J. Environ. Chem. Eng. 2023, 11, 109741. [Google Scholar] [CrossRef]
  43. Mohamed, M.G.; Ebrahium, S.M.; Hammam, A.S.; Kuo, S.-W.; Aly, K.I. Enhanced CO2 Capture in Nitrogen-Enriched Microporous Carbons Derived from Polybenzoxazines Containing Azobenzene and Carboxylic Acid Units. J. Polym. Res. 2020, 27, 1–12. [Google Scholar] [CrossRef]
  44. Shang, S.; Tao, Z.; Yang, C.; Hanif, A.; Li, L.; Tsang, D.C.; Gu, Q.; Shang, J. Facile Synthesis of CuBTC and its Graphene Oxide Composites as Efficient Adsorbents for CO2 Capture. Chem. Eng. J. 2020, 393, 124666. [Google Scholar] [CrossRef]
  45. Wang, Z.; Goyal, N.; Liu, L.; Tsang, D.C.; Shang, J.; Liu, W.; Li, G. N-doped porous carbon derived from polypyrrole for CO2 capture from humid flue gases. Chem. Eng. J. 2020, 396, 125376. [Google Scholar] [CrossRef]
  46. Li, J.; Michalkiewicz, B.; Min, J.; Ma, C.; Chen, X.; Gong, J.; Mijowska, E.; Tang, T. Selective Preparation of Biomass-derived Porous Carbon with Controllable Pore Sizes Toward Highly Efficient CO2 Capture. Chem. Eng. J. 2019, 360, 250–259. [Google Scholar] [CrossRef]
  47. Byrne, J.F.; Marsh, H. Porosity in Carbons: Characterisation and Applications; CDIAC, Carbon Dioxide Information Analysis Center: Bethel, PA, USA, 1995. [Google Scholar]
  48. Zauška, Ľ.; Bova, S.; Beňová, E.; Bednarčík, J.; Baláž, M.; Zeleňák, V.; Hornebecq, V.; Almáši, M. Thermosensitive Drug Delivery System SBA-15-PEI for Controlled Release of Nonsteroidal Anti-Inflammatory Drug Diclofenac Sodium Salt: A Comparative Study. Materials 2021, 14, 1880. [Google Scholar] [CrossRef]
  49. Sing, K.S.W.; Williams, R.T. Physisorption Hysteresis Loops and the Characterization of Nanoporous Materials. Adsorpt. Sci. Technol. 2004, 22, 773–782. [Google Scholar] [CrossRef]
  50. Melouki, R.; Ouadah, A.; Llewellyn, P.L. The CO2 Adsorption Behavior Study on Activated Carbon Synthesised from Olive Waste. J. CO2 Util. 2020, 42, 101292. [Google Scholar] [CrossRef]
  51. Bai, J.; Huang, J.; Yu, Q.; Demir, M.; Gecit, F.H.; Altay, B.N.; Wang, L.; Hu, X. One-pot Synthesis of Self S-doped Porous Carbon for Efficient CO2 Adsorption. Fuel Process. Technol. 2023, 244, 107700. [Google Scholar] [CrossRef]
  52. Rouquerol, J.; Avnir, D.; Fairbridge, C.W.; Everett, D.H.; Haynes, J.M.; Pernicone, N.; Ramsay, J.D.F.; Sing, K.S.W.; Unger, K.K. Recommendations for the Characterisation of Porous Solids (Technical Report). Pure Appl. Chem. 1994, 66, 1739–1758. [Google Scholar] [CrossRef]
  53. Paryanto; Wibowo, W.A.; Hantoko, D.; Saputro, M.E. Preparation of Activated Carbon from Mangrove Waste by KOH Chemical Activation. IOP Conf. Ser. Mater. Sci. Eng. 2019, 543, 012087. [Google Scholar] [CrossRef]
  54. Plachy, T.; Kutalkova, E.; Skoda, D.; Holcapkova, P. Transformation of Cellulose via Two-Step Carbonization to Conducting Carbonaceous Particles and Their Outstanding Electrorheological Performance. Int. J. Mol. Sci. 2022, 23, 5477. [Google Scholar] [CrossRef]
  55. Thommes, M.; Kaneko, K.; Neimark, A.V.; Olivier, J.P.; Rodriguez-Reinoso, F.; Rouquerol, J.; Sing, K.S.W. Physisorption of Gases, with Special Reference to the Evaluation of Surface Area and Pore Size Distribution (IUPAC Technical Report). Pure Appl. Chem. 2015, 87, 1051–1069. [Google Scholar] [CrossRef]
  56. Spessato, L.; Duarte, V.A.; Fonseca, J.M.; Arroyo, P.A.; Almeida, V.C. Nitrogen-Doped Activated Carbons with High Performances for CO2 Adsorption. J. CO2 Util. 2022, 61, 102013. [Google Scholar] [CrossRef]
  57. Zelenka, T.; Simanova, K.; Saini, R.; Zelenková, G.; Nehra, S.; Sharma, A.; Almáši, M. Carbon Dioxide and Hydrogen Adsorption Study on Surface-modified HKUST-1 with Diamine/triamine. Sci. Rep. 2022, 12, 17366. [Google Scholar] [CrossRef]
  58. Almáši, M.; Király, N.; Zeleňák, V.; Vilková, M.; Bourrelly, S. Zinc(ii) and Cadmium(ii) Amorphous Metal-organic Frameworks (aMOFs): Study of Activation Process and High-pressure Adsorption of Greenhouse Gases. RSC Adv. 2021, 11, 20137–20150. [Google Scholar] [CrossRef] [PubMed]
  59. Li, M.; Xiao, R. Preparation of a Dual Pore Structure Activated Carbon from Rice Husk Char as an Adsorbent for CO2 Capture. Fuel Process. Technol. 2019, 186, 35–39. [Google Scholar] [CrossRef]
  60. Li, D.; Tian, Y.; Li, L.; Li, J.; Zhang, H. Production of Highly Microporous Carbons with Large CO2 Uptakes at Atmospheric Pressure by KOH Activation of Peanut Shell Char. J. Porous Mater. 2015, 22, 1581–1588. [Google Scholar] [CrossRef]
  61. Zhang, C.; Song, W.; Ma, Q.; Xie, L.; Zhang, X.; Guo, H. Enhancement of CO2 Capture on Biomass-Based Carbon from Black Locust by KOH Activation and Ammonia Modification. Energy Fuels 2016, 30, 4181–4190. [Google Scholar] [CrossRef]
  62. Serafin, J.; Dziejarski, B.; Vendrell, X.; Kiełbasa, K.; Michalkiewicz, B. Biomass Waste Fern Leaves as a Material for a Sustainable Method of Activated Carbon Production for CO2 Capture. Biomass Bioenergy 2023, 175, 106880. [Google Scholar] [CrossRef]
  63. Kim, C.-H.; Lee, S.-Y.; Park, S.-J. Efficient Micropore Sizes for Carbon Dioxide Physisorption of Pine Cone-Based Carbonaceous Materials at Different Temperatures. J. CO2 Util. 2021, 54, 101770. [Google Scholar] [CrossRef]
  64. Singh, G.; Kim, I.Y.; Lakhi, K.S.; Joseph, S.; Srivastava, P.; Naidu, R.; Vinu, A. Heteroatom Functionalized Activated Porous Biocarbons and Their Excellent Performance for CO2 Capture at High Pressure. J. Mater. Chem. A Mater. Energy Sustain. 2017, 5, 21196–21204. [Google Scholar] [CrossRef]
  65. Serafin, J.; Narkiewicz, U.; Morawski, A.W.; Wróbel, R.J.; Michalkiewicz, B. Highly Microporous Activated Carbons from Biomass for CO2 Capture and Effective Micropores at Different Conditions. J. CO2 Util. 2017, 18, 73–79. [Google Scholar] [CrossRef]
  66. He, S.; Chen, G.; Xiao, H.; Shi, G.; Ruan, C.; Ma, Y.; Dai, H.; Yuan, B.; Chen, X.; Yang, X. Facile Preparation of N-Doped Activated Carbon Produced from Rice Husk for CO2 Capture. J. Colloid Interface Sci. 2021, 582, 90–101. [Google Scholar] [CrossRef] [PubMed]
  67. Ello, A.S.; de Souza, L.K.C.; Trokourey, A.; Jaroniec, M. Coconut Shell-Based Microporous Carbons for CO2 Capture. Microporous Mesoporous Mater. 2013, 180, 280–283. [Google Scholar] [CrossRef]
  68. Guo, Y.; Tan, C.; Sun, J.; Li, W.; Zhang, J.; Zhao, C. Porous Activated Carbons Derived from Waste Sugarcane Bagasse for CO2 Adsorption. Chem. Eng. J. 2020, 381, 122736. [Google Scholar] [CrossRef]
  69. Zhang, Y.; Wei, Z.; Liu, X.; Liu, F.; Yan, Z.; Zhou, S.; Wang, J.; Deng, Q. Synthesis of Palm Sheath Derived-Porous Carbon for Selective CO2 Adsorption. RSC Adv. 2022, 12, 8592–8599. [Google Scholar] [CrossRef] [PubMed]
  70. Brunauer, S.; Emmett, P.H.; Teller, E. Adsorption of Gases in Multimolecular Layers. J. Am. Chem. Soc. 1938, 60, 309–319. [Google Scholar] [CrossRef]
  71. Zelenka, T.; Horikawa, T.; Do, D.D. Artifacts and Misinterpretations in Gas Physisorption Measurements and Characterisation of Porous Solids. Adv. Colloid Interface Sci. 2023, 311, 102831. [Google Scholar] [CrossRef]
Figure 1. The preparation procedure of cellulose–amine porous materials using hydrothermal and thermal activation.
Molecules 29 01158 g001
Figure 2. SEM images of hydrothermal: (a) C+MELA, (b) C+BAPE, (c) C+DETA and thermal: (d) C+MELA (P), (e) C+BAPE (P) (f) C+DETA (P) products (structures of APCs modified with the same amine are shown beside each other).
Molecules 29 01158 g002
Figure 3. IR spectra of the prepared APCs doped with (a) 1,2-bis(triaminopropylamino)ethane (BAPE), (b) melamine (MELA), and (c) diethylenetriamine (DETA) (black curve—cellulose (C); red curve—corresponding pure amine; blue curve—hydrothermal product C+amine measured by ATR technique; orange curve—hydrothermal product C+amine measured by KBr technique; teal curve—pyrolysed product C+amine (P) measured by ATR technique).
Molecules 29 01158 g003
Figure 4. IR spectra of C+DETA after gradual heating in the temperature range of (a) 20–170 °C with an increment of 5 °C and (b) 20–700 °C with an increment of 50 °C.
Molecules 29 01158 g004
Figure 5. TG curves of the APCs prepared via (a) hydrothermal activation, (b) thermal activation, and (c) normalised TG curves.
Molecules 29 01158 g005
Figure 6. N2 adsorption/desorption isotherms as measured at −196 °C for (a) hydrothermal and (b) thermal products activated at 150 °C under vacuum.
Molecules 29 01158 g006
Figure 7. Comparison of SBET surface areas for hydrothermal (black columns) and thermal (red columns) samples.
Molecules 29 01158 g007
Figure 8. CO2 adsorption/desorption isotherms of (a) hydrothermal and (b) thermal materials measured at 0 °C and up to 1 bar.
Molecules 29 01158 g008
Figure 9. Thermogravimetric carbon dioxide adsorption curves of C+MELA (black curve), C+BAPE (red curve), C+DETA (green curve), and C (orange curve) measured at 25 °C.
Molecules 29 01158 g009
Figure 10. Cyclic thermogravimetric CO2 adsorption/desorption curve on C+MELA measured at 25 °C via (a) thermal regeneration at 110 °C and (b) argon purging at 25 °C.
Molecules 29 01158 g010
Figure 11. Scheme for preparation of nitrogen-doped cellulose–amine activated porous carbons.
Molecules 29 01158 g011
Table 1. Results of elemental analysis (C, H, N, O in wt. %) for hydrothermal and thermal products.
NN *C/%H/%N/%O **/%
C+DETA341.057.676.5344.75
C+BAPE443.698.187.8440.29
C+MELA637.846.3512.6143.20
C+DETA (P)388.560.960.2710.21
C+BAPE (P)491.151.150.427.28
C+MELA (P)684.980.730.6713.62
*—number of nitrogen atoms in used amines (see Figure 2), **—the content of O was calculated as the difference between 100% and the weight percentage sum of C, H, and N elements.
Table 2. Wavenumbers (in cm−1) of relevant adsorption bands in the IR spectra of prepared APCs.
CMELADETABAPEC+MELAC+DETAC+BAPEC+MELA (P)C+DETA (P)C+BAPE (P)
ν(OH)3332 (as) 3281 (s)XXXXX3403XXX
ν(NH2)X3467
3417
3353
3276
3353
3276
3468
3412
3351
3276
3331
3284
XXX
ν(NH)XX31843176332831843180XXX
X3176
3120
XX3184
3130
XXXXX
ν(CH2)aliph2895X2925, 2879 (as)
2854, 2812 (s)
2922(as)
2813(s)
2962, 2931 (as)
2898, 2868 (s)
2925, 2876 (as)
2851, 2812 (s)
2915 (as)
2848, 2823 (s)
XXX
δ(OH)1645XXXXXXXXX
δ(NH2)X1626159515981649
1624
15951590XXX
ν(CN)X1566
1526
XX1552XXXXX
δ(CH2)1428X14541456143514541455XXX
δ(CH)1333X13511356136313511358XXX
δ(C-OH)1314XXX131313001314XXX
ν(C-O)1053
1028
XXX1052
1022
1062
1036
1055
1031
XXX
γ(CCH)XXXXXXX991977992
aliph—aliphatic, s—symmetric, as—asymmetric, X–not present.
Table 3. Textural properties (BET surface area (SBET) and pore volume (Vp)) of activated hydrothermal and pyrolysed carbons and of carbonaceous materials modified with different amines.
SBET
m2 g−1
Vp
cm3 g−1
C320.014
C+DETA7690.378
C+BAPE8330.473
C+MELA10790.511
C (P)1210.067
C+DETA (P)9980.488
C+BAPE (P)10760.502
C+MELA (P)13480.628
Table 4. CO2 adsorption capacity of APCs at 0 °C and 1 bar in terms of volume (V), amount of substance (n), and mass fraction (w).
V(CO2)cm3 g−1n(CO2)mmol g−1w(CO2)wt. %
C3.650.170.75
C+DETA98.084.3819.28
C+BAPE119.355.3323.46
C+MELA164.607.3432.30
C (P)5.180.231.01
C+DETA (P)39.541.767.75
C+BAPE (P)49.042.199.64
C+MELA (P)93.294.1618.31
Disclaimer/Publisher’s Note: The statements, opinions and data contained in all publications are solely those of the individual author(s) and contributor(s) and not of MDPI and/or the editor(s). MDPI and/or the editor(s) disclaim responsibility for any injury to people or property resulting from any ideas, methods, instructions or products referred to in the content.

