
Efficient Capture of Cannabis Terpenes in Olive Oil during Microwave-Assisted Cannabinoid Decarboxylation †


Abstract
1. Introduction
2. Results and Discussion
3. Materials and Methods
3.1. Plant Material
3.2. Chemical Reagents and Solvents
3.3. Extraction Protocol
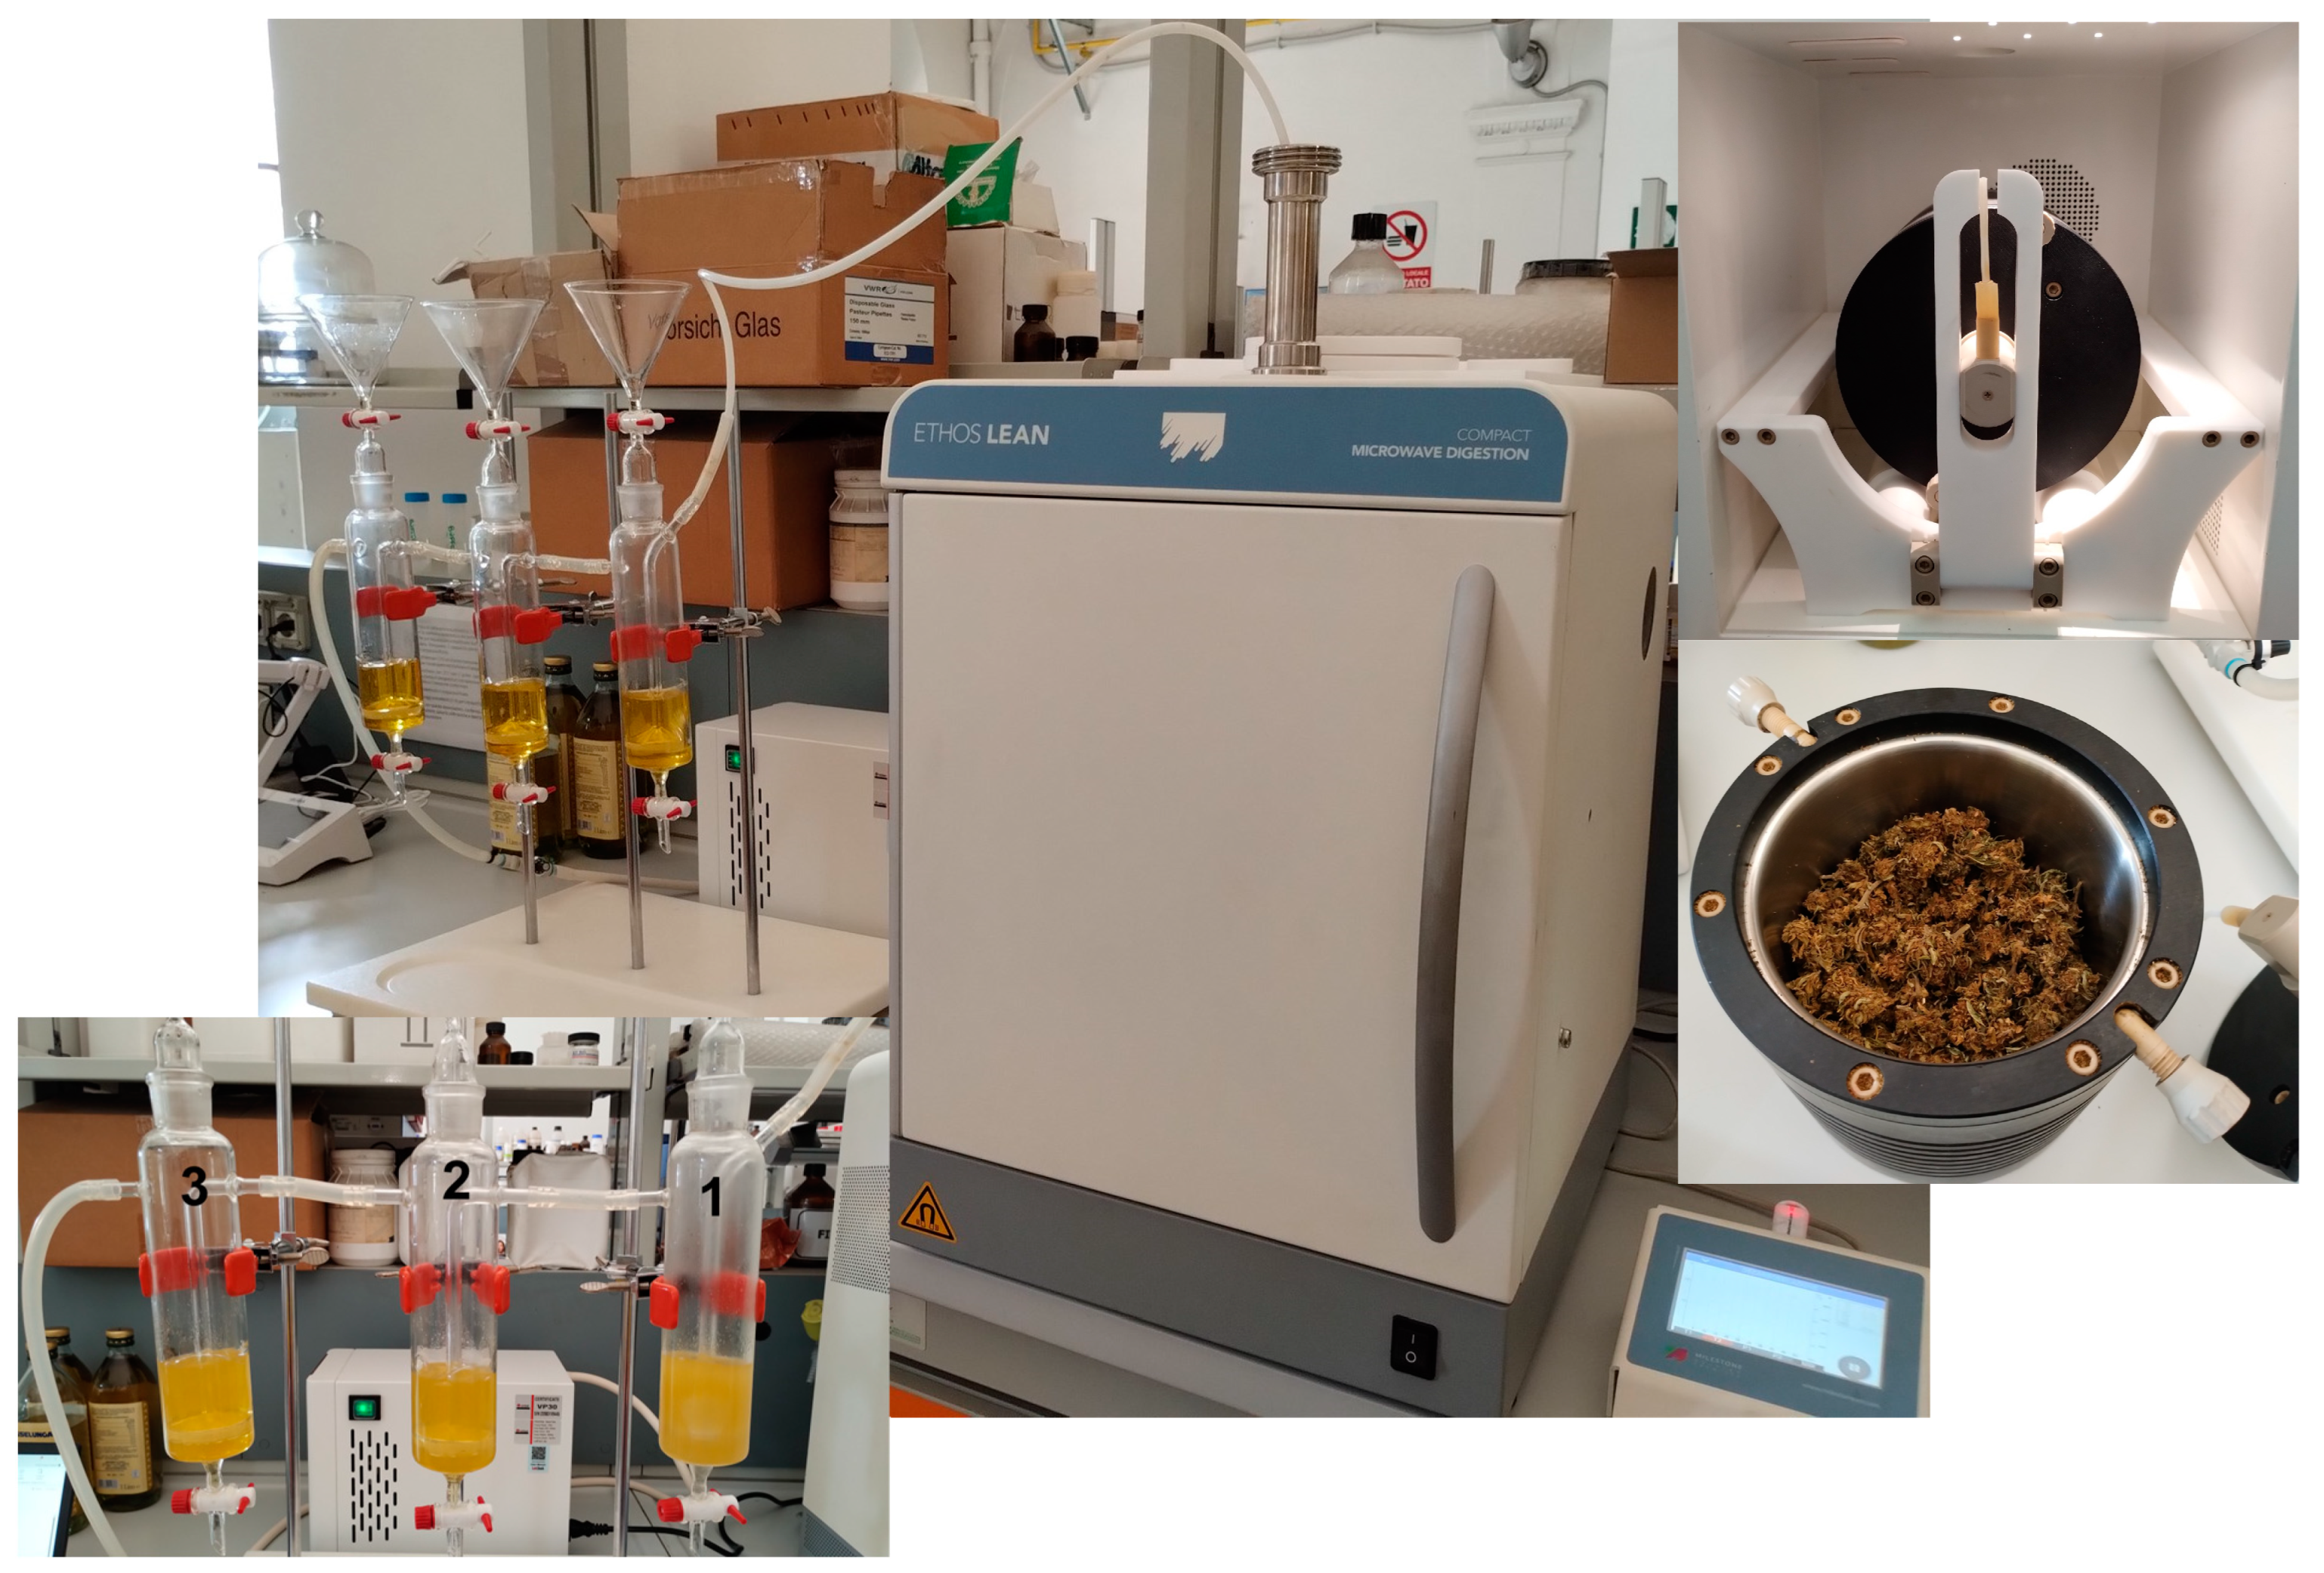
3.3.1. Decarboxylation in the Milestone Ethos LEAN Prototype and Volatile Trapping
3.3.2. Extraction in Olive Oil Using the Milestone Ethos Lean Prototype
3.4. HS-SPME GC-MS Analyses of Oil and Inflorescence Samples
3.4.1. Equipment
3.4.2. Instrument Parameters
3.4.3. Sampling Mode
3.4.4. Sample Preparation
3.4.5. Identification and Quantification
3.5. Statistical Analysis
4. Conclusions
Author Contributions
Funding
Institutional Review Board Statement
Informed Consent Statement
Data Availability Statement
Acknowledgments
Conflicts of Interest
References
- Elzinga, S.; Fischedick, J.; Podkolinski, R.; Raber, J.C. Cannabinoids and terpenes as chemotaxonomic markers in cannabis. Nat. Prod. Chem. Res. 2015, 3, 181. [Google Scholar] [CrossRef]
- Flores-Sanchez, I.J.; Verpoorte, R. Secondary metabolism in cannabis. Phytochem. Rev. 2008, 7, 615–639. [Google Scholar] [CrossRef]
- De Vita, D.; Madia, V.N.; Tudino, V.; Saccoliti, F.; De Leo, A.; Messore, A.; Roscilli, P.; Botto, A.; Pindinello, I.; Santilli, G.; et al. Comparison of different methods for the extraction of cannabinoids from Cannabis. Nat. Prod. Res. 2020, 34, 2952–2958. [Google Scholar] [CrossRef]
- Lewis-Bakker, M.M.; Yang, Y.; Vyawahare, R.; Kotra, L.P. Extractions of medical Cannabis cultivars and the role of decarboxylation in optimal receptor responses. Cannabis Cannabinoid Res. 2019, 4, 183–194. [Google Scholar] [CrossRef]
- Veress, T.; Szanto, J.I.; Leisztner, L. Determination of cannabinoid acids by high-performance liquid-chromatography of their neutral derivatives formed by thermal decarboxylation. 1. Study of the decarboxylation process in open reactors. J. Chromatogr. 1990, 520, 339–347. [Google Scholar] [CrossRef]
- Nahar, L.; Uddin, S.J.; Alam, M.A.; Sarker, S.D. Extraction of naturally occurring cannabinoids: An update. Phytochem. Anal. 2021, 32, 228–241. [Google Scholar] [CrossRef]
- Aizpurua-Olaizola, O.; Soydaner, U.; Ozturk, E.; Schibano, D.; Simsir, Y.; Navarro, P.; Etxebarria, N.; Usobiaga, A. Evolution of the cannabinoid and terpene content during the growth of Cannabis sativa plants from different chemotypes. J. Nat. Prod. 2016, 79, 324–331. [Google Scholar] [CrossRef] [PubMed]
- Shapira, A.; Berman, P.; Futoran, K.; Guberman, O.; Meiri, D. Tandem mass spectrometric quantification of 93 terpenoids in Cannabis using static headspace injections. Anal. Chem. 2019, 91, 11425–11432. [Google Scholar] [CrossRef] [PubMed]
- Brenneisen, R.; ElSohly, M.A. Chromatographic and spectroscopic profiles of Cannabis of different origins: Part I. J. Forensic Sci. 1988, 33, 1385–1404. [Google Scholar] [CrossRef] [PubMed]
- Rossi, S.A.; ElSohly, M.A. The volatile oil composition of fresh and air-dried buds of Cannabis sativa. J. Nat. Prod. 1996, 59, 49–51. [Google Scholar] [CrossRef] [PubMed]
- Sommano, S.R.; Chittasupho, C.; Ruksiriwanich, W.; Jantrawut, P. The Cannabis Terpenes. Molecules 2020, 25, 5792. [Google Scholar] [CrossRef]
- Russo, E.B.; Marcu, J. Cannabis Pharmacology: The Usual Suspects and a Few Promising Leads. In Advances in Pharmacology; Kendall, D., Alexander, S.P.H., Eds.; Academic Press: Cambridge, MA, USA, 2017; Volume 80, pp. 67–134. [Google Scholar]
- Ajikumar, P.K.; Tyo, K.; Carlsen, S.; Mucha, O.; Phon, T.H.; Stephanopoulos, G. Terpenoids: Opportunities for biosynthesis of natural product drugs using engineered microorganisms. Mol. Pharm. 2008, 5, 167–190. [Google Scholar] [CrossRef]
- Huang, M.; Lu, J.J.; Huang, M.Q.; Bao, J.L.; Chen, X.P.; Wang, Y.T. Terpenoids: Natural products for cancer therapy. Expert Opin. Investig. Drugs 2012, 21, 1801–1818. [Google Scholar] [CrossRef]
- Abdel-Rahman, F.H.; Alaniz, N.M.; Saleh, M.A. Nematicidal activity of terpenoids. J. Environ. Sci. Health Part B 2013, 48, 16–22. [Google Scholar] [CrossRef]
- Caputi, L.; Aprea, E. Use of terpenoids as natural flavouring compounds in food industry. Recent Pat. Food Nutr. Agric. 2011, 3, 9–16. [Google Scholar] [CrossRef]
- Fischedick, J.T. Identification of terpenoid chemotypes among high (−)-trans-Δ9-tetrahydrocannabinol-producing Cannabis sativa L. cultivars. Cannabis Cannabinoid Res. 2017, 2, 34–47. [Google Scholar] [CrossRef]
- Gertsch, J.; Leonti, M.; Raduner, S.; Racz, I.; Chen, J.Z.; Xie, X.Q.; Altmann, K.H.; Karsak, M.; Zimmer, A. Beta-caryophyllene is a dietary cannabinoid. Proc. Natl. Acad. Sci. USA 2008, 105, 9099–9104. [Google Scholar] [CrossRef] [PubMed]
- Russo, E.B. Taming THC: Potential cannabis synergy and phytocannabinoid terpenoid entourage effects. Br. J. Pharmacol. 2011, 16, 1344–1364. [Google Scholar] [CrossRef] [PubMed]
- Brenneisen, R. Chemistry and analysis of phytocannabinoids and other Cannabis constituents. In Marijuana and the Cannabinoids; Humana Press: Totowa, NJ, USA, 2007; pp. 17–49. [Google Scholar] [CrossRef]
- Markle, S. Strain-specific isolation of terpenes utilizing microwave-assisted extraction. Cannabis Sci. Technol. 2019, 2, 50–76. [Google Scholar]
- Gunjevíc, V.; Grillo, G.; Carnaroglio, D.; Binello, A.; Barge, A.; Cravotto, G. Selective recovery of terpenes, polyphenols and cannabinoids from Cannabis sativa L. inflorescences under microwaves. Ind. Crops Prod. 2021, 162, 113247. [Google Scholar] [CrossRef]
- Marzorati, S.; Friscione, D.; Picchi, E.; Verotta, L. Cannabidiol from inflorescences of Cannabis sativa L.: Green extraction and purification processes. Ind. Crops Prod. 2020, 155, 112816. [Google Scholar] [CrossRef]
- Ibrahim, E.A.; Wang, M.; Radwan, M.M.; Wanas, A.S.; Majumdar, C.G.; Avula, B.; Wang, Y.H.; Khan, I.A.; Chandra, S.; Lata, H.; et al. Analysis of terpenes in Cannabis sativa L. using GC/MS: Method development, validation, and application. Planta Med. 2019, 85, 431–438. [Google Scholar] [CrossRef] [PubMed]
- Giovannoni, S.; Lancioni, C.; Vaccarini, C.; Sedan, D.; Andrinolo, D.; Castells, C. Determination of variability of terpenes and terpenoids in Cannabis sativa by gas chromatography-flame ionization detection and gas chromatography-mass spectrometry. J. Chromatogr. A 2023, 1687, 463669. [Google Scholar] [CrossRef] [PubMed]
- Stenerson, K.K.; Halpenny, M.R. Analysis of terpenes in Cannabis using headspace solid-phase microextraction and GC–MS. LC-GC N. Am. (Suppl.) 2017, 28–33. [Google Scholar]
- Vas, G. Chapter 4. State of the art solventless sample preparation alternatives for analytical evaluation of the volatile constituents of different cannabis based products. In Analysis of Cannabis; Ferrer, I., Thurman, E.M., Eds.; Elsevier: Amsterdam, The Netherlands, 2020; Volume 90, pp. 105–137. [Google Scholar]
- Rice, S.; Koziel, J.A. The relationship between chemical concentration and odor activity value explains the inconsistency in making a comprehensive surrogate scent training tool representative of illicit drugs. Forensic Sci. Int. 2015, 257, 257–270. [Google Scholar] [CrossRef] [PubMed]
- Calvi, L.; Pentimalli, D.; Panseri, S.; Giupponi, L.; Gelmini, F.; Beretta, G.; Vitali, D.; Bruno, M.; Zilio, E.; Pavlovic, R.; et al. Comprehensive quality evaluation of medical Cannabis sativa L. inflorescence and macerated oils based on HS-SPME coupled to GC–MS and LC-HRMS (q-exactive orbitrap®) approach. J. Pharm. Biomed. Anal. 2018, 150, 208–219. [Google Scholar] [CrossRef] [PubMed]
- Halpenny, M.; Stenerson, K.K. Quantitative Determination of Terpenes in Cannabis Using Headspace Solid Phase Microextraction and GC/MS. GERSTEL Application Note No. 189. 2017. Available online: https://gcms.cz/labrulez-bucket-strapi-h3hsga3/5bc1aea857bb4605a272bbe56cd35915/AppNote-189.pdf (accessed on 20 December 2023).
- Stenerson, K.K. Cannabis Terpene Analysis by Headspace SPME GC/MS. Reporter US Volume 34.4. Technical Document in Merck Website. Available online: https://www.sigmaaldrich.com/IT/en/technical-documents/protocol/food-and-beverage-testing-and-manufacturing/chemical-analysis-for-food-and-beverage/cannabis-terpenes-identification-spme-gcms (accessed on 20 December 2023).
- Stenerson, K.K. Headspace SPME-GC/MS Analysis of Terpenes in Hops and Cannabis. Analytix Reporter (Food & Beverage, Merck). 2018. Available online: https://www.sigmaaldrich.com/IT/en/technical-documents/protocol/analytical-chemistry/solid-phase-microextraction/analysis-terpenes-hops-cannabis (accessed on 20 December 2023).
- Raharjo, T.J.; Verpoorte, R. Methods for the analysis of cannabinoids in biological materials: A review. Phytochem. Anal. 2004, 15, 79–94. [Google Scholar] [CrossRef] [PubMed]
- Ternelli, M.; Brighenti, V.; Anceschi, L.; Poto, M.; Bertelli, D.; Licata, M.; Pellati, F. Innovative methods for the preparation of medical cannabis oils with a high content of both cannabinoids and terpenes. J. Pharm. Biomed. Anal. 2020, 186, 113296. [Google Scholar] [CrossRef]
- Wiebelhaus, N.; Hamblin, D.; Kreitals, N.M.; Almirall, J.R. Differentiation of marijuana headspace volatiles from other plants and hemp products using capillary micro-extraction of volatiles (CMV) coupled to gas-chromatography–mass spectrometry (GC–MS). Forensic Chem. 2016, 2, 1–8. [Google Scholar] [CrossRef]
- Giacoppo, S.; Bramanti, P.; Mazzon, E. Sativex in the management of multiple sclerosis-related spasticity: An overview of the last decade of clinical evaluation. Mult. Scler. Relat. Disord. 2017, 17, 22–31. [Google Scholar] [CrossRef]
- Badowski, M.E.; Yanful, P.K. Dronabinol oral solution in the management of anorexia and weight loss in AIDS and cancer. Therapeut. Clin. Risk Manag. 2018, 14, 643–651. [Google Scholar] [CrossRef] [PubMed]
- Nielsen, S.; Germanos, R.; Weier, M.; Pollard, J.; Degenhardt, L.; Hall, W.; Buckley, N.; Farrell, M. The use of cannabis and cannabinoids in treating symptoms of multiple sclerosis: A systematic review of reviews. Curr. Neurol. Neurosci. Rep. 2018, 18, 8. [Google Scholar] [CrossRef] [PubMed]
- Citti, C.; Ciccarella, G.; Braghiroli, D.; Parenti, C.; Vandelli, M.A.; Cannazza, G. Medicinal cannabis: Principal cannabinoids concentration and their stability evaluated by a high performance liquid chromatography coupled to diode array and quadrupole time of flight mass spectrometry method. J. Pharm. Biomed. Anal. 2016, 128, 201–209. [Google Scholar] [CrossRef] [PubMed]
- Giese, M.W.; Lewis, M.A.; Giese, L.; Smith, K.M. Development and validation of a reliable and robust method for the analysis of cannabinoids and terpenes in cannabis. J. AOAC Int. 2015, 98, 1503–1522. [Google Scholar] [CrossRef] [PubMed]
- Romano, L.L.; Hazekamp, A. Cannabis Oil: Chemical evaluation of an upcoming cannabis-based medicine. Cannabinoids 2013, 1, 1–11. Available online: https://www.lapiantiamo.it/download/Cannabis%20Oil%20-%20Chemical%20evaluation%20of%20an%20upcoming%20Cannabis-based%20medicine.pdf (accessed on 20 December 2023).
- Binello, A.; Rosso, E.; Gandlevskiy, N.; Carnaroglio, D.; Visinoni, F.; Di Franco, M.; Barge, A.; Cravotto, G. A new prototype reactor for the fast microwave-assisted decarboxylation and extraction of cannabinoids in olive oil from Cannabis inflorescences. Sustain. Chem. Pharm. 2023, 36, 101303. [Google Scholar] [CrossRef]
- Aparicio-Ruiz, R.; Casadei, E.; Ortiz-Romero, C.; García-González, D.L.; Servili, M.; Selvaggini, R.; Lacoste, F.; Escobessa, J.; Vichi, S.; Quintanilla-Casas, B.; et al. Method for the analysis of volatile compounds in virgin olive oil by SPME-GC-MS or SPME-GC-FID. MethodsX 2023, 10, 101972. [Google Scholar] [CrossRef]


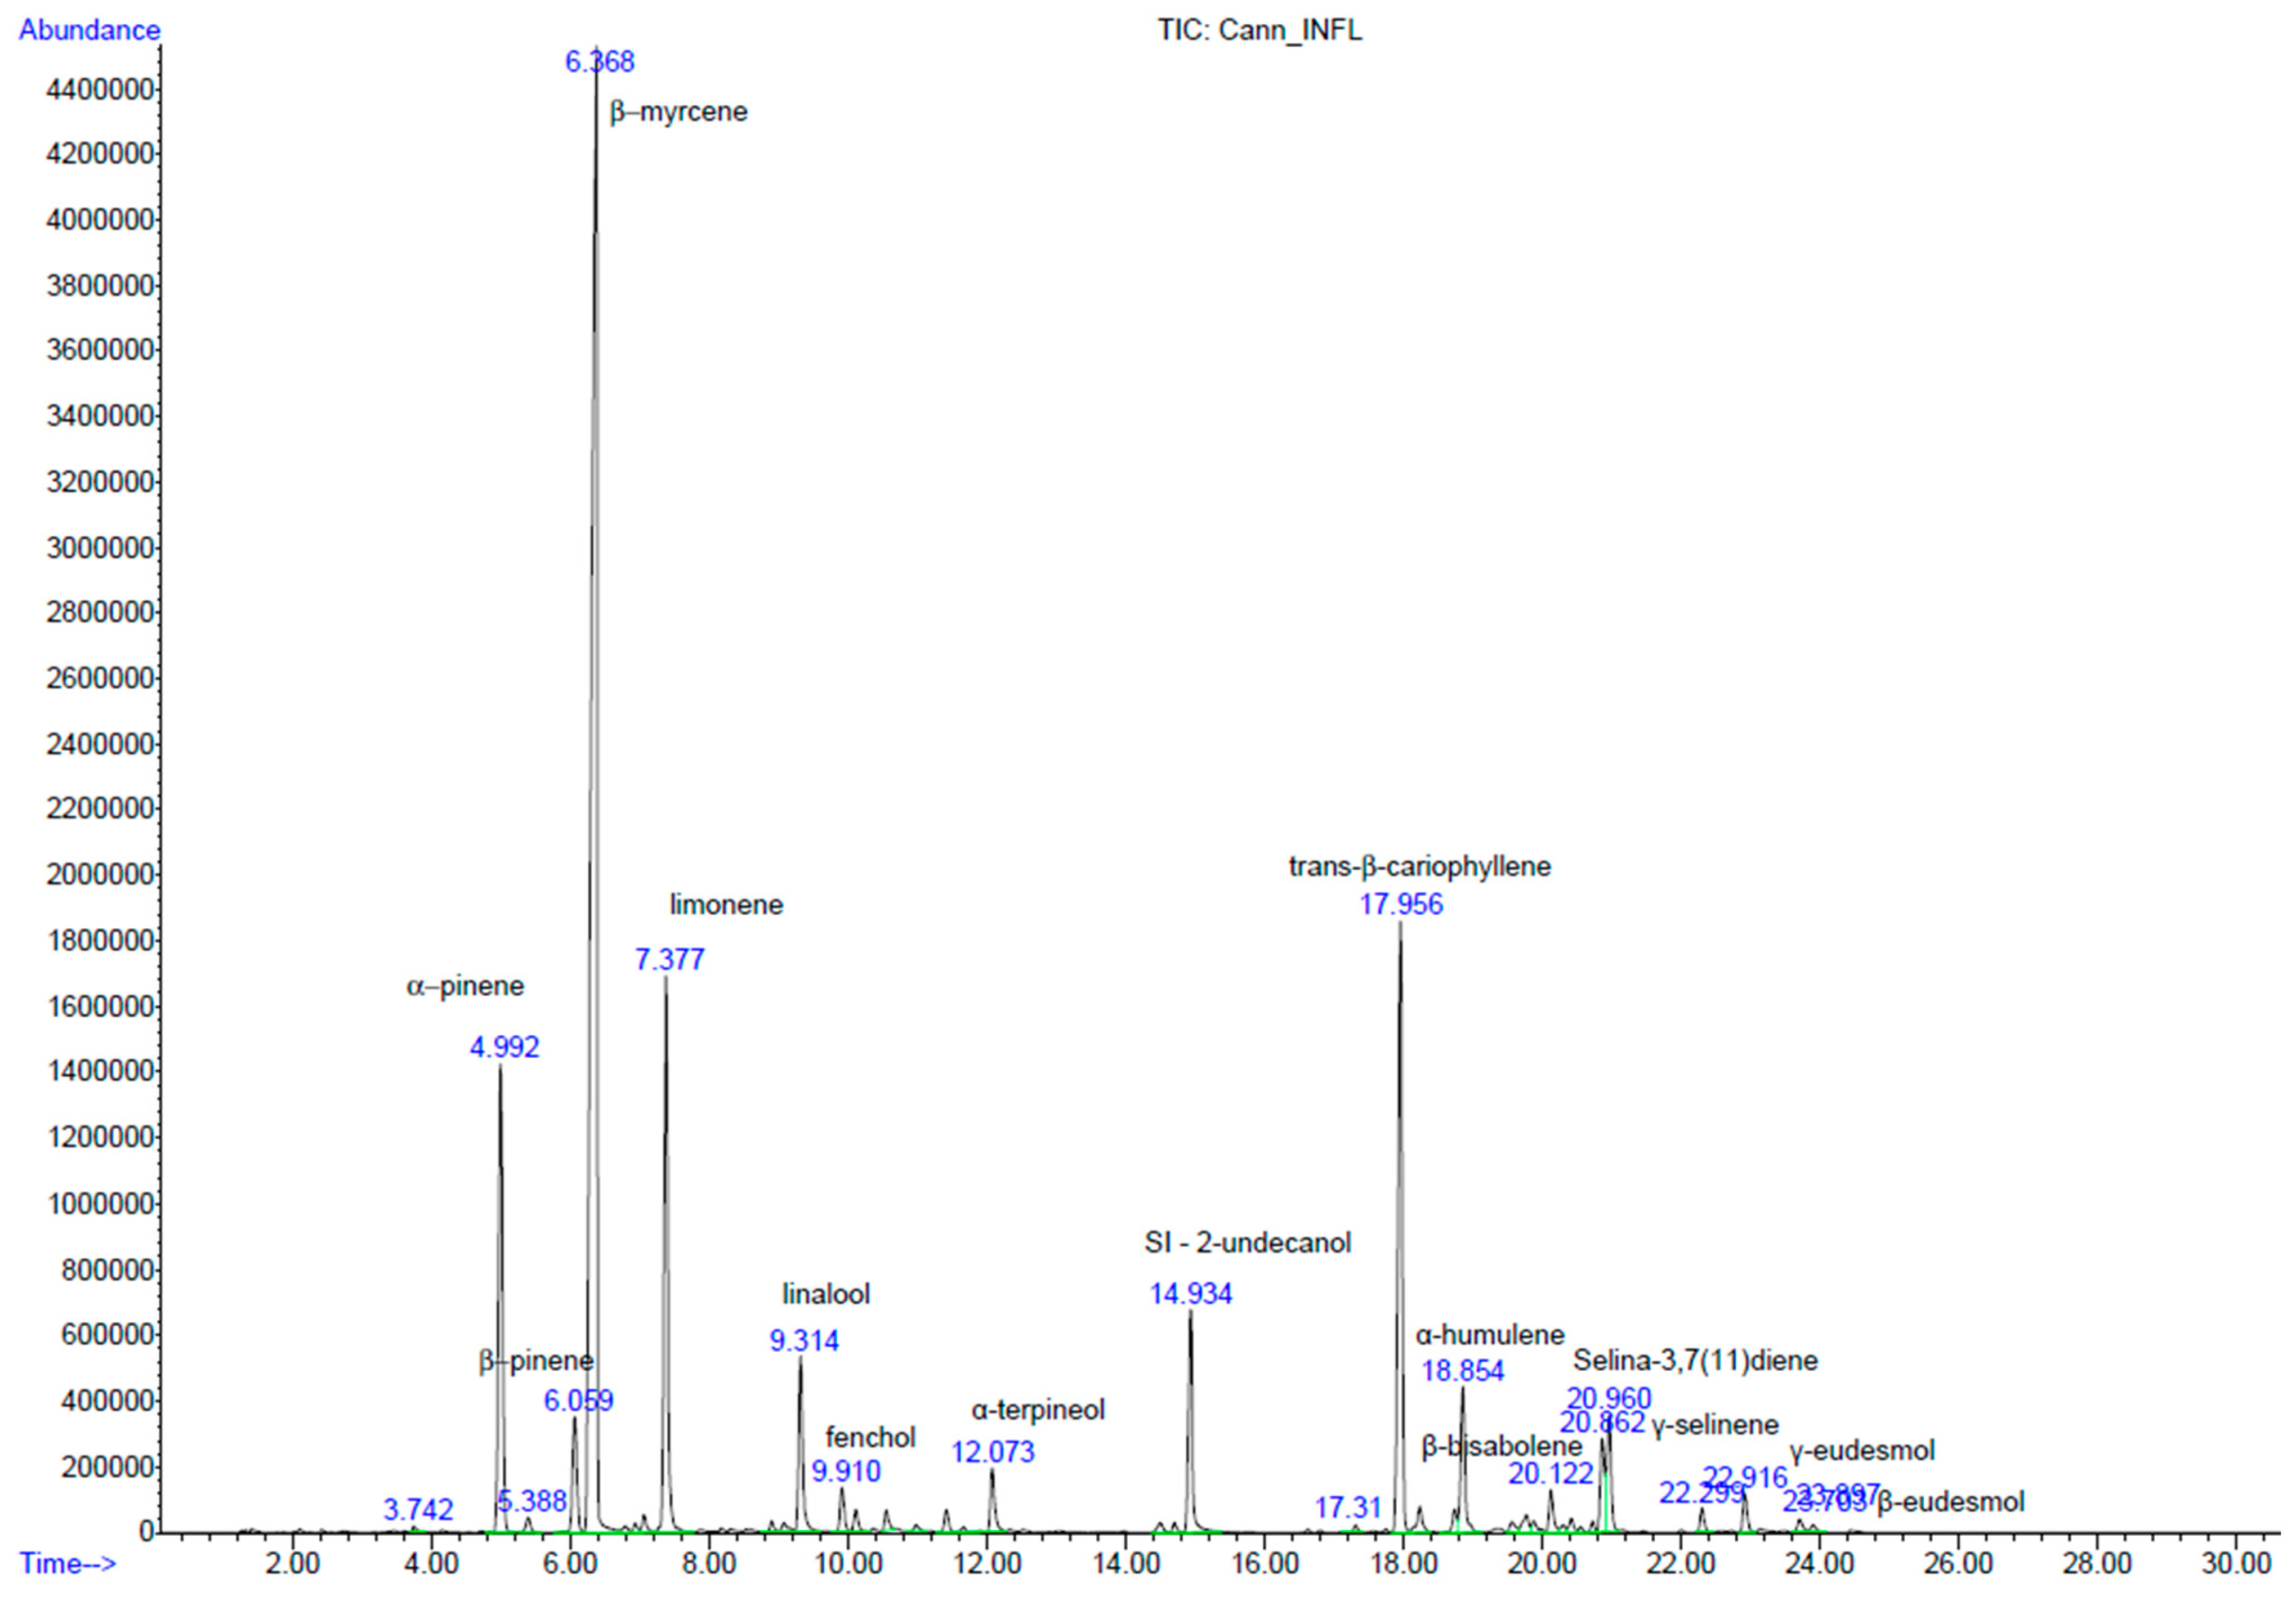
| Compounds | Ret. Time (min) a | Ident. (ST/Qual. %) b | Inflorescences (mg/kg, Mean ± S.D.) c | Area Percentage (%, Mean ± S.D.) c |
|---|---|---|---|---|
| Monoterpenes | ||||
| α-pinene | 5.00 | CTA | 8265.21 ± 624.95 | 9.04 ± 0.43 |
| Camphene | 5.40 | CTA | 294.56 ± 20.49 | 0.32 ± 0.02 |
| β-pinene | 6.06 | CTA/B | 2316.61 ± 139.99 | 2.54 ± 0.12 |
| β-myrcene | 6.30 | 97 | 40,459.89 ± 1402.91 | 44.34 ± 2.24 |
| δ-3-carene | 6.79 | CTA/B | 175.21 ± 17.47 | 0.19 ± 0.02 |
| limonene | 7.40 | CTA/B | 9660.13 ± 381.68 | 10.59 ± 0.57 |
| γ-terpinene | 8.17 | CTA | 16.57 ± 33.14 | 0.02 ± 0.04 |
| α-terpinolene | 8.90 | CTB | 175.11 ± 7.68 | 0.19 ± 0.01 |
| Monoterpenoids | ||||
| l-fenchone | 9.08 | CTA | 229.05 ± 28.78 | 0.25 ± 0.03 |
| Linalool | 9.30 | CTB | 3228.18 ± 154.61 | 3.53 ± 0.09 |
| d-α-Fenchyl alcohol | 9.90 | CTA | 809.58 ± 99.82 | 0.89 ± 0.09 |
| Borneol L | 11.43 | CTB | 406.24 ± 23.73 | 0.44 ± 0.02 |
| Terpinen-4-ol | 11.67 | 90 | 74.89 ± 50.98 | 0.08 ± 0.06 |
| α-terpineol | 12.10 | CTB | 1289.09 ± 60.39 | 1.41 ± 0.04 |
| Sesquiterpenes | ||||
| trans-β-caryophyllene | 17.90 | CTB | 11,696.54 ± 999.88 | 12.80 ± 0.79 |
| α-bergamotene | 18.20 | 94 | 656.90 ± 63.10 | 0.72 ± 0.06 |
| trans-β-farnesene | 18.74 | 96 | 429.41 ± 125.69 | 0.47 ± 0.13 |
| α-humulene | 18.87 | CTA | 3002.91 ± 320.52 | 3.28 ± 0.28 |
| valencene | 19.76 | 99 | 482.46 ± 93.57 | 0.53 ± 0.09 |
| α-selinene | 19.89 | 90 | 261.28 ± 107.87 | 0.28 ± 0.11 |
| β-bisabolene | 20.12 | 97 | 828.31 ± 201.79 | 0.90 ± 0.20 |
| α-gurjunene | 20.70 | 98 | 170.93 ± 32.38 | 0.19 ± 0.03 |
| γ-selinene | 20.80 | 96 | 1807.54 ± 413.43 | 1.97 ± 0.41 |
| Selina-3,7(11)diene | 20.99 | 99 | 2405.71 ± 311.73 | 2.63 ± 0.29 |
| Sesquiterpenoids | ||||
| guaiol | 22.29 | 96 | 587.34 ± 96.07 | 0.64 ± 0.11 |
| γ-eudesmol | 22.90 | 93 | 878.89 ± 97.01 | 0.96 ± 0.11 |
| β-eudesmol | 23.70 | CTB | 442.33 ± 76.32 | 0.49 ± 0.09 |
| (+)-bulnesol | 23.89 | 94 | 273.87 ± 43.55 | 0.30 ± 0.05 |
| Total | - | - | 91,324.74 ± 2774.36 | - |
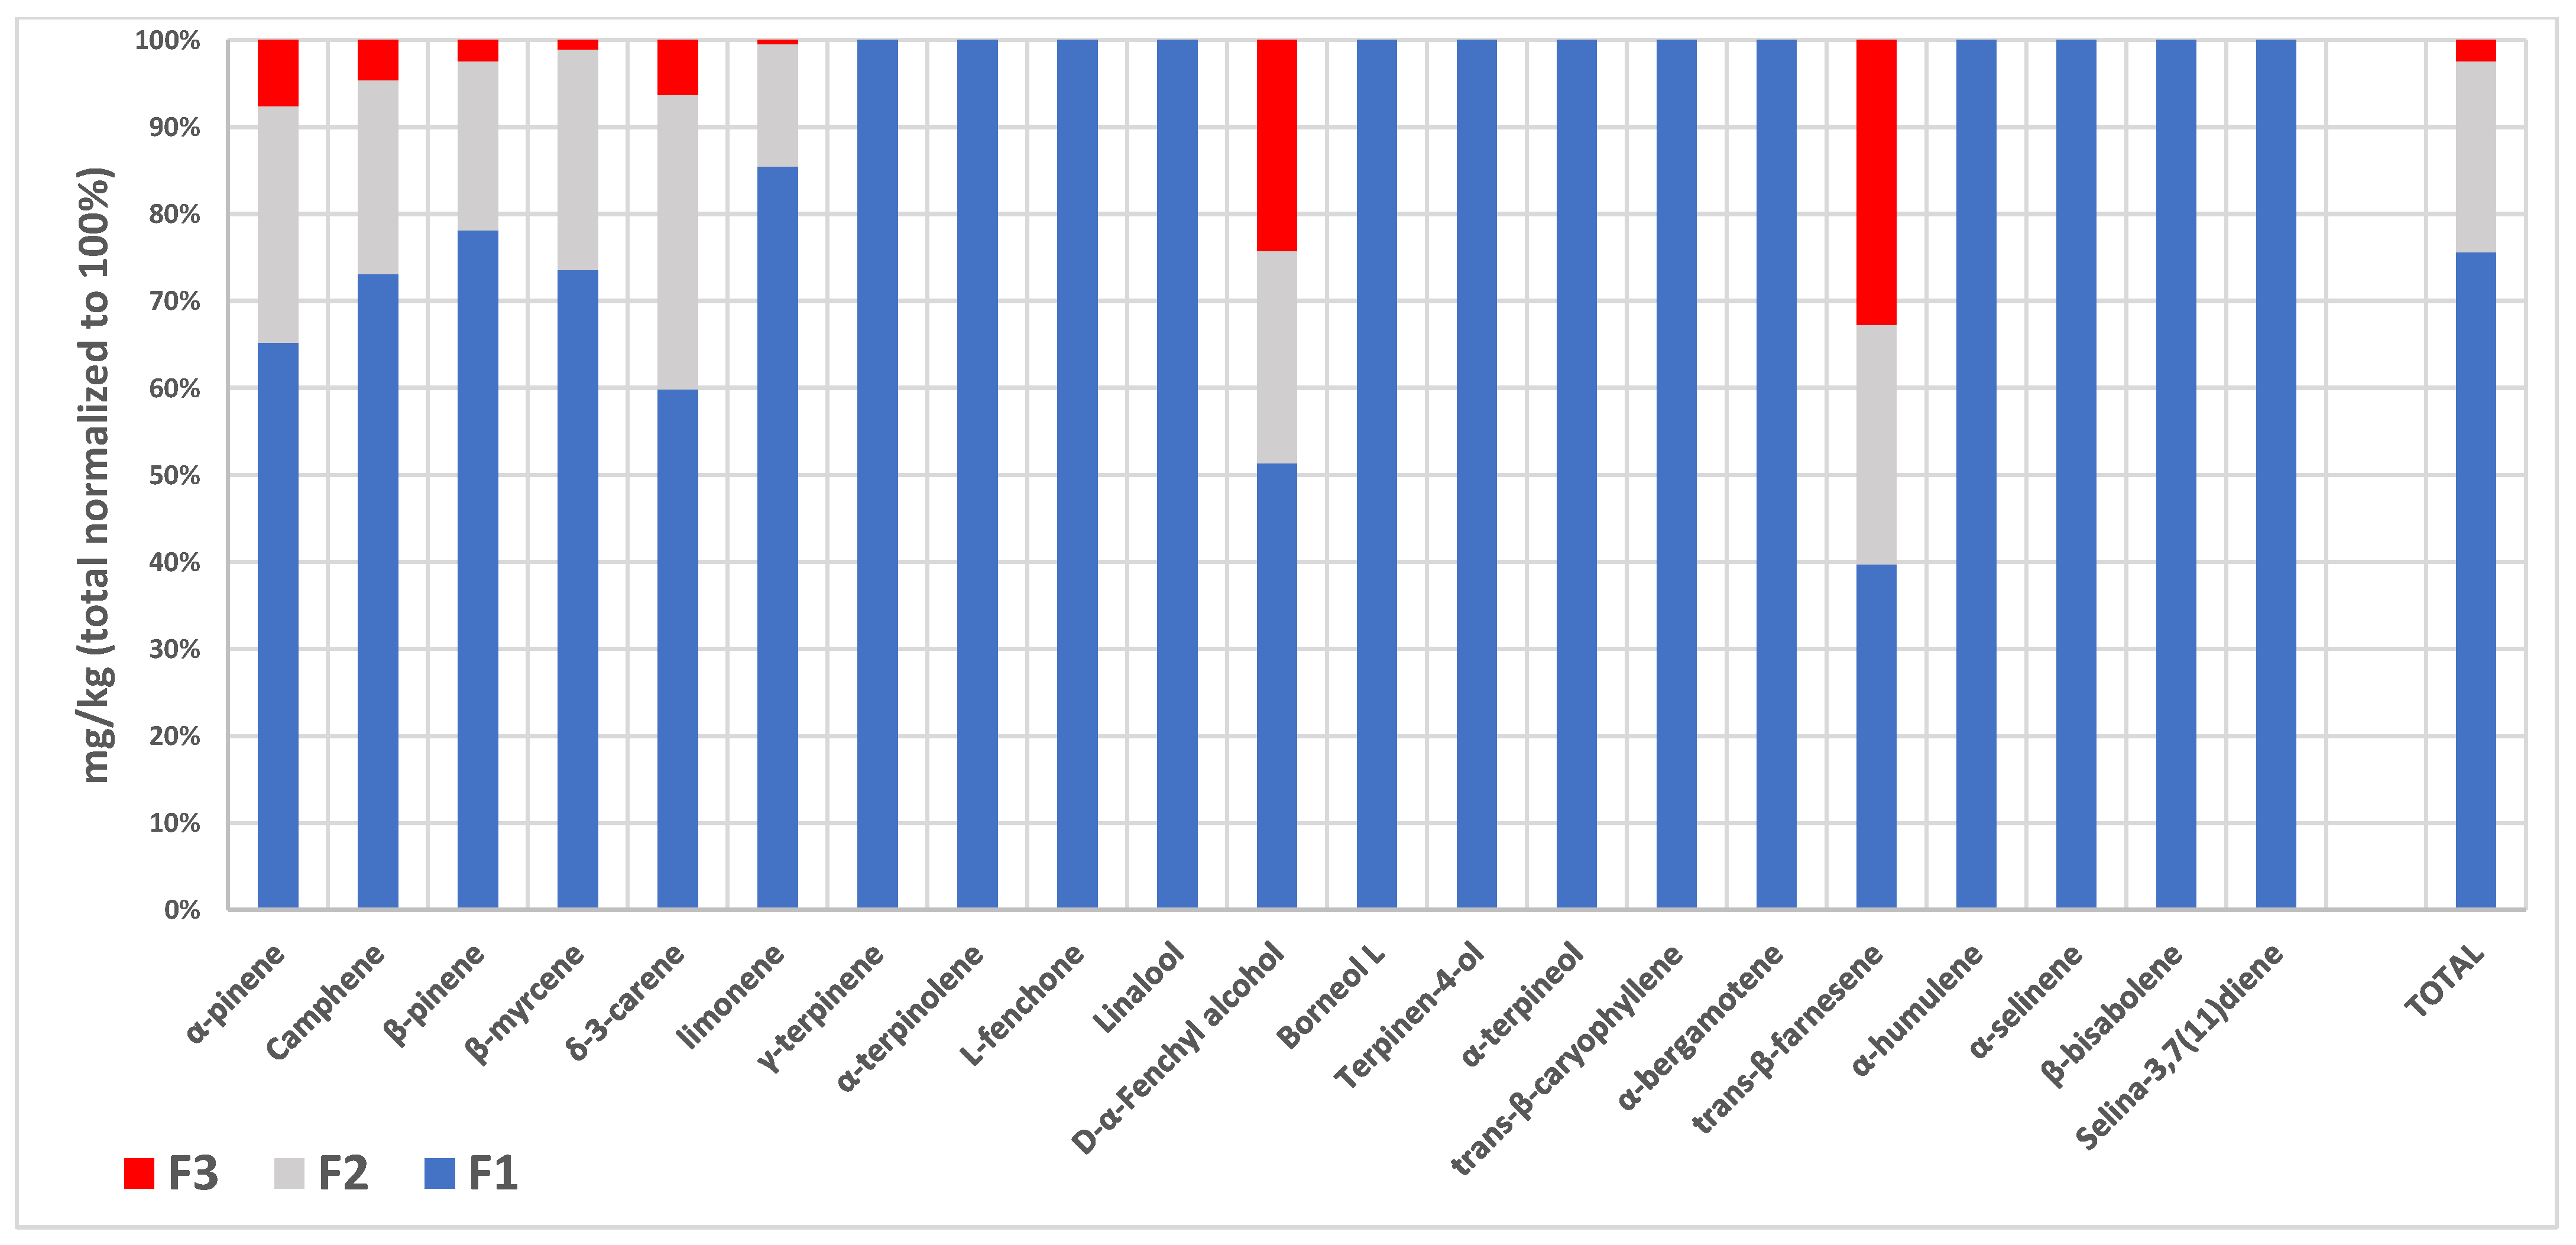
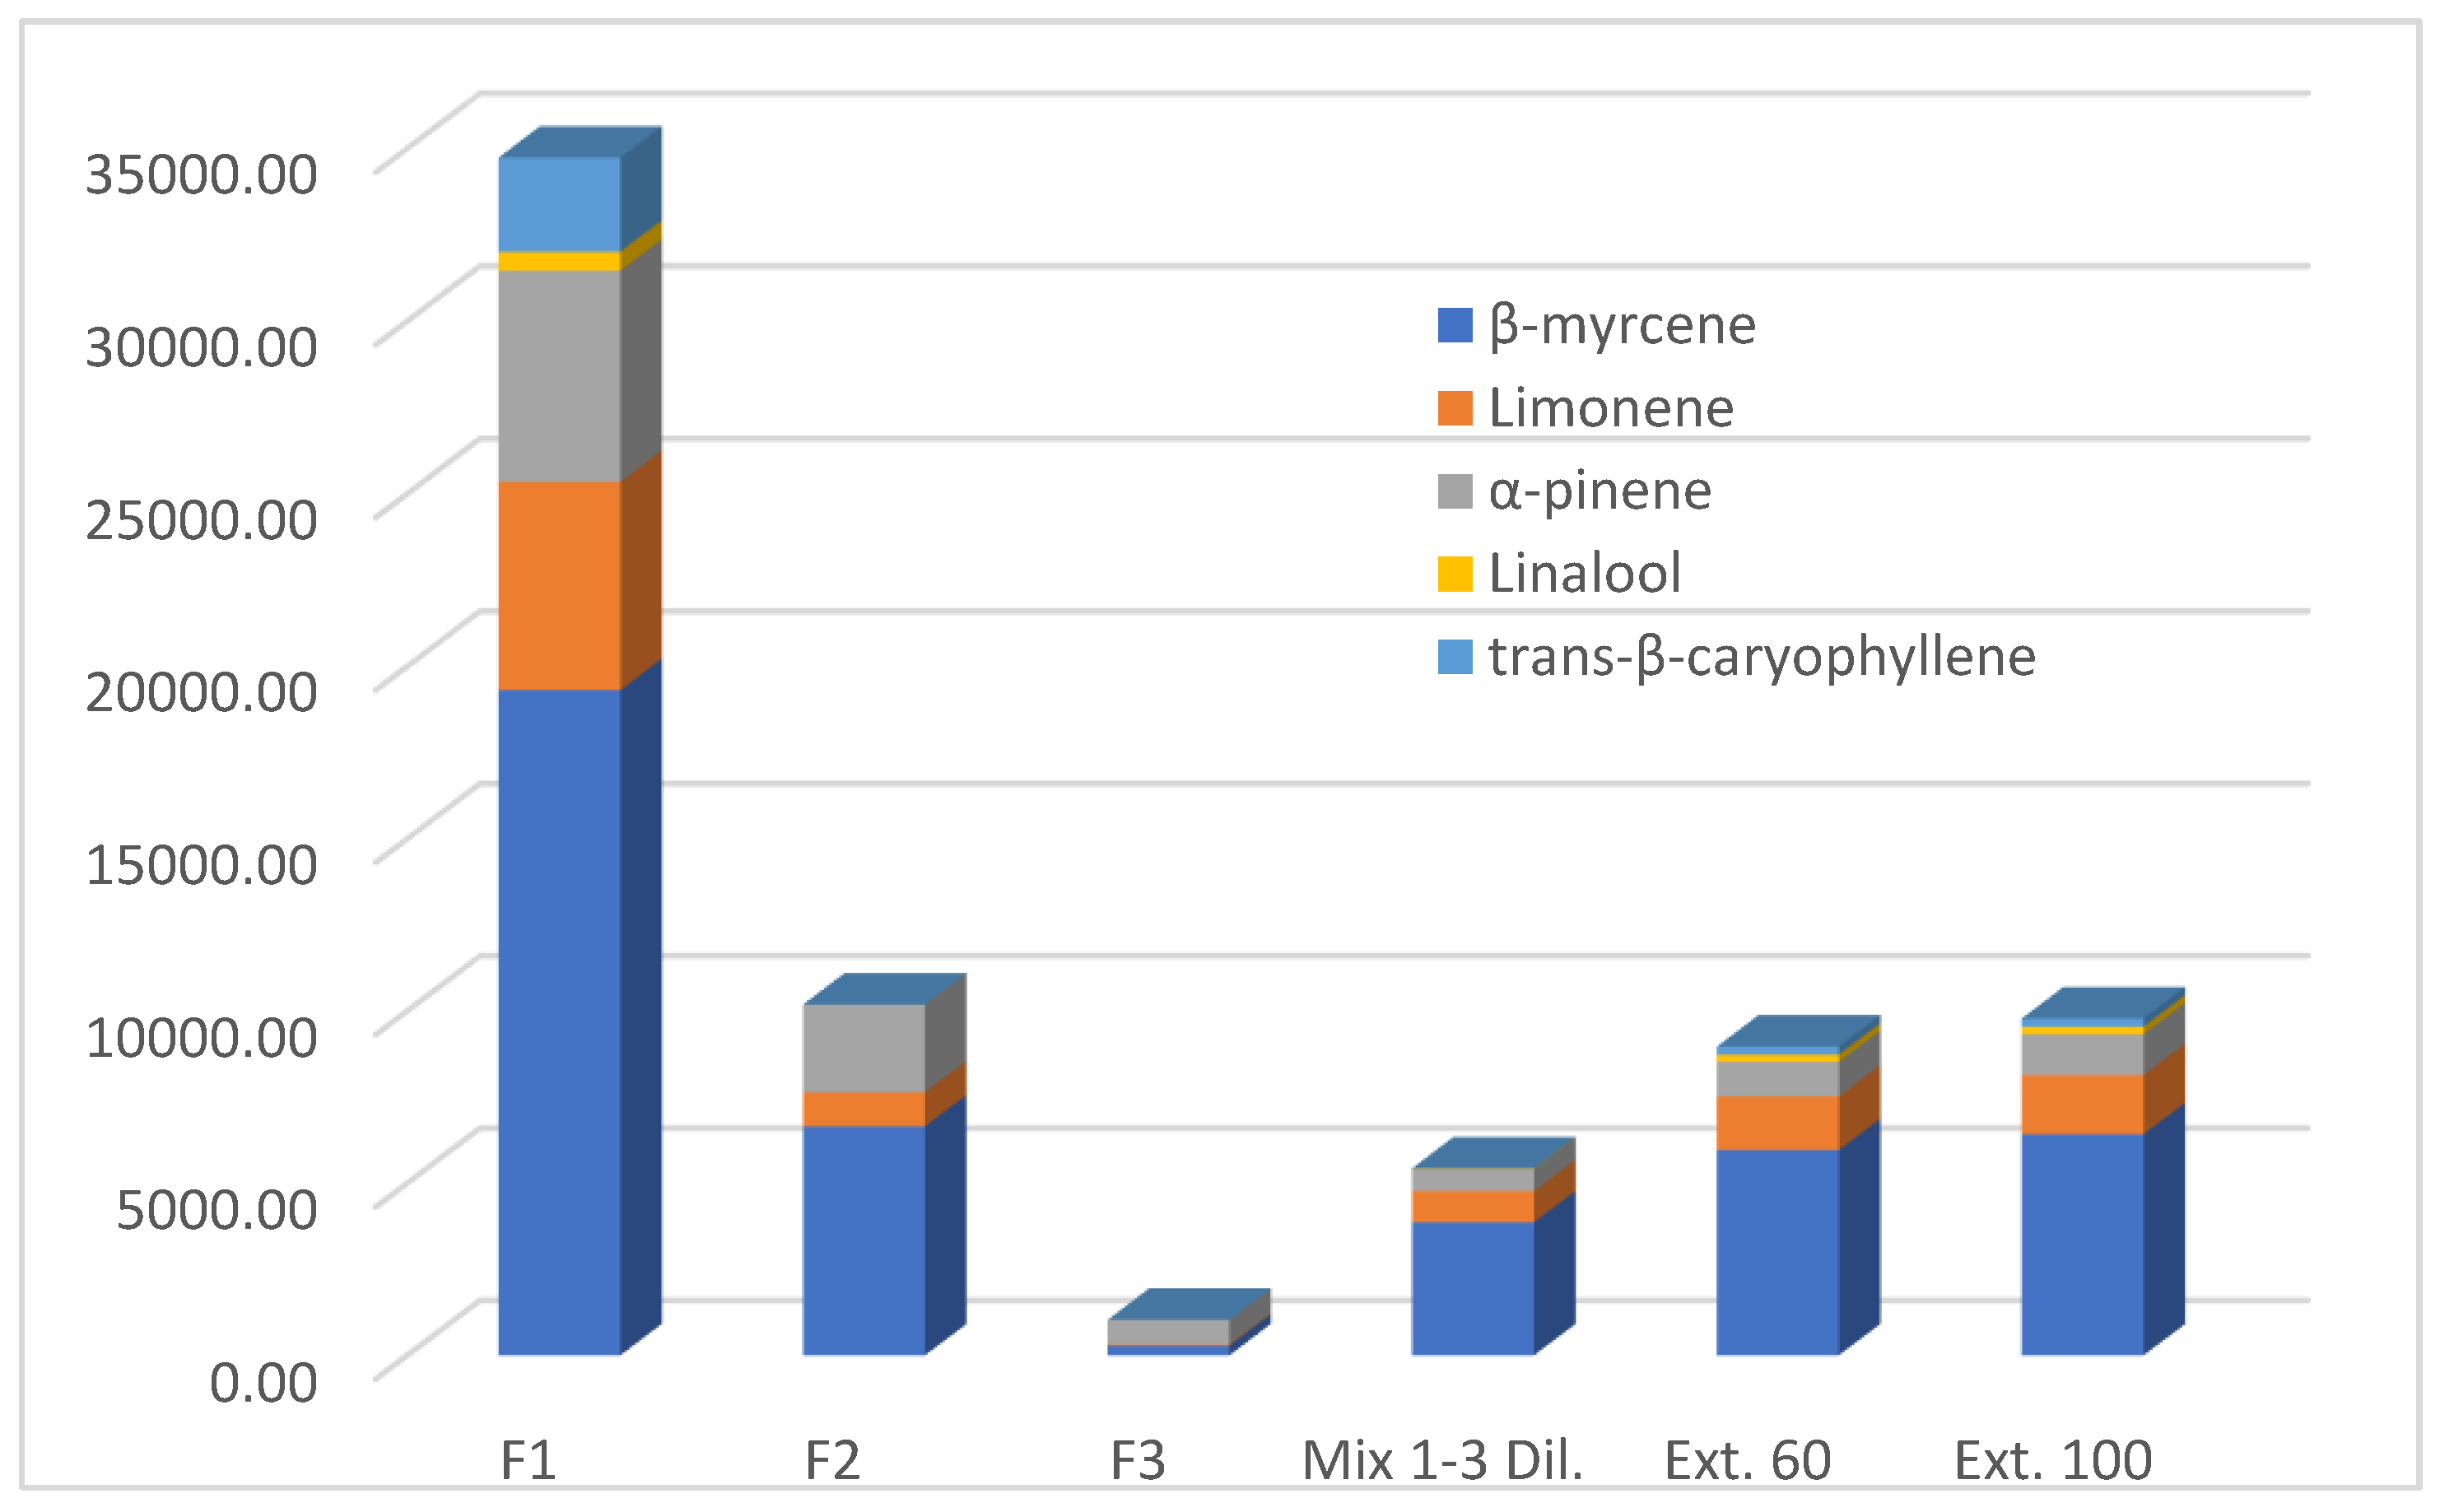
| Compounds | Ret. Time (min) a | Ident. (ST/Qual. %) b | F1 (mg/kg, Mean ± S.D.) c | F2 (mg/kg, Mean ± S.D.) c | F3 (mg/kg, Mean ± S.D.) c |
|---|---|---|---|---|---|
| Monoterpenes | |||||
| α-pinene | 5.01 | CTA | 6120.28 ± 480.41 | 2547.44 ± 167.02 | 712.71 ± 56.82 |
| Camphene | 5.40 | CTA | 207.38 ± 17.6 | 62.94 ± 5.94 | 13.21 ± 2.30 |
| β-pinene | 6.08 | CTA/B | 1703.88 ± 217.10 | 422.61 ± 36.67 | 53.36 ± 4.18 |
| β-myrcene | 6.41 | 97 | 19,314.47 ± 830.54 | 6646.57 ± 481.01 | 285.35 ± 17.79 |
| δ-3-carene | 6.79 | CTA/B | 86.35 ± 20.35 | 48.72 ± 6.97 | 9.14 ± 0.93 |
| limonene | 7.40 | CTA/B | 6030.37 ± 103.55 | 991.04 ± 75.96 | 34.26 ± 9.21 |
| γ-terpinene | 8.17 | CTA | 92.97 ± 6.06 | - | - |
| α-terpinolene | 8.90 | CTB | 80.79 ± 19.84 | - | - |
| Monoterpenoids | |||||
| l-fenchone | 9.08 | CTA | 55.71 ± 21.62 | - | - |
| Linalool | 9.30 | CTB | 543.50 ± 79.71 | - | - |
| d-α-Fenchyl alcohol | 9.90 | CTA | 193.47 ± 24.52 | 92.18 ± 11.02 | 91.13 ± 7.16 |
| Borneol L | 11.43 | CTB | 34.93 ± 2.85 | - | - |
| Terpinen-4-ol | 11.67 | 90 | 17.48 ± 2.36 | - | - |
| α-terpineol | 12.10 | CTB | 80.50 ± 8.04 | - | - |
| Sesquiterpenes | |||||
| trans-β-caryophyllene | 17.90 | CTB | 2724.93 ± 615.49 | - | - |
| α-bergamotene | 18.20 | 91 | 31.76 ± 5.56 | - | - |
| trans-β-farnesene | 18.75 | 96 | 11.69 ± 9.70 | 8.09 ± 1.11 | 9.61 ± 0.54 |
| α-humulene | 18.87 | CTA | 59.93 ± 19.79 | - | - |
| α-selinene | 19.89 | 92 | 6.54 ± 4.80 | - | - |
| β-bisabolene | 20.00 | 91 | 16.56 ± 12.39 | - | - |
| Selina-3,7(11)diene | 20.99 | 96 | 14.04 ± 12.37 | - | - |
| Total | - | - | 37,390.38 ± 723.16 | 10,819.59 ± 187.83 | 1208.78 ± 31.12 |
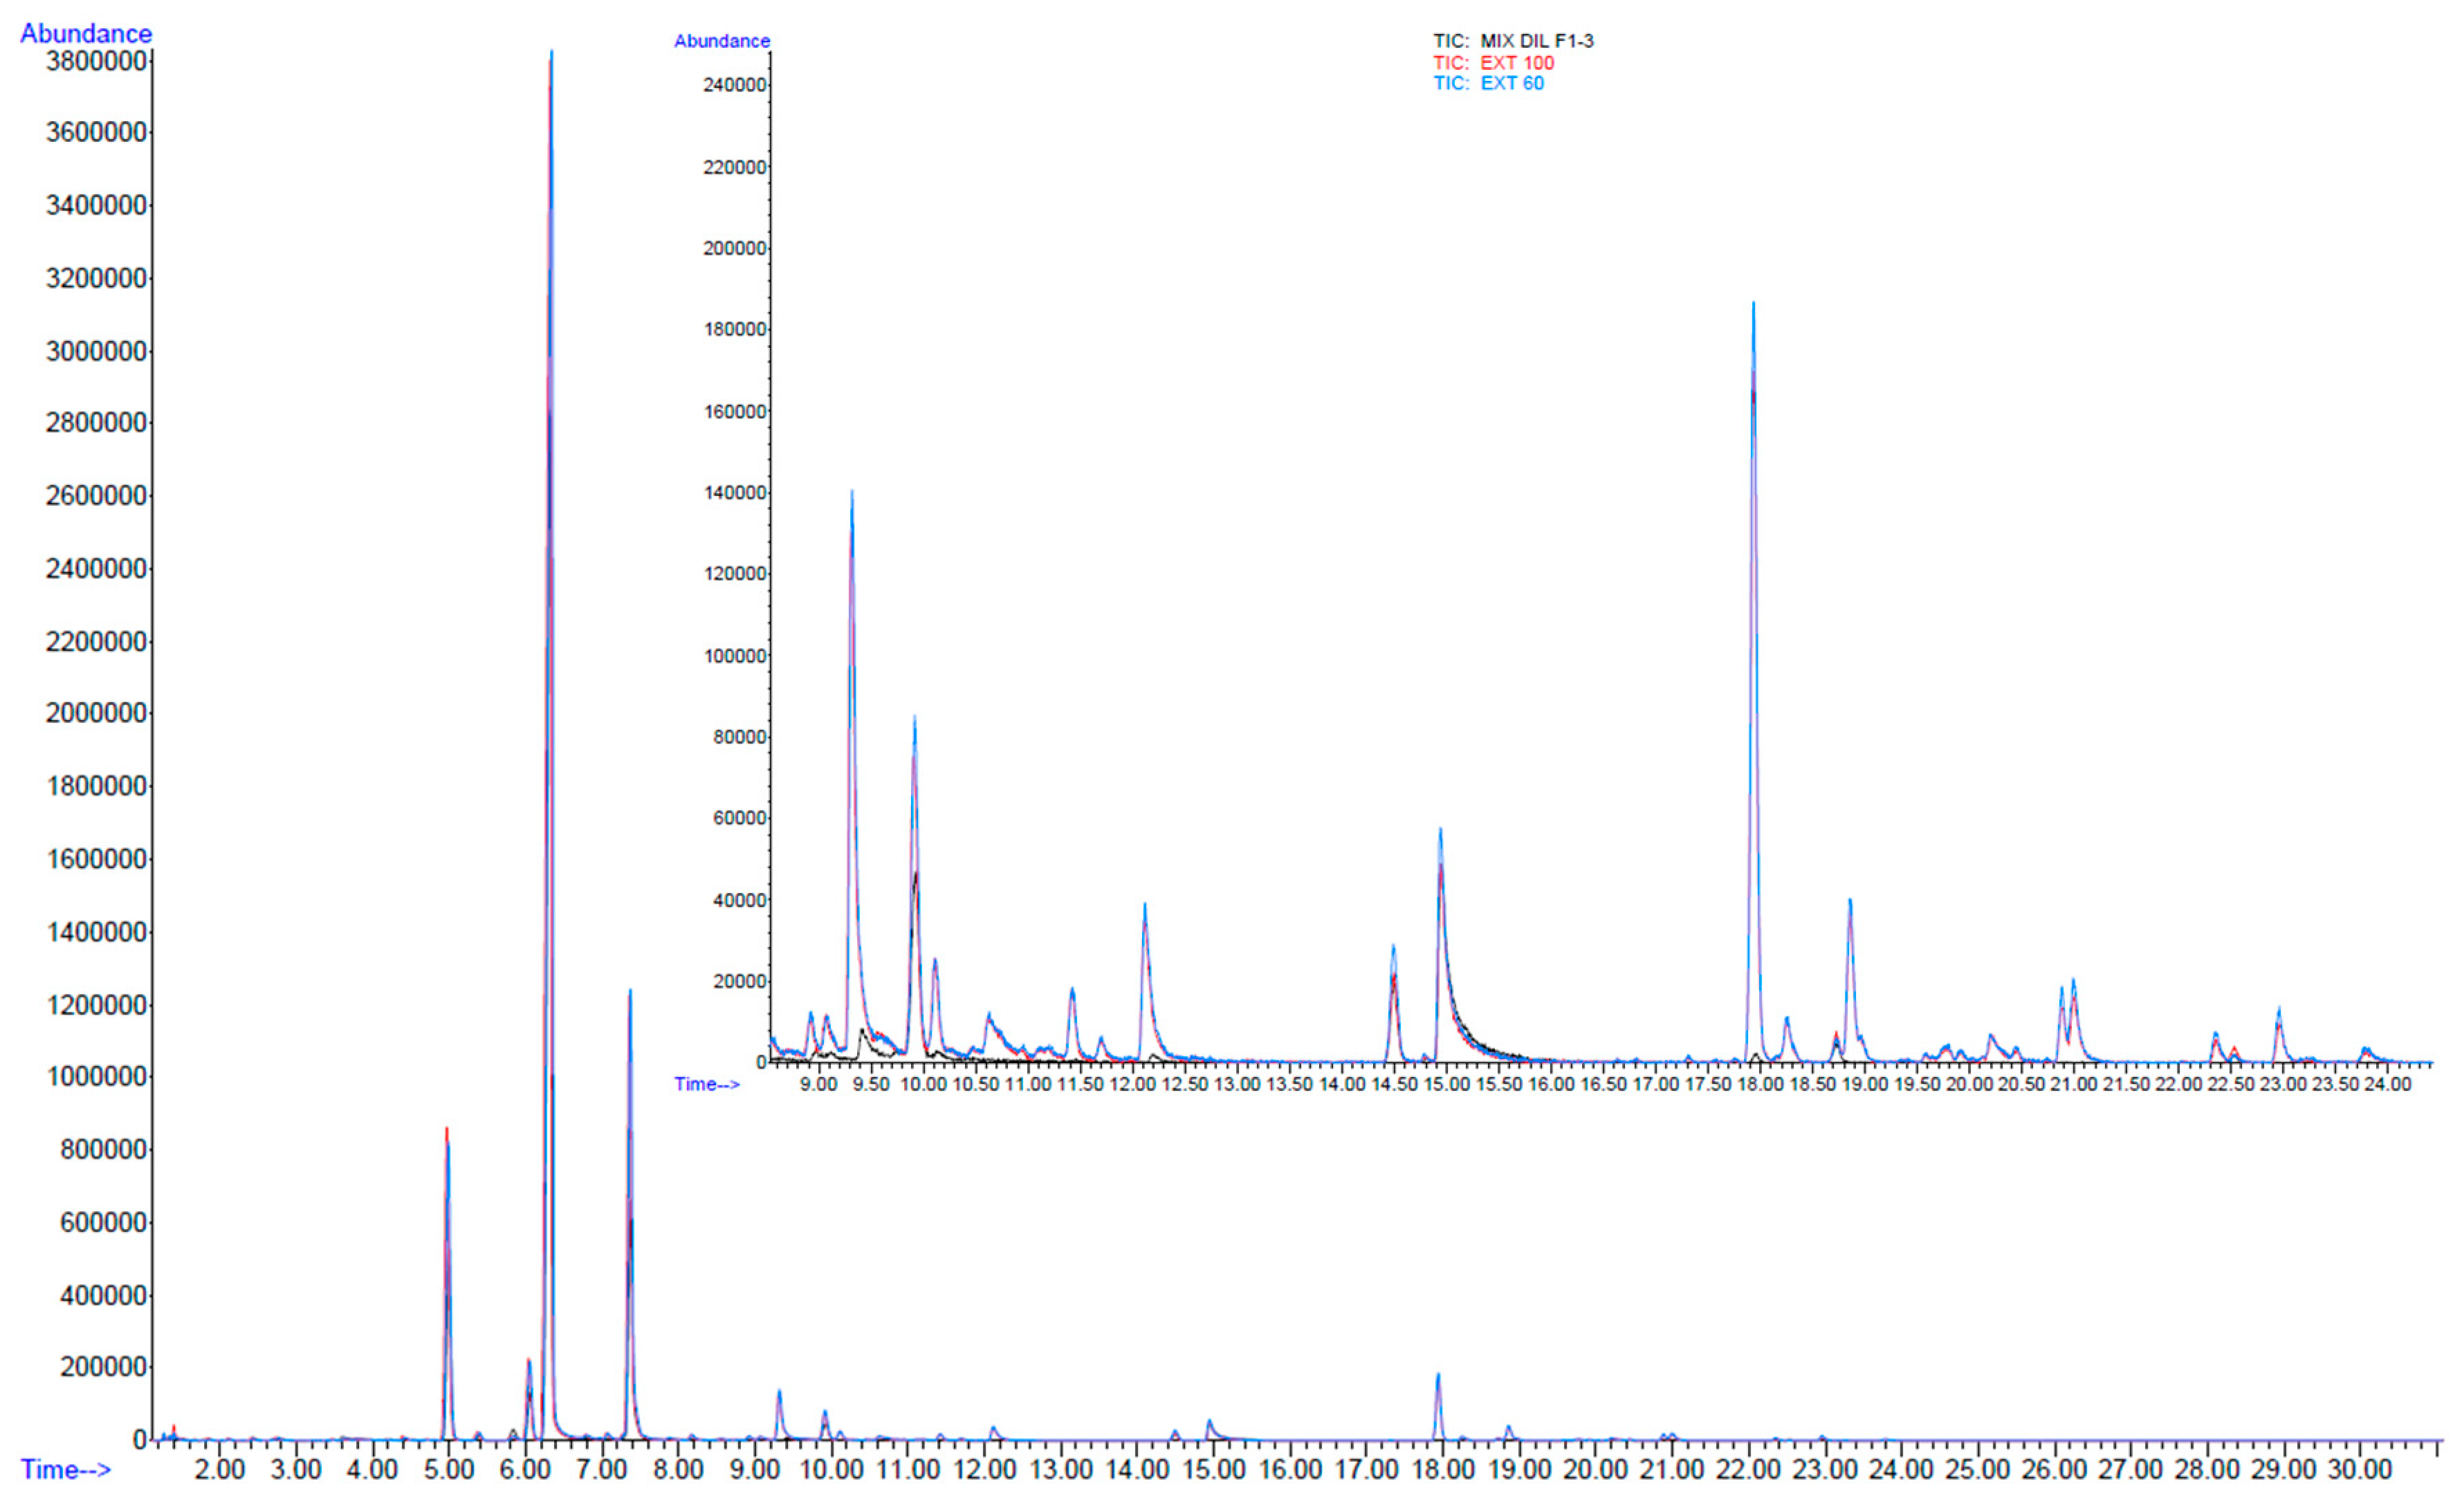
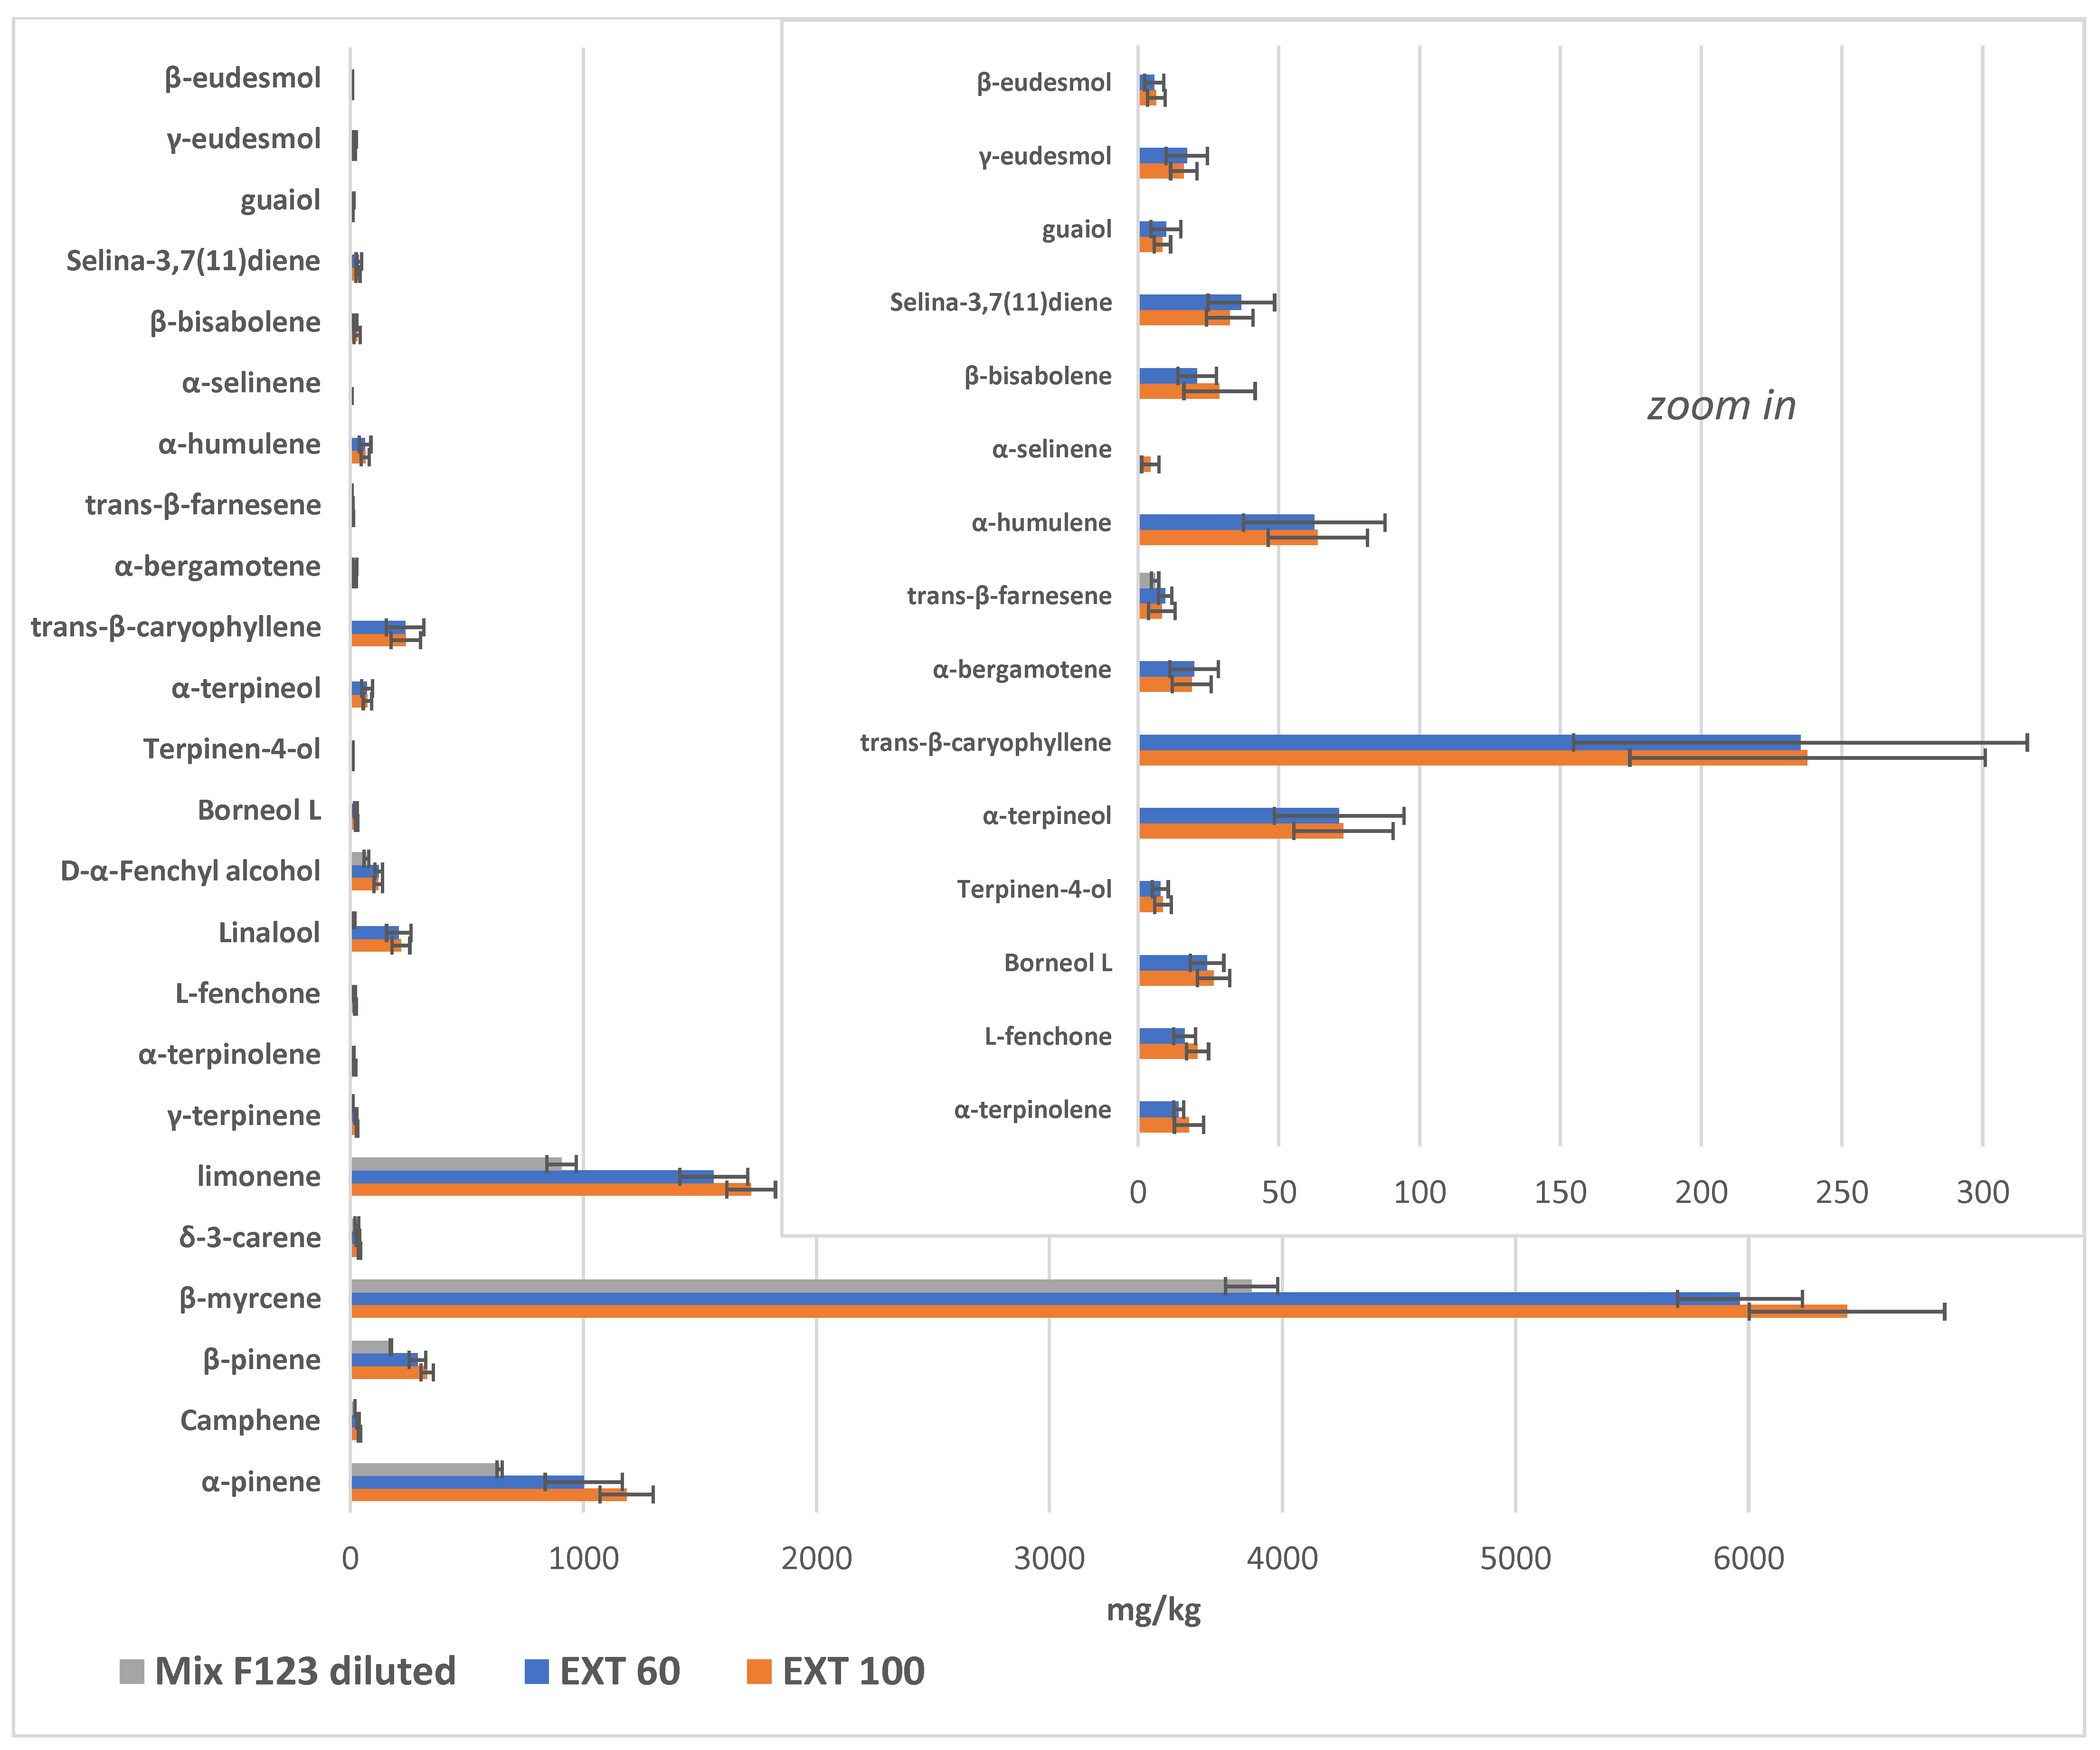
| Compounds | Mix F1 ÷ 3 dil. (mg/kg, Mean ± S.D.) a | Ext. 60 (mg/kg, Mean ± S.D.) a | Ext. 100 (mg/kg, Mean ± S.D.) a | Increase % Ext. 60 b | Increase % Ext. 100 b |
|---|---|---|---|---|---|
| Monoterpenes | |||||
| α-pinene | 639.89 ± 11.59 | 1001.30 ± 165.37 | 1185.22 ± 114.54 | 56.48 | 85.22 |
| Camphene | 19.30 ± 0.15 | 32.63 ± 5.53 | 38.30 ± 4.52 | 69.05 | 98.40 |
| β-pinene | 173.96 ± 2.63 | 287.73 ± 35.62 | 329.46 ± 26.45 | 65.40 | 89.38 |
| β-myrcene | 3866.84 ± 112.21 | 5963.38 ± 268.21 | 6422.52 ± 419.28 | 54.22 | 66.09 |
| δ-3-carene | 27.61 ± 8.05 | 31.68 ± 7.46 | 38.31 ± 4.57 | 14.73 | 38.76 |
| limonene | 906.52 ± 63.54 | 1559.04 ± 145.29 | 1720.05 ± 104.28 | 71.98 | 89.74 |
| γ-terpinene | 8.49 ± 1.92 | 23.49 ± 3.48 | 28.53 ± 2.82 | 176.63 | 235.88 |
| α-terpinolene | − | 14.41 ± 1.78 | 18.11 ± 5.20 | + | + |
| Monoterpenoids | |||||
| l-fenchone | − | 16.59 ± 3.88 | 21.12 ± 3.93 | + | + |
| Linalool | 16.86 ± 2.41 | 207.45 ± 52.45 | 216.71 ± 38.32 | 1130.42 | 1185.33 |
| d-α-Fenchyl alcohol | 68.45 ± 10.65 | 121.70 ± 16.08 | 119.17 ± 18.53 | 77.79 | 74.10 |
| Borneol L | − | 24.51 ± 5.94 | 26.79 ± 5.74 | + | + |
| Terpinen-4-ol | − | 7.87 ± 2.84 | 8.82 ± 2.93 | + | + |
| α-terpineol | − | 71.44 ± 23.03 | 72.94 ± 17.60 | + | + |
| Sesquiterpenes | |||||
| trans-β-caryophyllene | − | 235.29 ± 80.56 | 237.78 ± 63.10 | + | + |
| α-bergamotene | − | 19.94 ± 8.60 | 19.07 ± 6.91 | + | + |
| trans-β-farnesene | 6.04 ± 1.32 | 9.65 ± 2.34 | 8.43 ± 4.77 | 59.64 | 39.45 |
| α-humulene | − | 62.57 ± 25.17 | 63.80 ± 17.63 | + | + |
| α-selinene | − | − | 4.36 ± 3.10 | + | + |
| β-bisabolene | − | 21.00 ± 6.84 | 28.93 ± 12.66 | + | + |
| Selina-3,7(11)diene | − | 36.68 ± 11.80 | 32.59 ± 8.26 | + | + |
| Sesquiterpenoids | |||||
| guaiol | − | 9.92 ± 5.31 | 8.67 ± 2.89 | + | + |
| γ-eudesmol | − | 17.30 ± 7.35 | 16.23 ± 4.69 | + | + |
| β-eudesmol | − | 5.78 ± 3.38 | 6.50 ± 3.14 | + | + |
| Total | 5733.97 ± 167.35 A | 9775.56 ± 678.04 B | 10,672.39 ± 723.05 B | 70.48 | 86.13 |
| Samples a | Total Terpenes (mg/kg) | Total Terpenes (mg in the Sample) | Terpene Recovery (w/w %) b |
|---|---|---|---|
| Inflorescences (100 g) | 91,324.74 ± 2774.36 | 9132.47 | - |
| F1 (100 mL olive oil) | 37,390.38 ± 723.16 | 3439.92 | 37.67 ± 0.73 |
| F2 (100 mL olive oil) | 10,819.59 ± 187.80 | 995.40 | 10.90 ± 0.19 |
| F3 (100 mL olive oil) | 1208.78 ± 31.10 | 111.21 | 1.22 ± 0.03 |
| Mix F1 ÷ 3 dil. (260 mL of 1:1:1 mixture of F1, 2 and 3/1000 mL olive oil) | 5733.97 ± 167.35 | 5275.25 | 57.76 ± 1.69 |
| Ext 60 (500 mL Mix F1 ÷ 3 dil./ 50 g inflorescences) | 9775.56 ± 678.04 | 4496.76 | 98.48 ± 6.83 |
| Ext 100 (500 mL Mix F1 ÷ 3 dil./ 50 g inflorescences) | 10,672.39 ± 723.05 | 4909.30 | 107.51 ± 7.28 |
Disclaimer/Publisher’s Note: The statements, opinions and data contained in all publications are solely those of the individual author(s) and contributor(s) and not of MDPI and/or the editor(s). MDPI and/or the editor(s) disclaim responsibility for any injury to people or property resulting from any ideas, methods, instructions or products referred to in the content. |
© 2024 by the authors. Licensee MDPI, Basel, Switzerland. This article is an open access article distributed under the terms and conditions of the Creative Commons Attribution (CC BY) license (https://creativecommons.org/licenses/by/4.0/).
Share and Cite
Boffa, L.; Binello, A.; Cravotto, G. Efficient Capture of Cannabis Terpenes in Olive Oil during Microwave-Assisted Cannabinoid Decarboxylation. Molecules 2024, 29, 899. https://doi.org/10.3390/molecules29040899
Boffa L, Binello A, Cravotto G. Efficient Capture of Cannabis Terpenes in Olive Oil during Microwave-Assisted Cannabinoid Decarboxylation. Molecules. 2024; 29(4):899. https://doi.org/10.3390/molecules29040899
Chicago/Turabian StyleBoffa, Luisa, Arianna Binello, and Giancarlo Cravotto. 2024. "Efficient Capture of Cannabis Terpenes in Olive Oil during Microwave-Assisted Cannabinoid Decarboxylation" Molecules 29, no. 4: 899. https://doi.org/10.3390/molecules29040899
APA StyleBoffa, L., Binello, A., & Cravotto, G. (2024). Efficient Capture of Cannabis Terpenes in Olive Oil during Microwave-Assisted Cannabinoid Decarboxylation. Molecules, 29(4), 899. https://doi.org/10.3390/molecules29040899