
The Identification of Structural Changes in the Lithium Hexamethyldisilazide–Toluene System via Ultrasonic Relaxation Spectroscopy and Theoretical Calculations


Abstract
1. Introduction
2. Results and Discussion
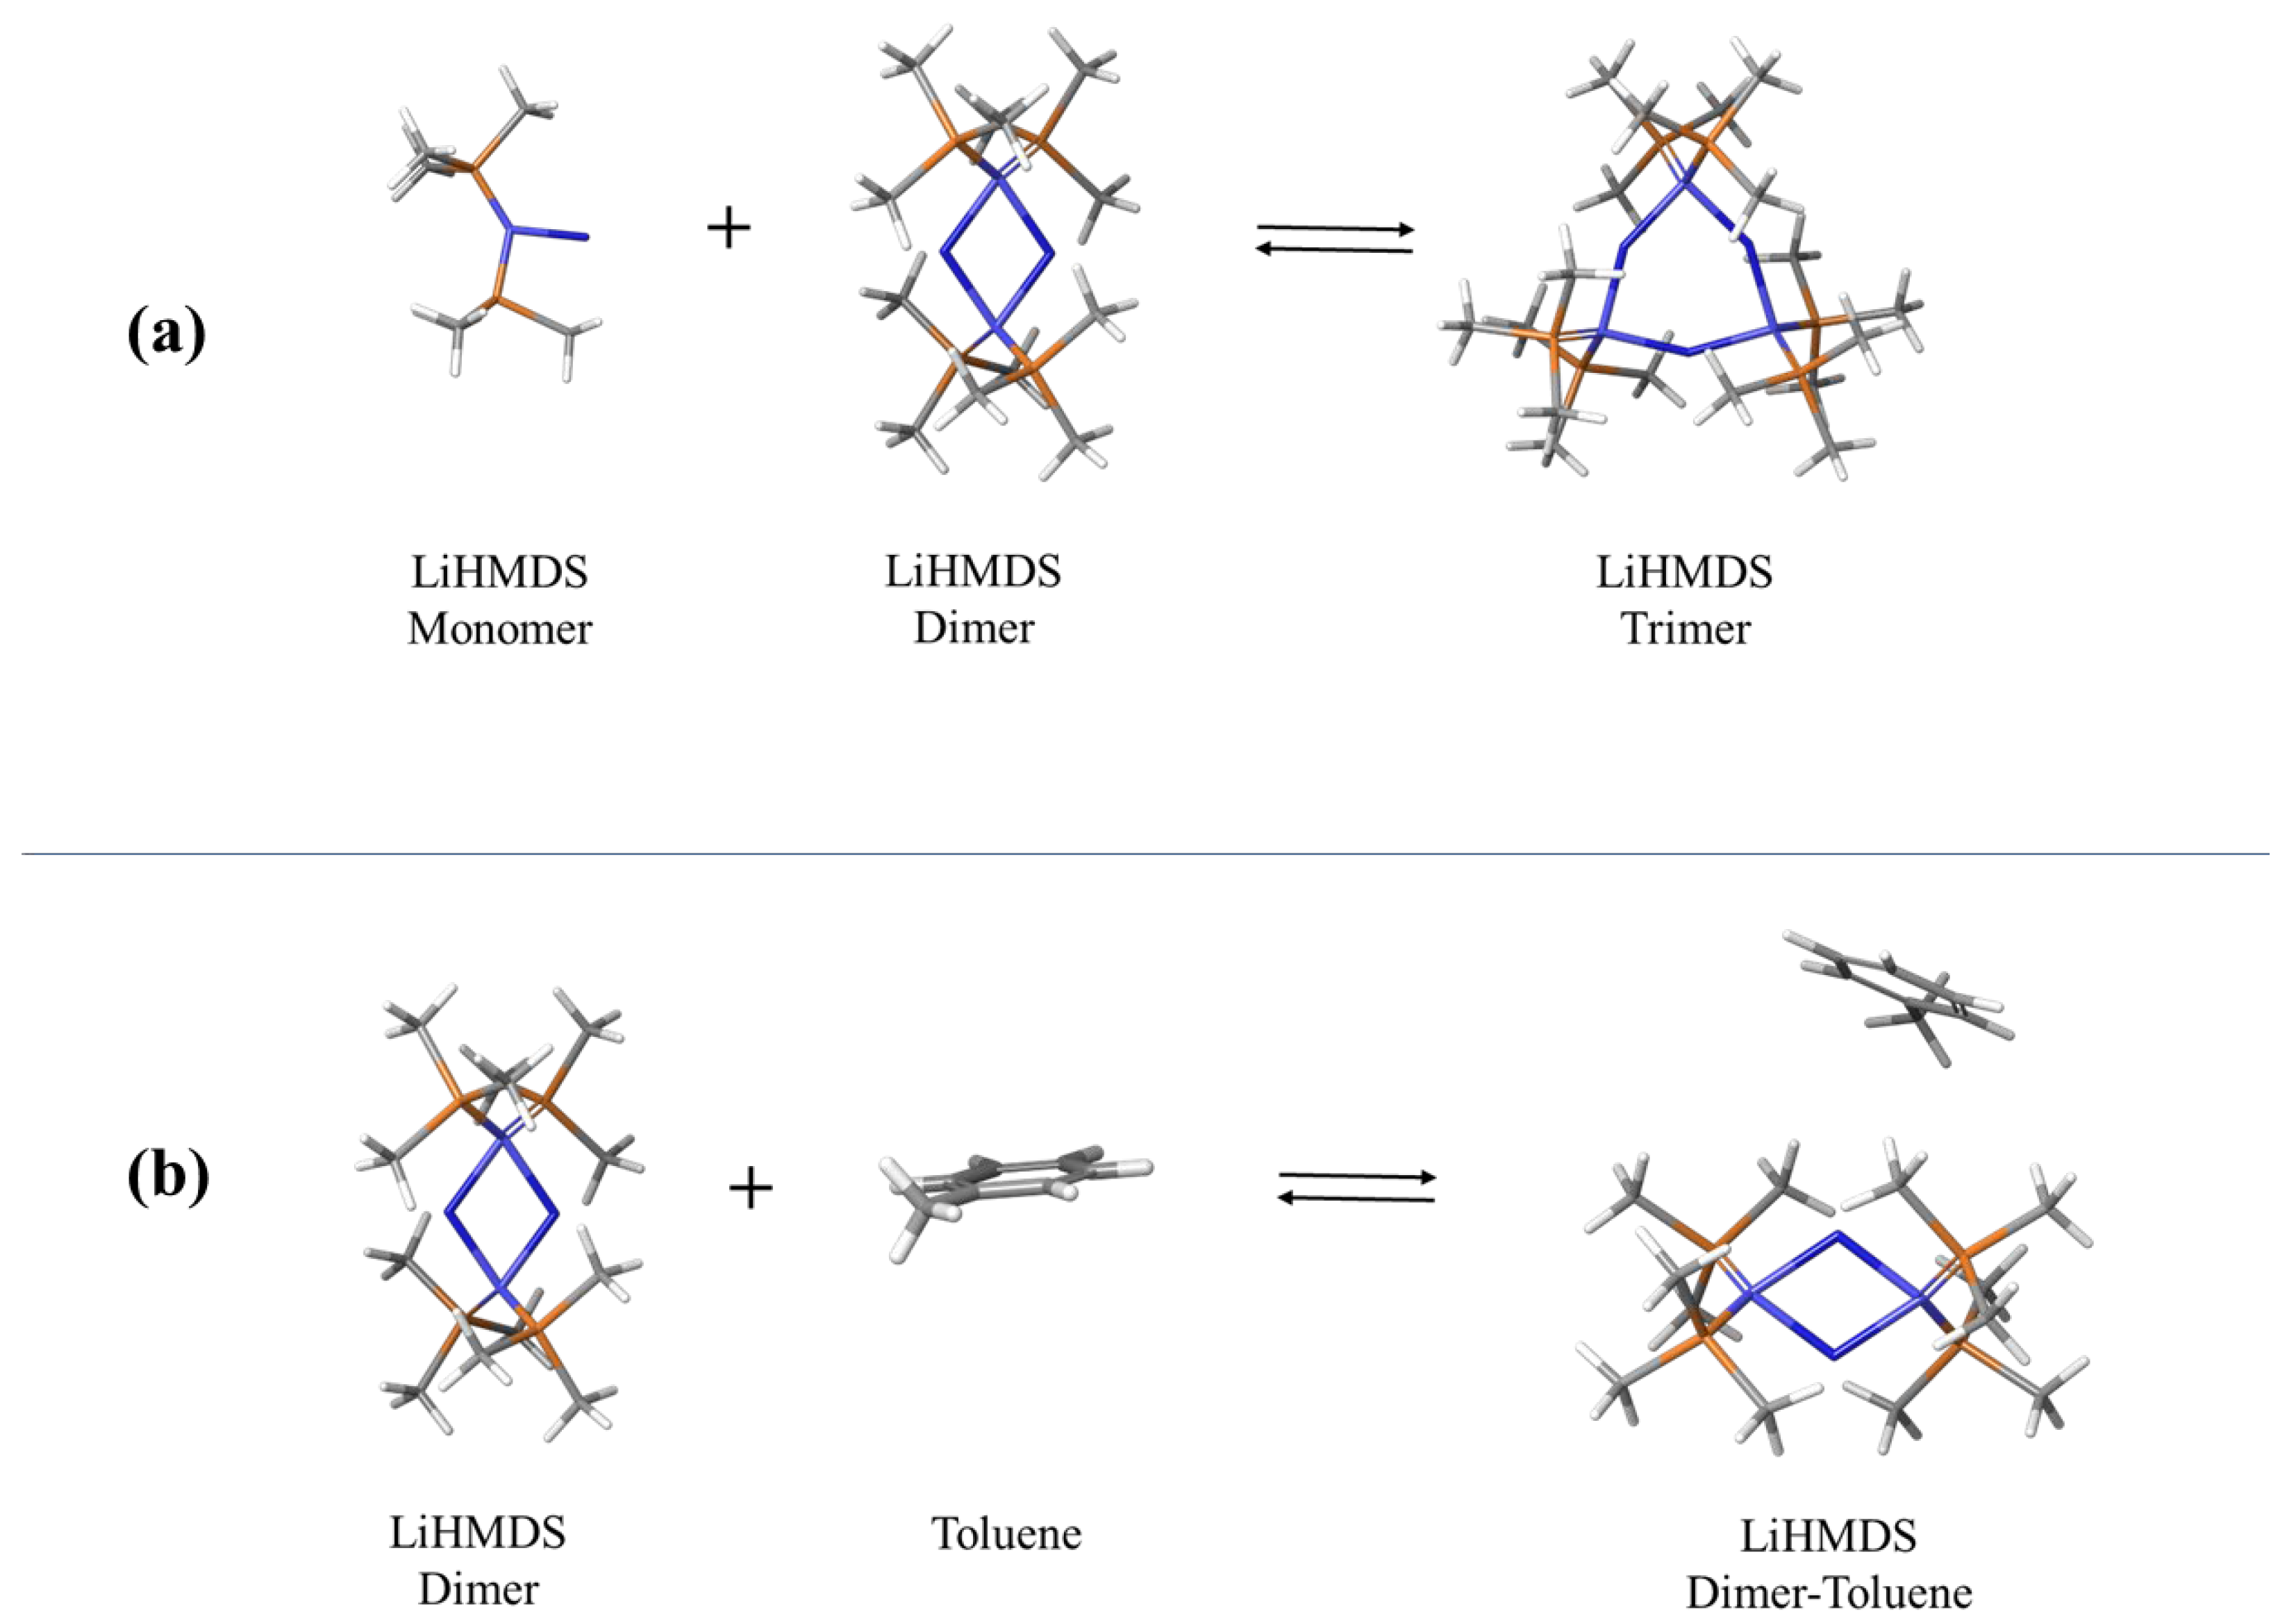
2.1. Structural Processes in LiHMDS Solutions
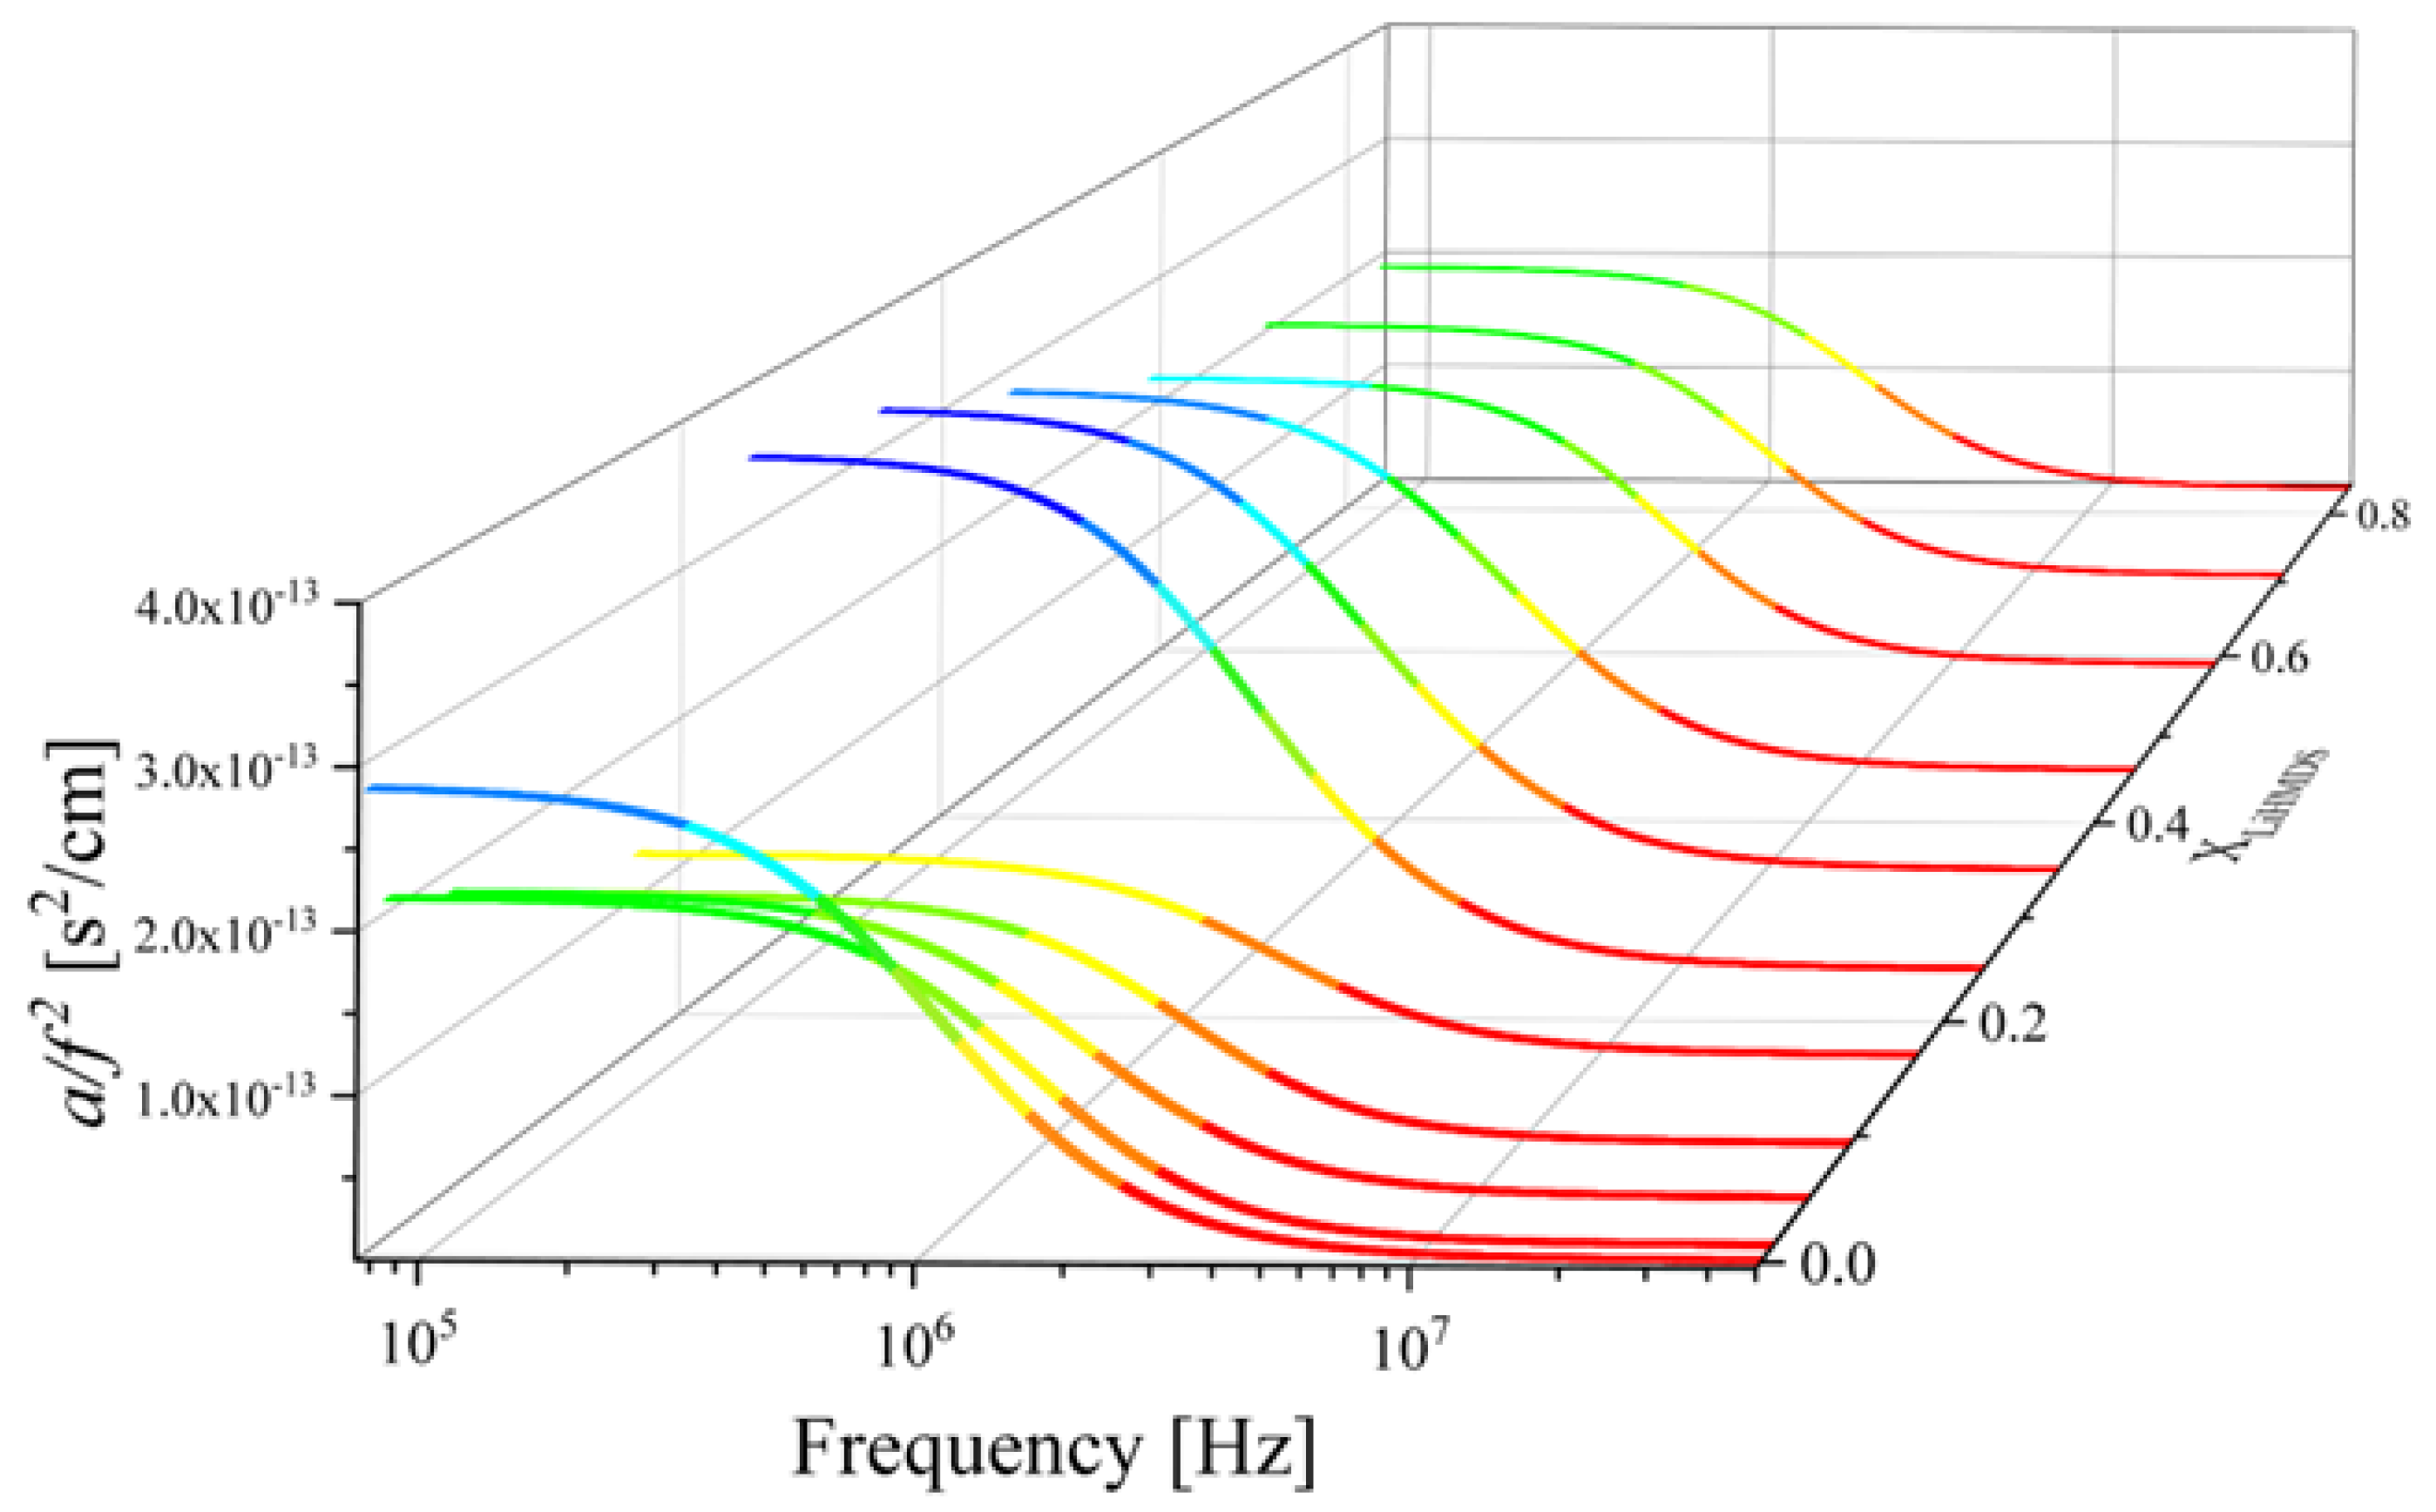
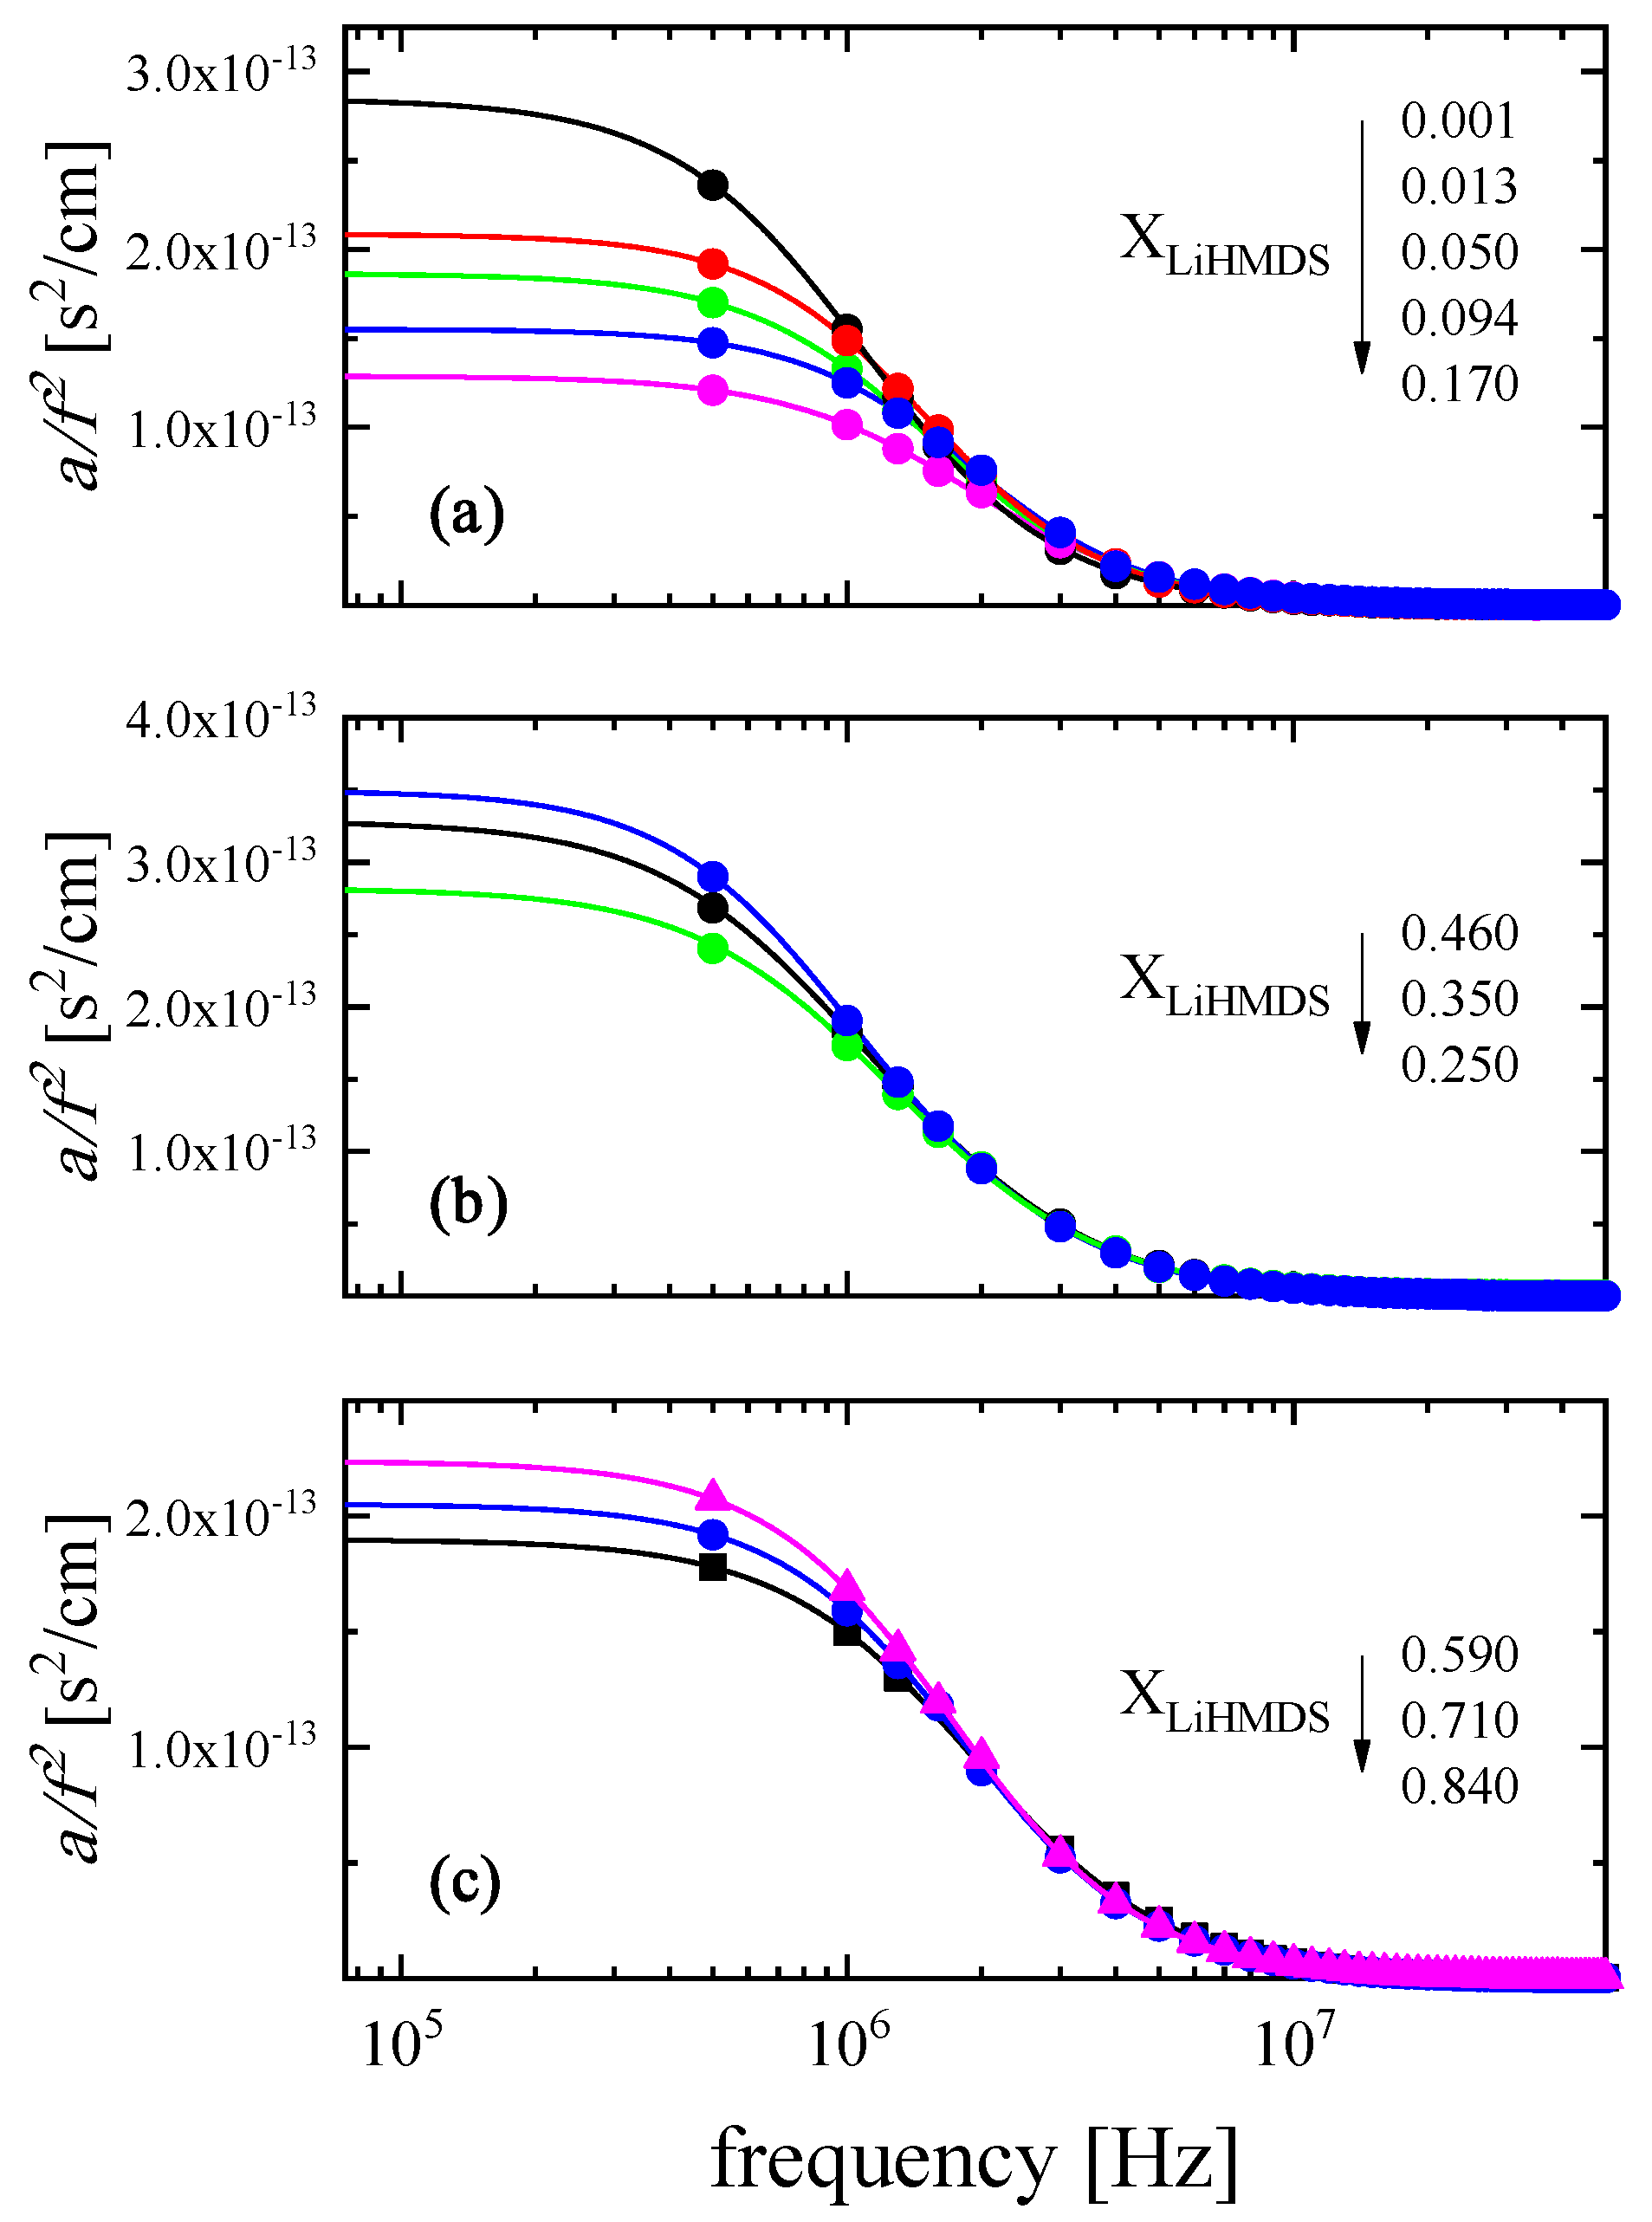
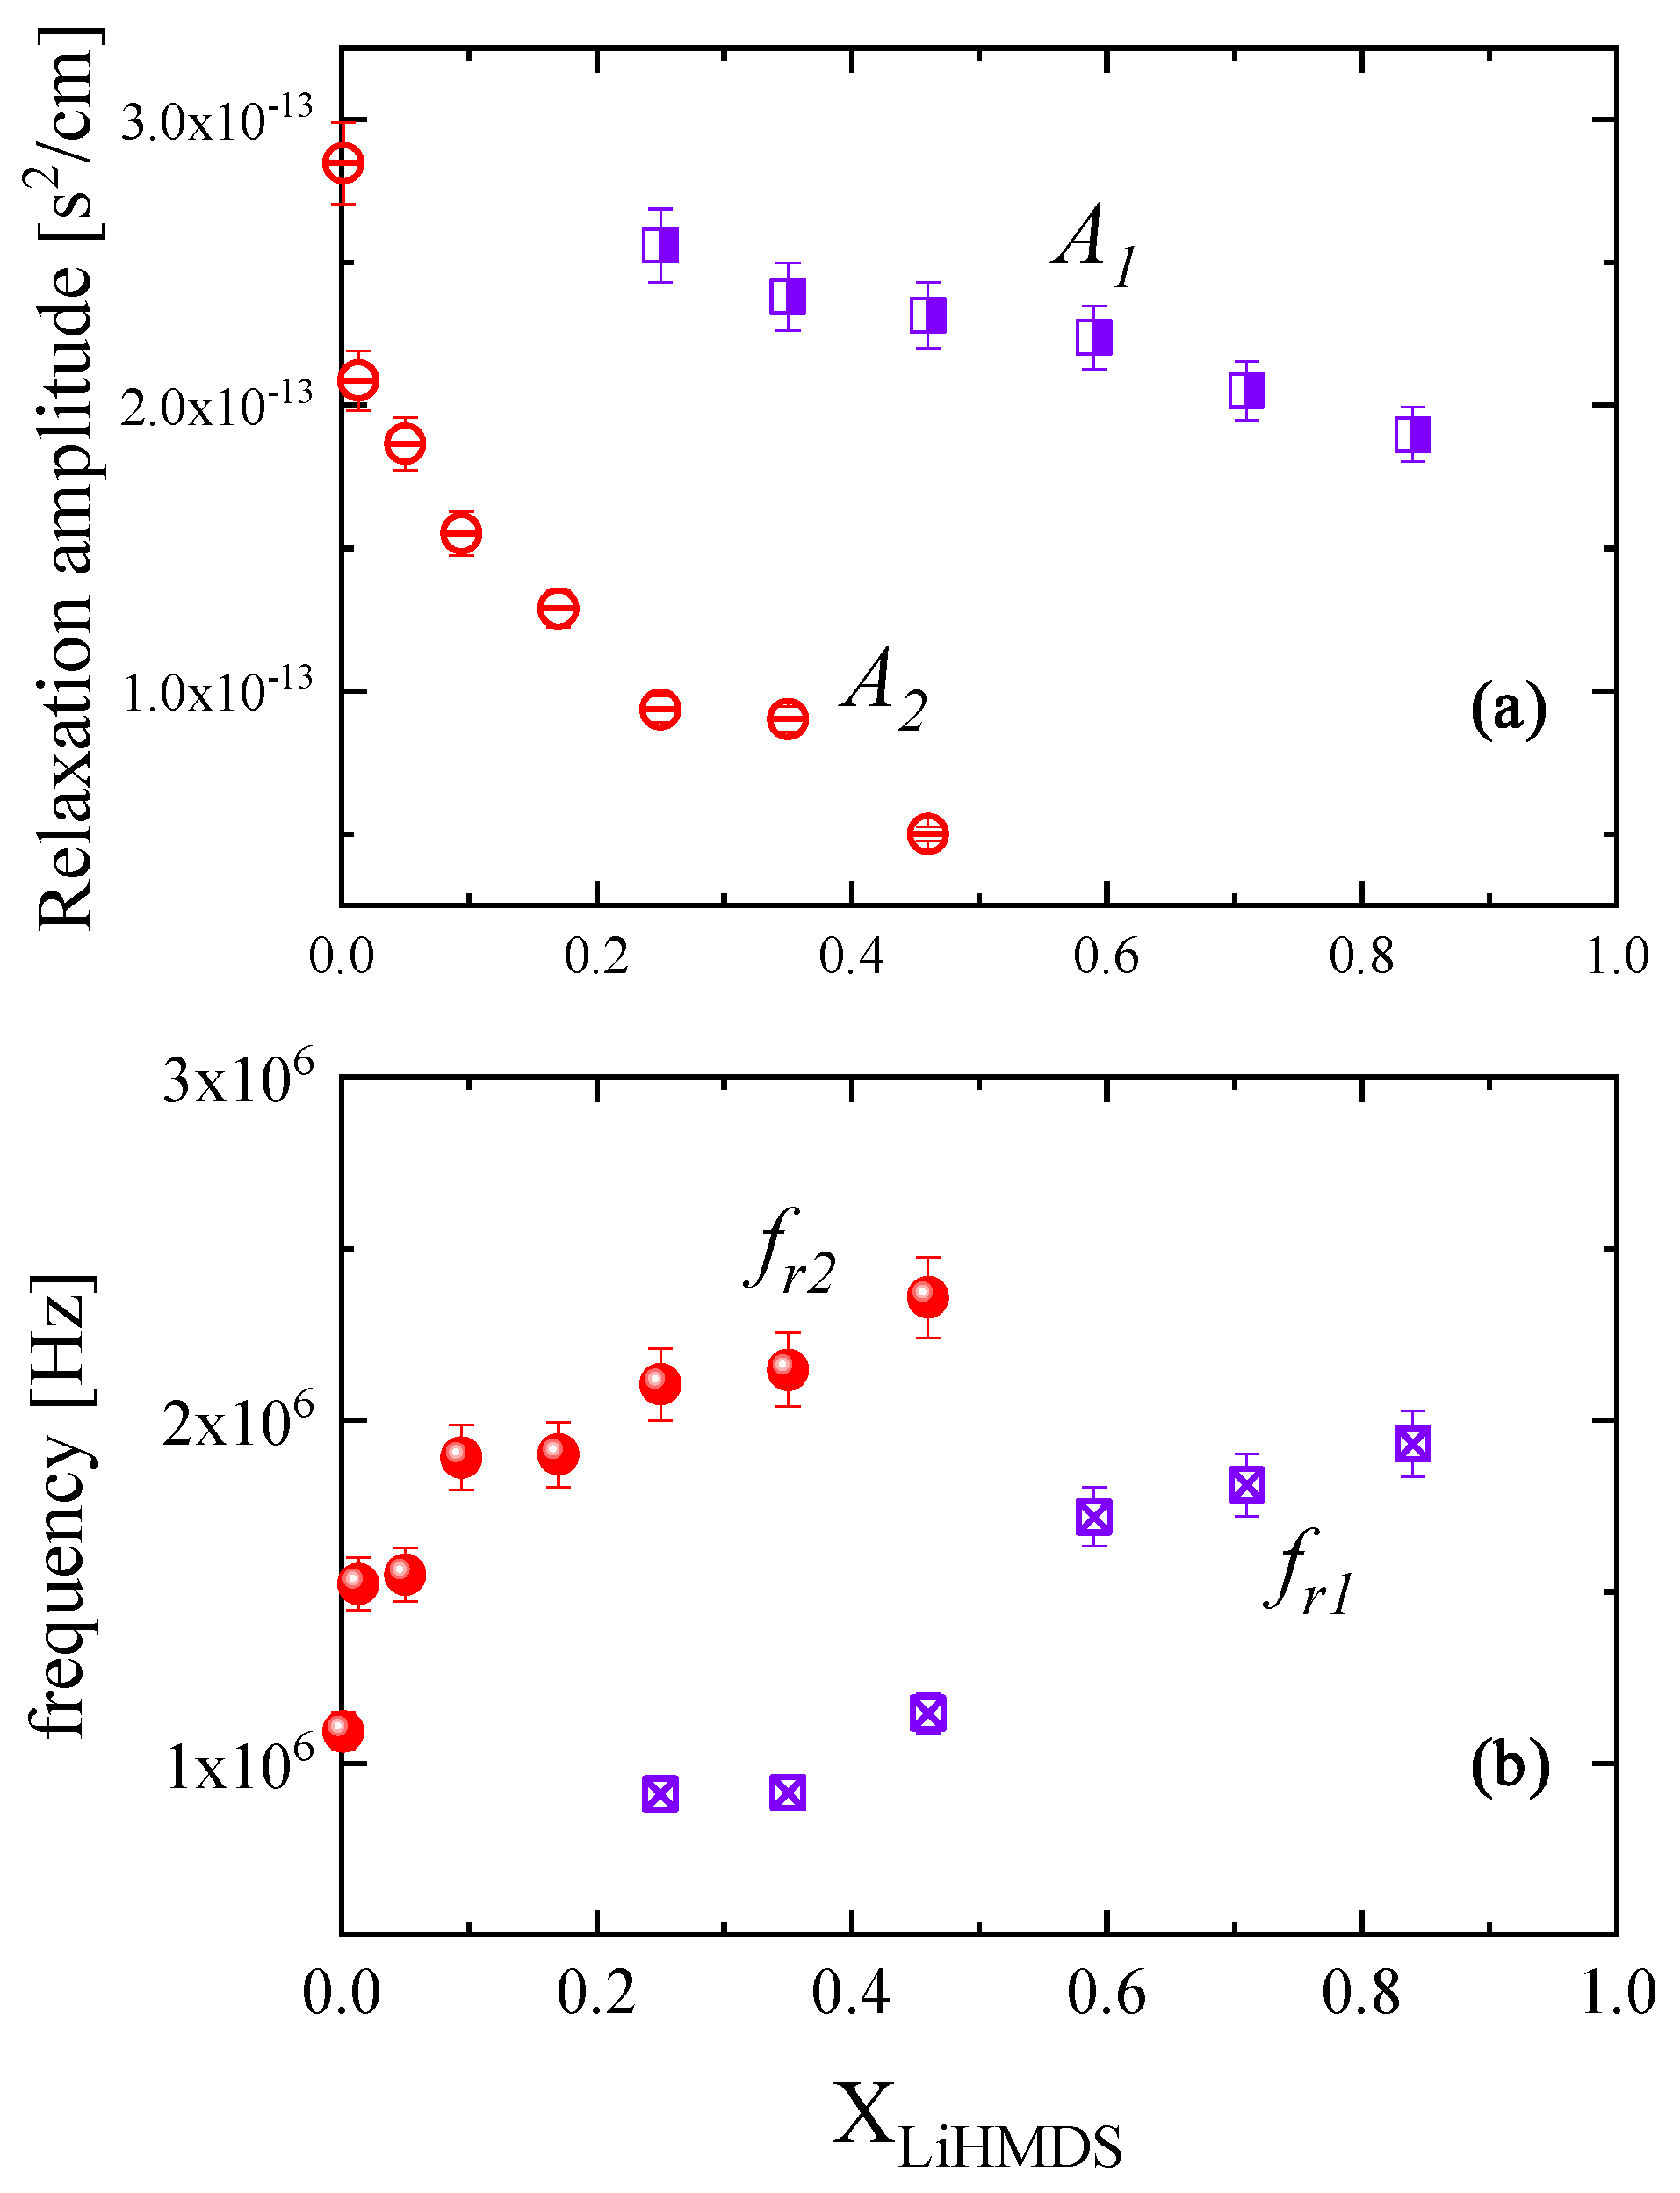
2.2. Ultrasonic Sensing of the Relaxation Processes—Concentration Dependence
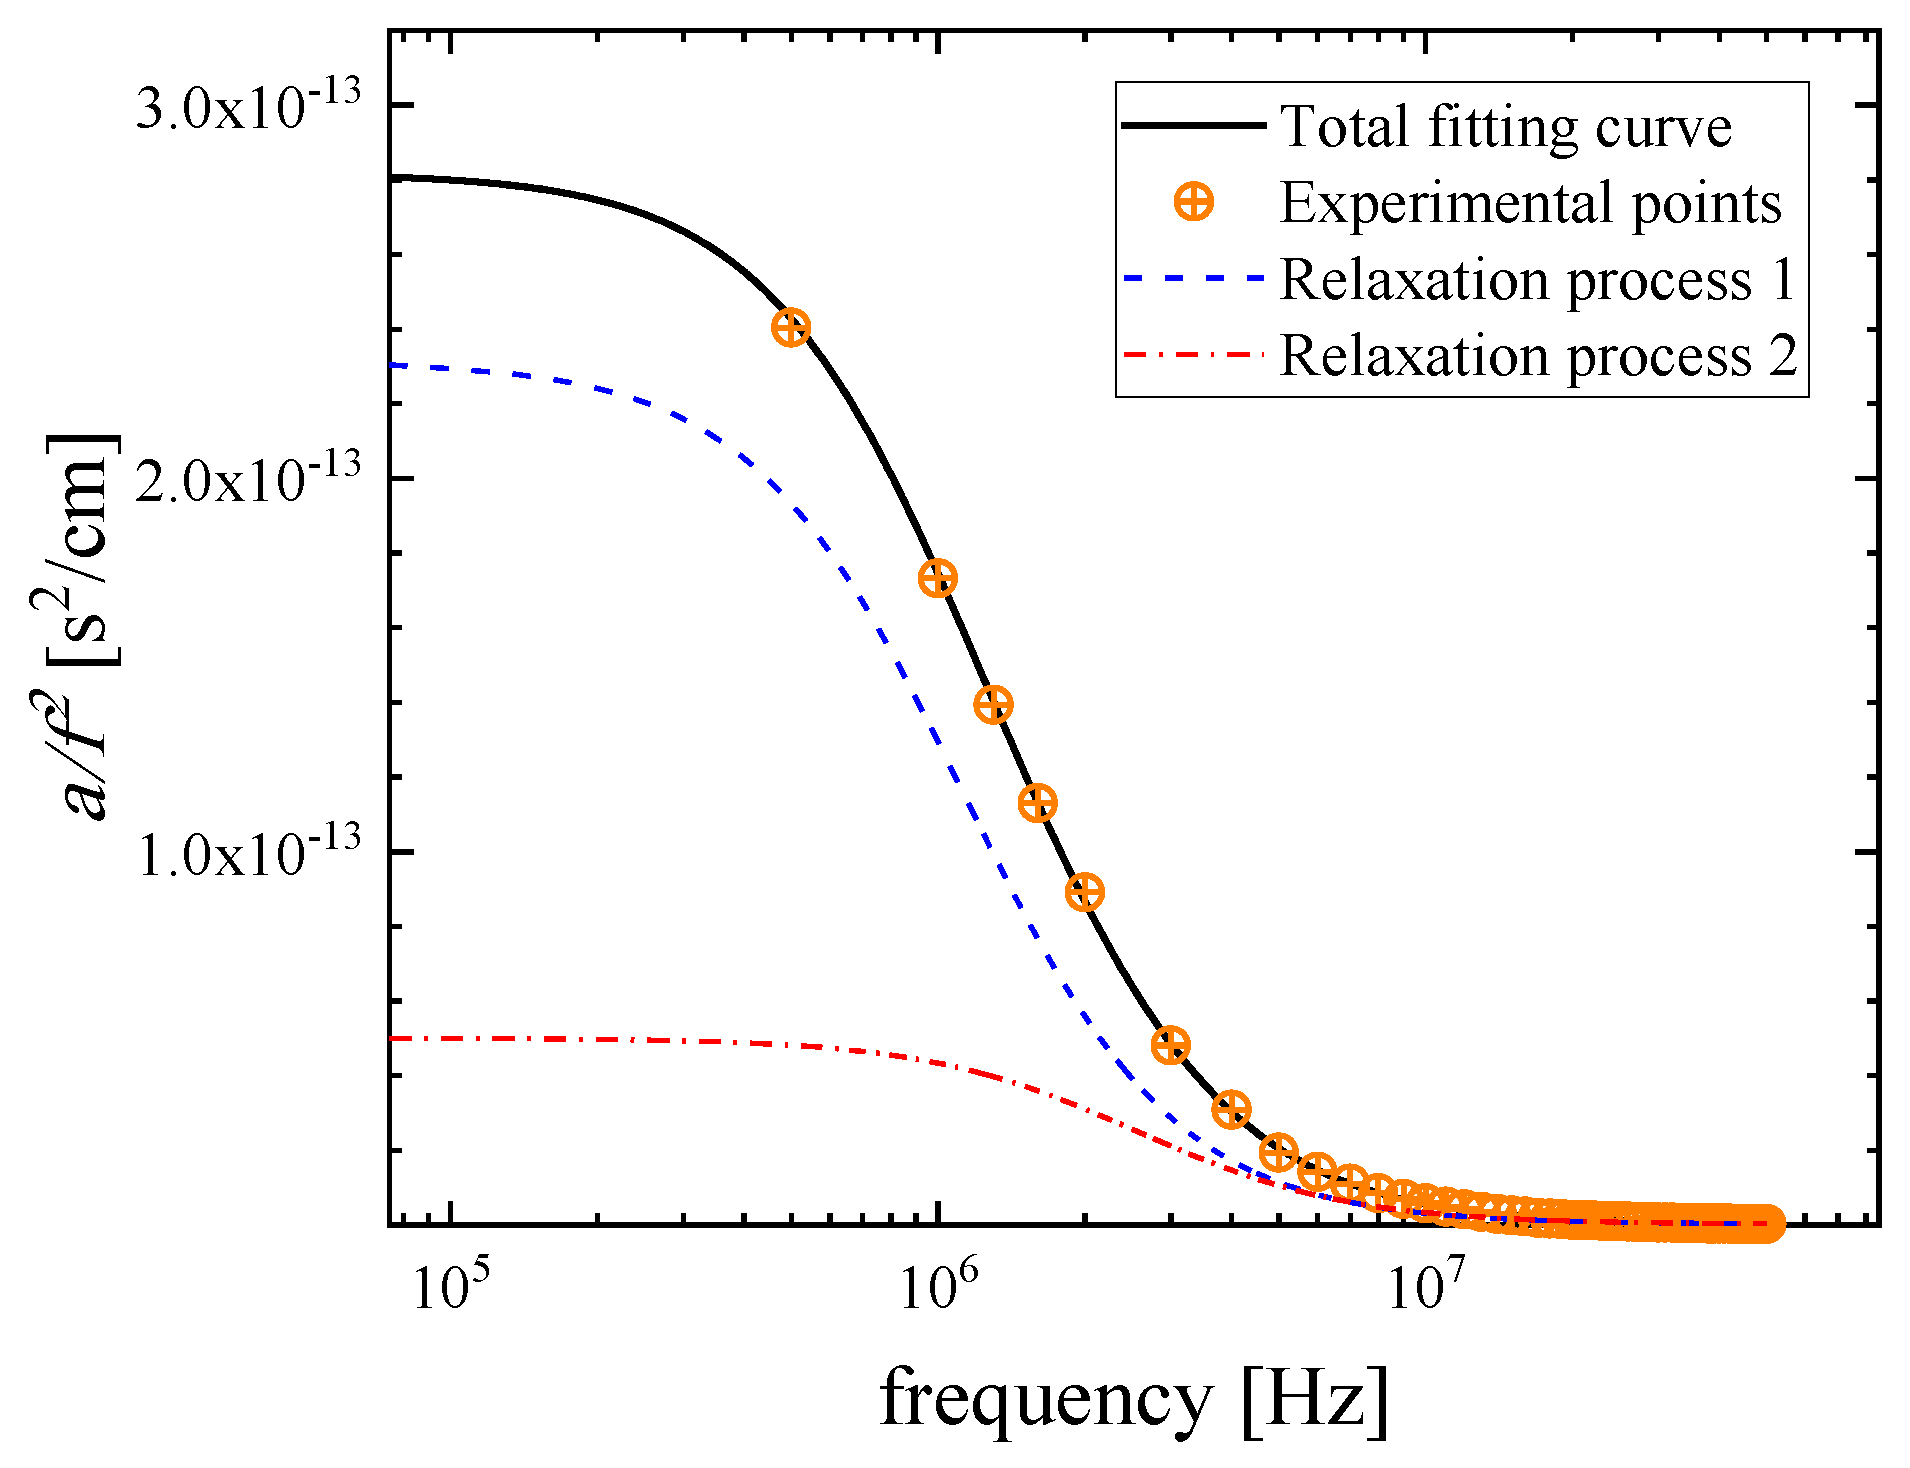
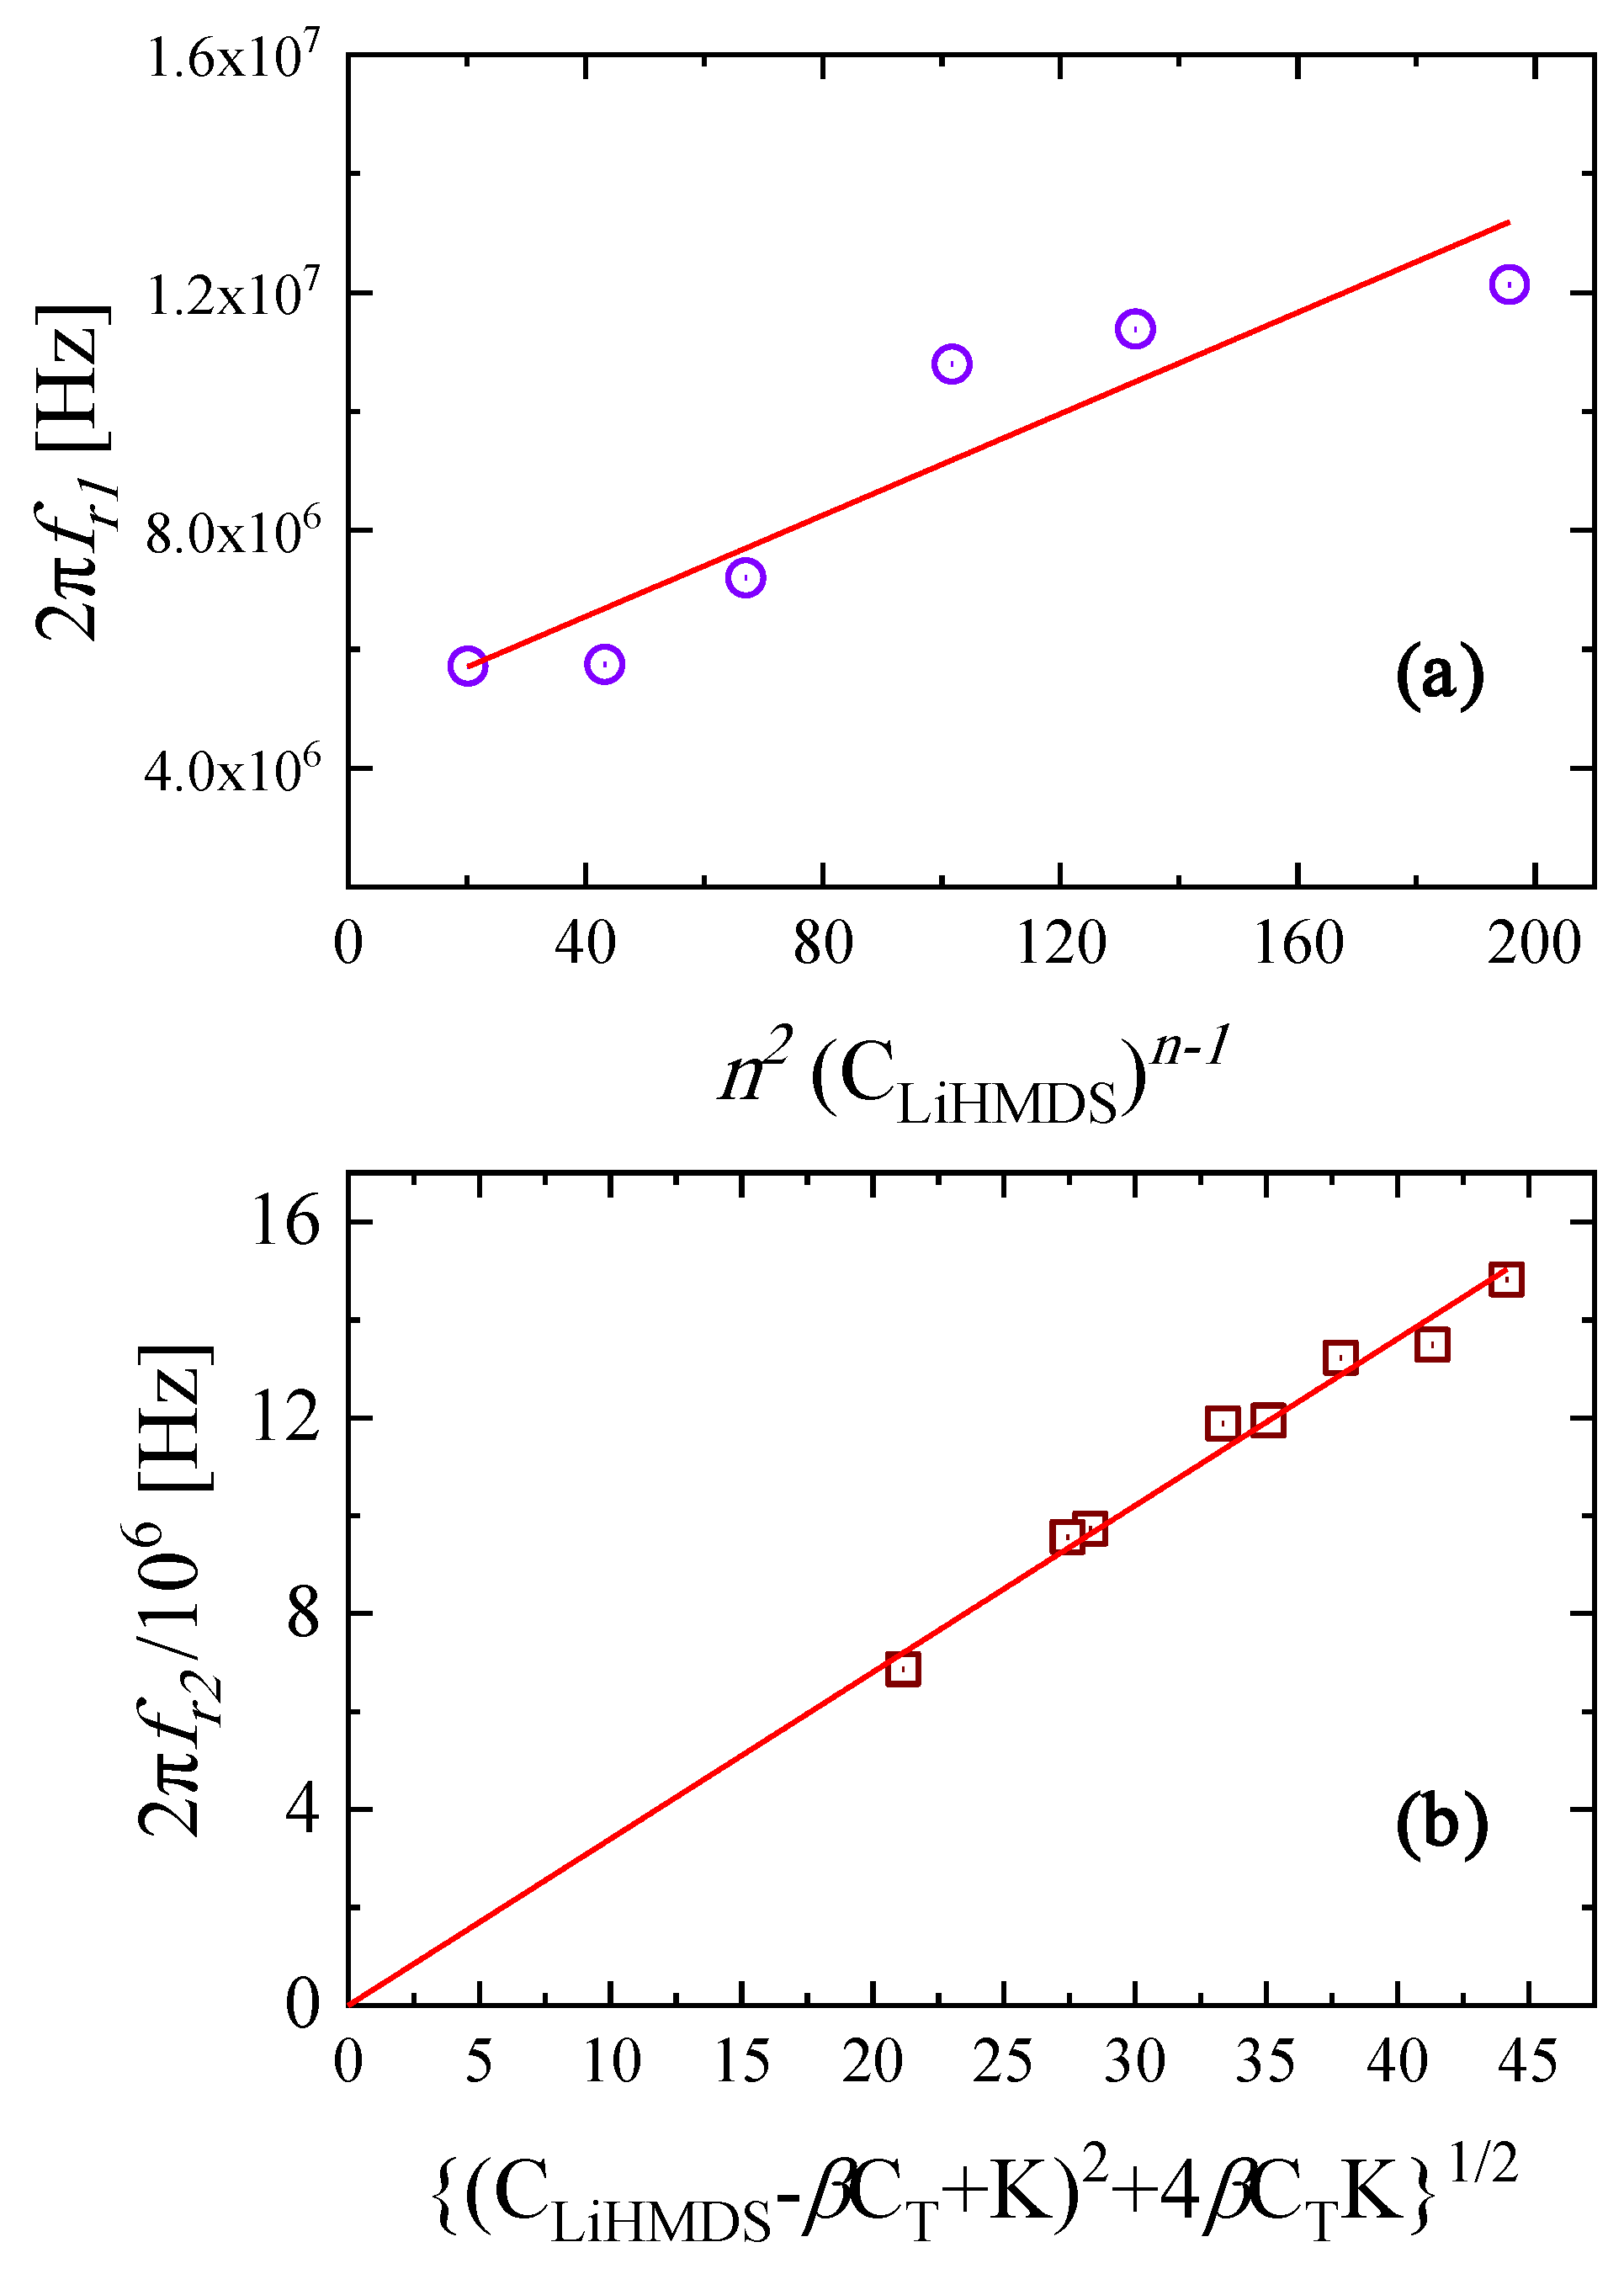
2.3. Kinetic Models of the Relaxation Processes
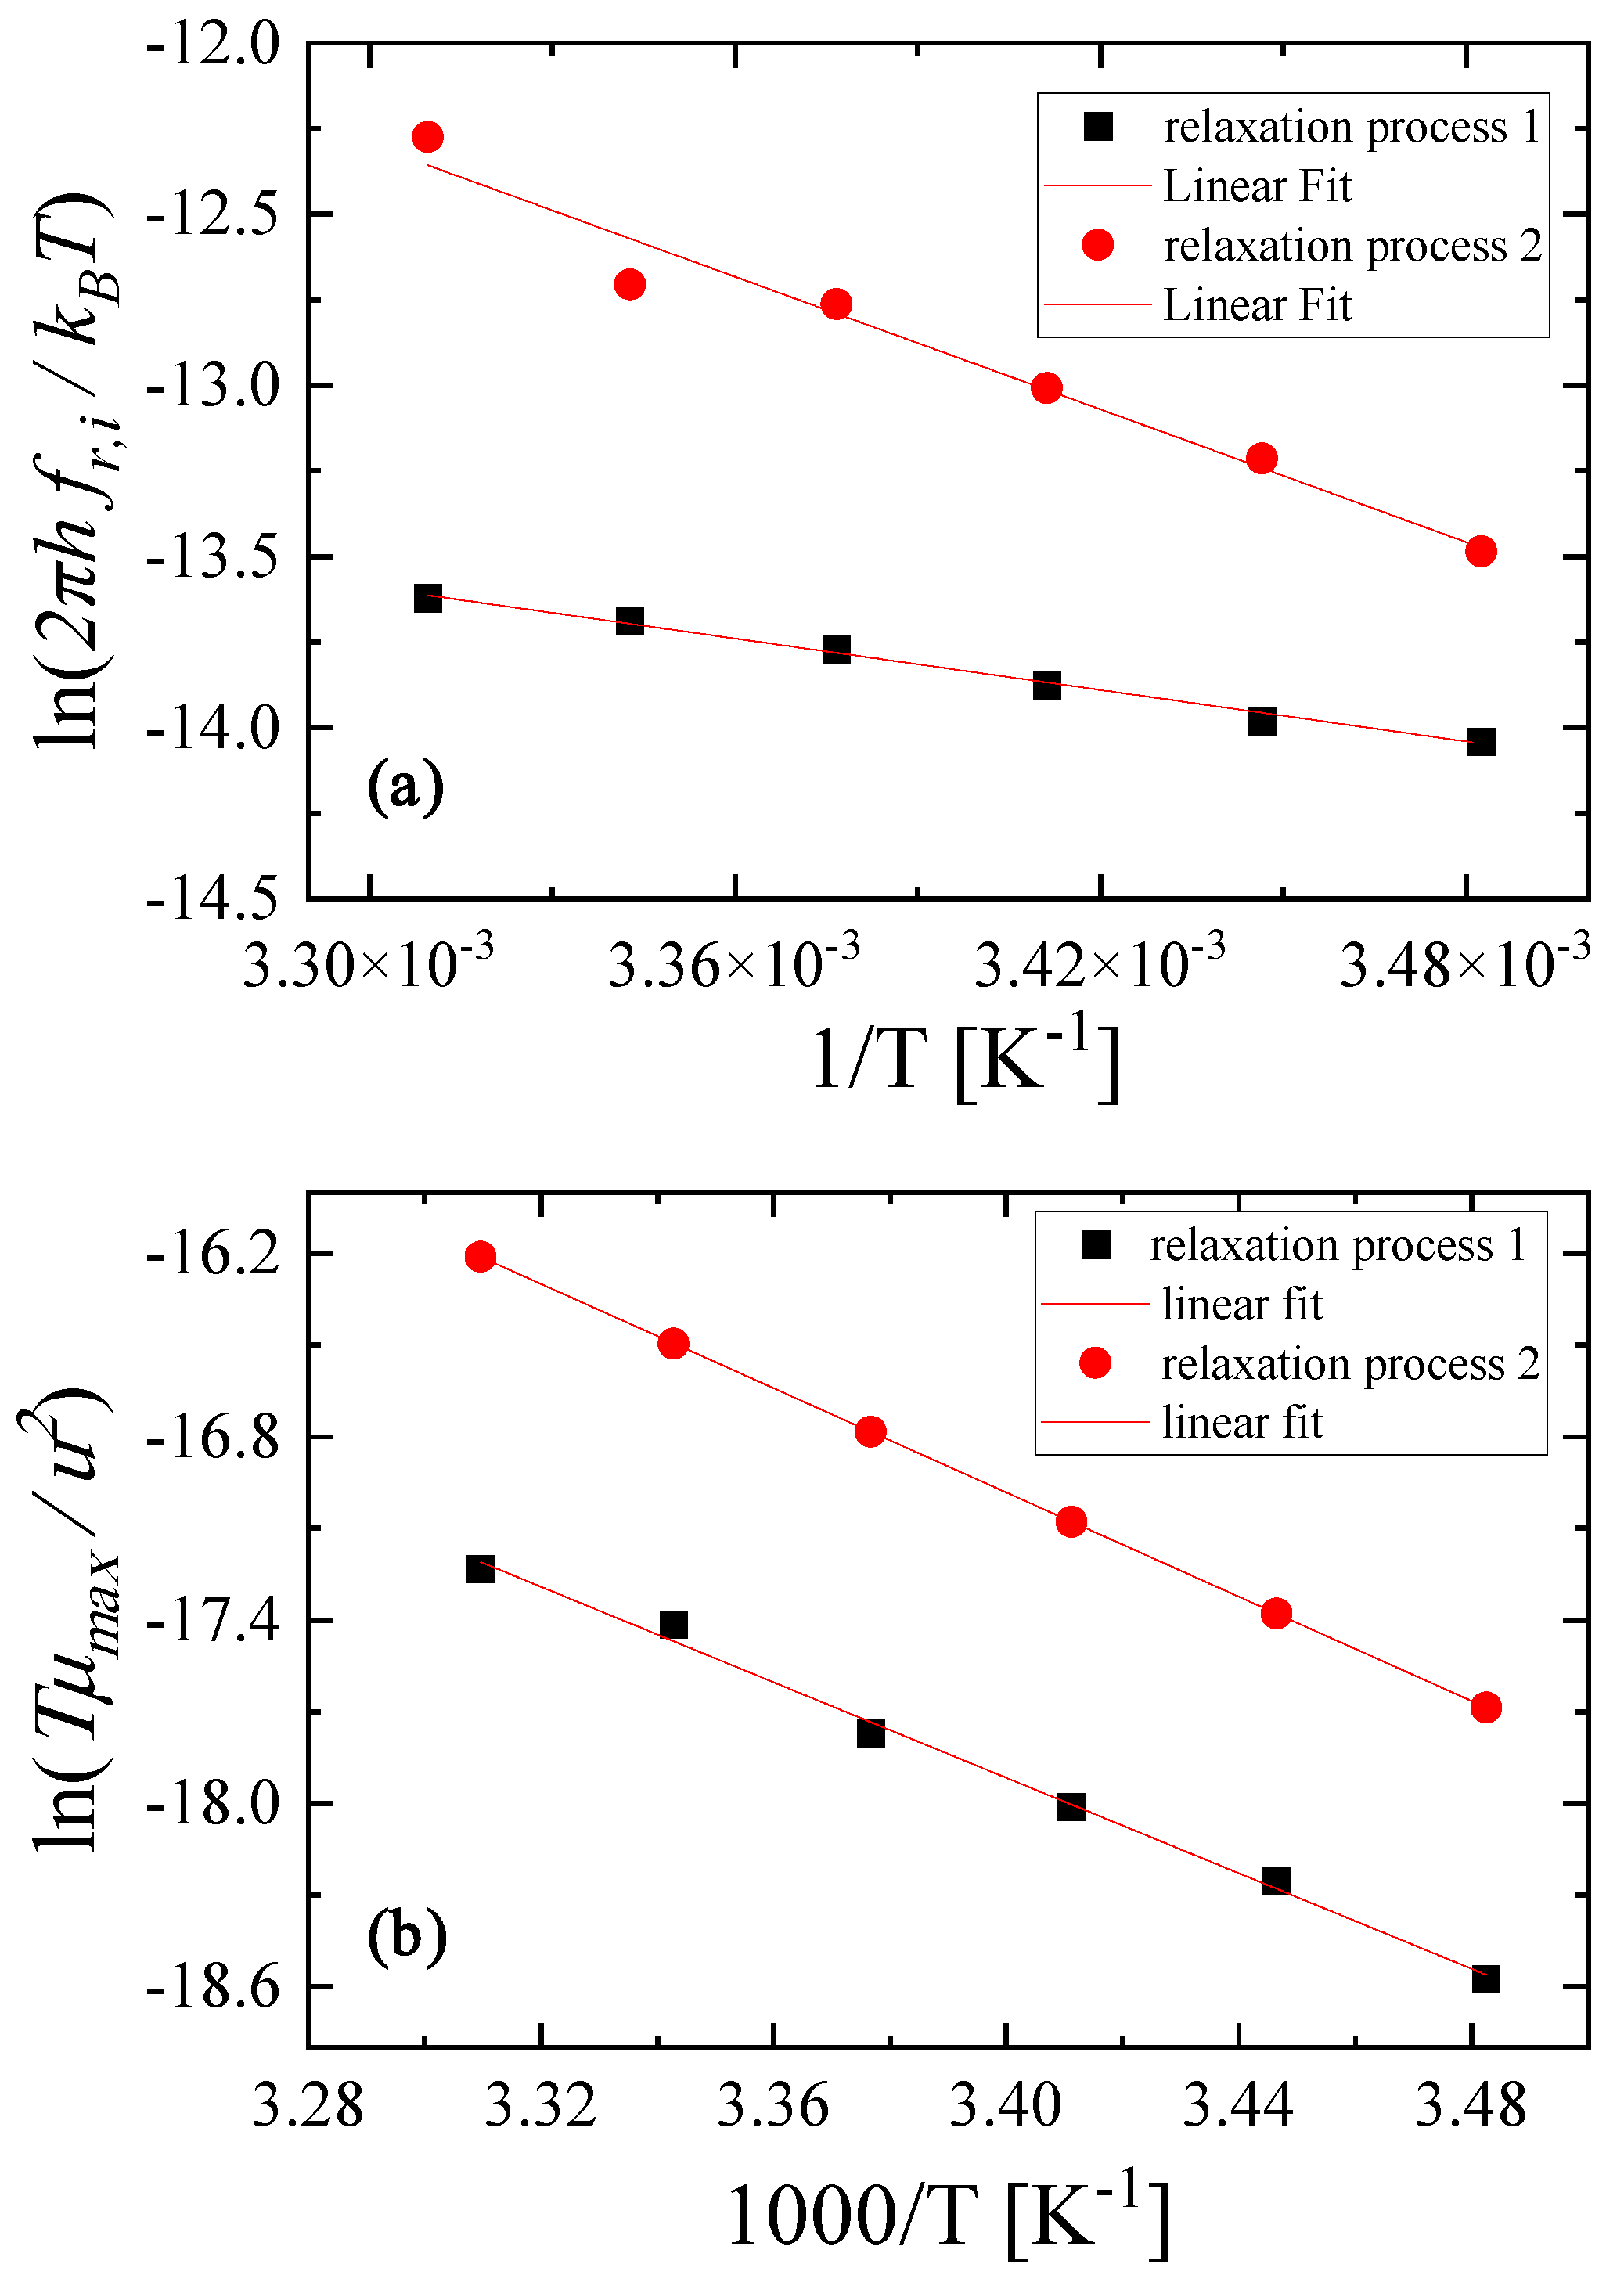
2.4. Thermodynamic Analysis of the Relaxation Processes
3. Materials and Methods
3.1. Solutions
3.2. Ultrasonic Relaxation Spectroscopic Measurements
3.3. Theoretical Calculations
4. Conclusions
Supplementary Materials
Author Contributions
Funding
Institutional Review Board Statement
Informed Consent Statement
Data Availability Statement
Conflicts of Interest
References
- Danheiser, R.L.; Miller, R.F.; Brisbois, R.G. Detrifluoroacetylative diazo group transfer: (E)-1-diazo-4-phenyl-3-buten-2-one. Org. Synth. 1996, 73, 134. [Google Scholar]
- Wu, G.; Huang, M. Organolithium Reagents in Pharmaceutical Asymmetric Processes. Chem. Rev. 2006, 106, 2596–2616. [Google Scholar] [CrossRef] [PubMed]
- Lappert, M.; Protchenko, A.; Power, P.; Seeber, A. Metal Amide Chemistry; John Wiley & Sons: Hoboken, NJ, USA, 2009. [Google Scholar]
- Lucht, B.L.; Collum, D.B. Ethereal Solvation of Lithium Hexamethyldisilazide: Unexpected Relationships of Solvation Number, Solvation Energy, and Aggregation State. J. Am. Chem. Soc. 1995, 117, 9863–9874. [Google Scholar] [CrossRef]
- Lucht, B.L.; Collum, D.B. Lithium Ion Solvation: Amine and Unsaturated Hydrocarbon Solvates of Lithium Hexamethyldisilazide (LiHMDS). J. Am. Chem. Soc. 1996, 118, 2217–2225. [Google Scholar] [CrossRef]
- Neufeld, R.; Michel, R.; Herbst-Irmer, R.; Schçne, R.; Stalke, D. Introducing a Hydrogen-Bond Donor into a Weakly Nucleophilic Brønsted Base: Alkali Metal Hexamethyldisilazides (MHMDS, M= Li, Na, K, Rb and Cs) with Ammonia. Chem. Eur. J. 2016, 22, 12340–12346. [Google Scholar] [CrossRef] [PubMed]
- Rogers, R.D.; Atwood, J.L.; Grüning, R. The crystal structure of N-lithiohexamethyldisilazane, [LiN(SiMe3)2]3. J. Organomet. Chem. 1978, 157, 229–237. [Google Scholar] [CrossRef]
- Popenova, S.; Mawhinney, R.C.; Schreckenbach, G. Density Functional Study of Lithium Hexamethyldisilazide (LiHMDS) Complexes: Effects of Solvation and Aggregation. Inorg. Chem. 2007, 46, 3856–3864. [Google Scholar] [CrossRef] [PubMed]
- Slutsky, L.J. Ultrasonic Chemical Relaxation Spectroscopy; Edmonds, P.D., Ed.; Methods of Experimental Physics 19; Academic Press Inc.: New York, NY, USA, 1981; pp. 179–235. [Google Scholar]
- Herzfeld, K.F.; Litovitz, T.A. Absorption and Dispersion of Ultrasonic Waves; Academic Press: New York, NY, USA, 1959. [Google Scholar]
- Nishikawa, S.; Kamimura, E. Dynamic characteristic of amitriptyline in water by ultrasonic relaxation method and molecular orbital calculation. J. Phys. Chem. A 2011, 115, 535–539. [Google Scholar] [CrossRef] [PubMed]
- Nishikawa, S.; Haraguchi, H.; Fukuyama, Y. Effect of ether oxygen on proton transfer and aggregation reactions of amines in water by ultrasonic absorption method. Bull. Chem. Soc. Jpn. 1991, 64, 1274–1282. [Google Scholar] [CrossRef]
- Nishikawa, S.; Mashima, M.; Yasunaga, T. Ultrasonic Absorption Mechanism in an Aqueous Solution of n-Propyl Alcohol. Bull. Chem. Soc. Jpn. 1975, 48, 661–665. [Google Scholar] [CrossRef]
- Nishikawa, S.; Kuramoto, N.; Uchiyama, T. Ultrasonic Relaxation Associated with Solute-Solvent Interaction in an Aqueous Solution of 5-Methoxy-1-pentanol. Bull. Chem. Soc. Jpn 1994, 67, 2870–2872. [Google Scholar] [CrossRef]
- Jacobson, B. Ultrasonic Velocity in Liquids and Liquid Mixtures. J. Chem. Phys. 1952, 20, 927–928. [Google Scholar] [CrossRef]
- Jacobson, B. Intermolecular Free Lengths in Liquids in Relation to Compressibility, Surface Tension and Viscosity. Acta Chem. Scand. 1952, 5, 1214–1216. [Google Scholar] [CrossRef]
- Tsigoias, S.; Papanikolaou, M.G.; Kabanos, T.A.; Kalampounias, A.G. Structure and dynamics of aqueous norspermidine solutions: An in situ ultrasonic relaxation spectroscopic study. J. Phys. Condens. Matter. 2021, 33, 495104. [Google Scholar] [CrossRef] [PubMed]
- Kaatze, U.; Hushcha, T.O.; Eggers, F. Ultrasonic Broadband Spectrometry of Liquids: A Research Tool in Pure and Applied Chemistry and Chemical Physics. J. Solution Chem. 2000, 29, 299. [Google Scholar] [CrossRef]
- Blandamer, M.J. Introduction to Chemical Ultrasonics; Academic Press: New York, NY, USA, 1973. [Google Scholar]
- Ensminger, D.; Bond, L.J. Ultrasonics: Fundamentals, Technologies, and Applications; CRC Press: New York, NY, USA, 2011. [Google Scholar]
- Stogiannidis, G.; Tsigoias, S.; Kalampounias, A.G. Conformational energy barriers in methyl acetate–Ethanol solutions: A temperature-dependent ultrasonic relaxation study and molecular orbital calculations. J. Mol. Liq. 2020, 302, 112519. [Google Scholar] [CrossRef]
- Jäger, S.; Meyer, P.; Feichtner, K.-S.; Henkel, S.; Schwaab, G.W.; Gessner, V.H.; Havenith, M. Reaction of lithium hexamethyldisilazide (LiHMDS) with water at ultracold conditions. Phys. Chem. Chem. Phys. 2022, 24, 24089–24094. [Google Scholar] [CrossRef] [PubMed]
- Kouderis, C.; Siafarika, P.; Kalampounias, A.G. Molecular relaxation dynamics and self-association of dexamethasone sodium phosphate solutions. Chem. Pap. 2021, 75, 6115–6125. [Google Scholar] [CrossRef] [PubMed]
- Kouderis, C.; Siafarika, P.; Kalampounias, A.G. Disentangling proton-transfer and segmental motion relaxations in poly-vinyl-alcohol aqueous solutions by means of ultrasonic relaxation spectroscopy. Polymer 2021, 217, 123479. [Google Scholar] [CrossRef]
- Frisch, M.J.; Trucks, G.W.; Schlegel, H.B.; Scuseria, G.E.; Robb, M.A.; Cheeseman, J.R.; Scalmani, G.; Barone, V.; Petersson, G.A.; Nakatsuji, H.; et al. Gaussian 09, Revision A.02; Gaussian Inc.: Wallingford, CT, USA, 2009. [Google Scholar]
- Kouderis, C.; Tsigoias, S.; Siafarika, P.; Kalampounias, A.G. The Effect of Alkali Iodide Salts in the Inclusion Process of Phenolphthalein in β-Cyclodextrin: A Spectroscopic and Theoretical Study. Molecules 2023, 28, 1147. [Google Scholar] [CrossRef] [PubMed]


| Species | Molekular Volume (cm3/mol) |
|---|---|
| LiHMDS monomer | 154.312 |
| LiHMDS dimer | 296.290 |
| LiHMDS trimer | 496.820 |
| Toluene | 86.081 |
| Toluene-complexed LiHMDS dimer | 502.320 |
| XLiHMDS | fr1 (×106 Hz) | A1 (×10−13 s2/cm) | fr2 (×106 Hz) | A2 (×10−13 s2/cm) | B (×10−16 s2/cm) | u (m/s) |
|---|---|---|---|---|---|---|
| 1 | - | - | - | - | - | 1093.48 |
| 0.924 | - | - | - | - | - | 1095.84 |
| 0.843 | 1.93 | 1.90 | - | - | 2.75 | 1102.8 |
| 0.714 | 1.81 | 2.05 | - | - | 2.64 | 1126.5 |
| 0.595 | 1.72 | 2.24 | - | - | 2.63 | 1149.4 |
| 0.466 | 1.15 | 2.32 | 2.36 | 0.50 | 2.01 | 1177.9 |
| 0.358 | 0.92 | 2.38 | 2.15 | 0.90 | 2.19 | 1205.2 |
| 0.258 | 0.91 | 2.56 | 2.10 | 0.94 | 2.36 | 1233.1 |
| 0.173 | - | - | 1.90 | 1.29 | 1.83 | 1260.2 |
| 0.094 | - | - | 1.89 | 1.55 | 1.87 | 1286.9 |
| 0.050 | - | - | 1.55 | 1.86 | 1.38 | 1295.3 |
| 0.013 | - | - | 1.52 | 2.09 | 1.37 | 1315.8 |
| 0.001 | - | - | 1.09 | 2.85 | 1.44 | 1321.1 |
| XLiHMDS | CLiHMDS (M) | β |
|---|---|---|
| 1 | 5.14 | - |
| 0.924 | 4.92 | - |
| 0.843 | 4.66 | - |
| 0.714 | 3.84 | - |
| 0.595 | 3.36 | - |
| 0.466 | 2.73 | 0.20 |
| 0.358 | 2.19 | 0.24 |
| 0.258 | 1.50 | 0.28 |
| 0.173 | 1.17 | 0.20 |
| 0.094 | 0.58 | 0.25 |
| 0.050 | 0.31 | 0.15 |
| 0.013 | 0.12 | 0.10 |
| 0.001 | 0.01 | 0.01 |
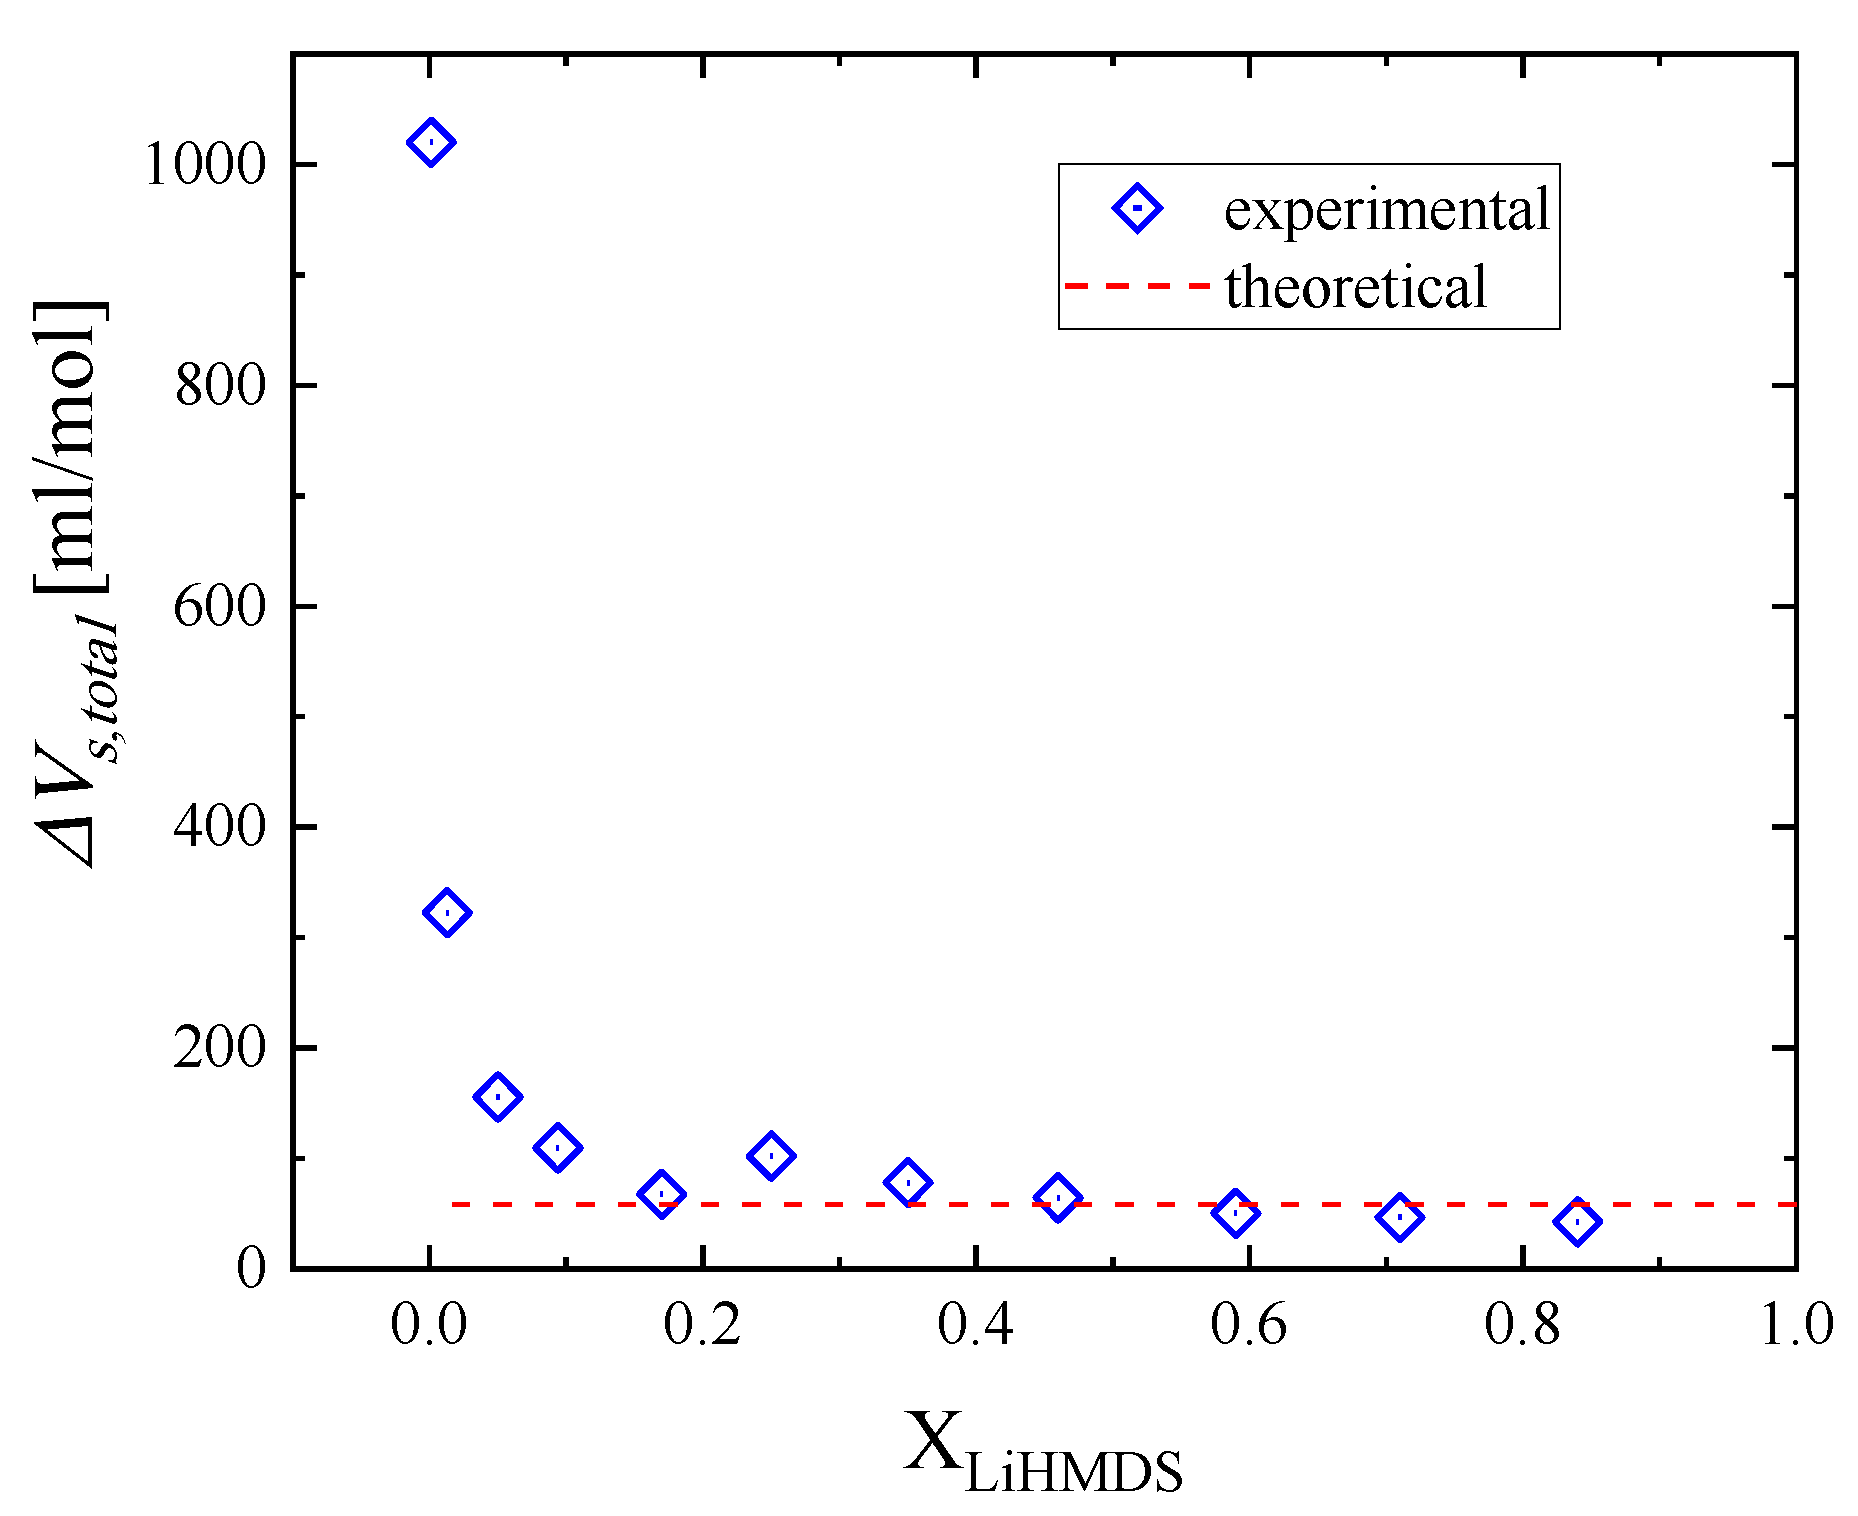
| XLiHMDS | ΔVs1 (mL/mol) | ΔVs2 (mL/mol) | ΔVs,total (mL/mol) |
|---|---|---|---|
| 1 | -- | -- | -- |
| 0.924 | -- | -- | -- |
| 0.843 | 42.6 | 0 | 42.6 |
| 0.714 | 46.8 | 0 | 46.8 |
| 0.595 | 50.3 | 0 | 50.3 |
| 0.466 | 45.9 | 18.6 | 64.5 |
| 0.358 | 46.2 | 31.8 | 78.1 |
| 0.258 | 57.2 | 44.8 | 102.1 |
| 0.173 | 0 | 67.6 | 67.6 |
| 0.094 | 0 | 109.5 | 109.5 |
| 0.050 | 0 | 155.6 | 155.6 |
| 0.013 | 0 | 322.6 | 322.6 |
| 0.001 | 0 | 1020.0 | 1020.0 |
| theoretical | 46.2 | 12.1 | 58.3 |
| Solution | XLiHMDS | CLiHMDS (M) | Ctoluene (M) |
|---|---|---|---|
| 1 | 1 | 5.14 | 0 |
| 2 | 0.924 | 4.92 | 0.41 |
| 3 | 0.843 | 4.66 | 0.87 |
| 4 | 0.714 | 3.84 | 1.54 |
| 5 | 0.595 | 3.36 | 2.29 |
| 6 | 0.466 | 2.73 | 3.12 |
| 7 | 0.358 | 2.19 | 3.94 |
| 8 | 0.258 | 1.50 | 4.31 |
| 9 | 0.173 | 1.17 | 5.57 |
| 10 | 0.094 | 0.58 | 5.53 |
| 11 | 0.050 | 0.31 | 5.89 |
| 12 | 0.013 | 0.12 | 9.13 |
| 13 | 0.001 | 0.01 | 9.34 |
Disclaimer/Publisher’s Note: The statements, opinions and data contained in all publications are solely those of the individual author(s) and contributor(s) and not of MDPI and/or the editor(s). MDPI and/or the editor(s) disclaim responsibility for any injury to people or property resulting from any ideas, methods, instructions or products referred to in the content. |
© 2024 by the authors. Licensee MDPI, Basel, Switzerland. This article is an open access article distributed under the terms and conditions of the Creative Commons Attribution (CC BY) license (https://creativecommons.org/licenses/by/4.0/).
Share and Cite
Kouderis, C.; Tryfon, A.; Kabanos, T.A.; Kalampounias, A.G. The Identification of Structural Changes in the Lithium Hexamethyldisilazide–Toluene System via Ultrasonic Relaxation Spectroscopy and Theoretical Calculations. Molecules 2024, 29, 813. https://doi.org/10.3390/molecules29040813
Kouderis C, Tryfon A, Kabanos TA, Kalampounias AG. The Identification of Structural Changes in the Lithium Hexamethyldisilazide–Toluene System via Ultrasonic Relaxation Spectroscopy and Theoretical Calculations. Molecules. 2024; 29(4):813. https://doi.org/10.3390/molecules29040813
Chicago/Turabian StyleKouderis, Constantine, Afrodite Tryfon, Themistoklis A. Kabanos, and Angelos G. Kalampounias. 2024. "The Identification of Structural Changes in the Lithium Hexamethyldisilazide–Toluene System via Ultrasonic Relaxation Spectroscopy and Theoretical Calculations" Molecules 29, no. 4: 813. https://doi.org/10.3390/molecules29040813
APA StyleKouderis, C., Tryfon, A., Kabanos, T. A., & Kalampounias, A. G. (2024). The Identification of Structural Changes in the Lithium Hexamethyldisilazide–Toluene System via Ultrasonic Relaxation Spectroscopy and Theoretical Calculations. Molecules, 29(4), 813. https://doi.org/10.3390/molecules29040813