Article

A Versatile Broadband Attached Proton Test Experiment for Routine 13C Nuclear Magnetic Resonance Spectroscopy

Department of Chemistry, Biochemistry and Pharmaceutical Sciences, University of Bern, Freiestrasse 3, 3012 Bern, Switzerland
*
Authors to whom correspondence should be addressed.
Molecules 2024, 29(4), 809; https://doi.org/10.3390/molecules29040809
Submission received: 18 December 2023 / Revised: 6 February 2024 / Accepted: 7 February 2024 / Published: 9 February 2024
(This article belongs to the Special Issue New Insights into Nuclear Magnetic Resonance (NMR) Spectroscopy)

Abstract

:
The proposed broadband attached proton test sequence allows the user to easily record 13C nuclear magnetic resonance multiplicity-edited and quaternary-carbon-only spectra. Compared to earlier attached proton test experiments, it preserves both a tolerance for wide ranges of one-bond-coupling constant values and the effective suppression of residual CHn signals in the quaternary-carbon-only spectra. The recording of edited spectra or quaternary-carbon-only spectra is made easy by a single, user-controllable constant. These attributes make the broadband attached proton test experiment attractive for the 13C analysis of small molecules, including spectral editing, particularly in high-throughput analysis laboratories.

1. Introduction

In 13C nuclear magnetic resonance (NMR) spectra, the so-called multiplicity, i.e., the number, n, of magnetically equivalent nuclei, I, bound to spin, S (InS group), is of special interest. Multiplicity provides valuable information to unequivocally find the signals of Cq-, CH-, CH2- and CH3 -groups and thus to obtain the number of the different carbon types for the molecule under study. Correspondingly designed 1D 13C-NMR experiments such as the attached proton test (APT) [1,2], insensitive nuclei enhancement by polarization transfer (INEPT) [3], or distortionless enhancement by polarization transfer (DEPT) [4] were introduced many years ago for this purpose.
The option for multiplicity discrimination has also been incorporated into 2D experiments such as 2D heteronuclear single quantum coherence (HSQC) [5,6] and 3D protein NMR experiments [7]. However, 1D 13C- DEPT or -APT are still the most common experiments for assigning 13C signals and elucidating molecular structures at a routine level.
The APT experiment belongs to the family of spin-echo (SE)-based experiments, such as spin-echo Fourier transform (SEFT) [8,9,10], and subspectral editing using a multiple-quantum trap (SEMUT) [11], which exploits heteronuclear Overhauser enhancement to improve sensitivity. Due to their simplicity, these experiments are very robust and are therefore ideal for routine spectroscopy and for educational purposes to introduce the concept of pulse sequences to undergraduate students. The added sensitivity gain achieved with polarization transfer experiments such as DEPT or INEPT has almost stopped the further development of APT-related experiments. However, the simplicity of the APT sequences, and in particular the ability to obtain all the carbon multiplicities, including Cq, is an important advantage that is otherwise only achieved with the polarization enhancement nurtured during attached nucleus testing (PENDANT) [12,13] and the DEPTQ sequences [14,15,16]. Furthermore, and with respect to other applications such as the study of perfluorinated compounds CFn, the APT experiment is easier to use than DEPT. Although powerful decoupling methods are essential due to the large 19F shift range, the selection and difficult calibration of broadband 19F pulses needed for DEPT are no longer necessary.
Recently, we have shown that the “old-fashioned” APT experiment produces similar or sometimes even slightly better results than INEPT or DEPT. [17] We concluded that none of the five experiments tested (APT, DEPT, DEPTQ, Refocused-INEPT, and PENDANT) can be considered an “ultimate” or superior experiment that consistently provides the best signal-to-noise ratio for all 13C signals [17].
For the APT experiment, the multiplicity discrimination of carbon signals depends on the length of the delay Δ, which is set to 1/1JCH. This setting enables partial multiplicity editing with positive Cq and CH2 signals and negative CH and CH3 signals, respectively. With Δ set to 0.5/1JCH, only Cq signals will be detected (Cq-only spectrum). Therefore, with both spectra, the signals of Cq and CH2 can be identified unequivocally, while a differentiation between CH and CH3 is not possible.
A long-standing and recurring problem with the APT sequence is that it suffers from low tolerance over wide ranges of 1JCH. For molecules with a wide range of 1JCH couplings, this affects (i) the sensitivity of the APT spectra in general, with the cancellation of signals or, in the worst case, signals showing the wrong multiplicity, and (ii) a mostly poor suppression of residual CHn signals in the Cq-only spectrum.
An APT editing method called error self-compensation reached by tau scrambling (ESCORT) has been proposed, which works very well for usual ranges of coupling constants. Yet, ESCORT requires the measurement of four spectra that must then undergo extensive spectral editing, which is not particularly suitable for routine measurements [18].
The CRISIS-APT (CRAPT) experiment, an improved APT with compensation for variations in 1JCH using 13C compensation for refocusing inefficiency with synchronized inversion sweeps (CRISIS) pulses [19], has also been proposed [20]. However, the CRAPT experiment relies on the linear relationship between 1JCH coupling constant values and carbon chemical shift in optimizing the sweep rate of the adiabatic pulses [21,22,23]. It has, therefore, a low 1JCH tolerance for chemical functionalities that lie outside this linear region. Furthermore, the CRAPT experiment inadequately suppresses the remaining CHn signals in the Cq-only spectrum.
Finally, more sophisticated APT sequences (compensated attached proton test, CAPT2 and CAPT3) were developed by the McClung’s group to improve the 1JCH tolerance of APT [24]. The CAPT sequences are more complex, contain a bilinear rotation decoupling (BIRD)r,X element [25,26] in the center of the preparation period, and are almost identical to the SEMUT-GL sequence, developed for other purposes [27].
In this report, we propose a new APT sequence, the broadband attached proton test sequence (BAPT), for measuring partially edited CHn spectra or Cq-only spectra. For wide ranges of 1JCH coupling constant values, the BAPT CHn spectra show improved 1JCH tolerance and therefore a higher sensitivity compared to the CAPT sequences. The BAPT Cq-only spectra are characterized by an efficient suppression of the CHn signals with a comparable quality to the spectra of ESCORT, SEMUT-GL, and improved quaternary carbon detection (iQCD) sequences [11,27,28], which are known to provide the best Cq-only spectra. Importantly, the present paper aims to improve a single (routine) experiment (APT), i.e., explicitly to not evaluate the tactics of which combination of 1D and/or 2D methods is useful for structure elucidation/verification depending on the structural problem [29,30]. It is obvious, then, when working with sample-limited natural products that it is more difficult to acquire a good-quality 13C NMR spectrum than it is to acquire a set of 2D spectra [31].

2. Results and Discussion

2.1. The Broadband Attached Proton Test Experiment

The broadband APT (BAPT) pulse sequence differs from the recommended CAPT3 pulse sequence [24] as follows (Figure 1): (i) Instead of a delay, Δ1, set to one single 1JCH value, three delays, Δ1, Δ2, and Δ3, are used and set for three estimated one-bond coupling constants, 1J1CH, 1J2CH, and 1J3CH, a long-known strategy that has been implemented in low-pass J filters [32], in SEMUT-GL [27], in HMBC experiments [33], and, recently, in DEPTQ+ experiments [16]. (ii) Like the basic APT experiment, the BAPT experiment can be used to provide either an APT spectrum or a Cq-only spectrum. For an APT spectrum, Δ1 = 1/(2*1J1CH), Δ2 = 1/(1J2CH), and Δ3 = 1/(2*1J3CH). To measure a Cq-only spectrum, the delay, Δ2, must be halved, i.e., (1/(1J2CH) → 1/(2*1J2CH)), and the phase cycle for the two proton 90° pulses (see Figure 1) must be redefined. For routine NMR spectroscopy, the choice between an APT or a Cq-only spectrum is made very simply and conveniently using just the value of a constant (1 = APT; 2 = Cq-only). The delay, Δ2, and the phase programs for the two proton 90° pulses are adjusted accordingly and automatically (Supplementary Information).

2.2. Analysis of the Broadband Attached Proton Test Experiment

2.2.1. Attached Proton Test Mode

The CAPT3 and BAPT sequences with the phases and delays adjusted to generate an APT spectrum were first evaluated. In Table 1, the observable in-phase 13C coherences for Cq, CH, CH2, and CH3 spin systems present just before acquisition are summarized. In the rest of the manuscript, for convenience, we will use the name of the pulse program, APTjc, to discuss the CAPT2 and CAPT3 sequences. As for the coupling between a carbon and its directly bound protons, 1JCH = J is the value of the actual coupling and 1J1CH, 1J2CH, 1J3CH are the values of the couplings used to define delays Δ1, Δ2, and Δ3, respectively.
As shown in Table 1, the terms shown in bold only occurred when the delays were not optimally adjusted, i.e., Δi≠ 1/(2*JCH) [24,27]. The intensities of all CHn groups were primarily determined by the respective terms 1 and 2, with term 1 dominating, except for CH groups and large mismatches between J and Δi [24]. For CH2 groups, simple numerical evaluations show that term 3 stayed small for their full range of coupling constants (~110–185 Hz) and can be neglected. For CH3 groups, terms 3 and 4 remained small for their full range of coupling constants (~90–140 Hz) and can be neglected as well.
From the expressions provided in Table 1, several conclusions and recommendations can be derived for the best adjustment of the delays Δ1–Δ3 in the BAPT experiment:
In the APTjc experiment, with the delay Δ1 set to Δ1 = 1/(2*1JCH), an excellent tolerance over a wide range of one-bond J coupling constants could be achieved [24]. However, we found that an even better 1JCH tolerance could be achieved by setting Δ1 in the BIRD sandwich to Δ1 = 1/(1J1CH) (Figure S2). That is why Δ2 is defined as 1/(1J2CH) in the BIRD sandwich of the BAPT experiment for recording an APT spectrum.

2.2.2. Standard Range of One-Bond JCH Coupling Constants (110–175 Hz)

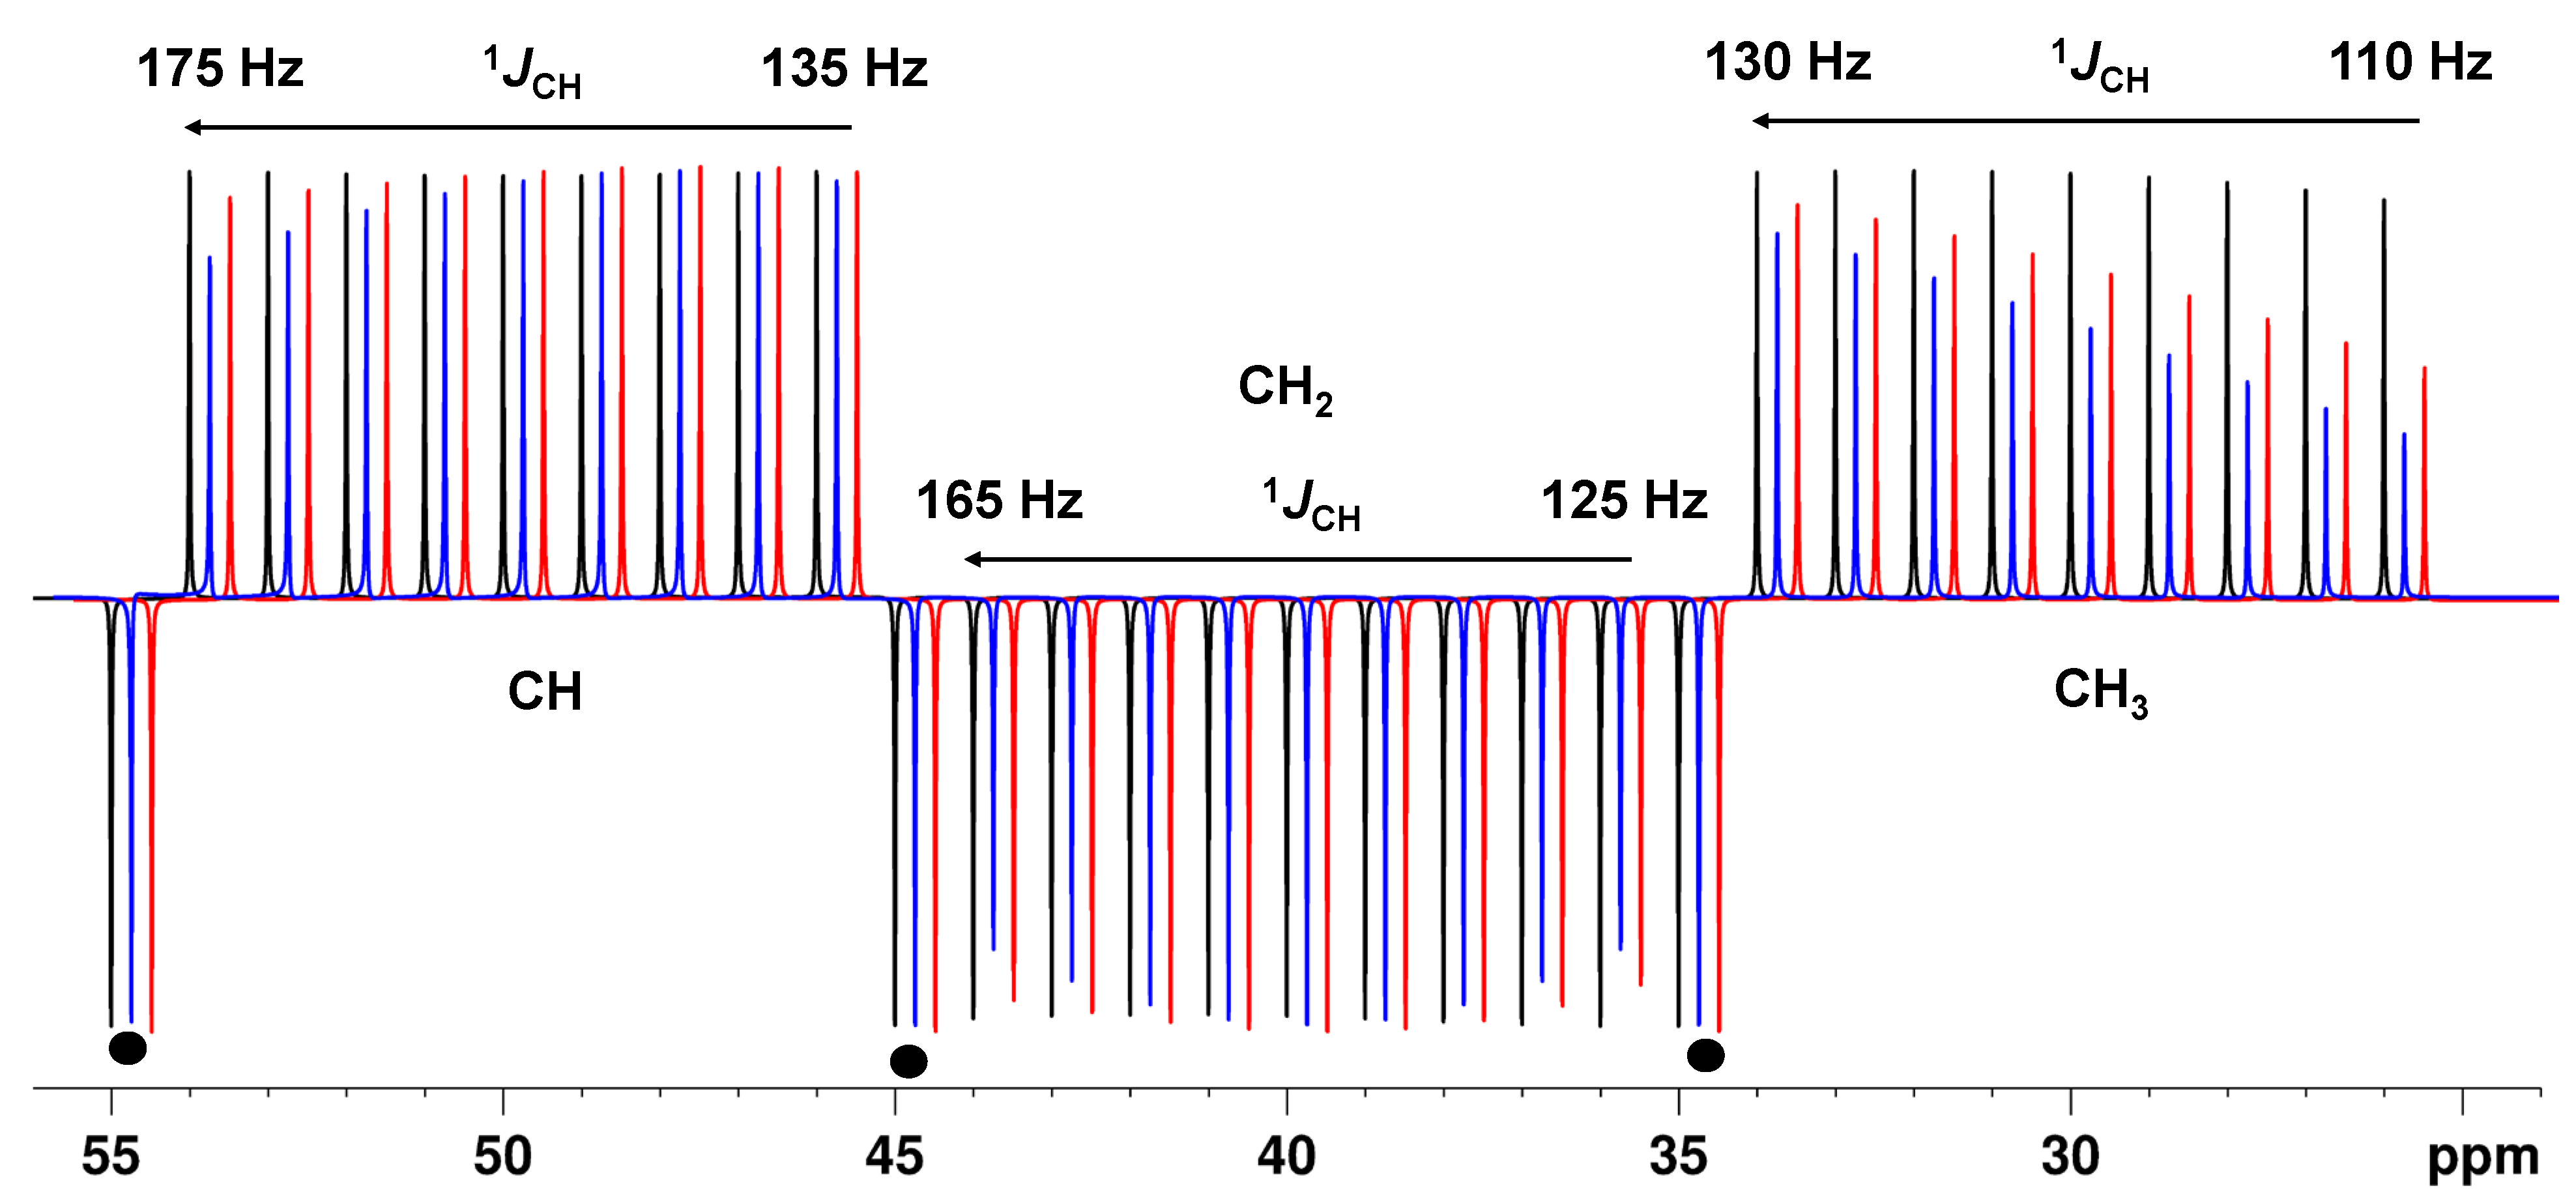
Simple calculations and simulations (Figures S3–S5) show that for an APT-type spectrum with the BAPT experiment, the delay Δ2 should be adjusted for all carbon types for large coupling constant values, typically 160–170 Hz, to obtain the best 1JCH tolerances. In contrast, the delays Δ1 and Δ3 should be optimized for the typical 1JCH ranges of CH2 and CH3 groups, and thus a value around 130 Hz provided the best results (Figure 2 and Figures S3–S5). With these optimizations, the intensity of CH groups was at a maximum (>99%) and constant over the coupling constant range of 130–175 Hz (Figure 2 and Figure S3). For the APTjc sequence, with Δ1 adjusted for an average coupling constant of 145 Hz, high intensities (>98%) were obtained for aliphatic CH groups, while the intensity could drop to ~90% for aromatic carbons with 1JCH coupling constants of ~175 Hz.
For the BAPT experiment, excellent tolerances and intensities close to the theoretical maximum were also obtained for CH2 (>96%) and particularly for CH3 groups (>90%) over their typical 1JCH ranges (125–165 Hz, CH2; 110–135 Hz, CH3). For the APTjc sequence, the intensity dropped to 89% (CH2 groups) and a low 53% (CH3 groups) with Δ1 adjusted for an average coupling constant of 145 Hz (Figure 2, Figures S4 and S5). As expected, both the APTjc and the BAPT sequence were superior to the APT sequence in every respect, i.e., in terms of overall sensitivity and tolerance to J-mismatch, especially for CH3 groups.
We also simulated the corresponding spectra for a hypothetical molecule and included spectral noise in the simulations to mimic the experimental data as closely as possible (Figure S6). The spectra confirmed the slight superiority of the BAPT sequence compared to the APTjc sequence: The improved J-tolerance achieved with BAPT with only a weak J dependance was most impressive for CH3 groups, while almost no J-dependance could be seen for the aliphatic CH2 and CH groups (Figure 2).

2.2.3. Full Range of One-Bond JCH Coupling Constants (110–250 Hz)

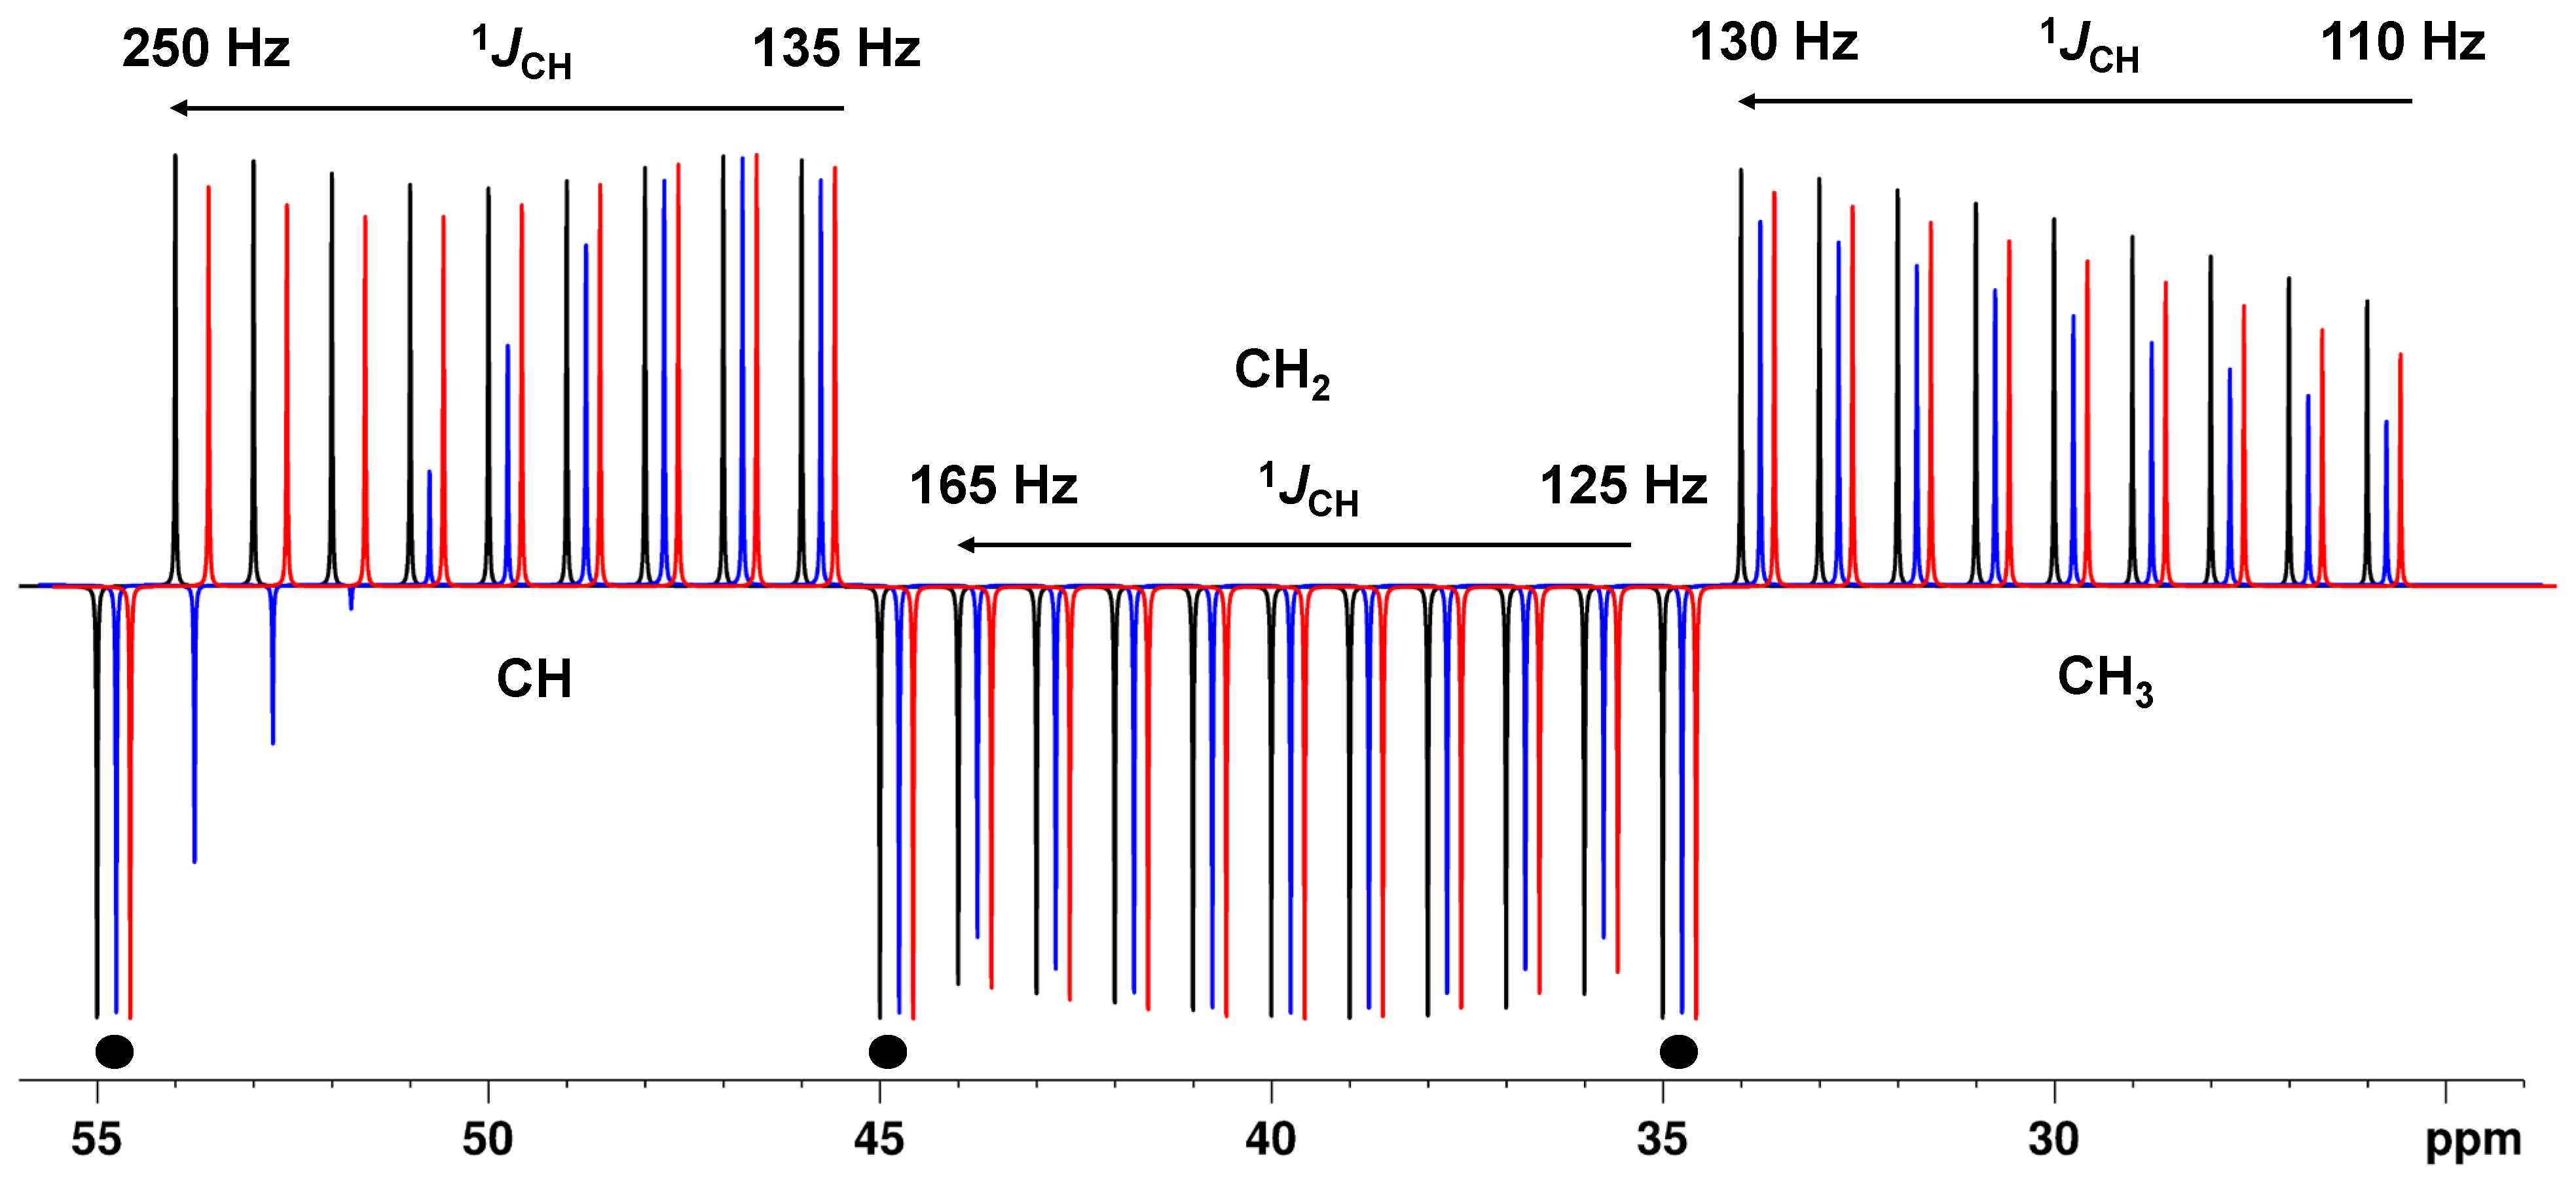
When the full range of one-bond JCH coupling constants (110–250 Hz) is considered, the same conclusions apply for the delay Δ2: The calculations and simulations show that for the BAPT experiment, the delay Δ2 must also be adjusted to very large coupling constant values, in this case, typically to 240–250 Hz. For the delays Δ1 and Δ3, we found that the best compromise was achieved when both delays were adjusted close to the standard average value of 145 Hz (Figure 3 and Figures S7–S9). With these optimized delays, Δi, an astonishingly high and uniform amplitude for all sizes of coupling constants (130–250 Hz) in CH groups was obtained (>95%) (Figure 3 and Figure S7). For the APTjc sequence, the intensity was also high and uniform, but it could drop to ~85%.
For the CH2 and CH3 groups, the BAPT sequence showed a slightly superior sensitivity compared to the APTjc sequence (Figure 3, Figures S8 and S9). Both BAPT and the APTjc sequences were again superior to the APT sequence for all carbon types, particularly for the alkyne group, for which the APT sequence produced an intense resonance with the wrong sign (Figure 3).

2.2.4. Cq-Only Mode

The APTjc experiment is intended exclusively for measuring APT spectra. However, after a minor modification (Figure S1), it can also be used to measure Cq-only spectra Therefore, we evaluated the performance of this modified APTjc and the BAPT sequence with its phases and delays adjusted to provide Cq-only spectra. In Table 2, the residual in-phase 13C coherences for CH, CH2, and CH3 spin systems present just before acquisition are summarized. Note that identical expressions to those derived for the BAPT experiment were obtained for the SEMUT-GL experiment, which is known to provide the best Cq-only spectra [27].

2.2.5. Standard Range of One-Bond JCH Coupling Constants (110–175 Hz)

Using the same three 1JiCH values for the delays Δ1, Δ2, and Δ3 as recommended to obtain an APT spectrum but with Δ2 redefined accordingly—Δ2 = 1/(2*1J2CH)—to measure a Cq-only spectrum, the following results were obtained:
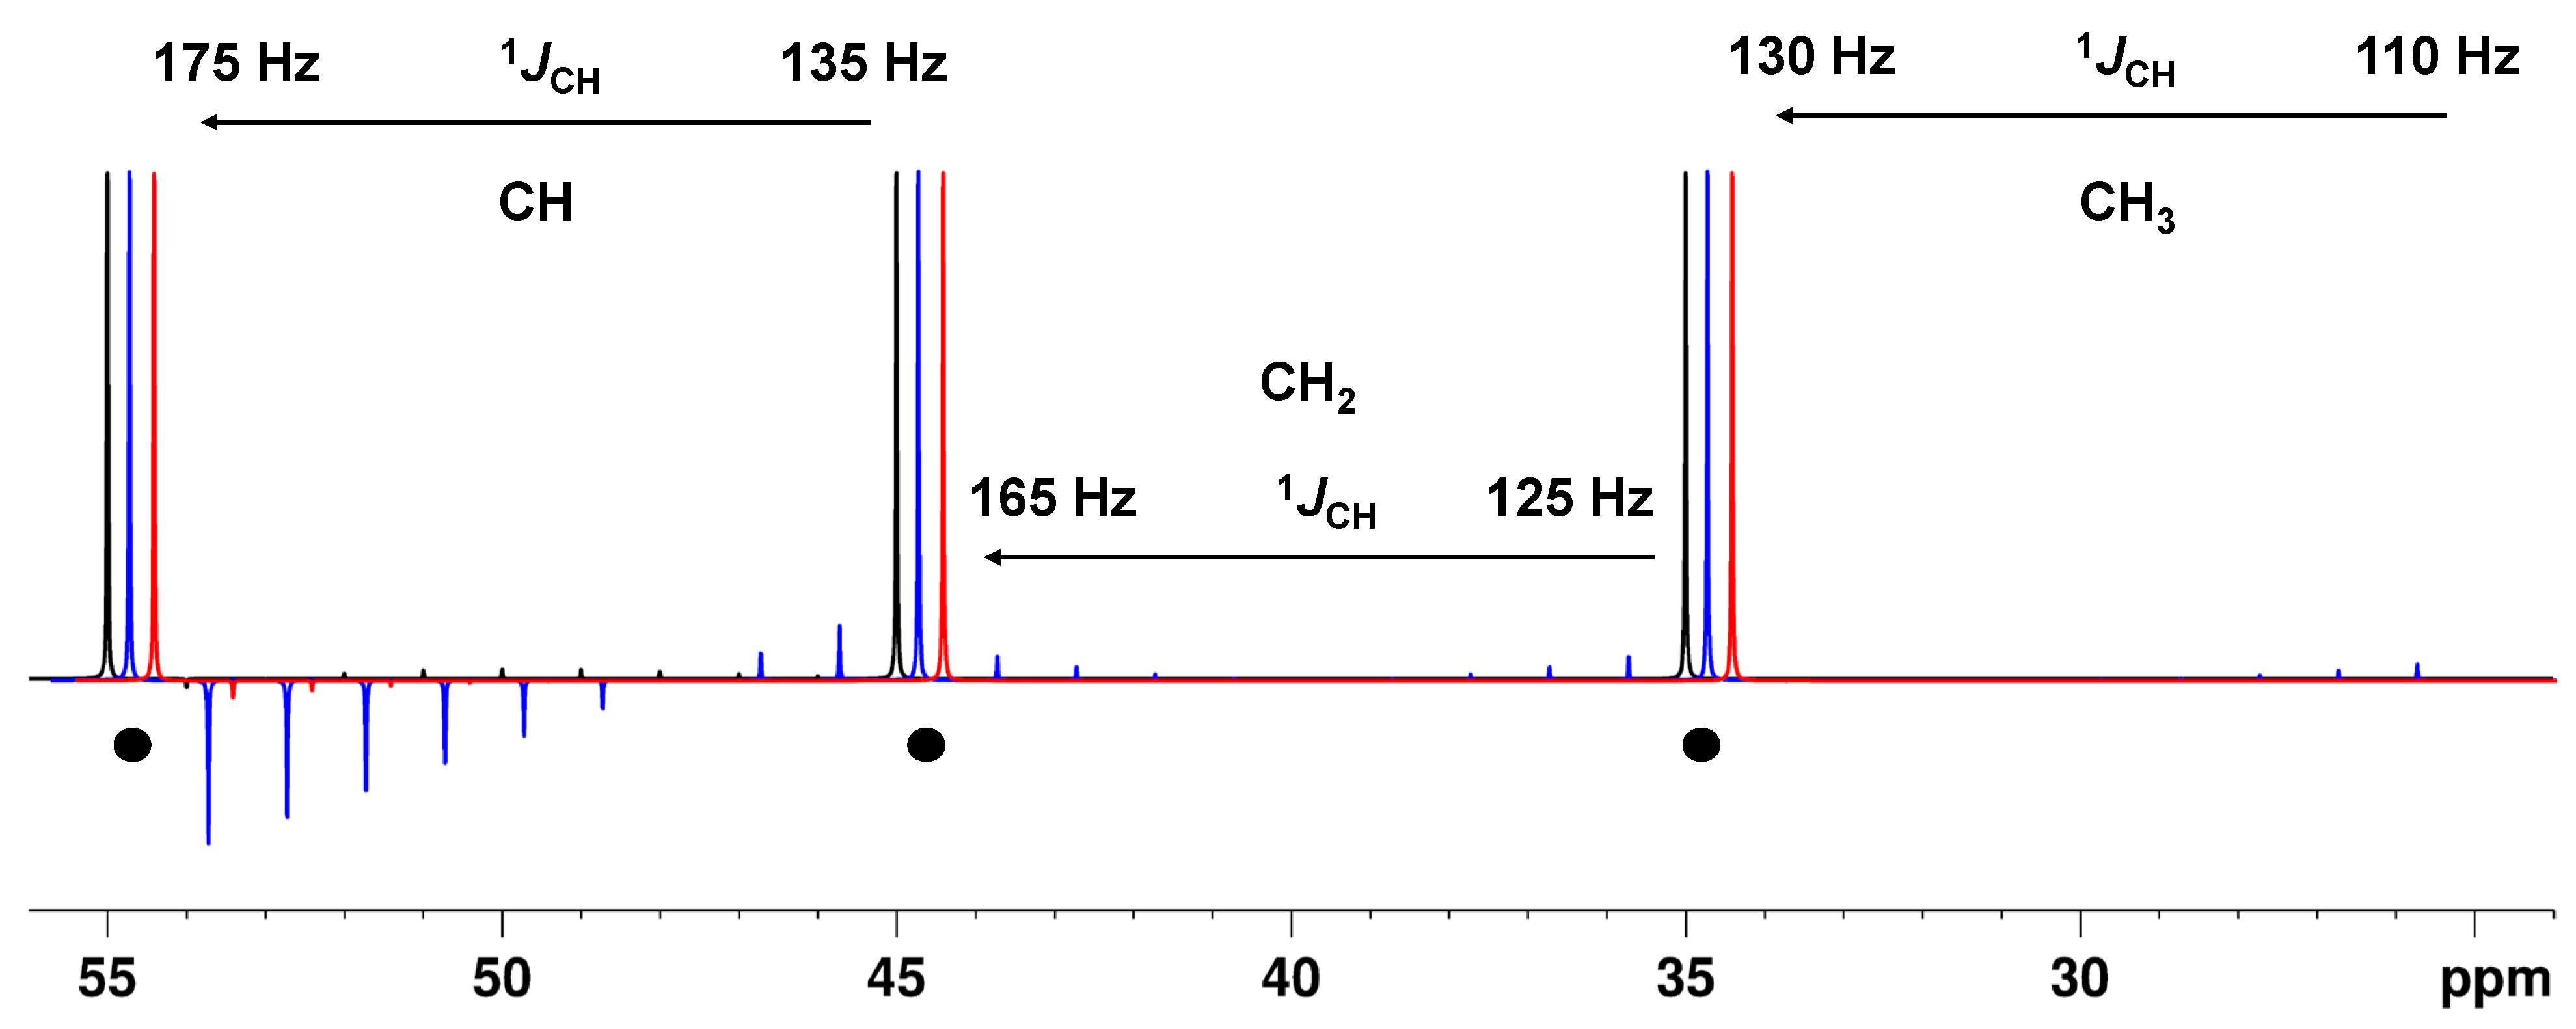
The modified APTjc and BAPT sequences were superior to the APT sequence in every respect: for the CH groups, which are the most critical in this regard, the residual signals are expected to be below the noise level but clearly visible in the Cq-only spectrum recorded with the APT sequence (Figure 4, Figures S10 and S11). According to the expressions shown in Table 2, the residual signals of the aliphatic CH2 and CH3 groups, which are easier to suppress, are expected to be below the noise level for the APTjc and BAPT pulse sequences but could potentially be visible in the Cq-only spectrum recorded with the APT sequence (Figure 4 and Figure S11).

2.2.6. Full Range of One-Bond JCH Coupling Constants (110–250 Hz)

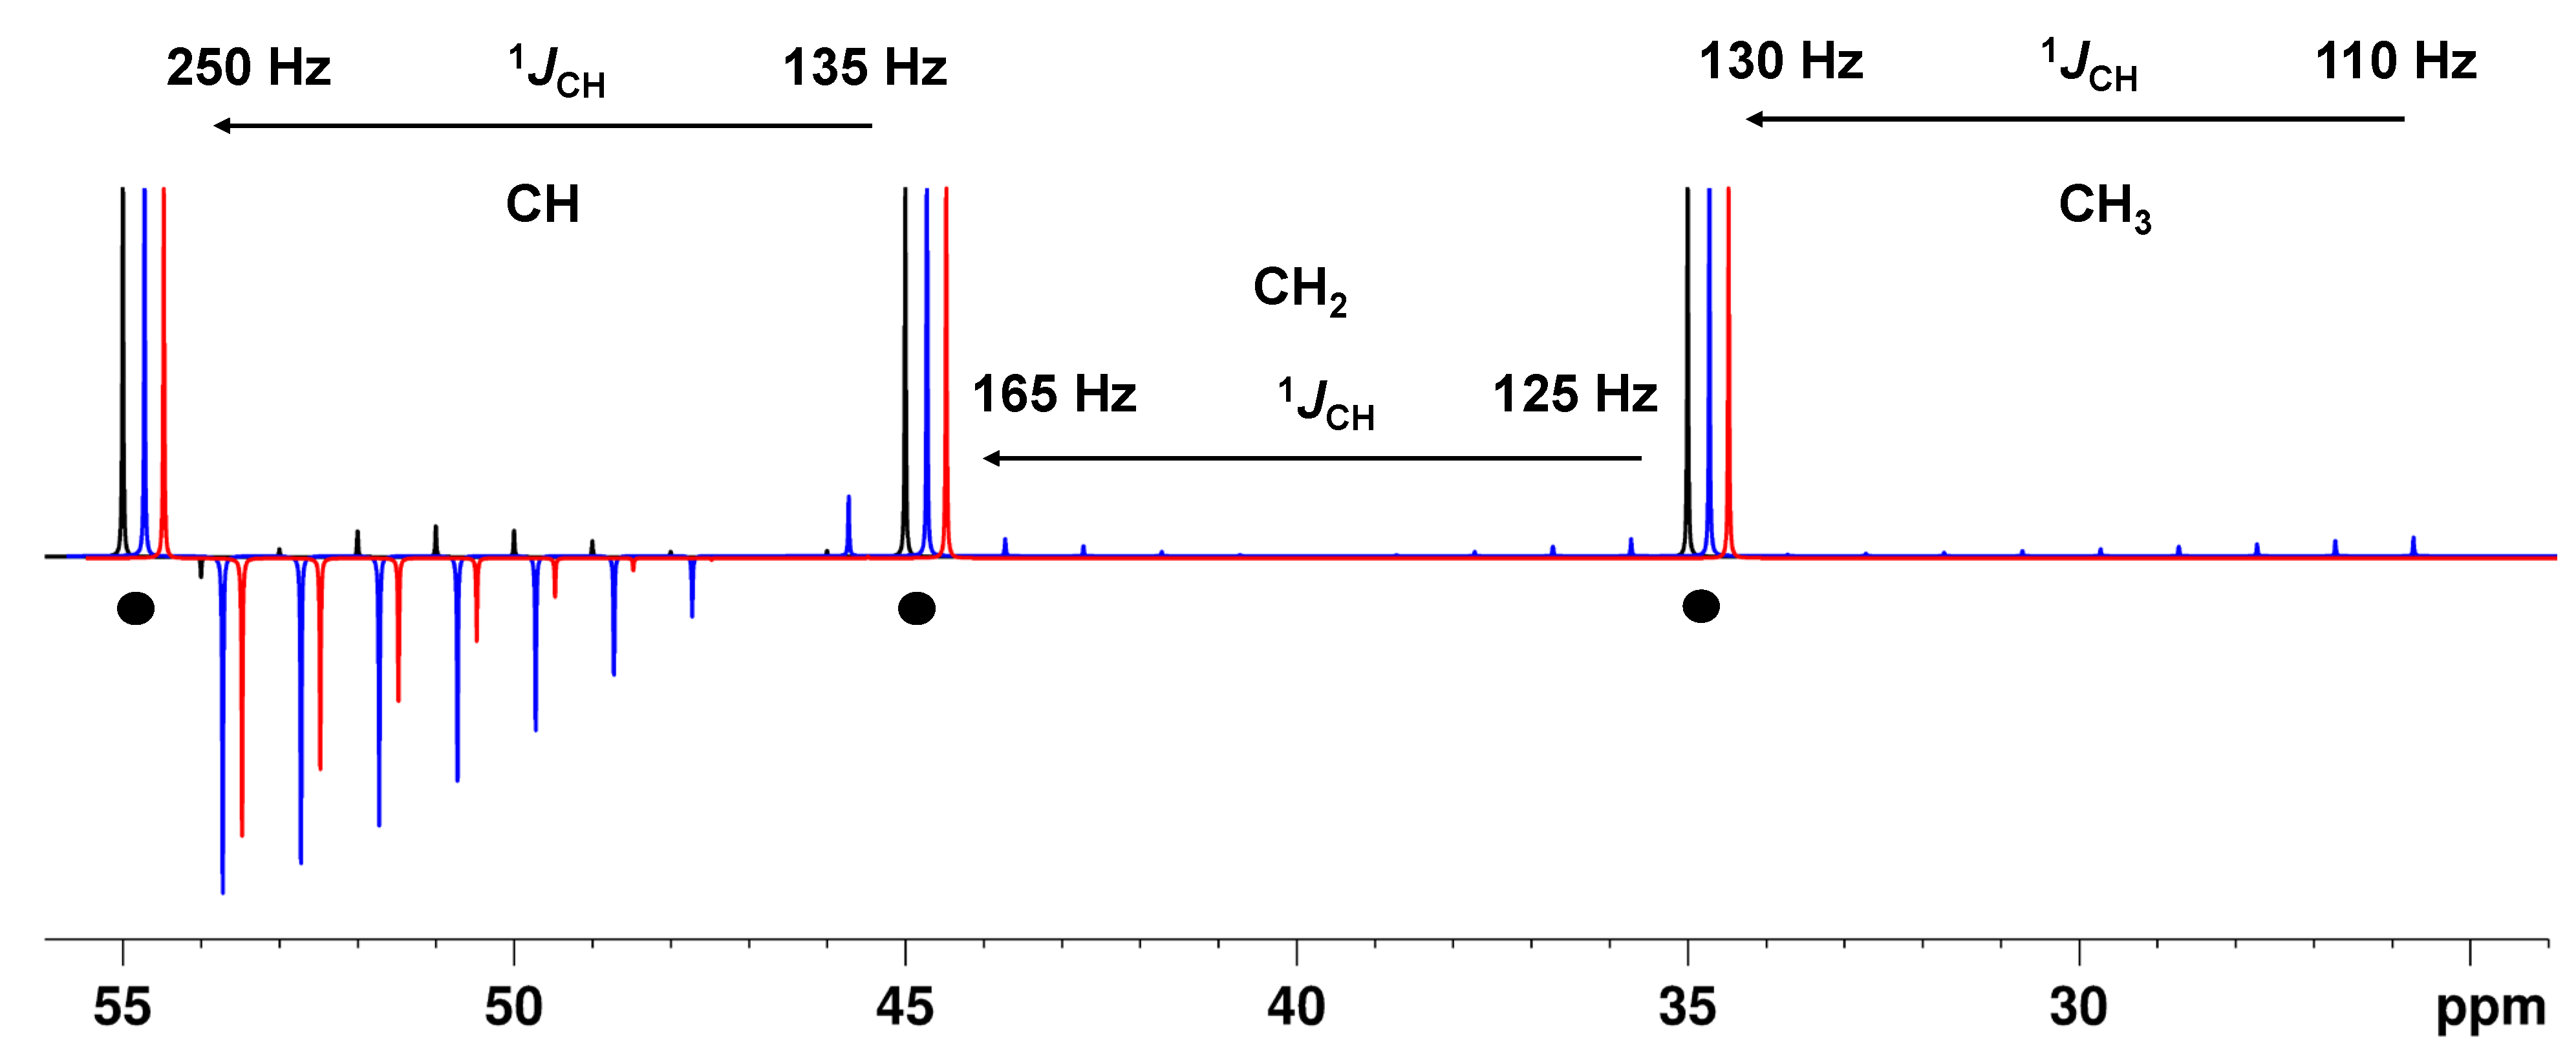
For the full range of coupling constants (110–250 Hz), the BAPT sequence was also clearly superior to the APT and APTjc sequences in every respect: the intensities of CH artifacts were very weak (alkyne CH group) or remained below the noise level (aromatic CH group), as expected, while intense residual signals of these CH groups are potentially visible in the Cq-only spectra recorded with the APT and APTjc experiment (Figure 5, Figures S12 and S13). The residual signals of the less critical aliphatic CH2 and CH3 groups are also expected to be below the noise level for the APTjc and BAPT pulse sequences but could potentially be visible in the Cq-only spectrum recorded with the APT sequence (Figure 5 and Figure S13).

3. Experimental Data

3.1. Cholesteryl Acetate

3.1.1. Attached Proton Test Spectrum

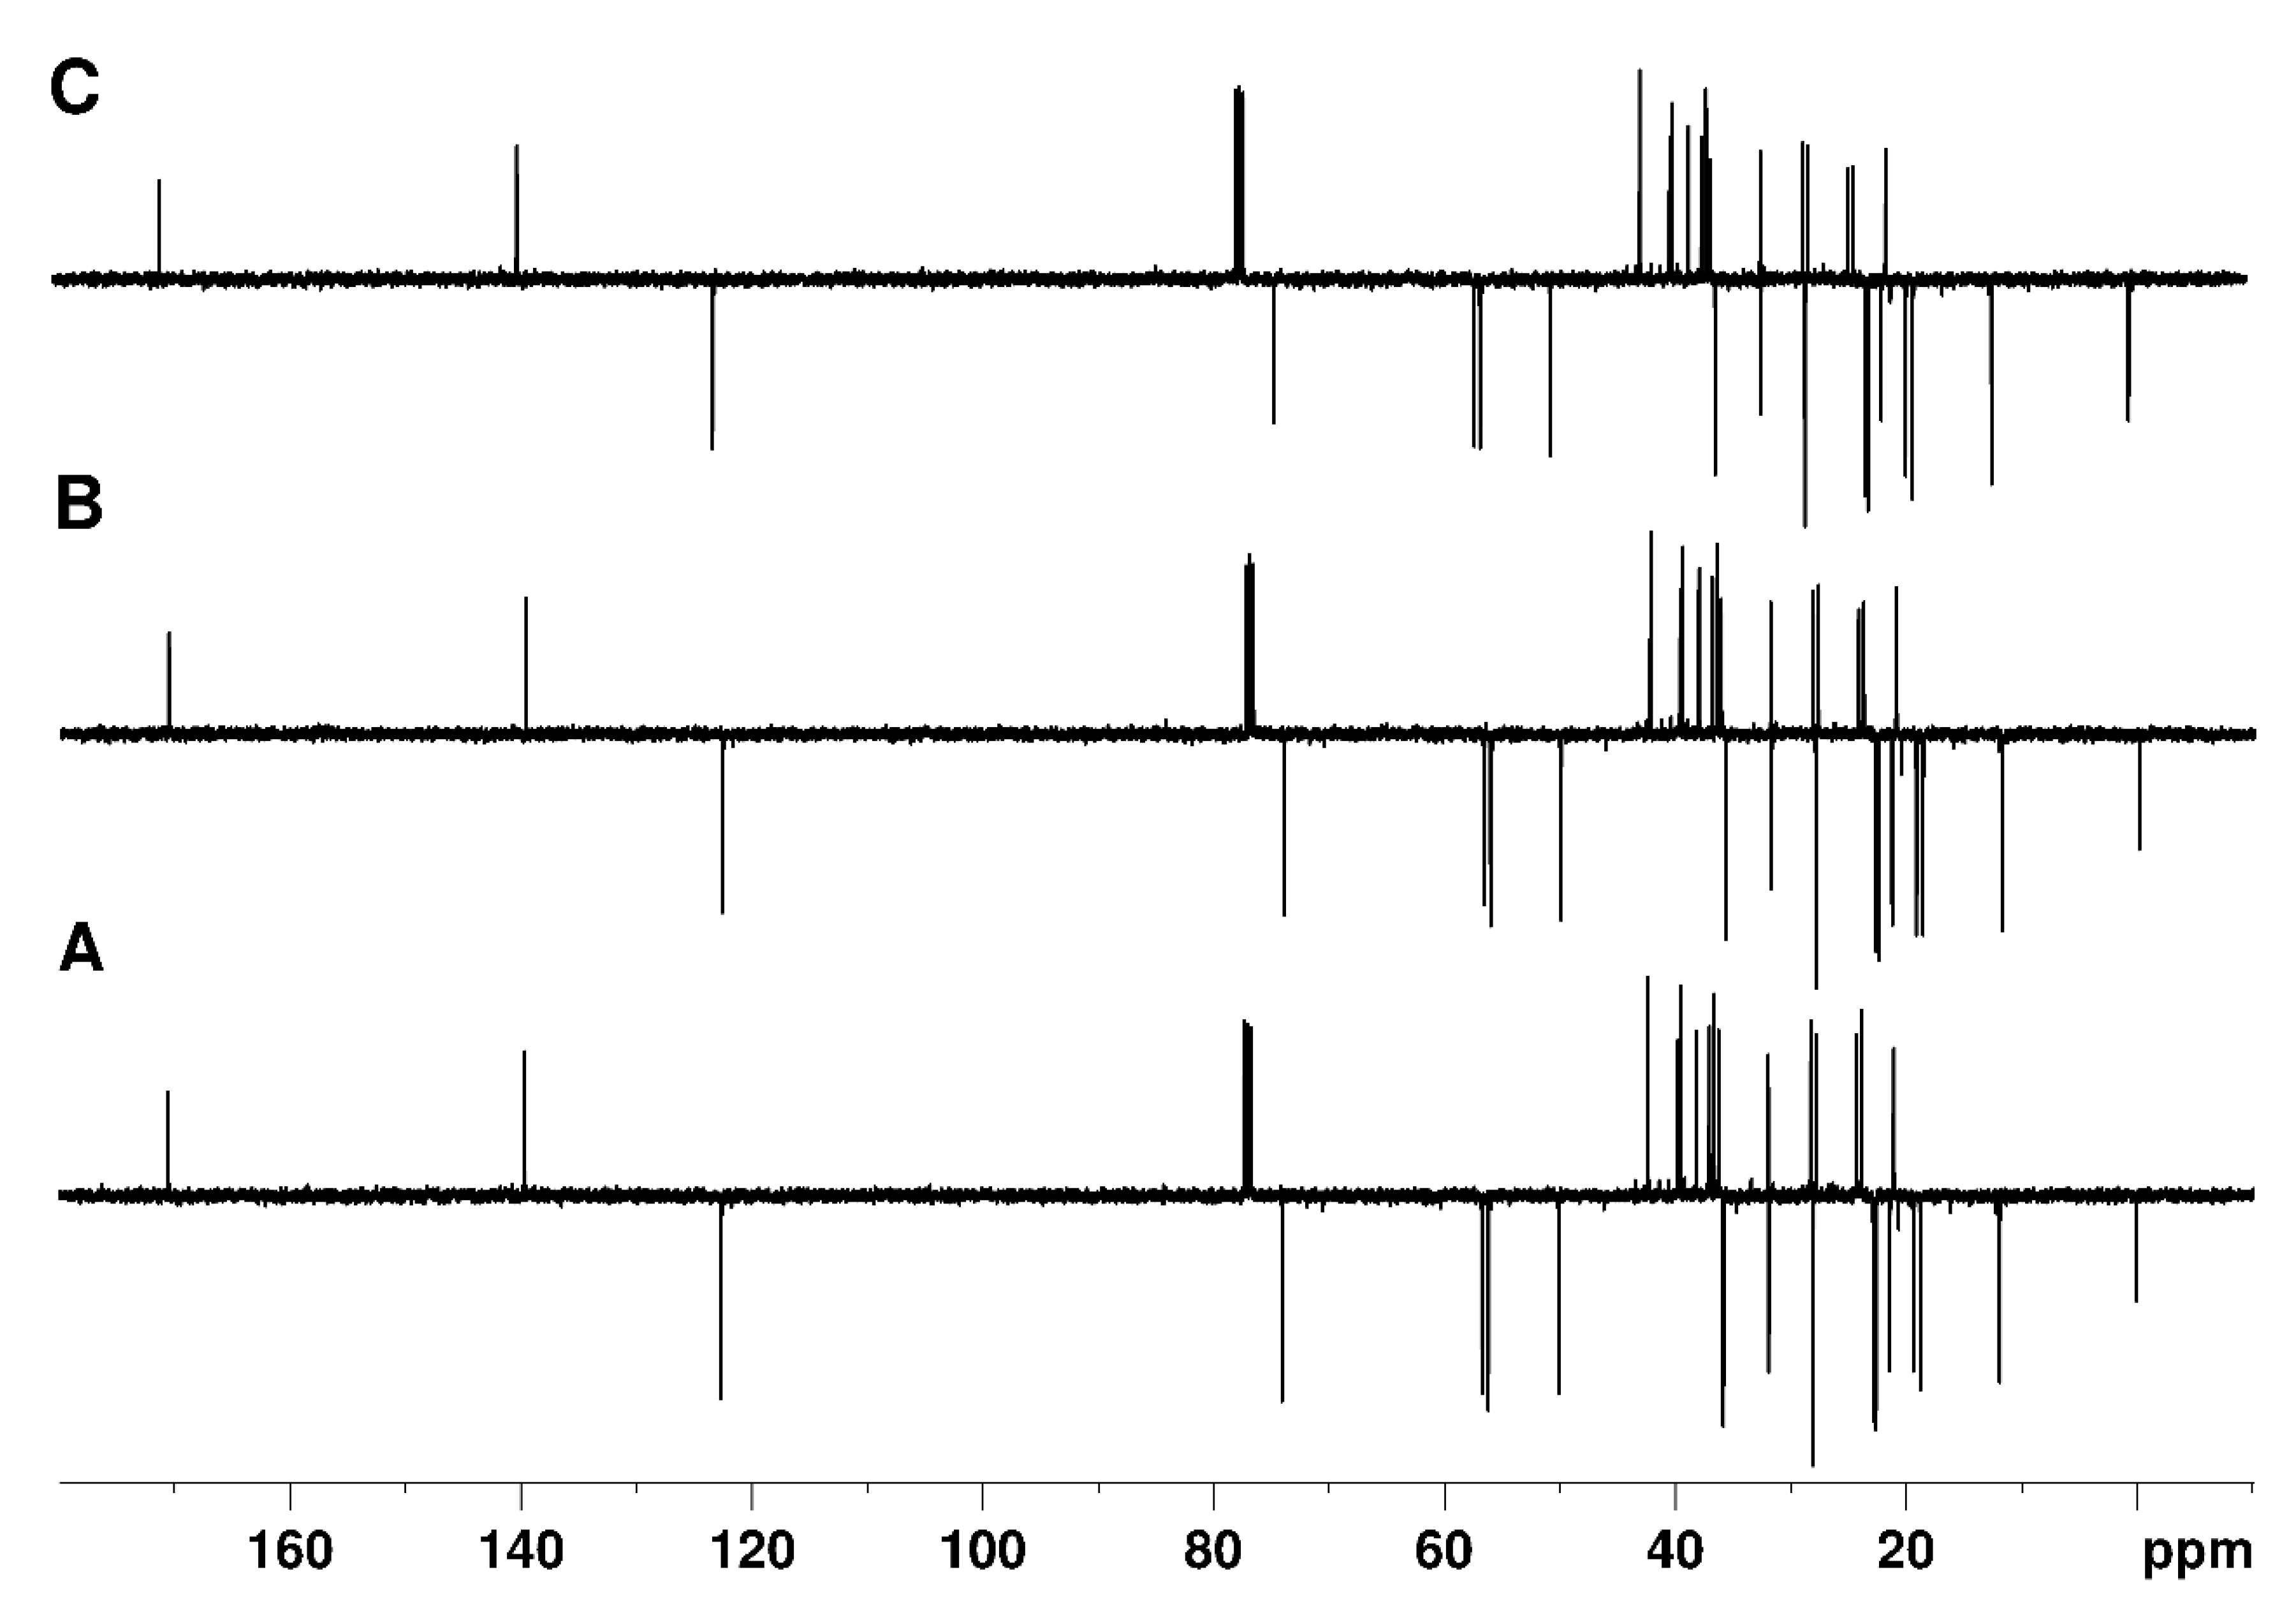
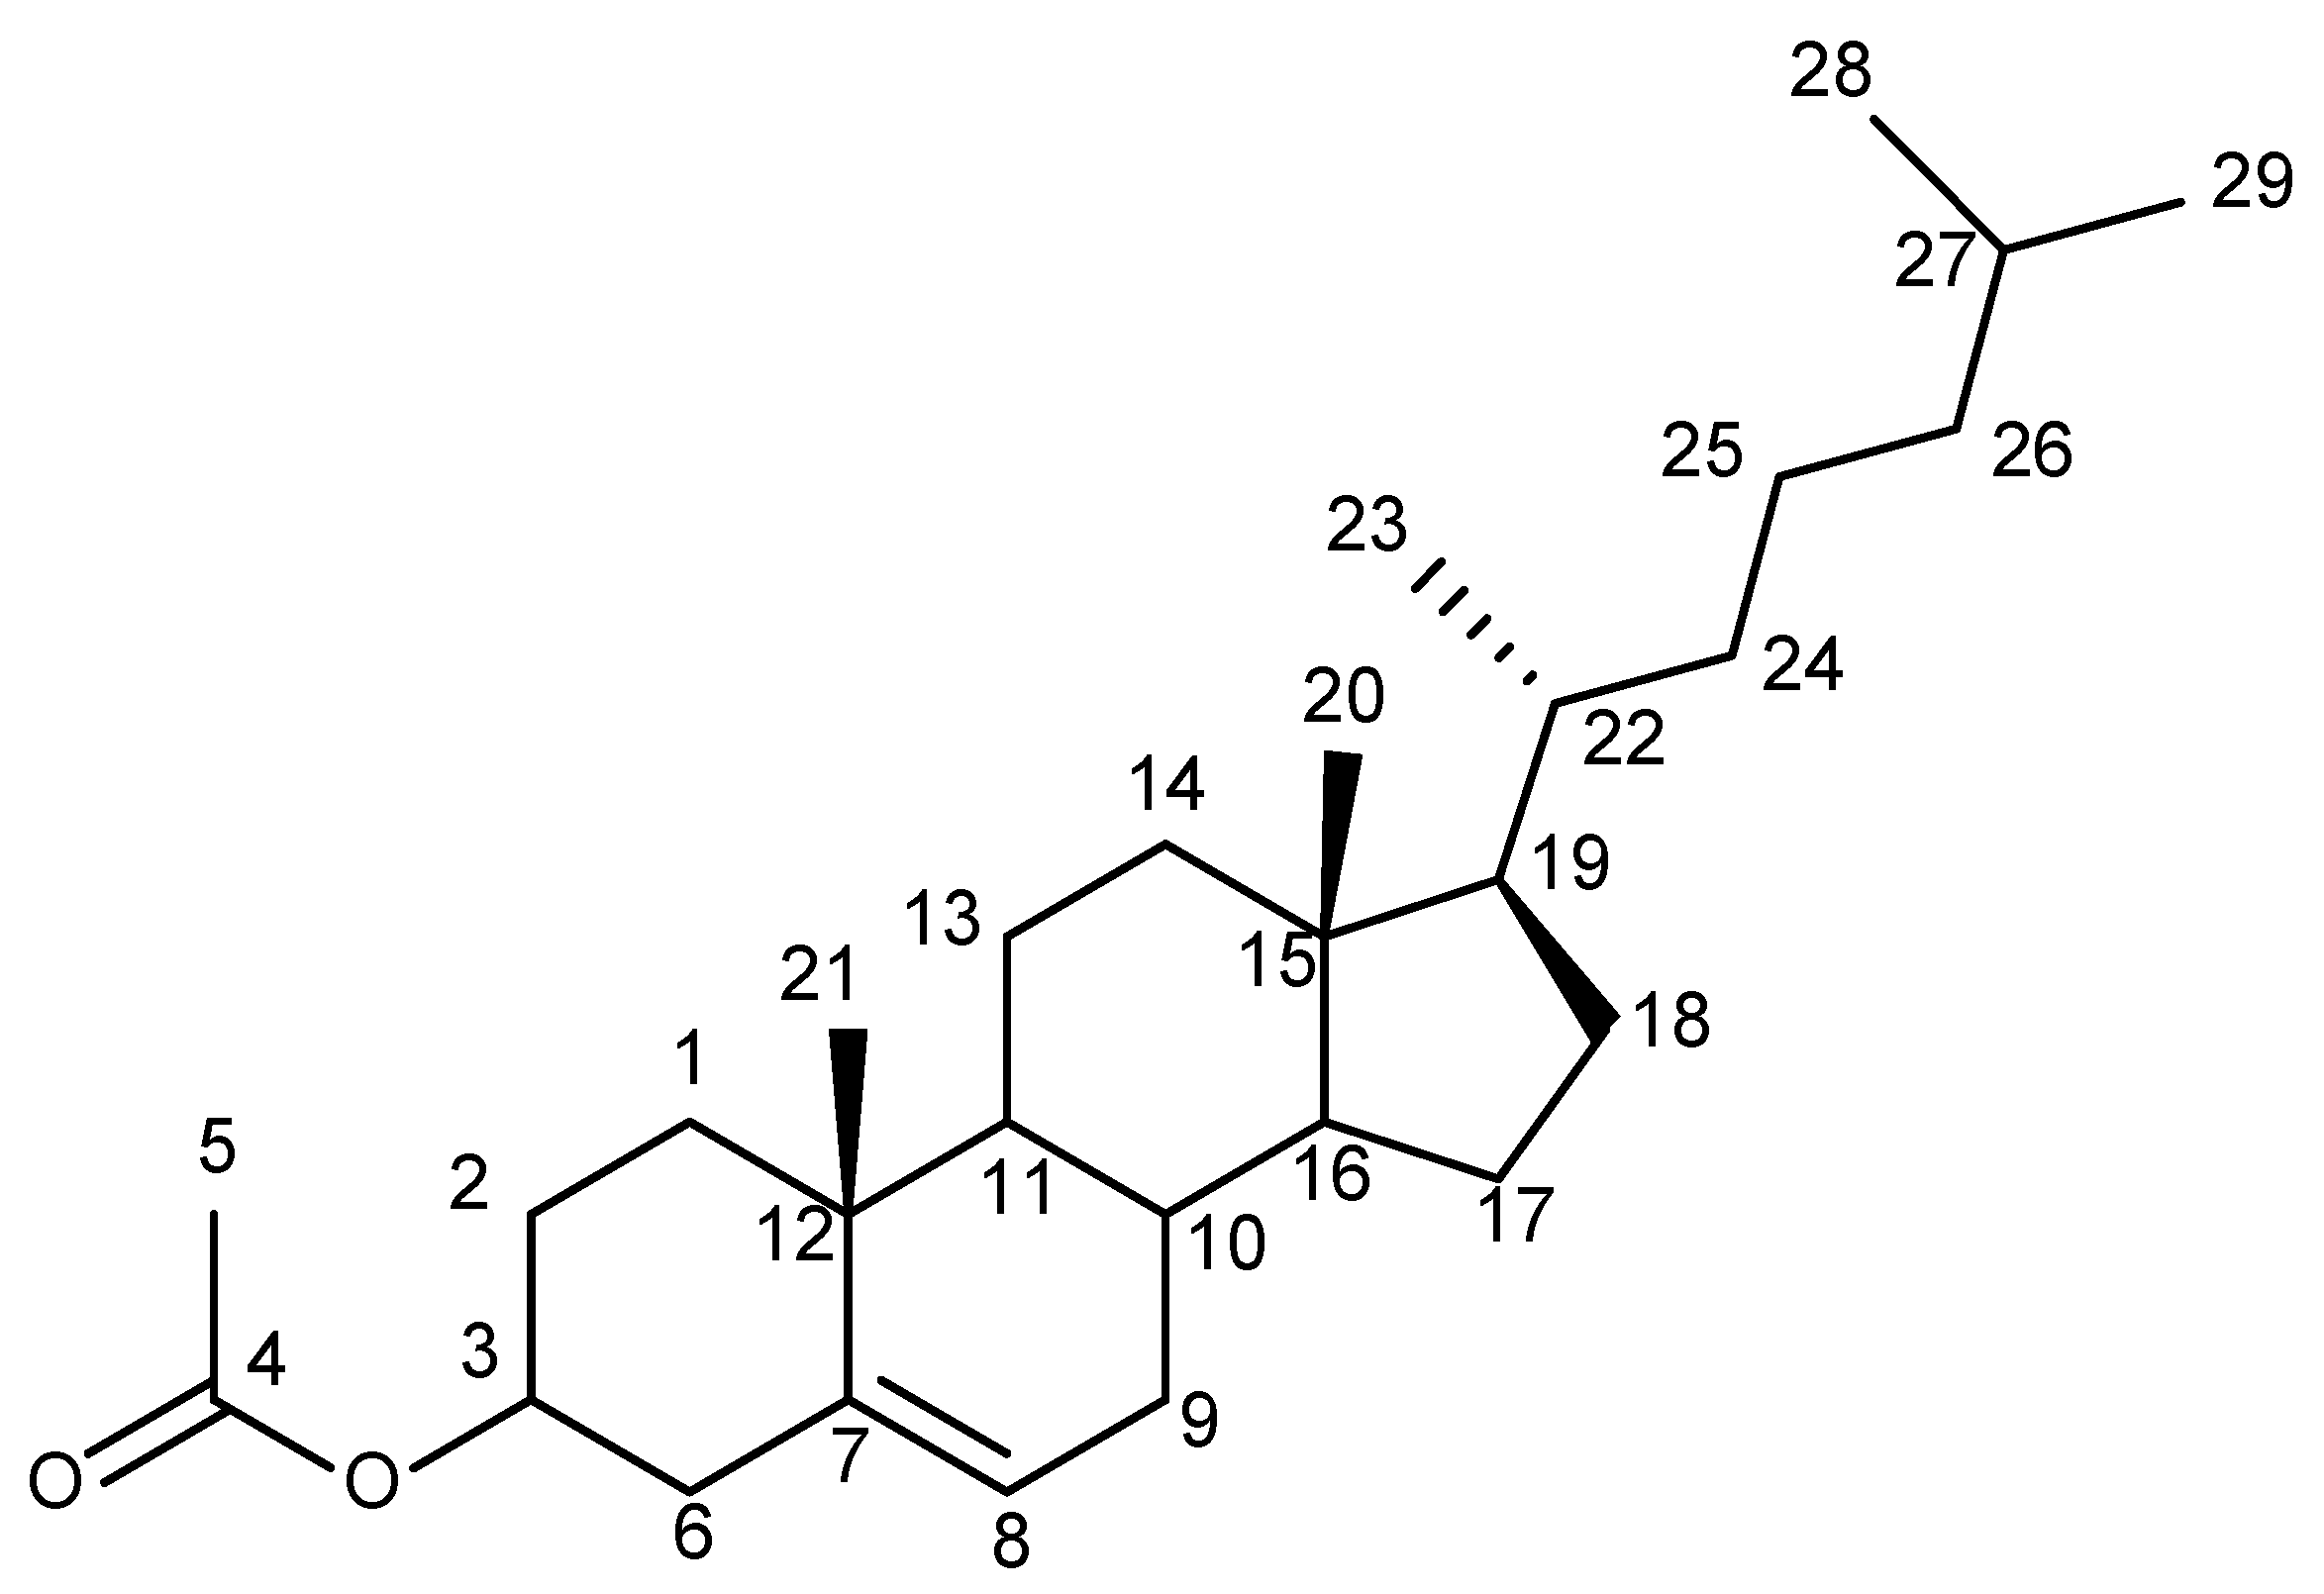
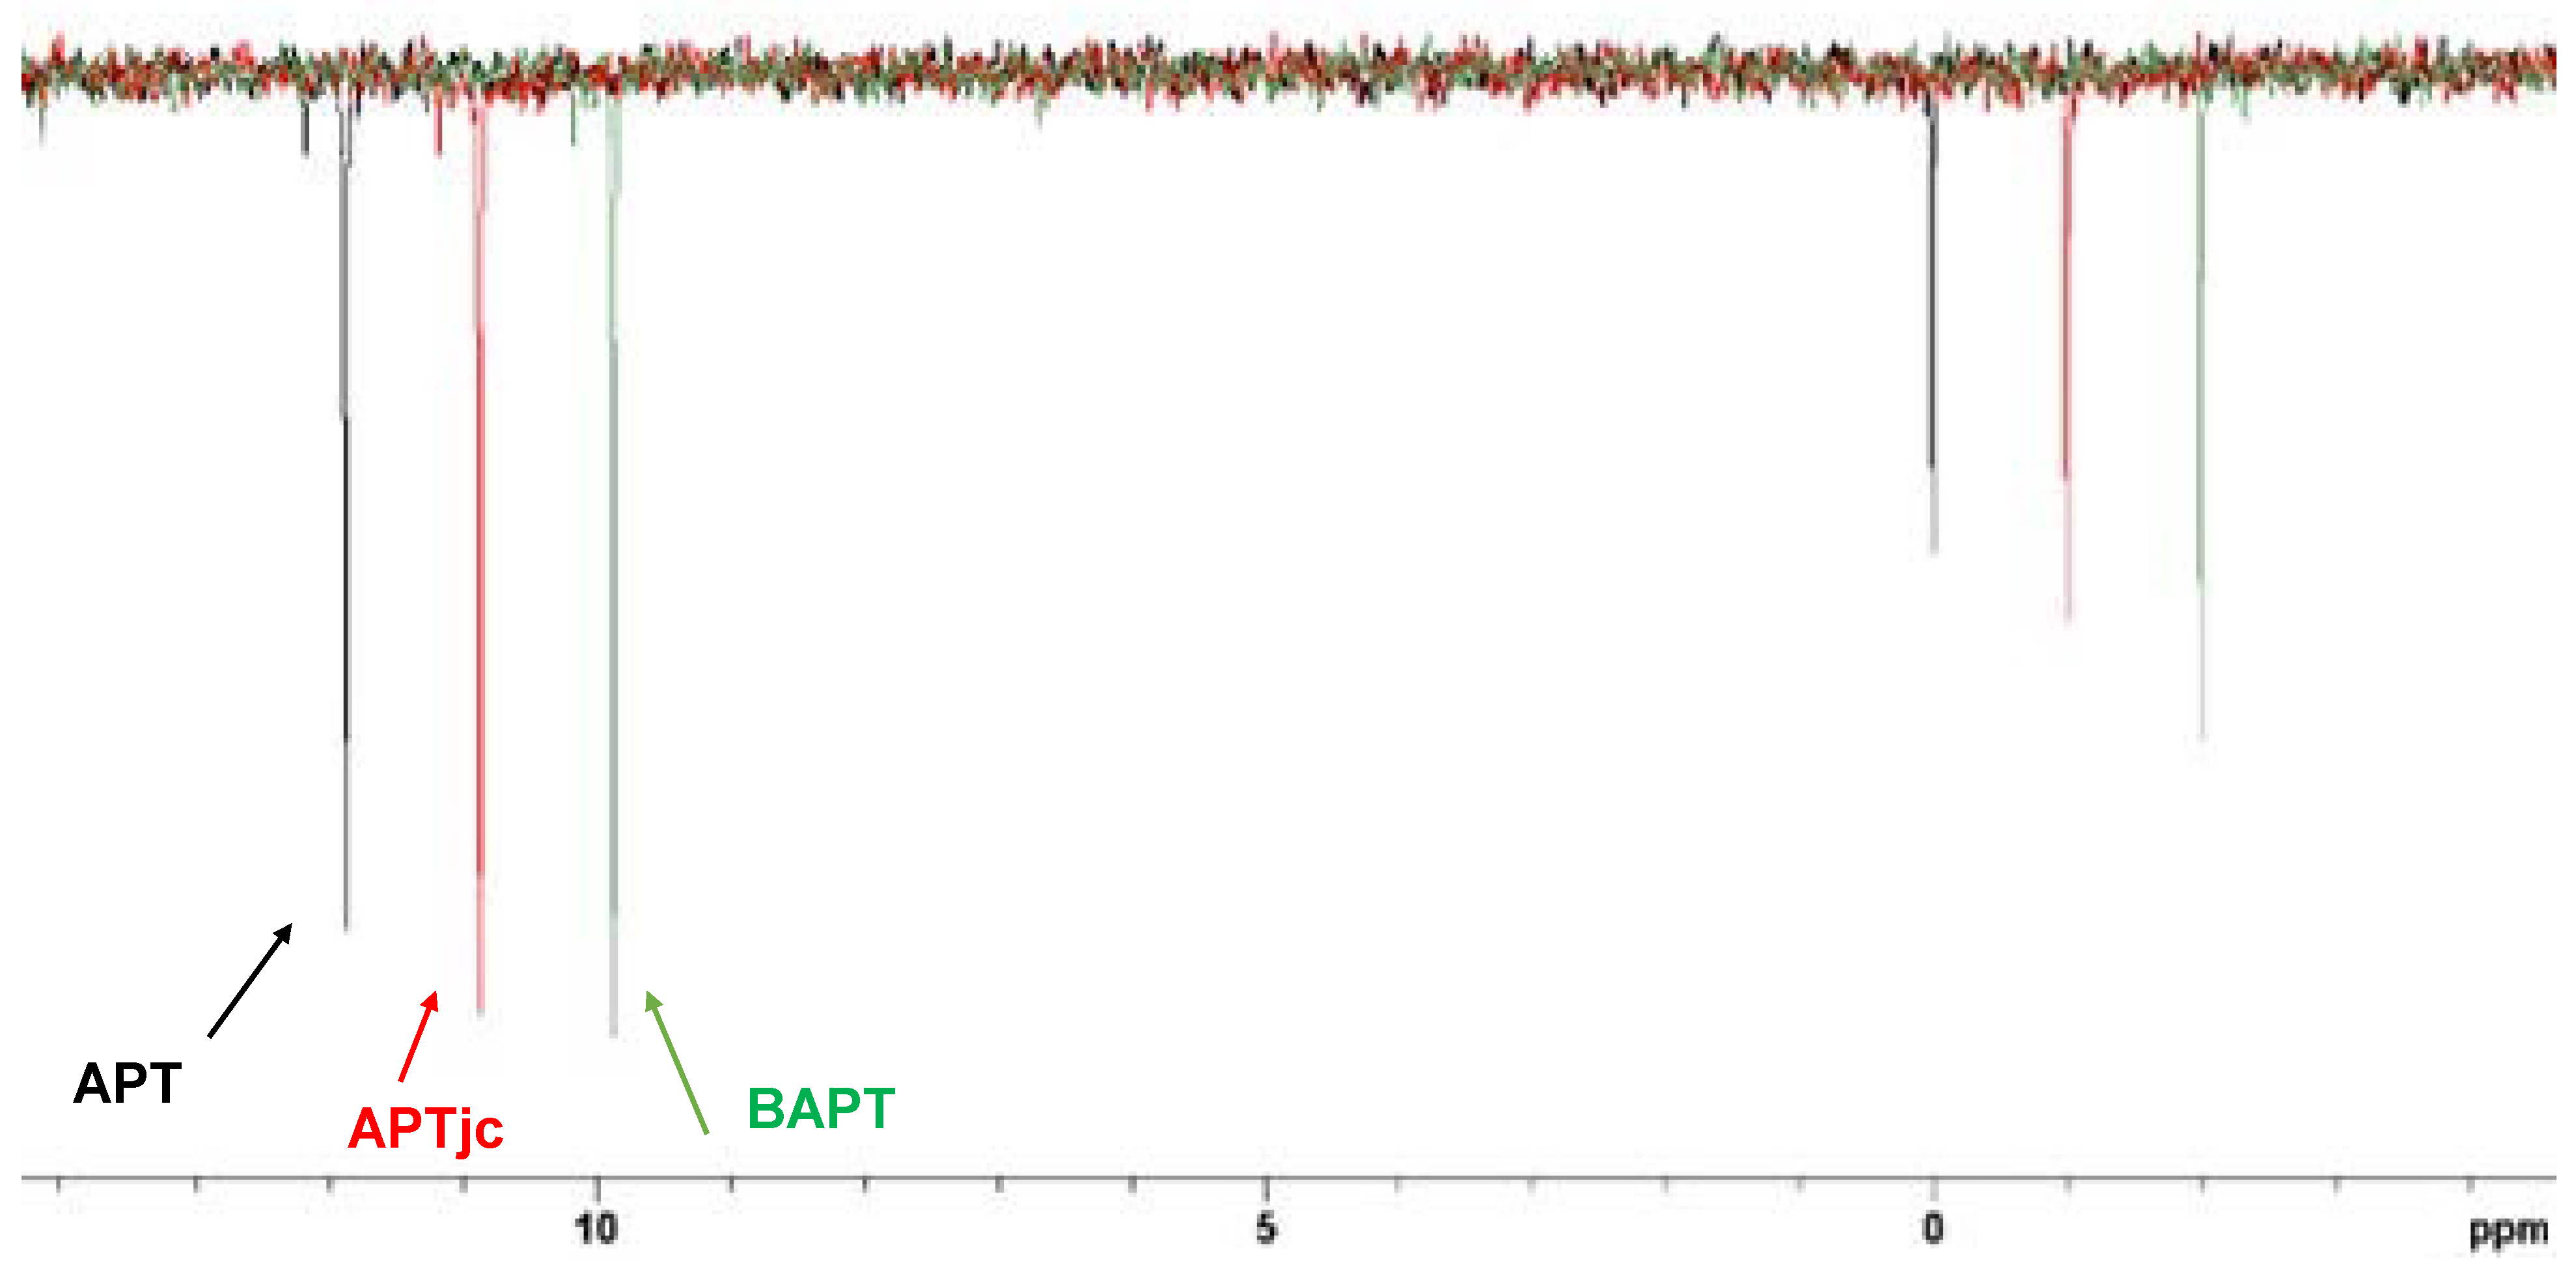
In Figure 6, the APT, APTjc, and BAPT spectra of 100 mmol cholesteryl acetate (Figure 7) dissolved in CDCl3 are shown. For APT and APTjc, the delay Δ1 was set to a coupling constant of 145 Hz, while for BAPT, Δ1 and Δ3 were set to a coupling constant of 130 Hz, and Δ2 was set to a coupling constant of 170 Hz, respectively. As expected for a molecule with a narrow range of one-bond coupling constants (120–153 Hz), similar spectra were obtained. However, the intensities of some methyl groups (Me20 at δ = 12 ppm) and of TMS at δ = 0 ppm were slightly more intense in the BAPT spectrum (Figure 8), as predicted, while other resonances (C3 at 74.2 ppm, C8 at 122.8 ppm) were slightly less intense (Figure S14).

3.1.2. Cq-Only Spectrum

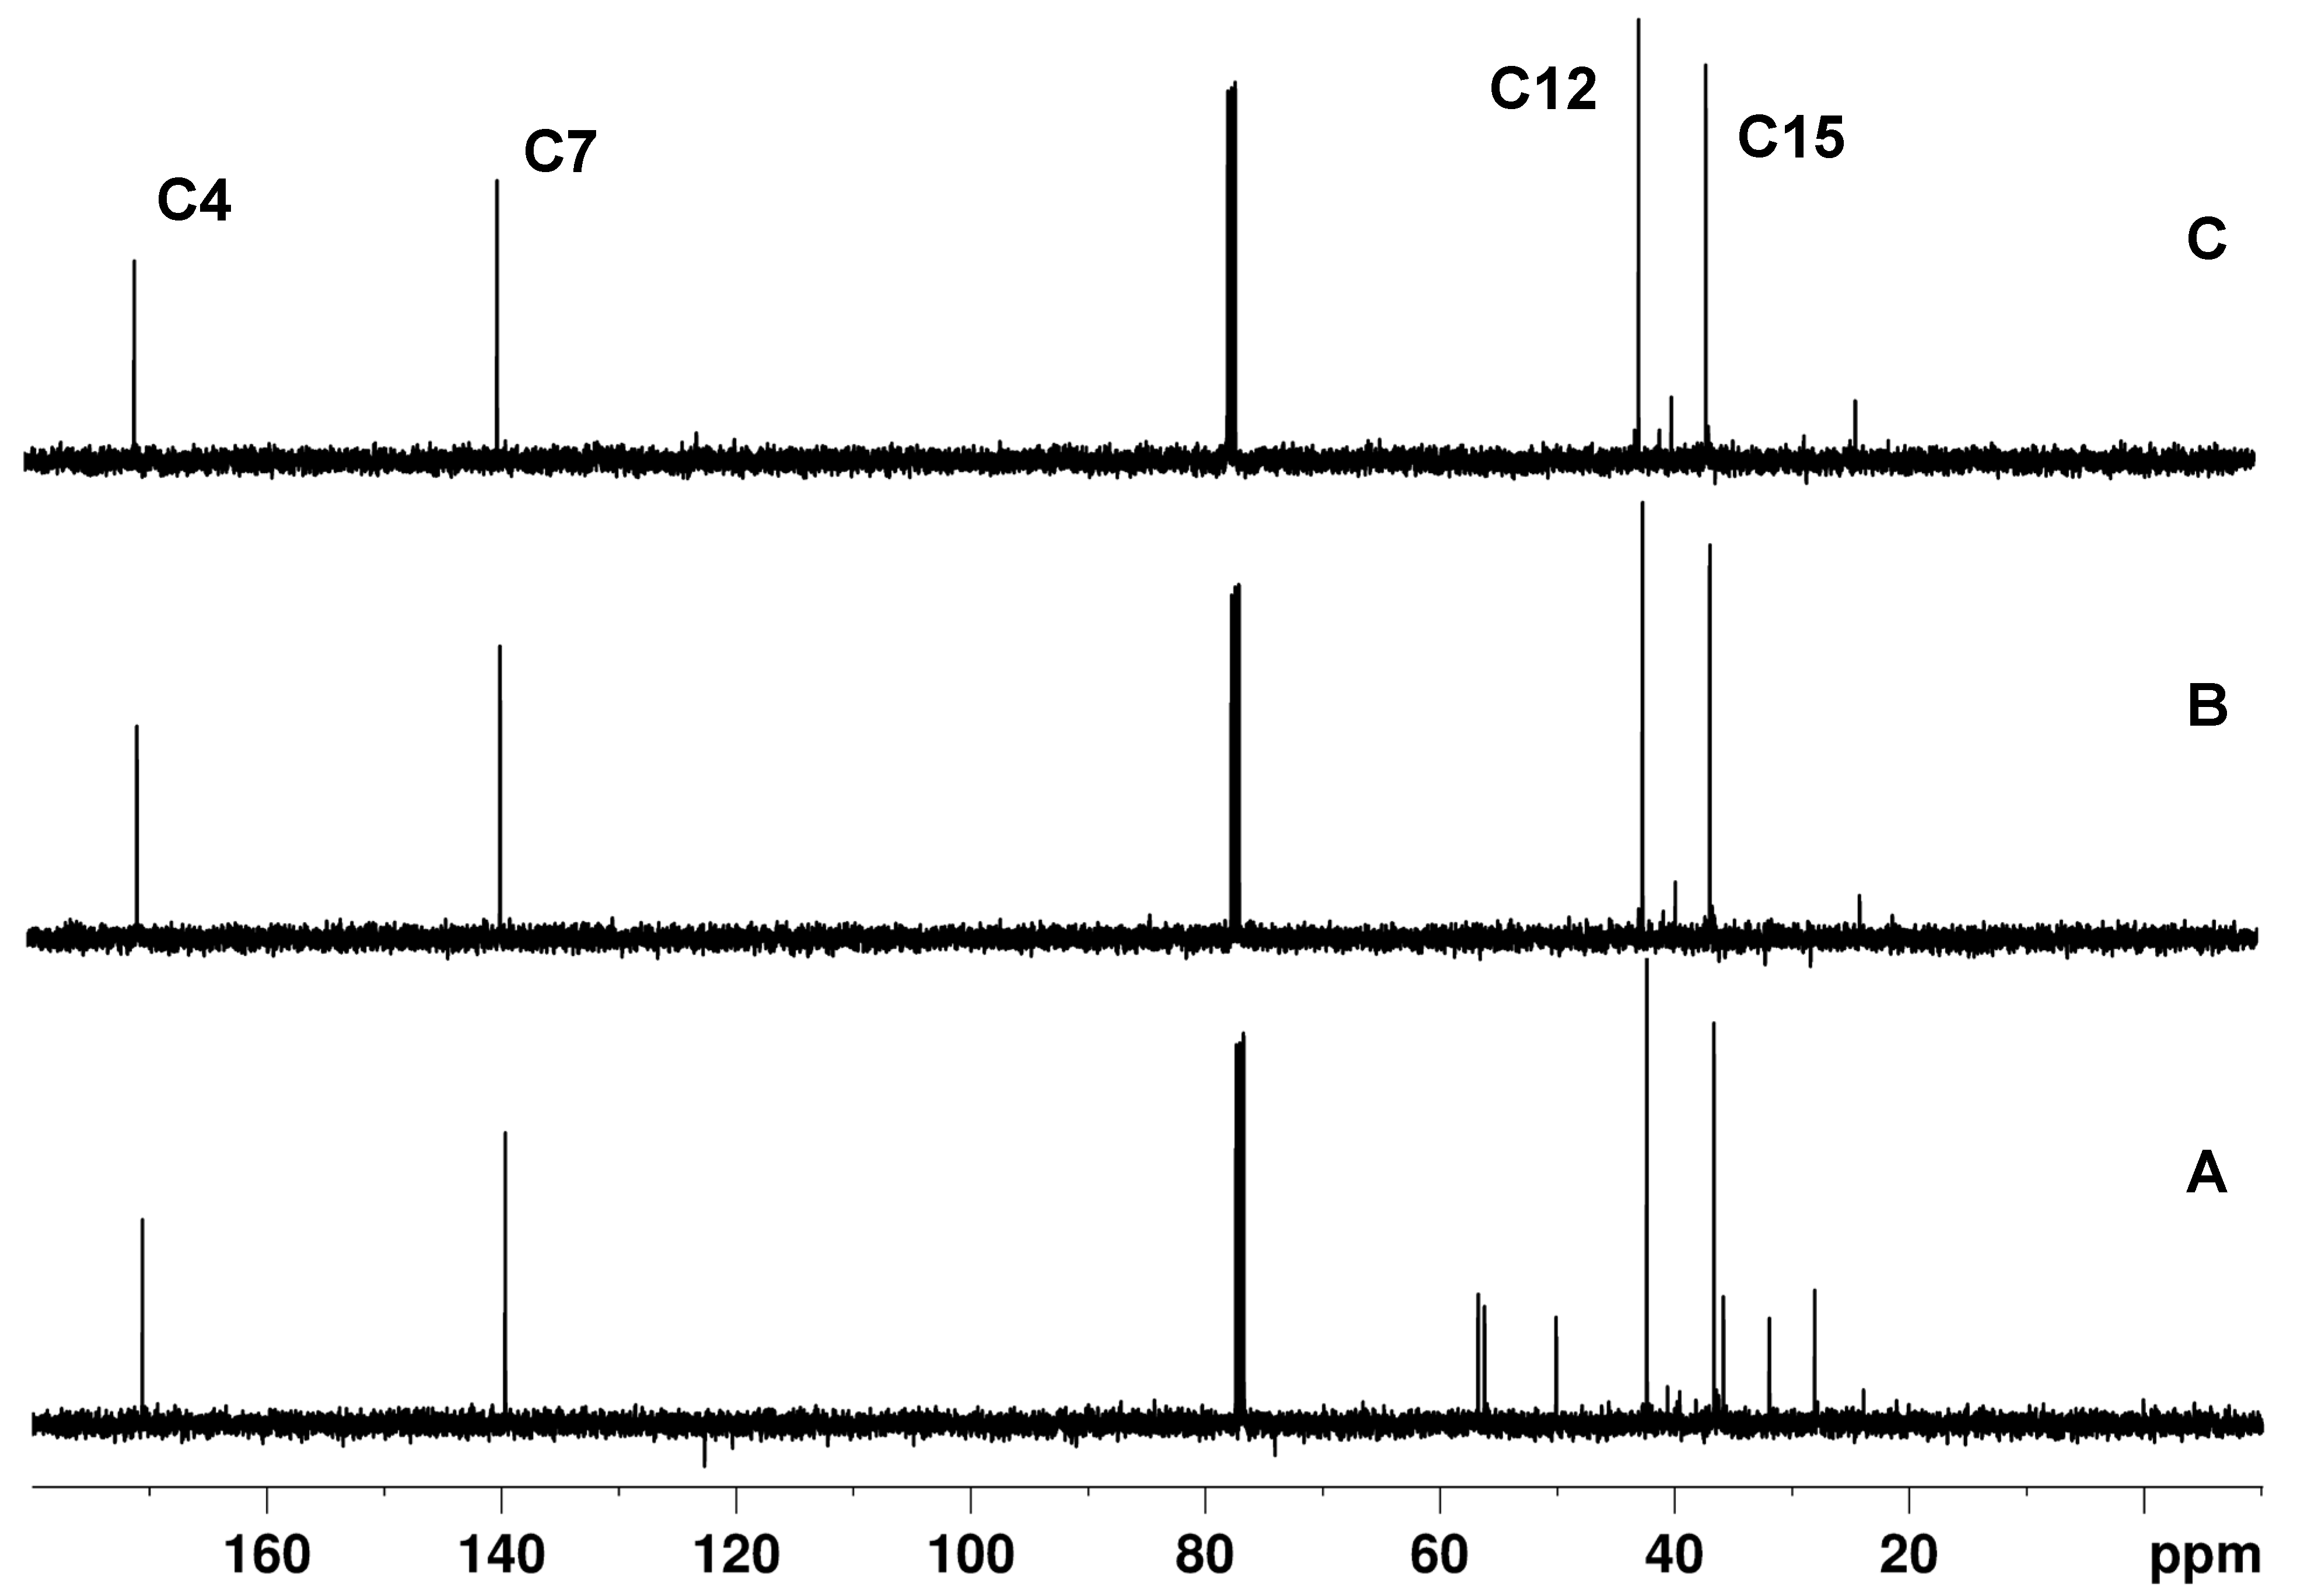
In Figure 9, the Cq-only spectra obtained using the APT, the modified APTjc, and the BAPT pulse sequences of cholesteryl acetate are shown. For APT and APTjc, the delay, Δ, was set to a coupling constant of 145 Hz, while for BAPT, Δ1 and Δ3 were set to a coupling constant of 130 Hz, and Δ2 was set to a coupling constant of 170 Hz, respectively. As expected, the spectrum obtained using the APT sequence was marred by numerous, sometimes quite intense, CH and CH2 artifacts. The spectra demonstrate the ability of the APTjc and the new BAPT pulse sequences to efficiently remove the signals originating from protonated carbons and to provide clean Cq-only spectra, comparable to those obtained using the SEMUT-GL and iQCD sequences, which are known to provide the best-possible Cq-only spectra [27,28].

3.2. 4-Methyl-N,N-(prop-2-yn-1-yl)aniline

3.2.1. APT Spectrum

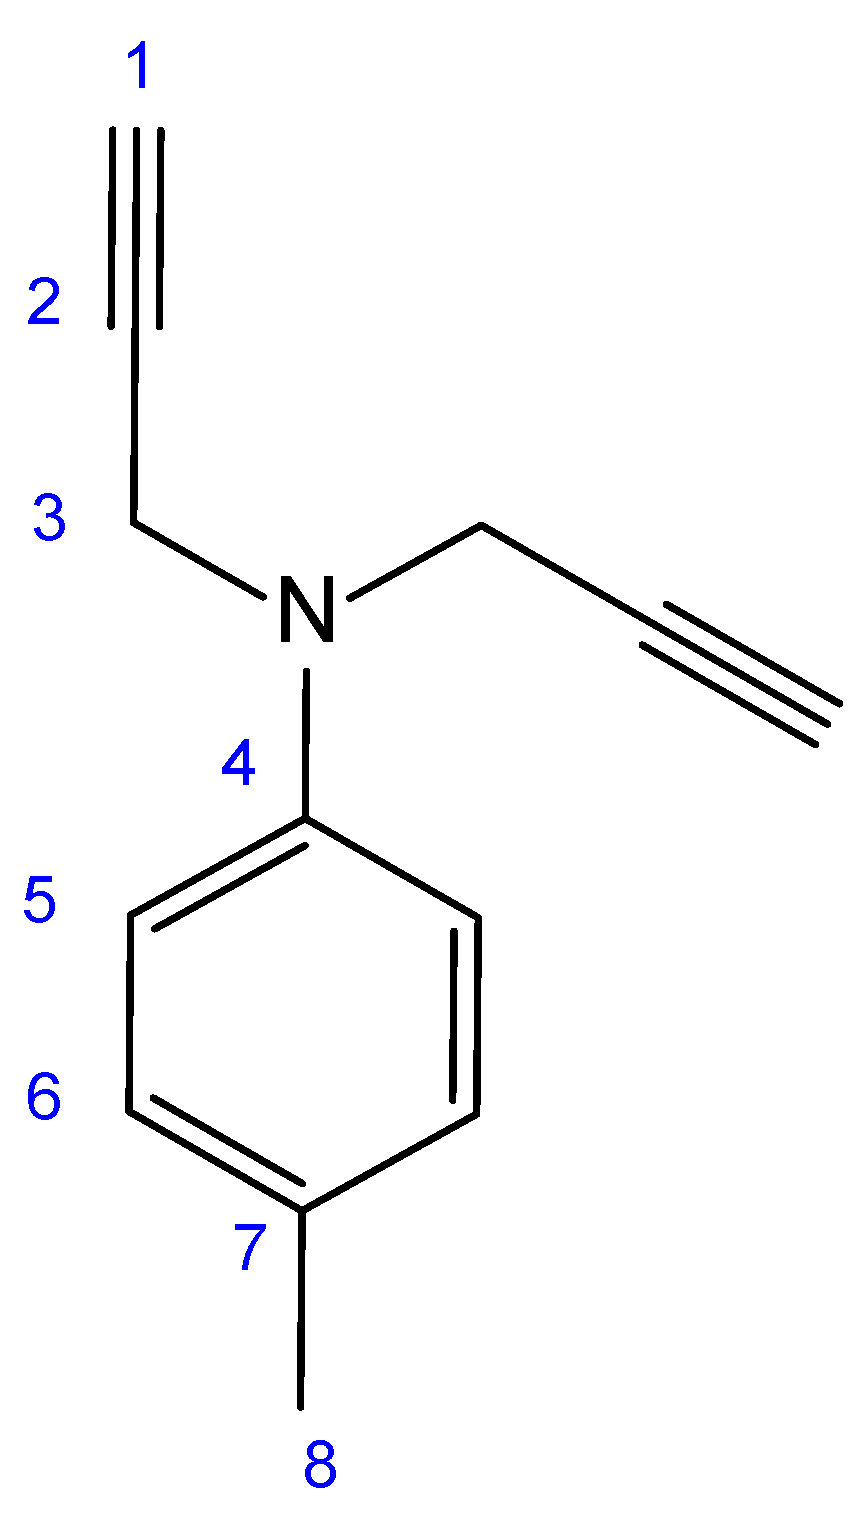
To better evaluate the effective performance of the BAPT experiment in a more challenging situation, we used a sample of ~30 mg of 4-methyl-N,N-di(prop-2-yn-1-yl)aniline dissolved in 0.7 mL of CDCl3 (Figure 10). This molecule has alkane, aromatic, and alkyne groups that cover the entire range of 1JCH coupling constants (125 Hz for 1JC8H8 to 248 Hz for 1JC1H1). Also, note the special case of C2 at 79.4 ppm, which behaves like a pseudo-quaternary carbon with its large two-bond coupling constant 2JC2H1 of 49 Hz. C2 should therefore be viewed as a CH group with a small 1JCH coupling constant.
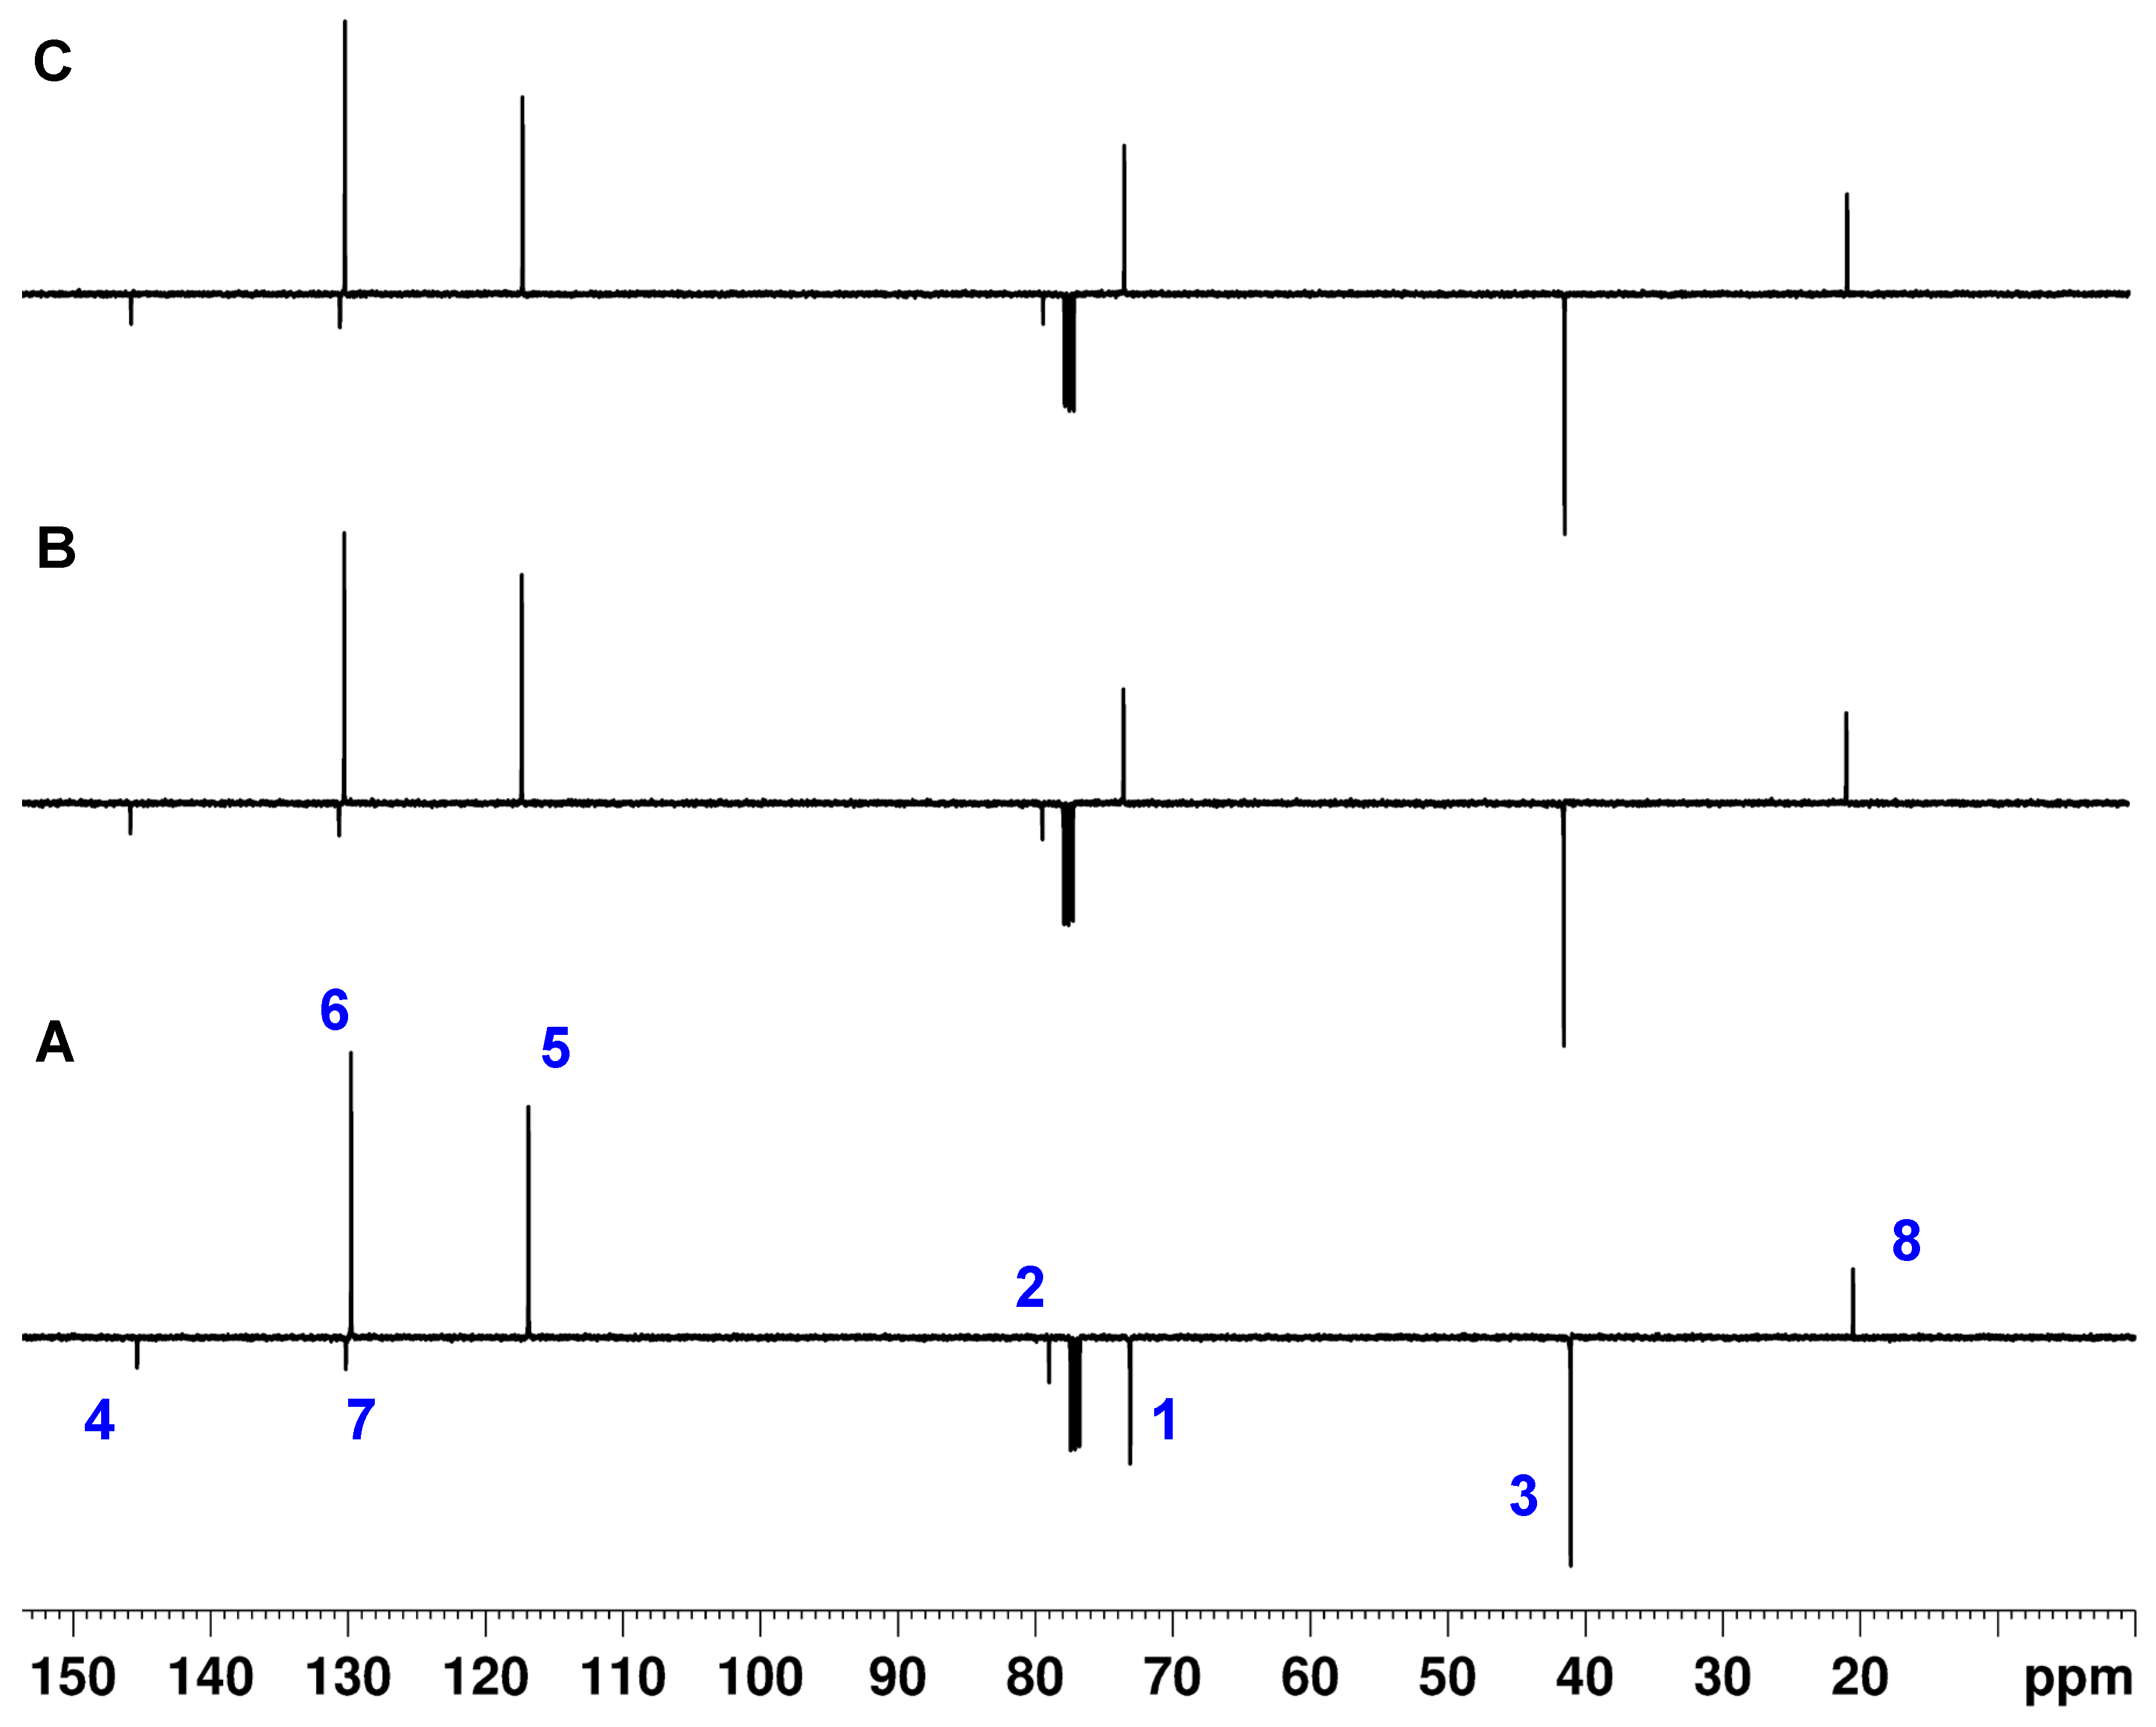
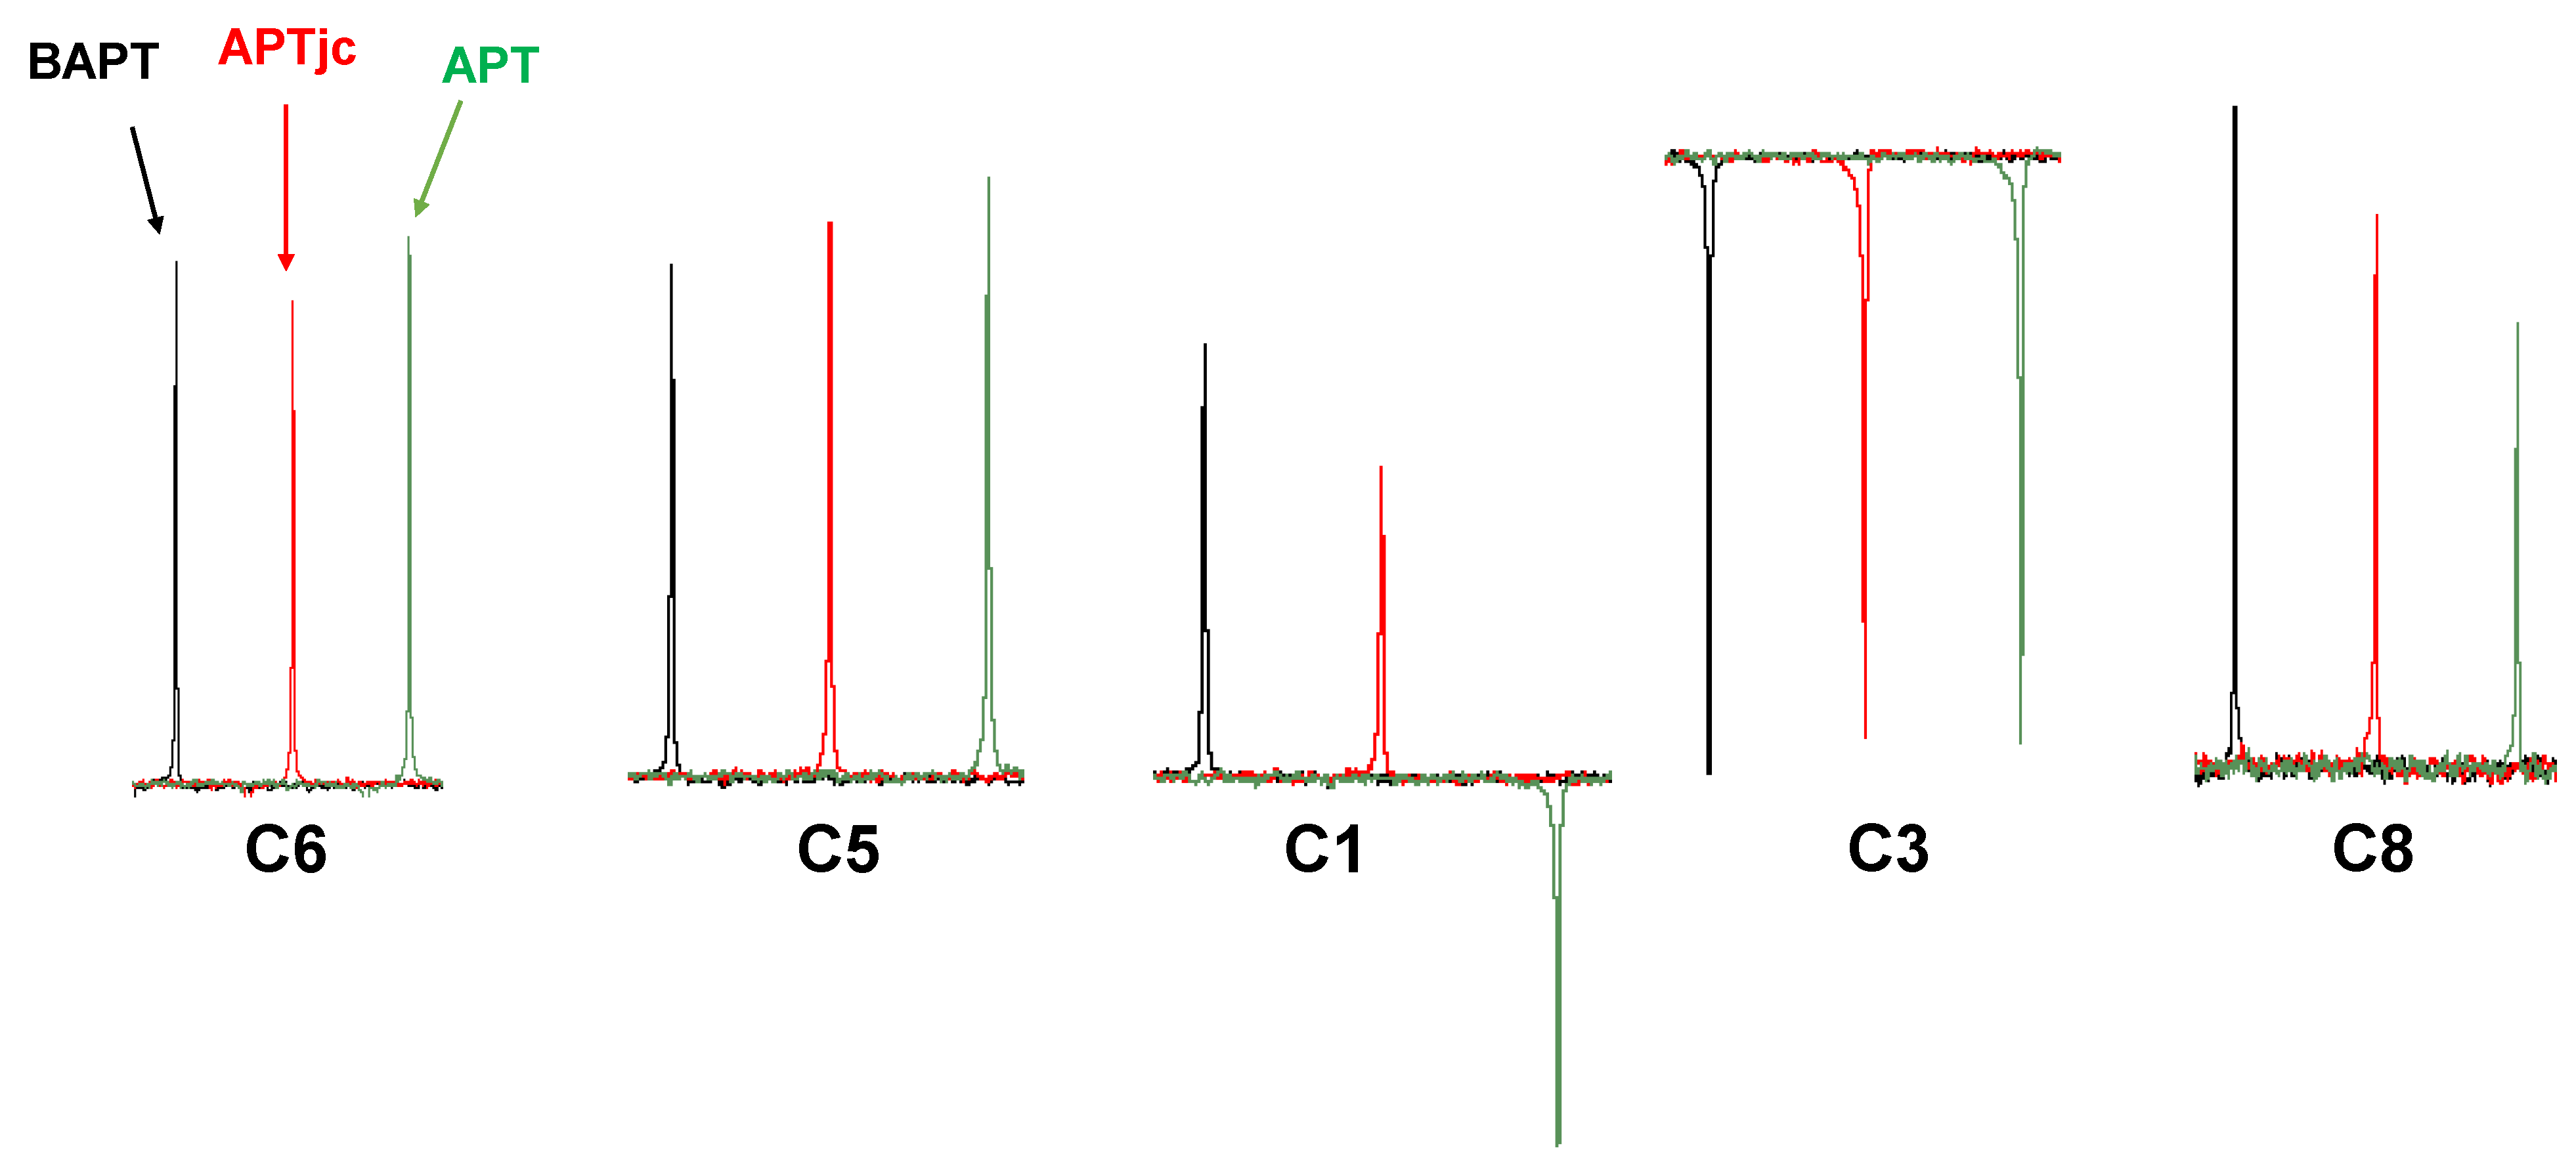
The standard APT spectrum of 4-methyl-N,N-di(prop-2-yn-1-yl)aniline is misleading. On the one hand, the resonance of the C8 methyl group at 20.6 ppm was very weak, and on the other hand, and more seriously, the resonance of C1 at 73.1 ppm appeared with the wrong sign and thus also provided the wrong multiplicity (Figure 11). As has been shown theoretically, these two findings were due to the large discrepancy between the actual 1JCH coupling constants in the acetylene- (~250 Hz) and methyl (~120 Hz) groups and the average coupling constant used to define the delays in the APT experiment, 1J1CH = 145 Hz. Note that using an average 1J1CH coupling constant of 185 Hz resulted in an APT spectrum with correct signal signs, but the resonance of the C8 methyl group at 20.6 ppm was almost invisible (not shown). In the APTjc spectrum of 4-methyl-N,N-di(prop-2-yn-1-yl)aniline, all resonances appeared with the correct signs according to their multiplicities, as well as an overall good intensity. In the BAPT spectrum, the signal intensities of C3 and C6 were slightly better, that of C5 slightly worse, while the signals of C1 and C8 were more intense (Figure 12). The BAPT spectrum was recorded according to the theoretical findings (Figure 3 and Figures S7–S9); the delay Δ2 was adjusted to a coupling constant of 240 Hz, and the delays Δ1 and Δ3 were adjusted to a value of 145 Hz.
The ability to independently optimize the three delays Δ1–Δ3 offers great flexibility with the BAPT sequence for specific optimization. This makes it possible to specifically increase the intensity of selected resonances and reduce others to achieve a sufficient intensity for all resonances in the shortest possible time and thus optimize the measurement time. As an example, by changing the values of the three delays Δ1–Δ3, the intensity of the less intense carbons C1 and C8 can be slightly increased at the expense of the more intense carbons C3, C5, and C6 (Figure S15).

3.2.2. Cq-Only Spectrum

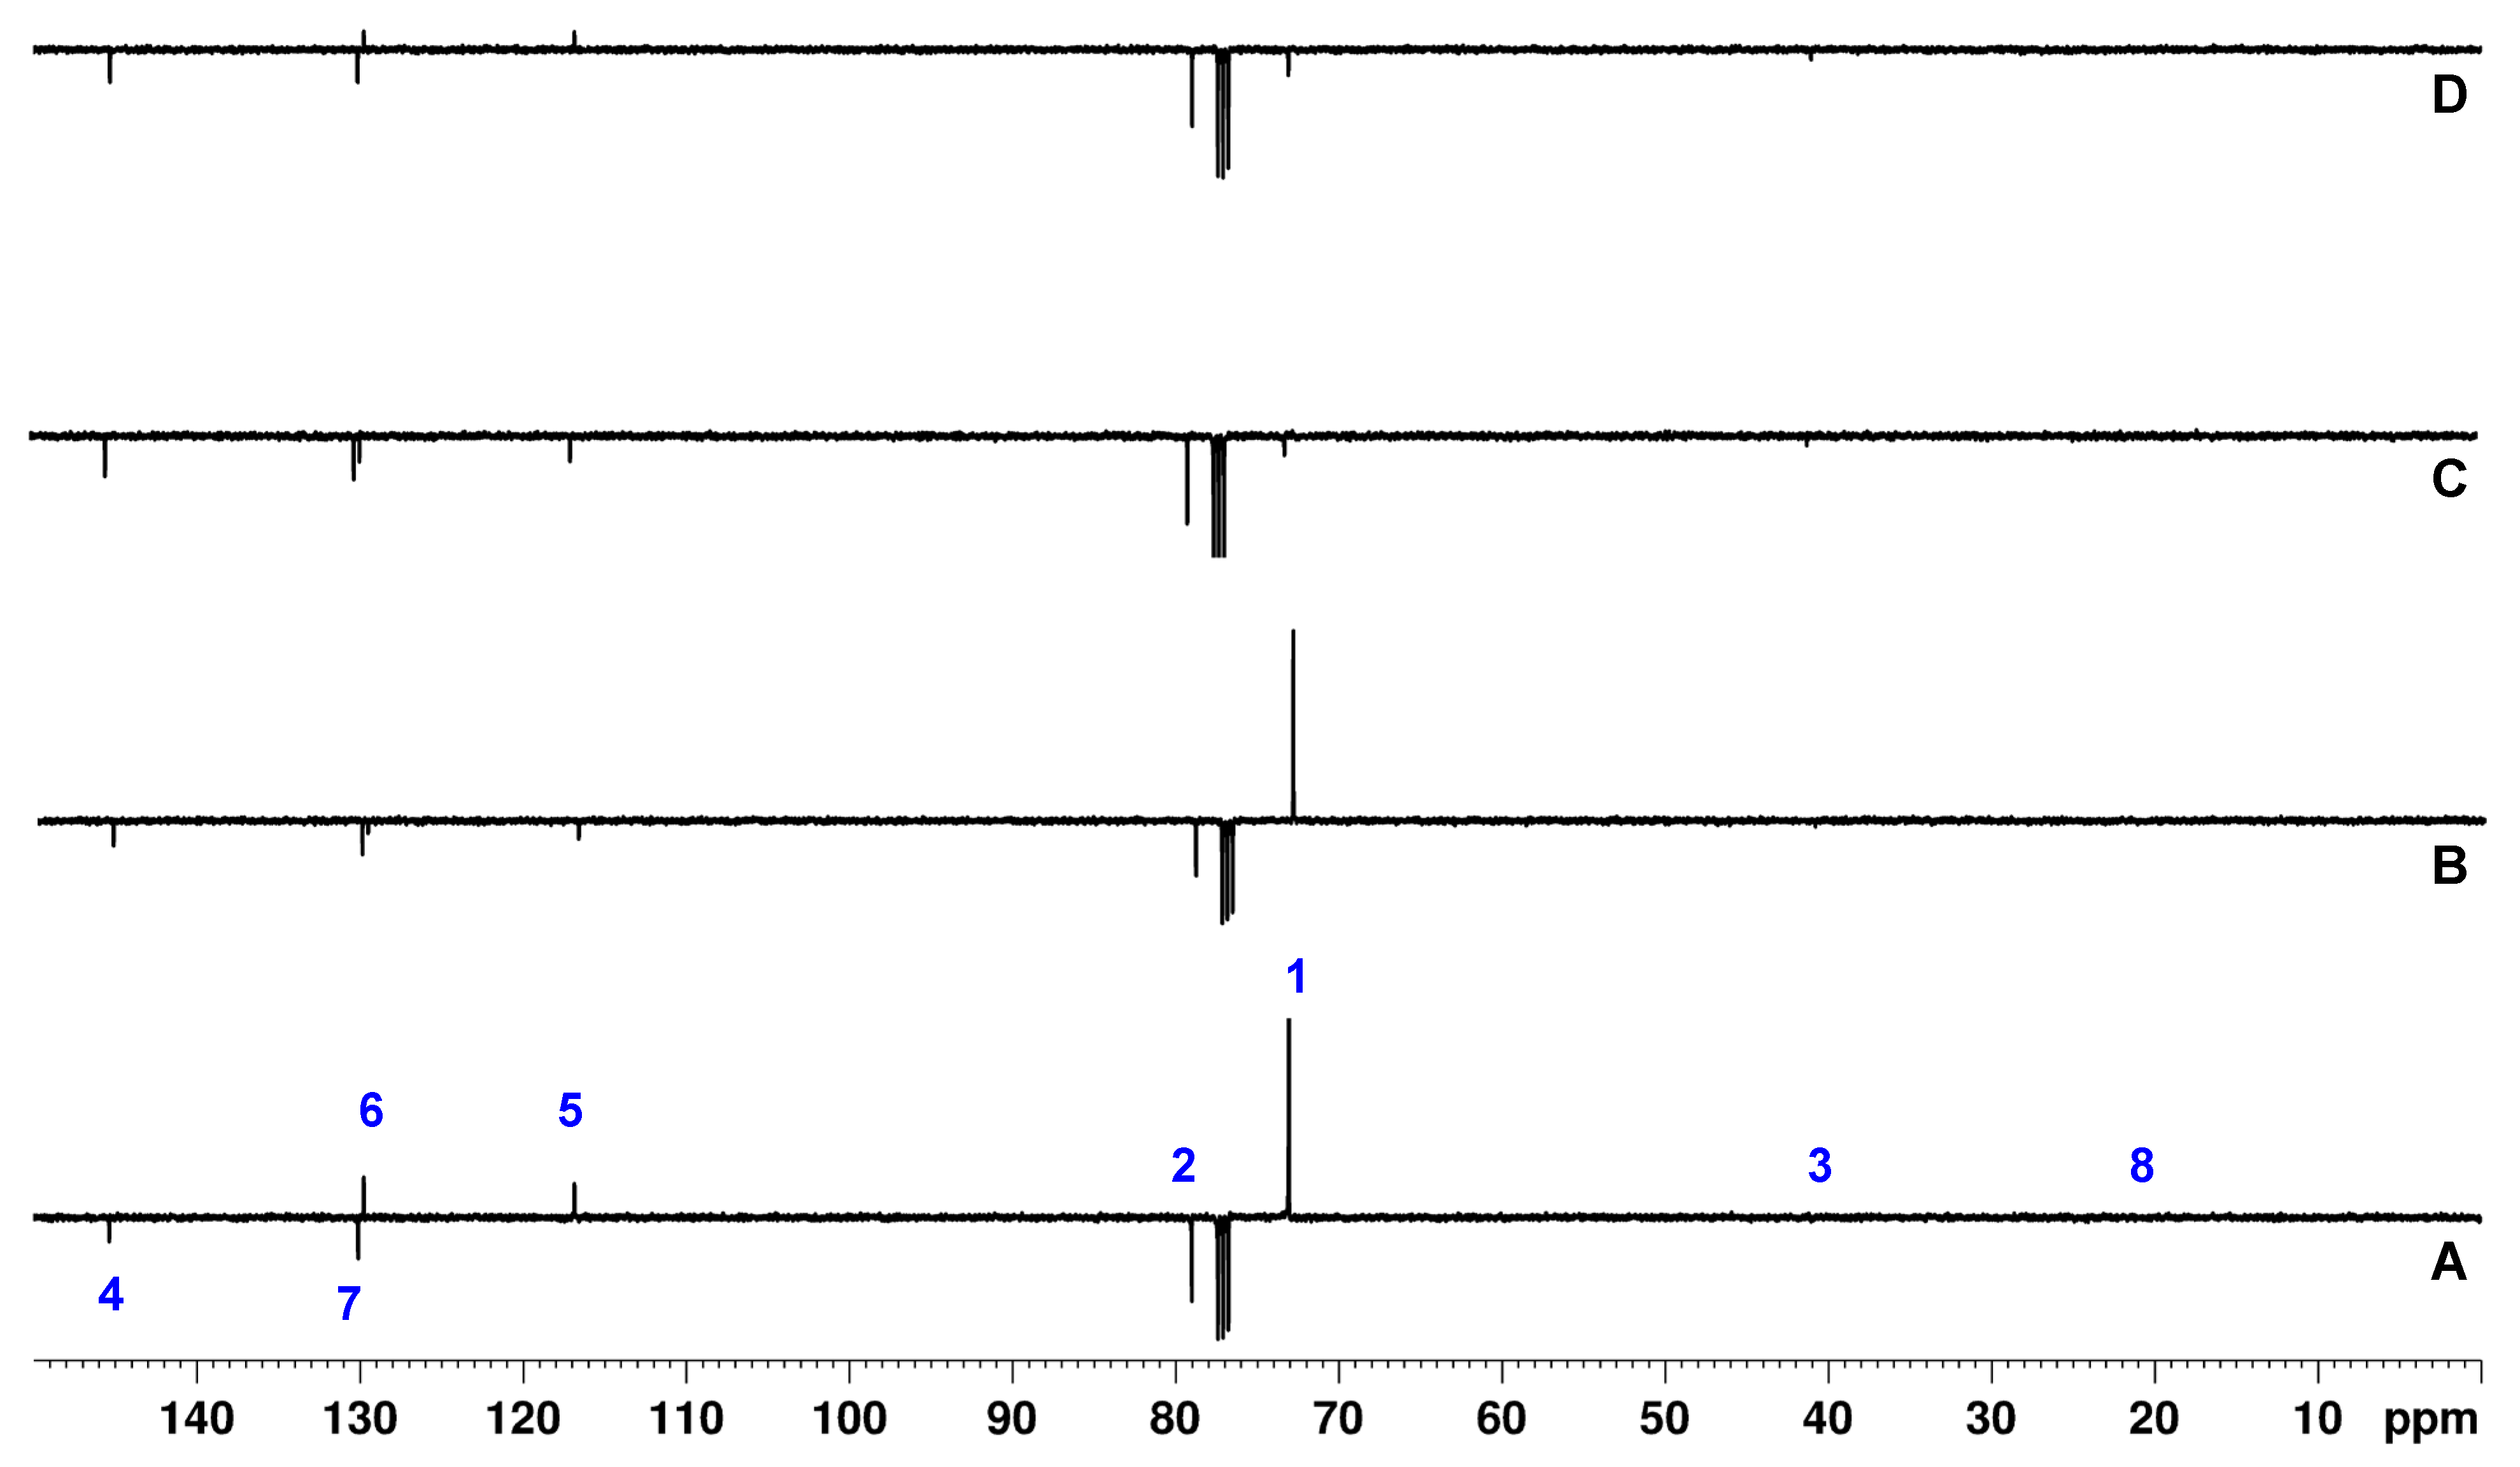
In Figure 13, the Cq-only spectra of 4-methyl-N,N-di(prop-2-yn-1-yl)aniline recorded with the APT, the modified APTjc, and BAPT sequences are shown. The Cq-only spectra obtained with the modified APTjc and BAPT sequences showed similar suppression degrees for CHn signals, except for a strong artifact of C1 at 73.1 ppm visible in in the APTjc spectrum. As expected, the APT sequence resulted in a significantly worse suppression of the CHn signals. The quality of the Cq-only spectrum obtained with the optimized SEMUT-GL sequence [27,32] was identical to that obtained with the BAPT sequence, except that the sign of the residual CH group signals was reversed due to the use of different Δ1–Δ3 delays.
Finally, we would like to highlight two situations in which 1D 13C BAPT experiments may prove advantageous over the standard heteronuclear inverse 2D 1H-13C correlation experiments HSQC and HMBC, even though a fair comparison proves tricky, because the philosophies, spectroscopic information, and characteristics of the experiments are so different.
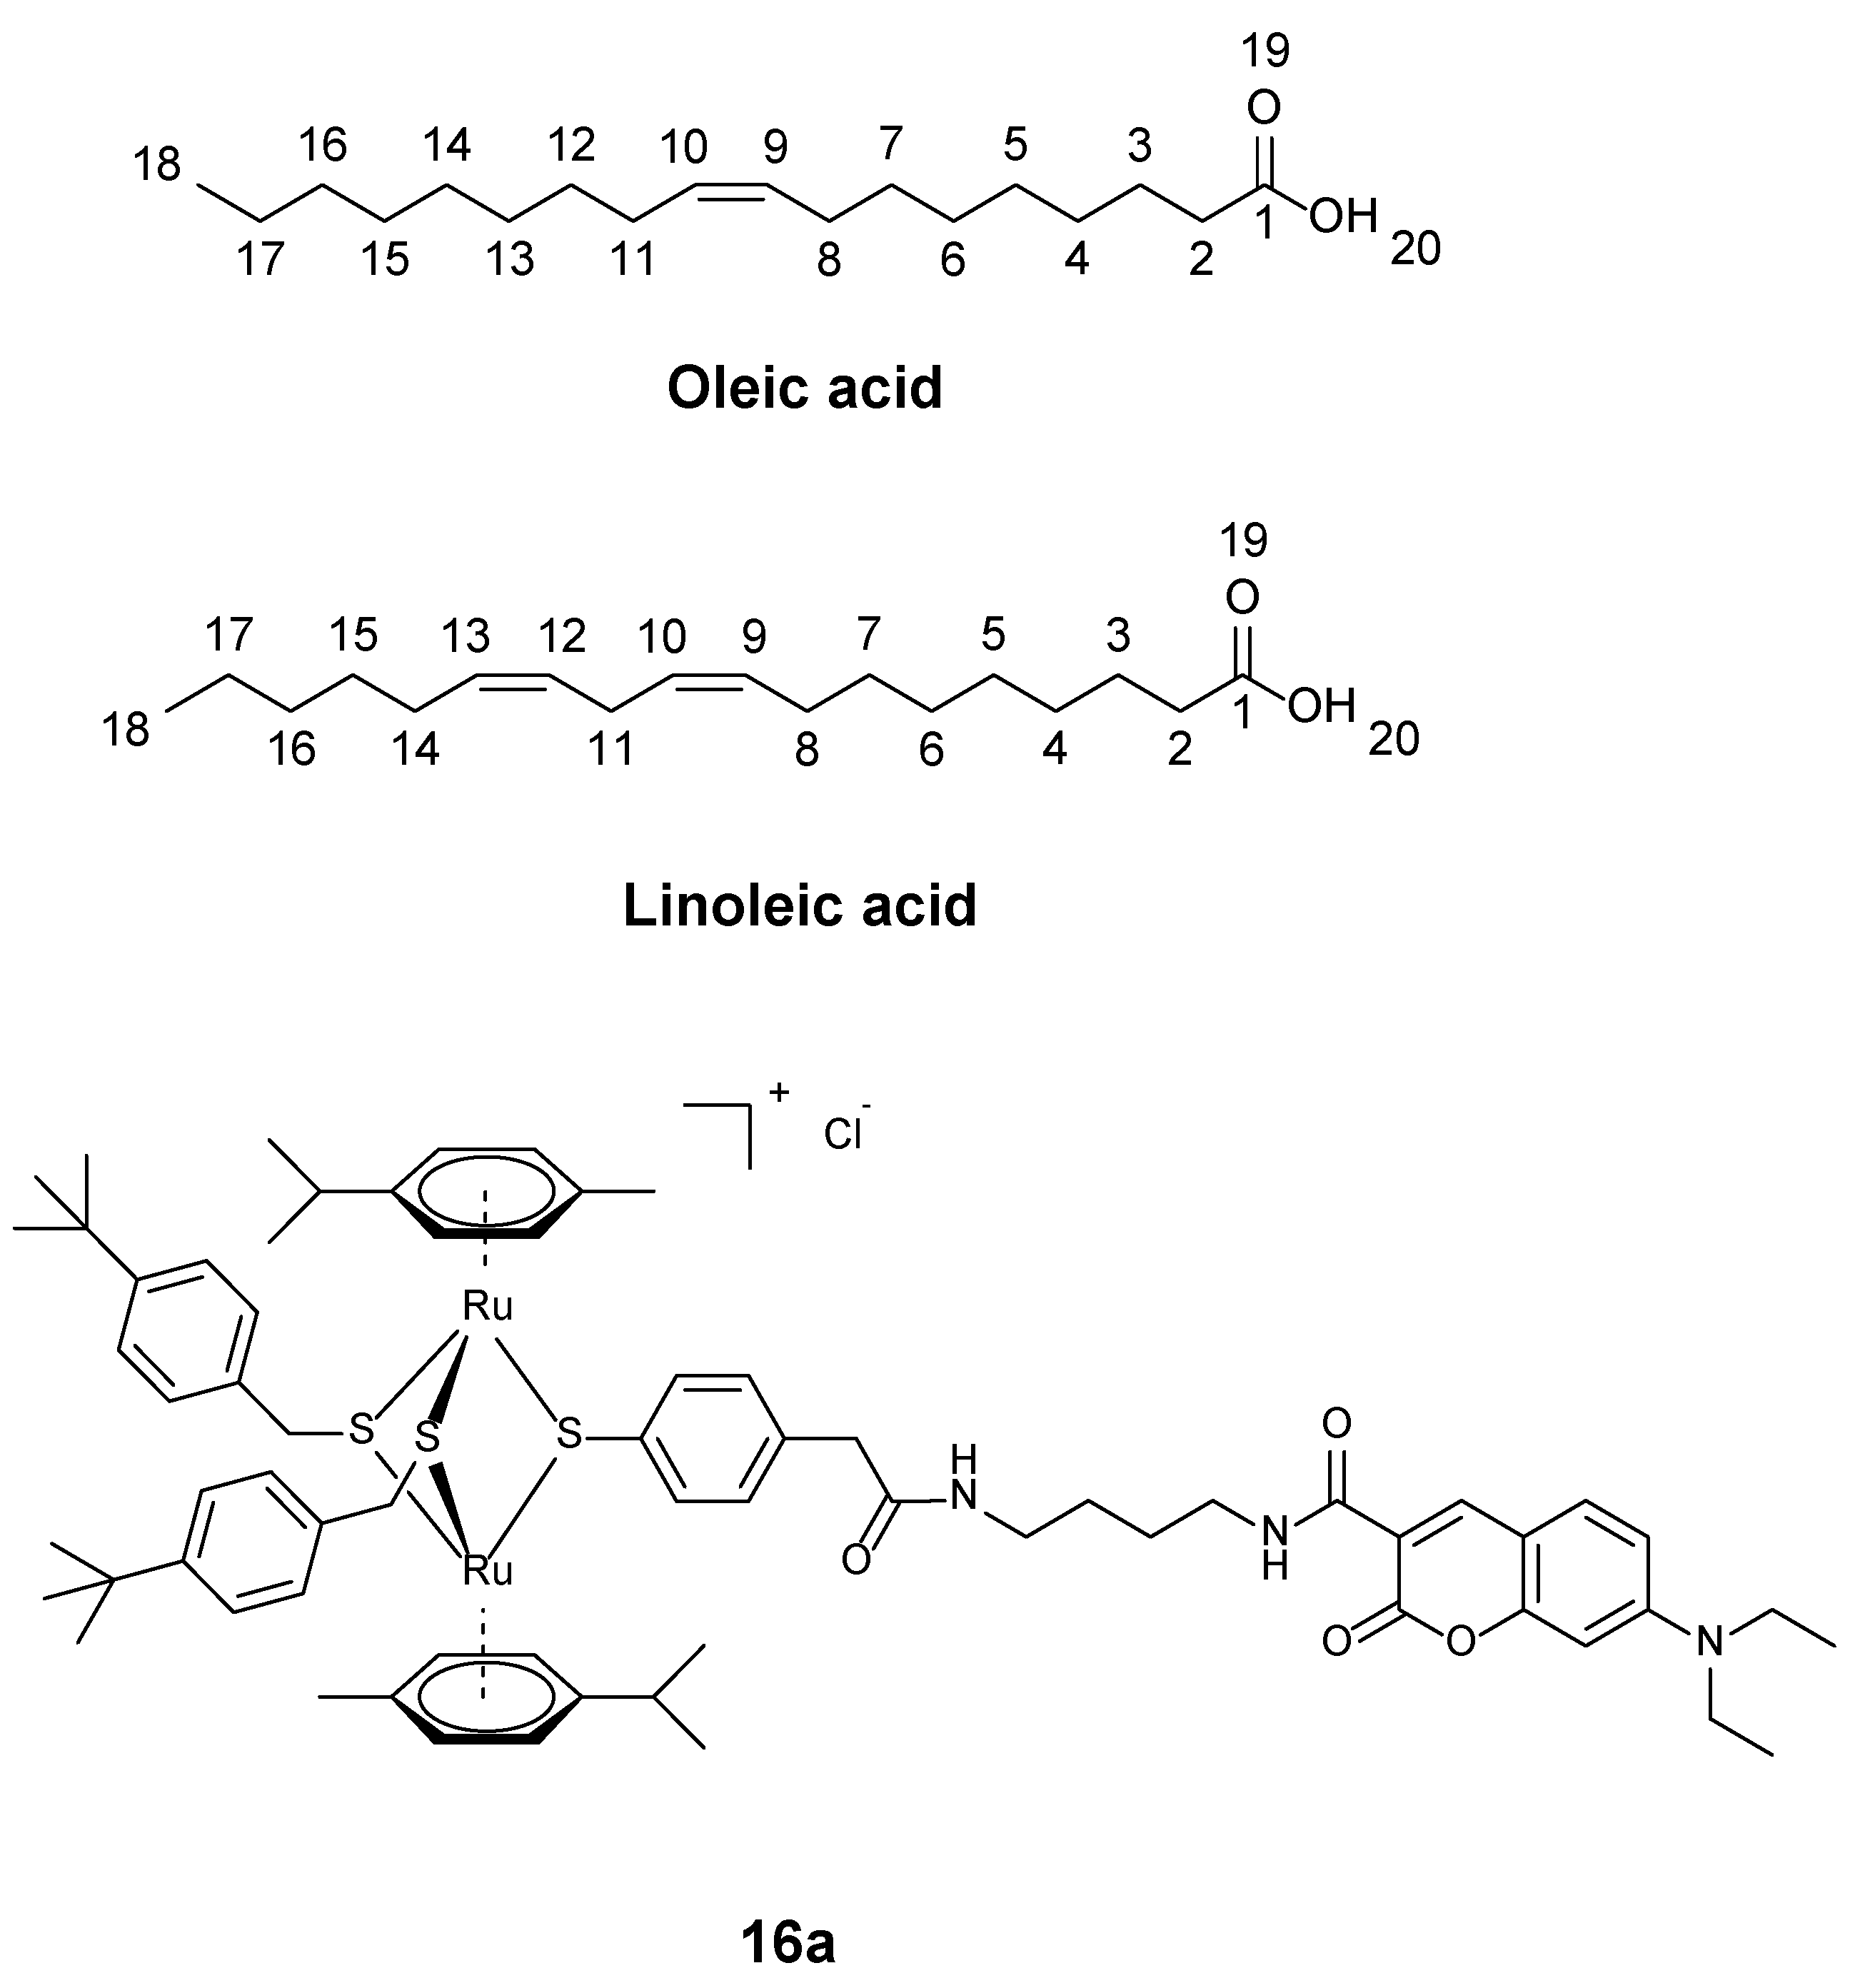
The first situation arises when analyzing samples that produce very compact 13C spectra, including many resonances in a reduced spectral window. This situation can arise in the analysis of mixtures, e.g., fatty acid mixtures, or in the following example, which contains a mixture of one of our coumarin fluorophore-bound diruthenium complexes, compound 16a [36] (Figure 14), with oleic and linoleic acids.
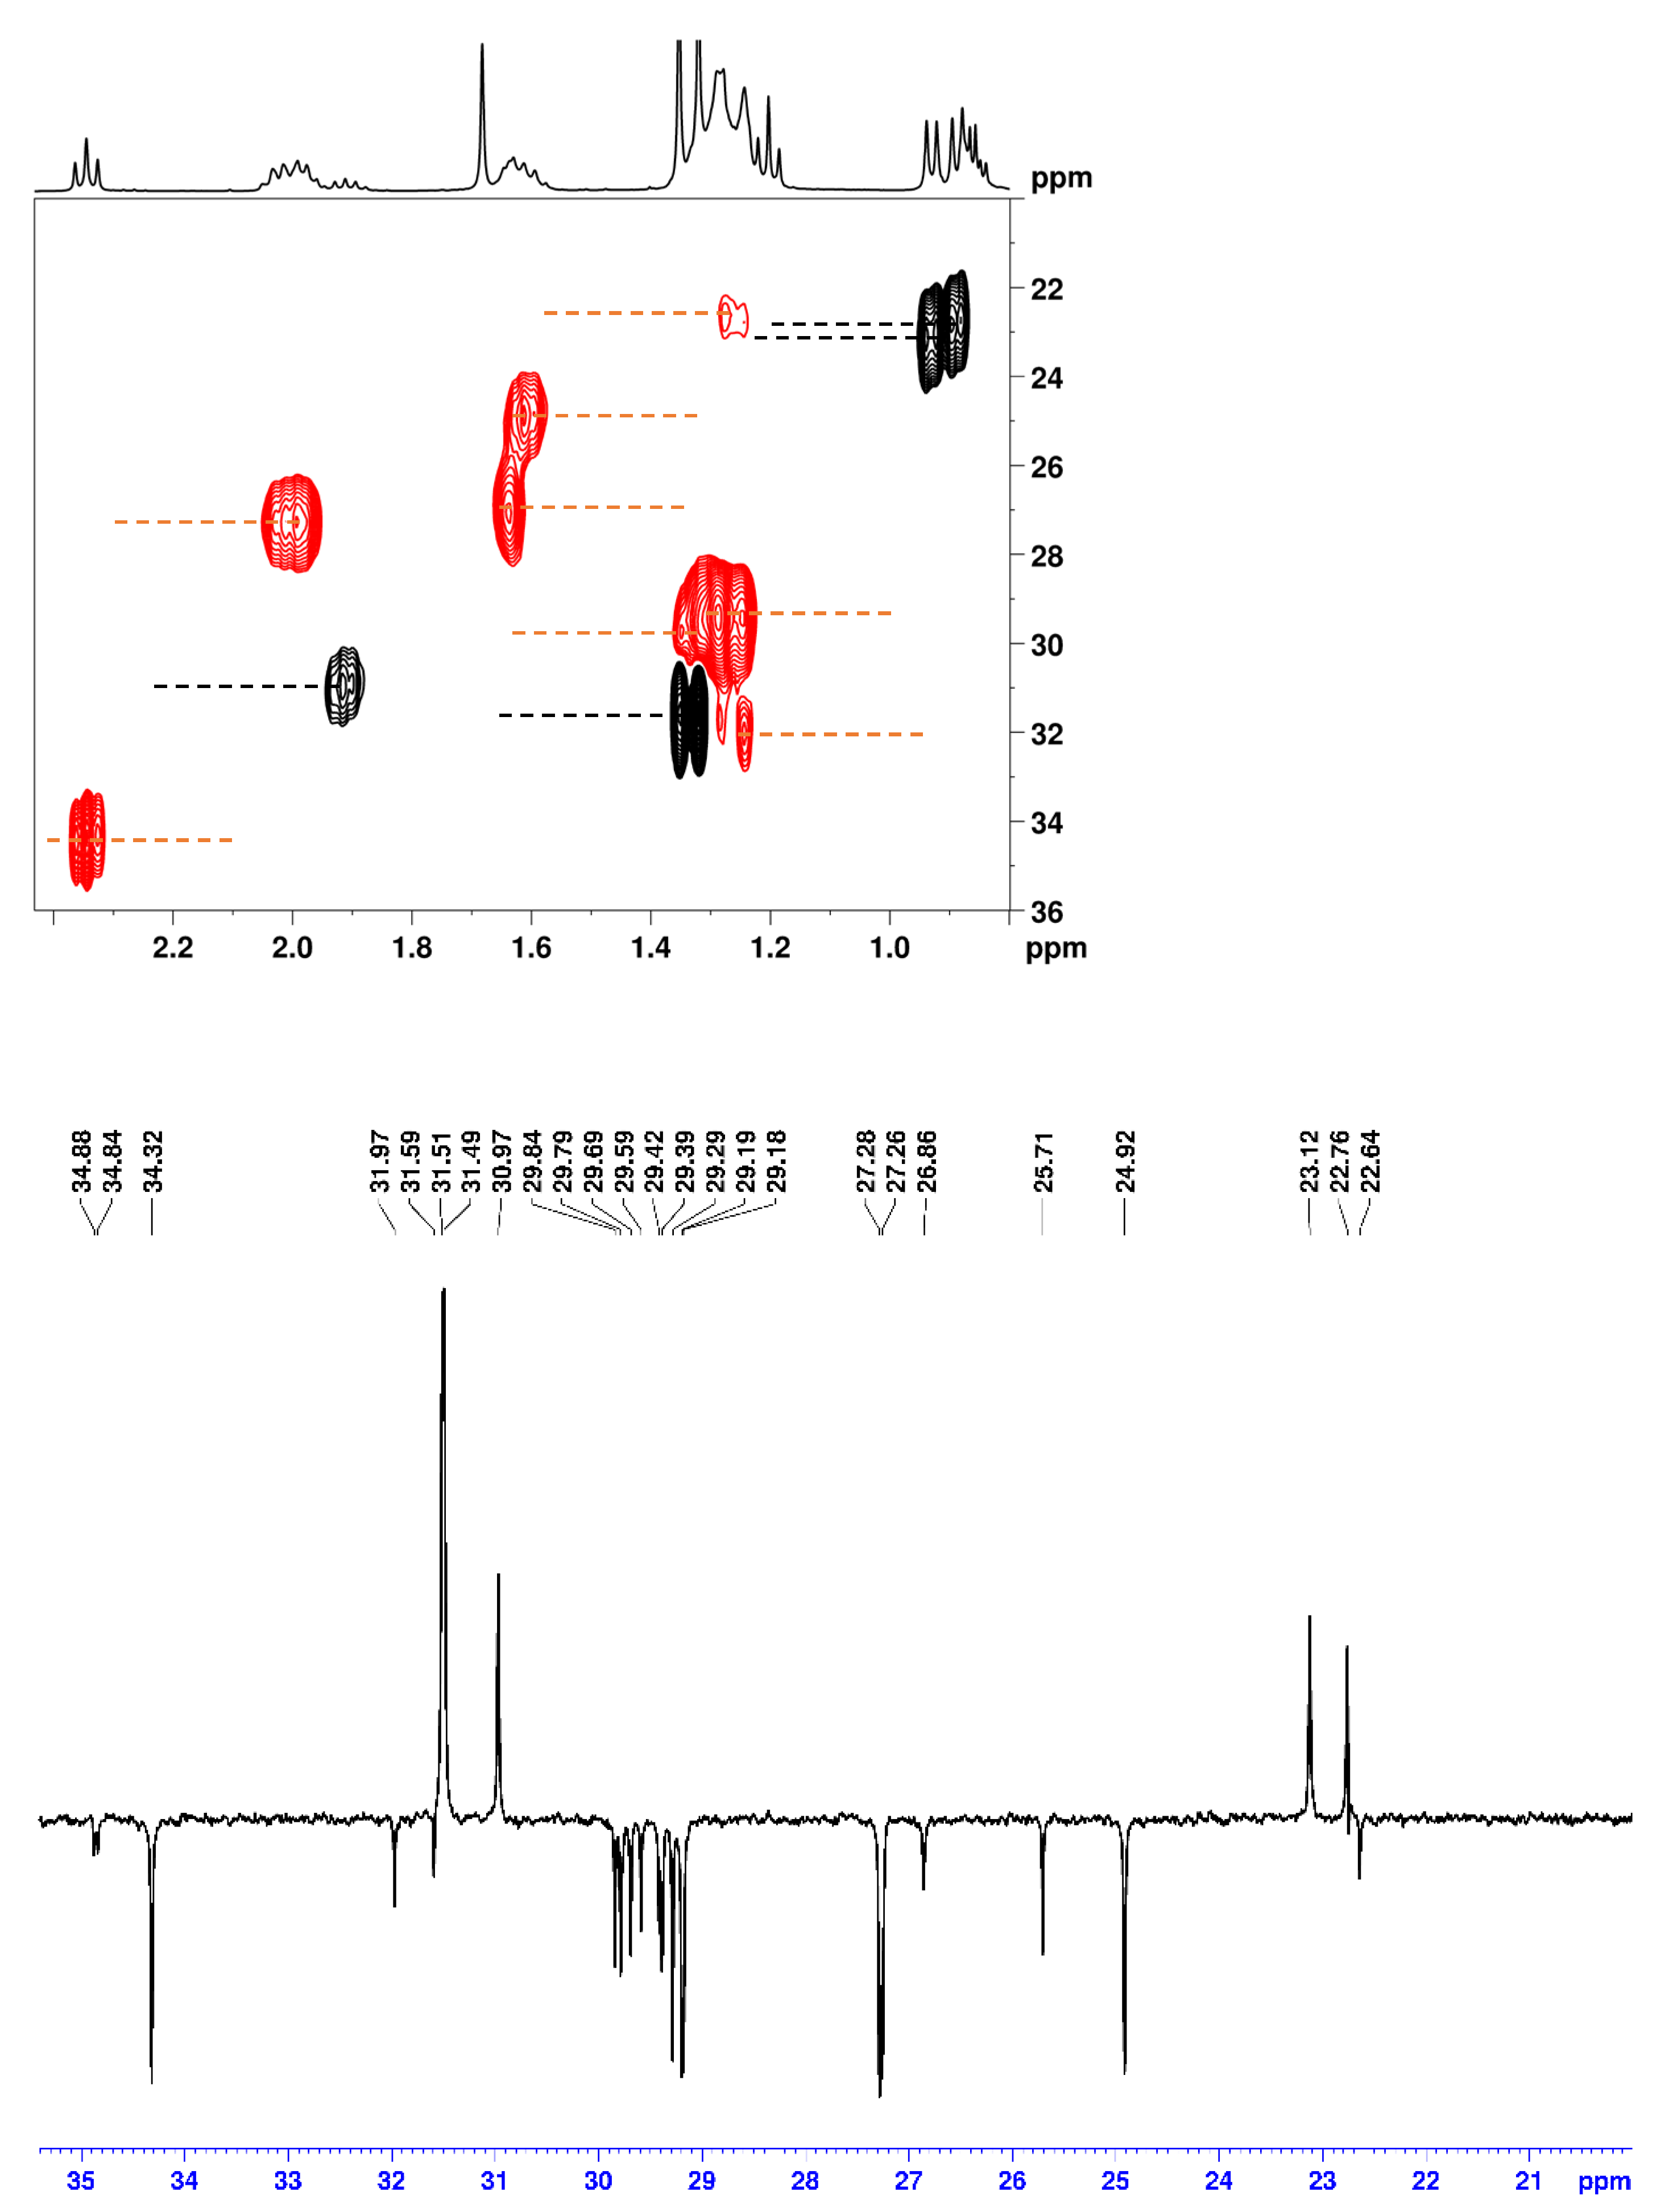
For instance, in the 2D 1H-13C edited HSQC spectrum of this mixture, only 12 carbons can be unambiguously differentiated in the region 20–35 ppm (Figure 15). Actually, there are more than 30 different carbons in this region: the aliphatic CH2 carbons 27 and 1216 (oleic acid), the aliphatic CH2 carbons 27 and 1516 (linoleic acid), the allylic carbons 8 (oleic and linoleic acids), 11 (oleic acid), and 14 (linoleic acid), the bis-allylic carbon 11 (linoleic acid), as well as various CH2 and CH3 groups of the diruthenium compound 16a [36]. Those carbons are easily identified in a 1D 13C APT or BAPT spectrum due to the much better resolution (Figure 15). It is of course possible to unambiguously identify and assign all carbons using 2D HSQC experiments, but this requires a very high resolution in the indirect dimension (F1, 13C), which can take very long measurement times, even if modern techniques such as non-uniform sampling (NUS) are used [37]. An alternative is the recording of band-selective 2D HSQC experiments [38], but these are not always easy to implement and use routinely and in a fully automatic mode.
The same problem occurs with the 2D 1H-13C HMBC spectrum of this mixture; for instance, only ~20 carbons can be unambiguously differentiated in the region 120–180 ppm (Figure S16). There are 27 different carbons in this region, all easily identified in a 1D 13C APT or BAPT spectrum (Figure S16). It is of course possible to unambiguously identify and assign all carbons using the 2D HMBC experiment, but, again, this requires experiments with a very high resolution in the indirect dimension (F1, 13C), i.e., a long measurement time or the recording of band-selective HMBC experiments [39].
Another potentially interesting benefit of 1D BAPT experiments is the ability to record clean Cq-only experiments. Indeed, the resulting Cq-only spectra can be used as F1 projections in HMBC or LR-HSQMBC spectra [40]. As seen in Figure 16, the identification and the correct attribution of the two quaternary carbons of cholesteryl acetate in the aliphatic region (C12 at 42.5 ppm and C15 at 36.7 ppm) are extremely facilitated in the HMBC spectrum when the clean BAPT Cq-only spectrum is set as the F1 projection. The distinction between CH2 and Cq resonances in APT spectra is not always trivial. Thus, when using the APT spectrum as an F1 projection, the identification and correct attribution of C12 and C15 are more difficult and require an almost complete analysis and attribution of all the carbons (Figure 16).

4. Conclusions

Despite the availability of powerful 2D methods such as HSQC and HMBC, 1D 13C NMR experiments are still popular as routine experiments due to their simplicity and usually short measurement time, be it in daily use, e.g., on open-access NMR spectrometers for reaction control, or for the structure verification of smaller molecules. Among them, the APT experiment is remarkably simple and robust, making it ideal for routine spectroscopy in the autosampler mode. However, when measuring CHn spectra, it suffers from a poor tolerance to wide ranges of 1JCH values and, as a secondary application, from the poor suppression of residual CHn signals in Cq-only spectra.
Given these problems and inspired by modified APT pulse sequences, we have developed the BAPT experiment, which provides a remarkably uncomplicated way to obtain both CHn spectra with an excellent tolerance for wide ranges of 1JCH values and Cq-only spectra with the efficient suppression of unwanted CHn signals. This improved performance, which has been proven both theoretically and experimentally, is achieved with three different delays Δ1, Δ2, and Δ3 compared to just one in the basic APT experiment. The three delays can be set for three different one-bond coupling constants and—according to a simple recipe—optimally adapted to the sample under investigation.
The high performance in terms of 1JCH tolerance and CHn suppression achieved with the dual-purpose BAPT experiment is quite comparable to the highest qualities achieved with the appropriately optimized SEMUT-GL or the single-purpose experiments designed exclusively for the measurement of pure CHn- (APTjc) and pure Cq-only spectra (iQCD).
Finally, the recording of APT and Cq-only spectra is most effectively accomplished by adjusting a single constant, which controls the delay (∆2) and phase programs for the two proton 90° pulses. These features increase the attractiveness of the proposed BAPT experiment for the 13C analysis of small molecules, especially in high-throughput analysis laboratories.

5. Materials and Methods

5.1. NMR Measurements

All experiments were recorded on a Bruker AvanceIIIHD 400 MHz NMR spectrometer equipped with a 5 mm BBFO Smartprobe® direct probehead (Bruker, Billerica, MA, USA). The samples used were (i) 30 mg of cholesteryl acetate dissolved in 0.7 mL of CDCl3 (standard test sample provided with Bruker NMR spectrometers), (ii) ~10 mg of 4-methyl-N,N-di(prop-2-yn-1-yl)aniline dissolved in 0.7 mL of CDCl3, and (iii) a ~30 mmol equimolar mixture of oleic acid, linoleic acid, and the diruthenium compound 16a, obtained by dissolving 5.08 mg of oleic acid, 5.05 mg of linoleic acid, and 24.21 mg of 16a in 0.6 mL of CDCl3. The 1H and 13C 90° pulse lengths were 10 μs. Cholesteryl acetate: If not otherwise mentioned, all spectra were acquired with 64 k real data points with a relaxation delay of 2 s, with 128 scans for a total experimental time of approximately 7 min. The 13C spectral widths were 190 ppm, leading to an acquisition time of 1.71 s. Data were processed with 128 k data points using exponential multiplication with a line broadening of 1 Hz. 4-methyl-N,N-di(prop-2-yn-1-yl)aniline: The spectra were acquired with 64 k data points with a relaxation delay of 4 s, with 64 scans for a total experimental time of approximately 6 min. The 13C spectral widths were 190 ppm, leading to an acquisition time of 1.71 s. Data were processed with 128 k data points using exponential multiplication with a line broadening of 1 Hz. Mixture oleic acid/linoleic acid/16a: BAPT spectra were acquired with 64 k real data points with a relaxation delay of 1 s, with 1024 scans for a total experimental time of approximately 21 min. The 13C spectral widths were 270 ppm, leading to an acquisition time of 1.21 s. Data were processed with 128 k data points using exponential multiplication with a line broadening of 1 Hz. The 2D 1H-13C HSQC data were acquired using 2048 data points and 128 t1 increments. Prior to Fourier transformation, zero-filling to 1024 points and linear prediction in F1 (256 points) and weighting with a cosine-squared function were applied in both dimensions. The experimental parameters were as follows: acquisition time: 0.21 s; spectral width of 12 ppm in F2 and of 190 ppm in F1; relaxation delay: 1 s; number of scans: NS = 4; total experimental time: 10 min. The 2D 1H-13C HMBC data were acquired using 4096 data points and 256 t1 increments. Prior to Fourier transformation, zero-filling to 1024 points and linear prediction in F1 (512 points) and weighting with a cosine function were applied in both dimensions. The experimental parameters were as follows: acquisition time: 0.42 s; spectral width of 12 ppm in F2 and of 220 ppm in F1; relaxation delay: 1 s; number of scans: NS = 8; total experimental time: 40 min.

5.2. Numerical Simulations

The numerical simulations were performed with Microsoft Excel®, Office 365 for Windows. Relaxation effects during both pulse sequences were not considered.

5.3. NMR Simulations

The simulations were performed with the BRUKER NMRSIM program for Windows (version 7.0 2022).

Supplementary Materials

The following supporting information can be downloaded at https://www.mdpi.com/article/10.3390/molecules29040809/s1, Figure S1: Pulse sequence of the modified CAPT3 for recording Cq-only spectra, Figure S2: Theoretical intensity of CH groups, APT and APTjc, 130–180 Hz, Figure S3: Theoretical intensity of CH groups, APTjc and BAPT, 125–170 Hz, Figure S4: Theoretical intensity of CH2 groups, APTjc and BAPT, 125–165 Hz, Figure S5: Theoretical intensity of CH3 groups, APTjc and BAPT, 110–135 Hz, Figure S6: Simulated Cq-only spectra with noise, APT, APTjc, and BAPT, 115–165 Hz, Figure S7: Theoretical intensity of CH groups, APTjc and BAPT, 130–250 Hz, Figure S8: Theoretical intensity of CH2 groups, APTjc and BAPT, 120–185 Hz, Figure S9: Theoretical intensity of CH3 groups, APTjc and BAPT, 110–135 Hz, Figure S10: Cq-only. Theoretical intensity of CH groups, APTjc and BAPT, 130–185 Hz, Figure S11: Simulated Cq-only spectra with noise, APT, APTjc, and BAPT, 115–165 Hz, Figure S12: Cq-only. Theoretical intensity of CH groups, APTjc and BAPT, 130–250 Hz, Figure S13: Simulated Cq-only spectra with noise, APT, APTjc, and BAPT, 115–250 Hz, Figure S14: Experimental APT, APTjc, and BAPT spectra of cholesteryl acetate, Figure S15: Experimental BAPT spectra of 4-methyl-N,N-di(prop-2-yn-1-yl)aniline, Figure S16: 2D HMBC and BAPT spectra of the mixture oleic acid, linoleic acid, and diruthenium compound 16a, BAPT pulse program.

Author Contributions

Conceptualization, P.B. and J.F.; Methodology, P.B. and J.F.; Software, P.B. and J.F.; Validation, P.B. and J.F.; Formal Analysis, P.B. and J.F.; Investigation, I.G., D.C., and J.F.; Resources, J.F.; Data Curation, P.B. and J.F.; Writing—Original Draft Preparation, P.B. and J.F.; Writing—Review and Editing, P.B. and J.F.; Visualization, P.B. and J.F.; Supervision, J.F.; Project Administration, J.F.; Funding Acquisition, J.F. All authors have read and agreed to the published version of the manuscript.

Funding

This work was supported by the University of Berne.

Institutional Review Board Statement

Not applicable.

Informed Consent Statement

Not applicable.

Data Availability Statement

Data are contained within the article and Supplementary Materials.

Conflicts of Interest

The authors declare no conflicts of interest.

References

  1. Cocq, C.L.; Lallemand, J.-Y. Precise Carbon-13 n.m.r. Multiplicity Determination. J. Chem. Soc. Chem. Commun. 1981, 4, 150–152. [Google Scholar] [CrossRef]
  2. Patt, S.L.; Shoolery, J.N. Attached Proton Test for Carbon-13 NMR. J. Magn. Reson. 1982, 46, 535–539. [Google Scholar] [CrossRef]
  3. Morris, G.A.; Freeman, R. Enhancement of Nuclear Magnetic Resonance Signals by Polarization Transfer. J. Am. Chem. Soc. 1979, 101, 760–762. [Google Scholar] [CrossRef]
  4. Doddrell, D.M.; Pegg, D.T.; Bendall, M.R. Distortionless Enhancement of NMR Signals by Polarization Transfer. J. Magn. Reson. 1982, 48, 323–327. [Google Scholar] [CrossRef]
  5. Willker, W.; Leibfritz, D.; Kerssebaum, R.; Bermel, W. Gradient Selection in Inverse Heteronuclear Correlation Spectroscopy. Magn. Reson. Chem. 1993, 31, 287–292. [Google Scholar] [CrossRef]
  6. Parella, T.; SanchezFerrando, F.; Virgili, A. Improved Sensitivity in Gradient-Based 1D and 2D Multiplicity-Edited HSQC Experiments. J. Magn. Reson. 1997, 126, 274–277. [Google Scholar] [CrossRef]
  7. Bax, A. Triple Resonance Three-Dimensional Protein NMR: Before It Became a Black Box. J. Magn. Reson. 2011, 213, 442–445. [Google Scholar] [CrossRef]
  8. Levitt, M.H.; Freeman, R. Simplification of NMR Spectra by Masking in a Second Frequency Dimension. J. Magn. Reson. 1980, 39, 533–538. [Google Scholar] [CrossRef]
  9. Bendall, M.R.; Doddrell, D.M.; Pegg, D.T. Editing of Carbon-13 NMR Spectra. 1. A Pulse Sequence for the Generation of Subspectra. J. Am. Chem. Soc. 1981, 103, 4603–4605. [Google Scholar] [CrossRef]
  10. Brown, D.W.; Nakashima, T.T.; Rabenstein, D.L. Simplification and Assignment of Carbon-13 NMR Spectra with Spin-Echo Fourier Transform Techniques. J. Magn. Reson. 1981, 45, 302–314. [Google Scholar] [CrossRef]
  11. Bildsøe, H.; Dønstrup, S.; Jakobsen, H.J.; Sørensen, O.W. Subspectral Editing Using a Multiple Quantum Trap: Analysis of J Cross-Talk. J. Magn. Reson. 1983, 53, 154–162. [Google Scholar] [CrossRef]
  12. Homer, J.; Perry, M.C. New Method for NMR Signal Enhancement by Polarization Transfer, and Attached Nucleus Testing. J. Chem. Soc. Chem. Commun. 1994, 4, 373–374. [Google Scholar] [CrossRef]
  13. Homer, J.; Perry, M.C. Enhancement of the NMR Spectra of Insensitive Nuclei Using PENDANT with Long-Range Coupling Constants. J. Chem. Soc. Perkin Trans. 1995, 2, 533–536. [Google Scholar] [CrossRef]
  14. Burger, R.; Bigler, P. DEPTQ: Distorsionless Enhancement by Polarization Transfer Including the Detection of Quaternary Nuclei. J. Magn. Reson. 1998, 135, 529–534. [Google Scholar] [CrossRef]
  15. Bigler, P.; Kümmerle, R.; Bermel, W. Multiplicity Editing Including Quaternary Carbons: Improved Performance for the 13C-DEPTQ Pulse Sequence. Magn. Reson. Chem. 2007, 45, 469–472. [Google Scholar] [CrossRef]
  16. Bigler, P.; Melendez, C.; Furrer, J. The DEPTQ+ Experiment: Leveling the DEPT Signal Intensities and Clean Spectral Editing for Determining CHn Multiplicities. Molecules 2021, 26, 3490. [Google Scholar] [CrossRef]
  17. Primasova, H.; Bigler, P.; Furrer, J. Chapter One—The DEPT Experiment and Some of Its Useful Variants. In Annual Reports on NMR Spectroscopy; Webb, G.A., Ed.; Academic Press: Cambridge, MA, USA, 2017; Volume 92, pp. 1–82. [Google Scholar]
  18. Madsen, J.C.; Bildsøe, H.; Jakobsen, H.J.; Sørensen, O.W. ESCORT Editing. An Update of the APT Experiment. J. Magn. Reson. 1969 1986, 67, 243–257. [Google Scholar] [CrossRef]
  19. Boyer, R.D.; Johnson, R.; Krishnamurthy, K. Compensation of Refocusing Inefficiency with Synchronized Inversion Sweep (CRISIS) in Multiplicity-Edited HSQC. J. Magn. Reson. 2003, 165, 253–259. [Google Scholar] [CrossRef] [PubMed]
  20. Burrow, T.E.; Burns, D.C.; Krishnamurthy, K.; Reynolds, W.F. CRAPT: An Improved Version of APT with Compensation for Variations in JCH. Magn. Reson. Chem. 2014, 52, 195–201. [Google Scholar] [CrossRef] [PubMed]
  21. Kupče, Ē.; Freeman, R. Compensation for Spin–Spin Coupling Effects during Adiabatic Pulses. J. Magn. Reson. 1997, 127, 36–48. [Google Scholar] [CrossRef]
  22. Zwahlen, C.; Legault, P.; Vincent, S.J.F.; Greenblatt, J.; Konrat, R.; Kay, L.E. Methods for Measurement of Intermolecular NOEs by Multinuclear NMR Spectroscopy:  Application to a Bacteriophage λ N-Peptide/boxB RNA Complex. J. Am. Chem. Soc. 1997, 119, 6711–6721. [Google Scholar] [CrossRef]
  23. Kupce, E. Applications of Adiabatic Pulses in Biomolecular Nuclear Magnetic Resonance. Methods Enzymol. 2001, 338, 82–111. [Google Scholar] [CrossRef]
  24. Torres, A.M.; Nakashima, T.T.; Mcclung, R.E.D. Improved J-Compensated Apt Experiments. J. Magn. Reson. A 1993, 101, 285–294. [Google Scholar] [CrossRef]
  25. Garbow, J.R.; Weitekamp, D.P.; Pines, A. Bilinear Rotation Decoupling of Homonuclear Scalar Interactions. Chem. Phys. Lett. 1982, 93, 504–509. [Google Scholar] [CrossRef]
  26. Uhrin, D.; Liptaj, T.; Kover, K.E. Modified BIRD Pulses and Design of Heteronuclear Pulse Sequences. J. Magn. Reson. A 1993, 101, 41–46. [Google Scholar] [CrossRef]
  27. Sørensen, O.W.; Dønstrup, S.; Bildsøe, H.; Jakobsen, H.J. Suppression of J Cross-Talk in Subspectral Editing. The SEMUT GL Pulse Sequence. J. Magn. Reson. 1983, 55, 347–354. [Google Scholar] [CrossRef]
  28. Furrer, J. Old and New Experiments for Obtaining Quaternary-Carbon-Only NMR Spectra. Appl. Spectrosc. Rev. 2021, 56, 128–142. [Google Scholar] [CrossRef]
  29. Reynolds, W.F.; Burns, D.C. Chapter 1 - Getting the Most Out of HSQC and HMBC Spectra. In Annual Reports on NMR Spectroscopy; Webb, G.A., Ed.; Academic Press: Cambridge, MA, USA, 2012; Volume 76, pp. 1–21. [Google Scholar]
  30. Burns, D.C.; Reynolds, W.F. Optimizing NMR Methods for Structure Elucidation: Characterizing Natural Products and Other Organic Compounds; The Royal Society of Chemistry: London, UK, 2018; ISBN 978-1-78262-539-1. [Google Scholar]
  31. Reynolds, W.F.; Enríquez, R.G. Choosing the Best Pulse Sequences, Acquisition Parameters, Postacquisition Processing Strategies, and Probes for Natural Product Structure Elucidation by NMR Spectroscopy. J. Nat. Prod. 2002, 65, 221–244. [Google Scholar] [CrossRef]
  32. Kogler, H.; Sørensen, O.W.; Bodenhausen, G.; Ernst, R.R. Low-Pass J Filters. Suppression of Neighbor Peaks in Heteronuclear Relayed Correlation Spectra. J. Magn. Reson. 1983, 55, 157–163. [Google Scholar] [CrossRef]
  33. Furrer, J. A Comprehensive Discussion of HMBC Pulse Sequences. 2. Some Useful Variants. Concepts Magn. Reson. Part A 2012, 40A, 146–169. [Google Scholar] [CrossRef]
  34. Smith, M.A.; Hu, H.; Shaka, A.J. Improved Broadband Inversion Performance for NMR in Liquids. J. Magn. Reson. 2001, 151, 269–283. [Google Scholar] [CrossRef]
  35. Skinner, T.E.; Gershenzon, N.I.; Nimbalkar, M.; Bermel, W.; Luy, B.; Glaser, S.J. New Strategies for Designing Robust Universal Rotation Pulses: Application to Broadband Refocusing at Low Power. J. Magn. Reson. 2012, 216, 78–87. [Google Scholar] [CrossRef]
  36. Desiatkina, O.; Paunescu, E.; Mosching, M.; Anghel, N.; Boubaker, G.; Amdouni, Y.; Hemphill, A.; Furrer, J. Coumarin-Tagged Dinuclear Trithiolato-Bridged Ruthenium(II).Arene Complexes: Photophysical Properties and Antiparasitic Activity. Chembiochem 2020, 21, 2818–2835. [Google Scholar] [CrossRef]
  37. Orekhov, V.Y.; Ibraghimov, I.; Billeter, M. Optimizing Resolution in Multidimensional NMR by Three-Way Decomposition. J. Biomol. NMR 2003, 27, 165–173. [Google Scholar] [CrossRef] [PubMed]
  38. Gaillet, C.; Lequart, C.; Debeire, P.; Nuzillard, J.-M. Band-Selective HSQC and HMBC Experiments Using Excitation Sculpting and PFGSE. J. Magn. Reson. 1999, 139, 454–459. [Google Scholar] [CrossRef] [PubMed]
  39. Claridge, T.D.W.; Pérez-Victoria, I. Enhanced 13C Resolution in Semi-Selective HMBC: A Band-Selective, Constant-Time HMBC for Complex Organic Structure Elucidation by NMR. Org. Biomol. Chem. 2003, 1, 3632–3634. [Google Scholar] [CrossRef] [PubMed]
  40. Williamson, R.T.; Buevich, A.V.; Martin, G.E.; Parella, T. LR-HSQMBC: A Sensitive NMR Technique to Probe Very Long-Range Heteronuclear Coupling Pathways. J. Org. Chem. 2014, 79, 3887–3894. [Google Scholar] [CrossRef] [PubMed]
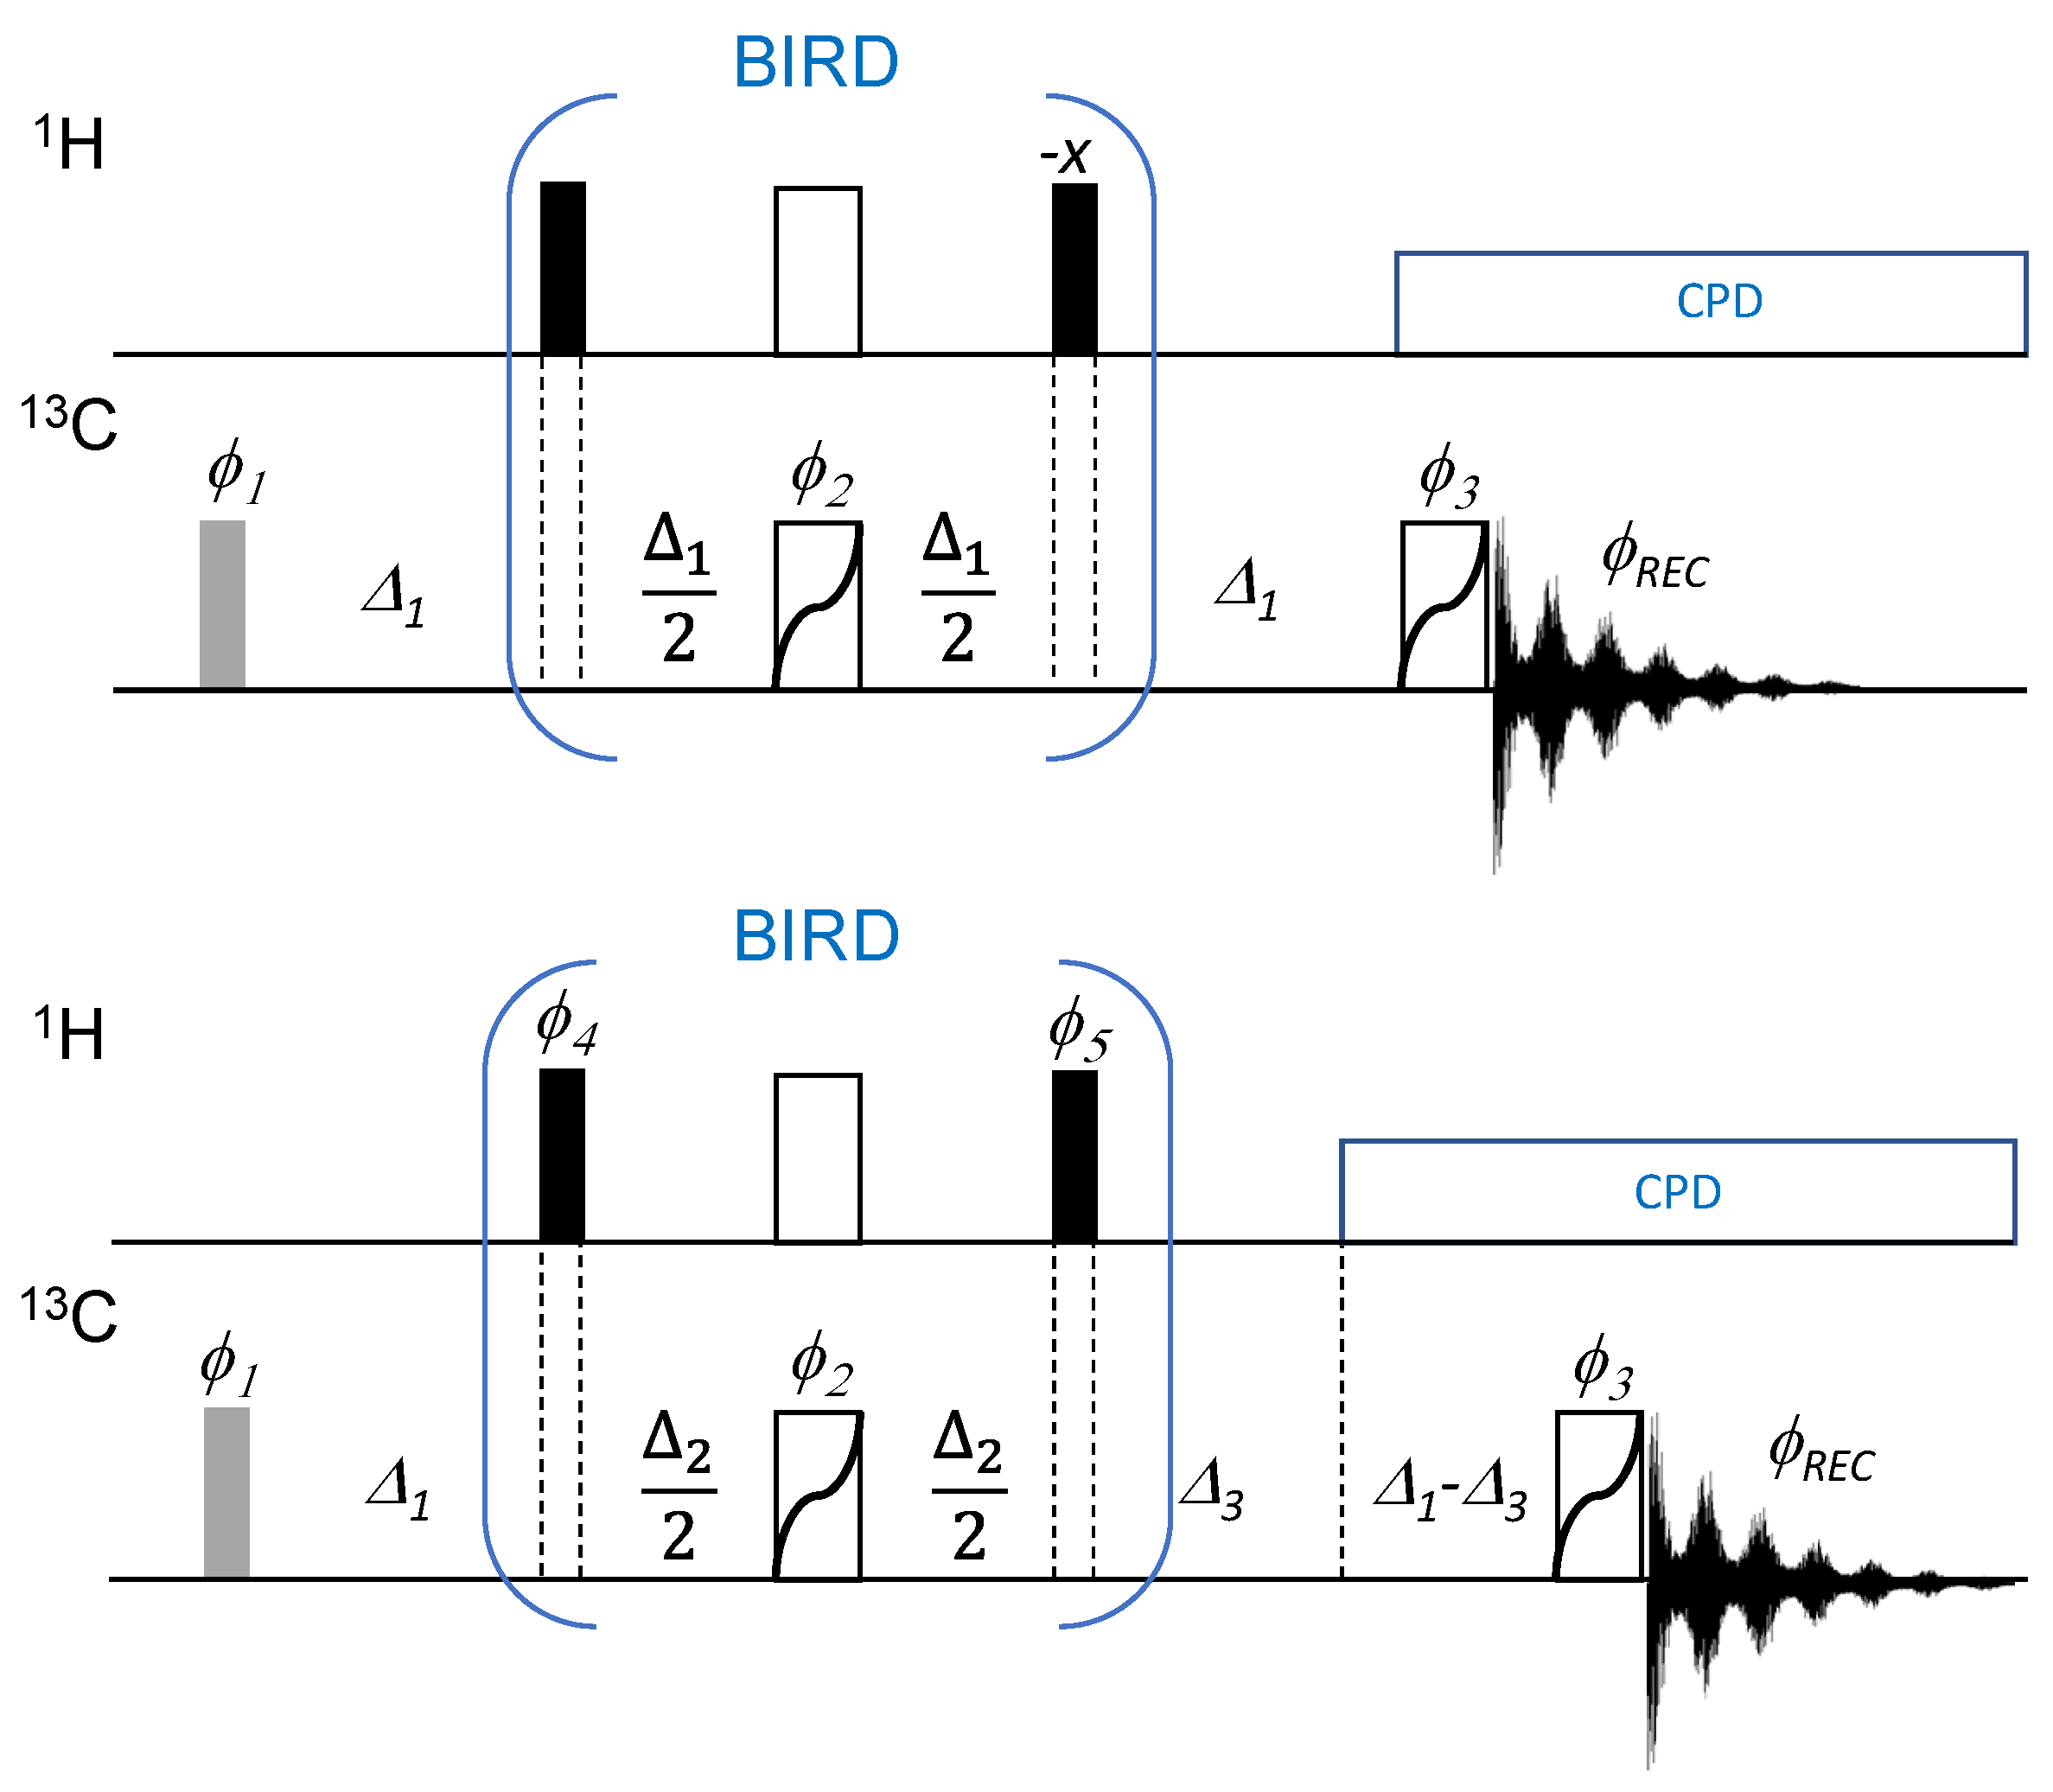
Figure 1. Pulse sequence of the CAPT3 (APTjc in the Bruker pulse program library, top) and the proposed broadband APT (BAPT, bottom) experiments. Thin bars stand for 90° pulses, thick bars for 180° pulses. All 13C 180° pulses can be replaced by broadband refocusing pulses [34,35]. The first 13C pulse may be set shorter than 90° to allow for a faster repetition rate (shown in grey). In the APTjc experiment, Δ1 is set to an average value 1/(21J1CH) [24]. In the BAPT experiment, Δ1, Δ2, and Δ3 are set as described in the text, with Δ2 = 1/J2CH to record APT-like spectra and Δ2 = 1/(2*J2CH) to record Cq-only spectra. The following phase cycling is applied: φ1 = 4(x), 4(−x), 4(y), 4(−y), φ2 = x, y, −x, −y, y, −x, −y, x, −x, −y, x, y, −y, x, y, −x, φ3 = x, y, y, x,( y, x, x, y)2, x, y, y, x, φREC = x, x, −x, −x, y, y, −y, −y. BAPT experiment: φ4 = x (APT-like mode); x, x, −x, −x (Cq-only mode), φ5 = −x (APT mode); y, −y (Cq-only mode). Phases not shown are applied along the x-axis.
Molecules 29 00809 g001
Figure 2. Theoretical intensity of CH, CH2, and CH3 groups as a function of the 1JCH value for the APT pulse sequence, Δ1 = 1/(1J1CH) (--), the APTjc pulse sequence, Δ1 = 1/(2*1J1CH) (--), and the BAPT pulse sequence, Δ1 = 1/(2*1J1CH), Δ2 = 1/1J2CH, and Δ3 = 1/(2*1J3CH) (--). For APT and APTjc, Δ1 was set to match a coupling constant value of 145 Hz. For BAPT, Δ1 and Δ3 were set to match a coupling constant value of 130 Hz, and Δ2 was set to match a coupling constant value of 175 Hz. Three quaternary carbons at 35, 45, and 55 ppm have been added for comparison and are shown with ●. For CH groups, the 1JCH value was varied from 135 to 175 Hz (right to left) in steps of 5 Hz. For CH2 groups, the 1JCH value was varied from 125 to 165 Hz (right to left) in steps of 5 Hz. For CH3 groups, the 1JCH value was varied from 110 to 130 Hz (right to left) in steps of 2.5 Hz. Full relaxation was considered. Simulations were performed using NMRSIM for Windows.
Molecules 29 00809 g002
Figure 3. Theoretical intensity of CH, CH2, and CH3 groups as a function of the 1JCH value for the APT pulse sequence, Δ1 = 1/(1J1CH) (--), the APTjc pulse sequence, Δ1 = 1/(2*1J1CH) (--), and the BAPT pulse sequence, Δ1 = 1/(2*1J1CH), Δ2 = 1/1J2CH, and Δ3 = 1/(2*1J3CH) (--). For APT and APTjc, Δ1 was set to match a coupling constant value of 145 Hz. For BAPT, Δ1 and Δ3 were set to match a coupling constant value of 145 Hz, and Δ2 was set to match a coupling constant value of 250 Hz. Three quaternary carbons at 35, 45, and 55 ppm have been added for comparison and are shown with ●. For CH groups, the 1JCH value was varied from 135 to 250 Hz (right to left) in steps of 15 Hz. For CH2 groups, the 1JCH value was varied from 125 to 165 Hz (right to left) in steps of 5 Hz. For CH3 groups, the 1JCH value was varied from 110 to 130 Hz (right to left) in steps of 2.5 Hz. Full relaxation was considered. Simulations were performed using NMRSIM for Windows.
Molecules 29 00809 g003
Figure 4. Theoretical residual intensity of CH, CH2, and CH3 groups in a Cq-only spectrum as a function of the 1JCH value for the APT pulse sequence, Δ1 = 1/(2*1J1CH) (--), the modified APTjc pulse sequence, Δ1 = 1/(2*1J1CH) (--), and the BAPT pulse sequence, Δ1 = 1/(2*1J1CH), Δ2 = 1/(2*1J2CH), and Δ3 = 1/(2*1J3CH) (--). The spin system and all other parameters were identical to those used for Figure 2.
Molecules 29 00809 g004
Figure 5. Theoretical residual intensity of CH, CH2, and CH3 groups in a Cq-only spectrum as a function of the 1JCH value for the APT pulse sequence (--), the APTjc pulse sequence, Δ1 = 1/(2*1J1CH) (--), and the BAPT pulse sequence, Δ1 = 1/(2*1J1CH), Δ2 = 1/(2*1J2CH), and Δ3 = 1/(2*1J3CH) (--). The spin system and all other parameters were identical to those used for Figure 3.
Molecules 29 00809 g005
Figure 6. APT (A), APTjc (B), and BAPT (C) spectra of cholesteryl acetate. For APT and APTjc, the delay, Δ, was adjusted to a coupling constant of 145 Hz, while for BAPT, Δ1 and Δ3 were adjusted to a coupling constant of 130 Hz, and Δ2 was adjusted to a coupling constant of 170 Hz.
Molecules 29 00809 g006
Figure 7. Molecular structure of cholesteryl acetate and atom numbering used in the text.
Molecules 29 00809 g007
Figure 8. Resonances of C12 (δ = 12 ppm, 1JCH = 122 Hz) of cholesteryl acetate and of TMS (δ = 0 ppm, 1JCH = 117 Hz) dissolved in 0.7 mL of CDCl3 recorded with the APT (black), APTjc (red), and BAPT (green) experiments.
Molecules 29 00809 g008
Figure 9. Cq-only spectra of cholesteryl acetate obtained using the APT (A), modified APTjc (B), and BAPT (C) pulse sequences. For APT and APTjc, the delay Δ was adjusted to a coupling constant of 145 Hz, while for BAPT, Δ1 and Δ3 were adjusted to a coupling constant of 130 Hz, and Δ2 was adjusted to a coupling constant of 170 Hz.
Molecules 29 00809 g009
Figure 10. Molecular structure of 4-methyl-N,N-(prop-2-yn-1-yl)aniline and atom numbering used in the text.
Molecules 29 00809 g010
Figure 11. APT (A), APTjc (B), and BAPT (C) spectra of ~10 mg of 4-methyl-N,N-di(prop-2-yn-1-yl)aniline dissolved in 0.7 mL of CDCl3. For APT and APTjc, the delay Δ1 was adjusted for a coupling constant 1J1CH of 145 Hz. For BAPT, the delays Δ1 and Δ3 were adjusted for a coupling constant 1J1,3CH of 145 Hz, and the delay Δ2 was adjusted for a coupling constant 1J2CH of 240 Hz. The relaxation delay was 2 s. All other parameters were identical to those described in the Materials and Methods Section.
Molecules 29 00809 g011
Figure 12. Resonances of C1, C3, C5, C6, and C8 of ~10 mg of 4-methyl-N,N-di(prop-2-yn-1-yl)aniline dissolved in 0.7 mL of CDCl3 recorded with the APT (green), APTjc (red), and BAPT (black) experiments.
Molecules 29 00809 g012
Figure 13. APT (A), APTjc (B), BAPT (C), and SEMUT-GL (D) Cq-only spectra of ~10 mg of 4-methyl-N,N-di(prop-2-yn-1-yl)aniline dissolved in 0.7 mL of CDCl3. For the APT and the modified APTjc experiments, the delay Δ1 was adjusted for a coupling constant 1J1CH of 145 Hz. For BAPT, the delays Δ1 and Δ3 were adjusted for a coupling constant 1J1,3CH of 145 Hz, and the delay Δ2 was adjusted for a coupling constant 1J2CH of 240 Hz. For SEMUT-GL, the delay Δ1 was adjusted for a coupling constant 1J1,3CH of 133 Hz, the delay Δ2 was adjusted for a coupling constant 1J2CH of 235 Hz, and the delay Δ3 was adjusted for a coupling constant 1J1,3CH of 191 Hz [27,32]. The tip angle of the first 13C pulse was 30°, and the relaxation delay was 4 s. All other parameters were identical to those described in the Materials and Methods Section.
Molecules 29 00809 g013
Figure 14. Molecular structures of oleic acid, linoleic acid, and the diruthenium–coumarin conjugate 16a [36], and atom numbering used in the text.
Molecules 29 00809 g014
Figure 15. (Top): part of the 2D 1H-13C edited HSQC spectrum of an equimolar (30 mmol) mixture of oleic acid, linoleic acid and compound 16a dissolved in CDCl3. CH and CH3 signals are phased up (black peaks) and CH2 signals are phased down (red peaks). (Bottom): BAPT spectrum of the same mixture, CH and CH3 signals are phased up and CH2 signals are phased down. The experimental parameters of the BAPT experiment were identical to those used for Figure 6.
Molecules 29 00809 g015
Figure 16. Part of the 7 Hz adjusted HMBC spectrum of cholesteryl acetate. Top: BAPT CHn, Cq spectrum set as external F1 projection. Bottom: BAPT Cq-only spectrum set as external F1 projection. The experimental parameters of the BAPT experiments were identical to those used for Figure 9.
Molecules 29 00809 g016
Table 1. Observable in-phase 13C coherences Cy for Cq, CH, CH2, and CH3 spin systems immediately before acquisition as obtained with the APT, APTjc [24], and BAPT sequences, the experimental parameters of which were set to obtain APT-like spectra. Relaxation effects were not considered. Terms in bold occurred when the delays were not optimally adjusted, Δi ≠ 1/(2*JCH).
APTΔ1 = 1/1J1CH
Cq−Cy
CHCy cos(πJΔ1)
CH2Cy cos2JΔ1)
CH3Cy cos3JΔ1)
APTjcΔ1 = 1/(2*1J1CH)
Cq−Cy
CHTerm 1: Cysin2JΔ1)
Term 2: −Cycos3JΔ1)
CH2Term 1: −Cysin4JΔ1)
Term 2: 2Cysin2JΔ1)cos3JΔ1)
Term 3: −Cycos6JΔ1)
CH3Term 1: Cysin6JΔ1)
Term 2: −3Cysin4JΔ1)cos3JΔ1)
Term 3: 3Cysin2JΔ1)cos6JΔ1)
Term 4: −Cycos9JΔ1)
BAPTΔ1 = 1/(2*1J1CH),Δ2 = 1/(1J2CH),Δ3 = 1/(2*1J3CH)
Cq−Cy
CHTerm 1: Cysin(πJΔ3)sin(πJΔ1)
Term 2: −Cycos(πJΔ3)cos(πJΔ2)cos(πJΔ1)
CH2Term 1: −Cysin2JΔ3)sin2JΔ1)
Term 2: 0.5Cysin(2πJΔ3)cos(πJΔ2)sin(2πJΔ1)
Term 3: −Cycos2JΔ3)cos2JΔ2)cos2JΔ1)
CH3Term 1: Cysin3JΔ3)sin3JΔ1)
Term 2: −3Cysin2JΔ3)cos(πJΔ3)cos(πJΔ2)cos(πJΔ1)sin2JΔ1)
Term 3: 3Cysin(πJΔ3)cos2JΔ3)cos2JΔ2)cos2JΔ1)sin(πJΔ1)
Term 4: −Cycos3JΔ3)cos3JΔ2)cos3JΔ1)
Table 2. Observable in-phase 13C coherences for CH, CH2, and CH3 spin systems immediately before acquisition with the APT, APTjc, and BAPT sequences set for recording Cq-only spectra.
APTΔ1 = 1/(2*1J1CH)
Cq−Cy
CHCy cos(πJΔ1)
CH2Cy cos2JΔ1)
CH3Cy cos3JΔ1)
APTjc *Δ1 = 1/(2*1J1CH)
Cq−Cy
CH−Cycos3JΔ1)
CH2−Cycos6JΔ1)
CH3−Cycos9JΔ1)
BAPT Δ 1 = 1/(2*1J1CH), Δ2 = 1/(1J2CH), Δ3 = 1/(2*1J3CH)
Cq−Cy
CH−Cycos(πJΔ3)cos(πJΔ2)cos(πJΔ1)
CH2−Cycos2JΔ3)cos2JΔ2)cos2JΔ1)
CH3−Cycos3JΔ3)cos3JΔ2)cos3JΔ1)
* The APTjc pulse sequence, which is intended exclusively for measuring APT spectra [24], can also be used for measuring Cq-only (Figure S1).
Disclaimer/Publisher’s Note: The statements, opinions and data contained in all publications are solely those of the individual author(s) and contributor(s) and not of MDPI and/or the editor(s). MDPI and/or the editor(s) disclaim responsibility for any injury to people or property resulting from any ideas, methods, instructions or products referred to in the content.