
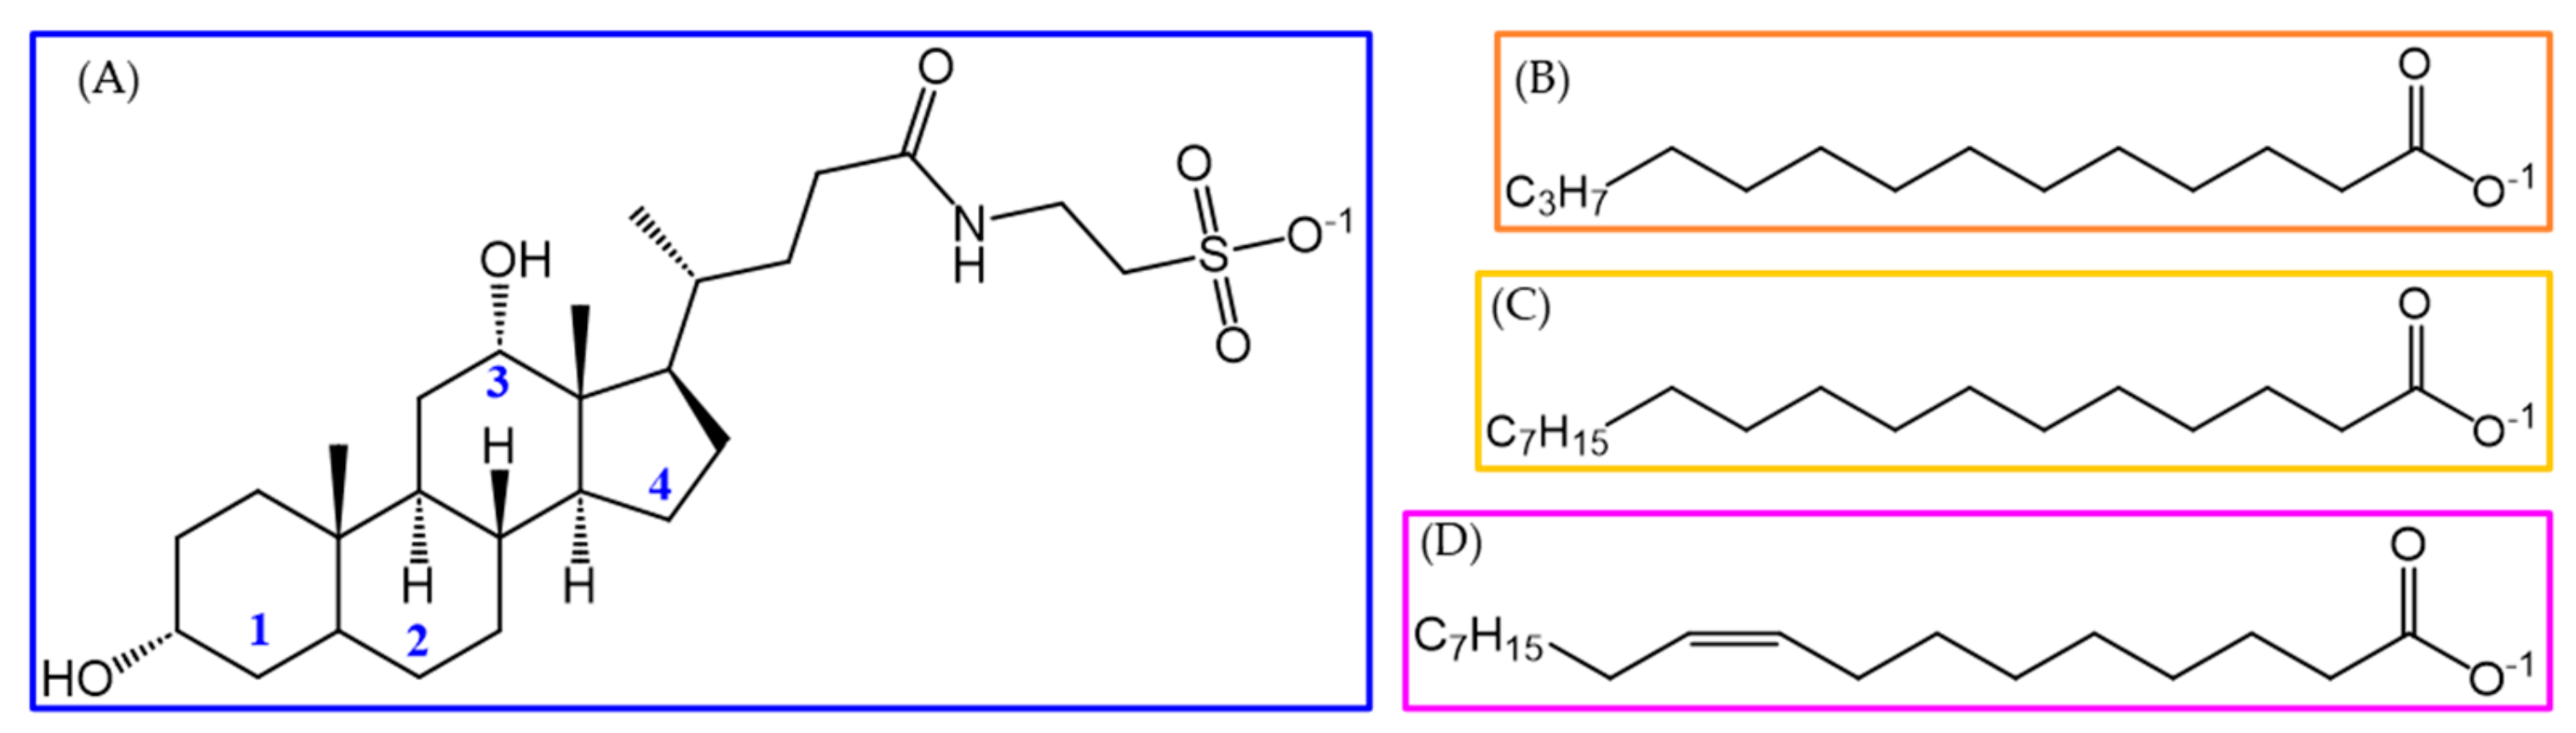
Taurodeoxycholate Aggregation Explored by Molecular Dynamics: Primary-To-Secondary Micelle Transition and Formation of Mixed Micelles with Fatty Acids


Abstract

1. Introduction
2. Results and Discussion
2.1. Pure TDC Micelles
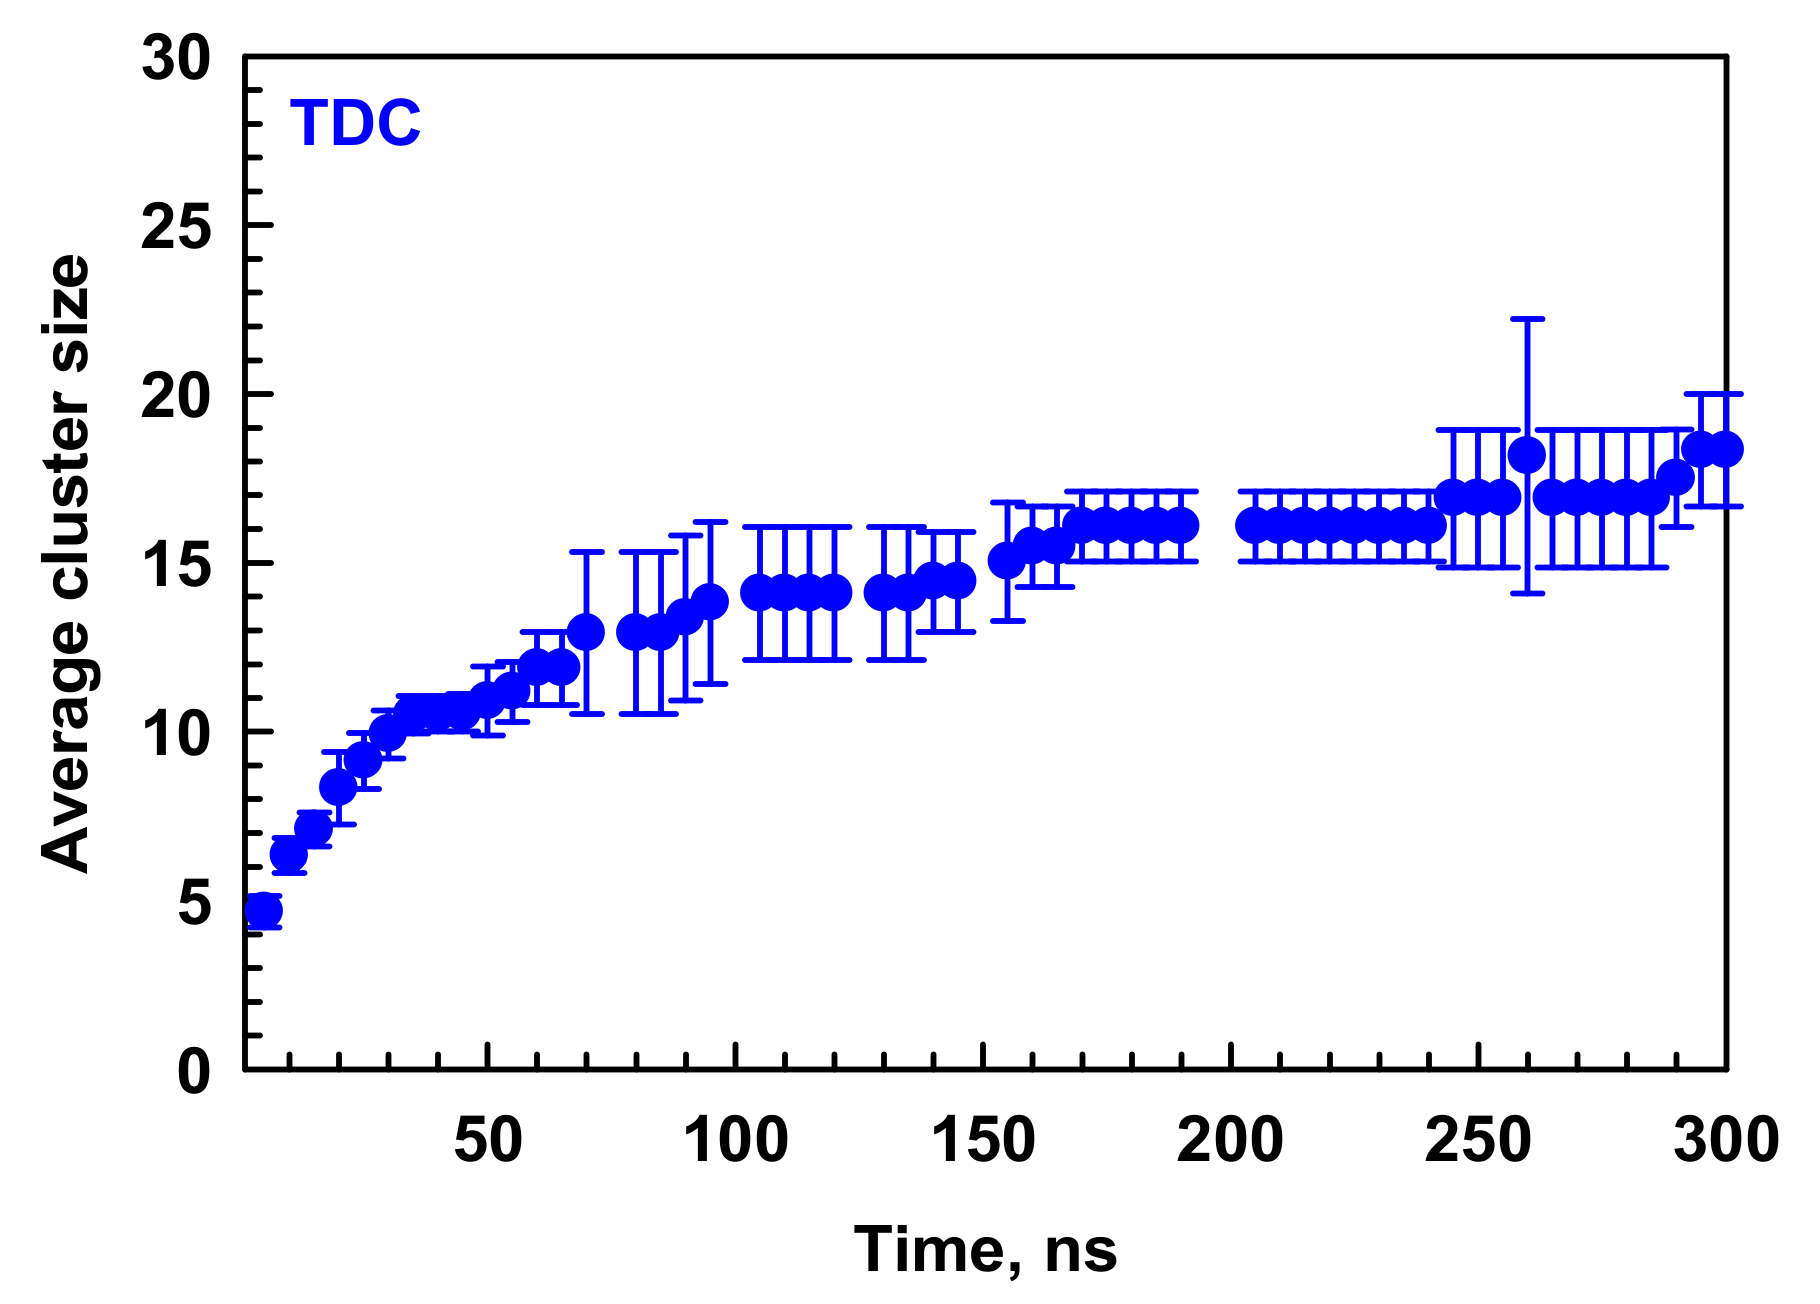
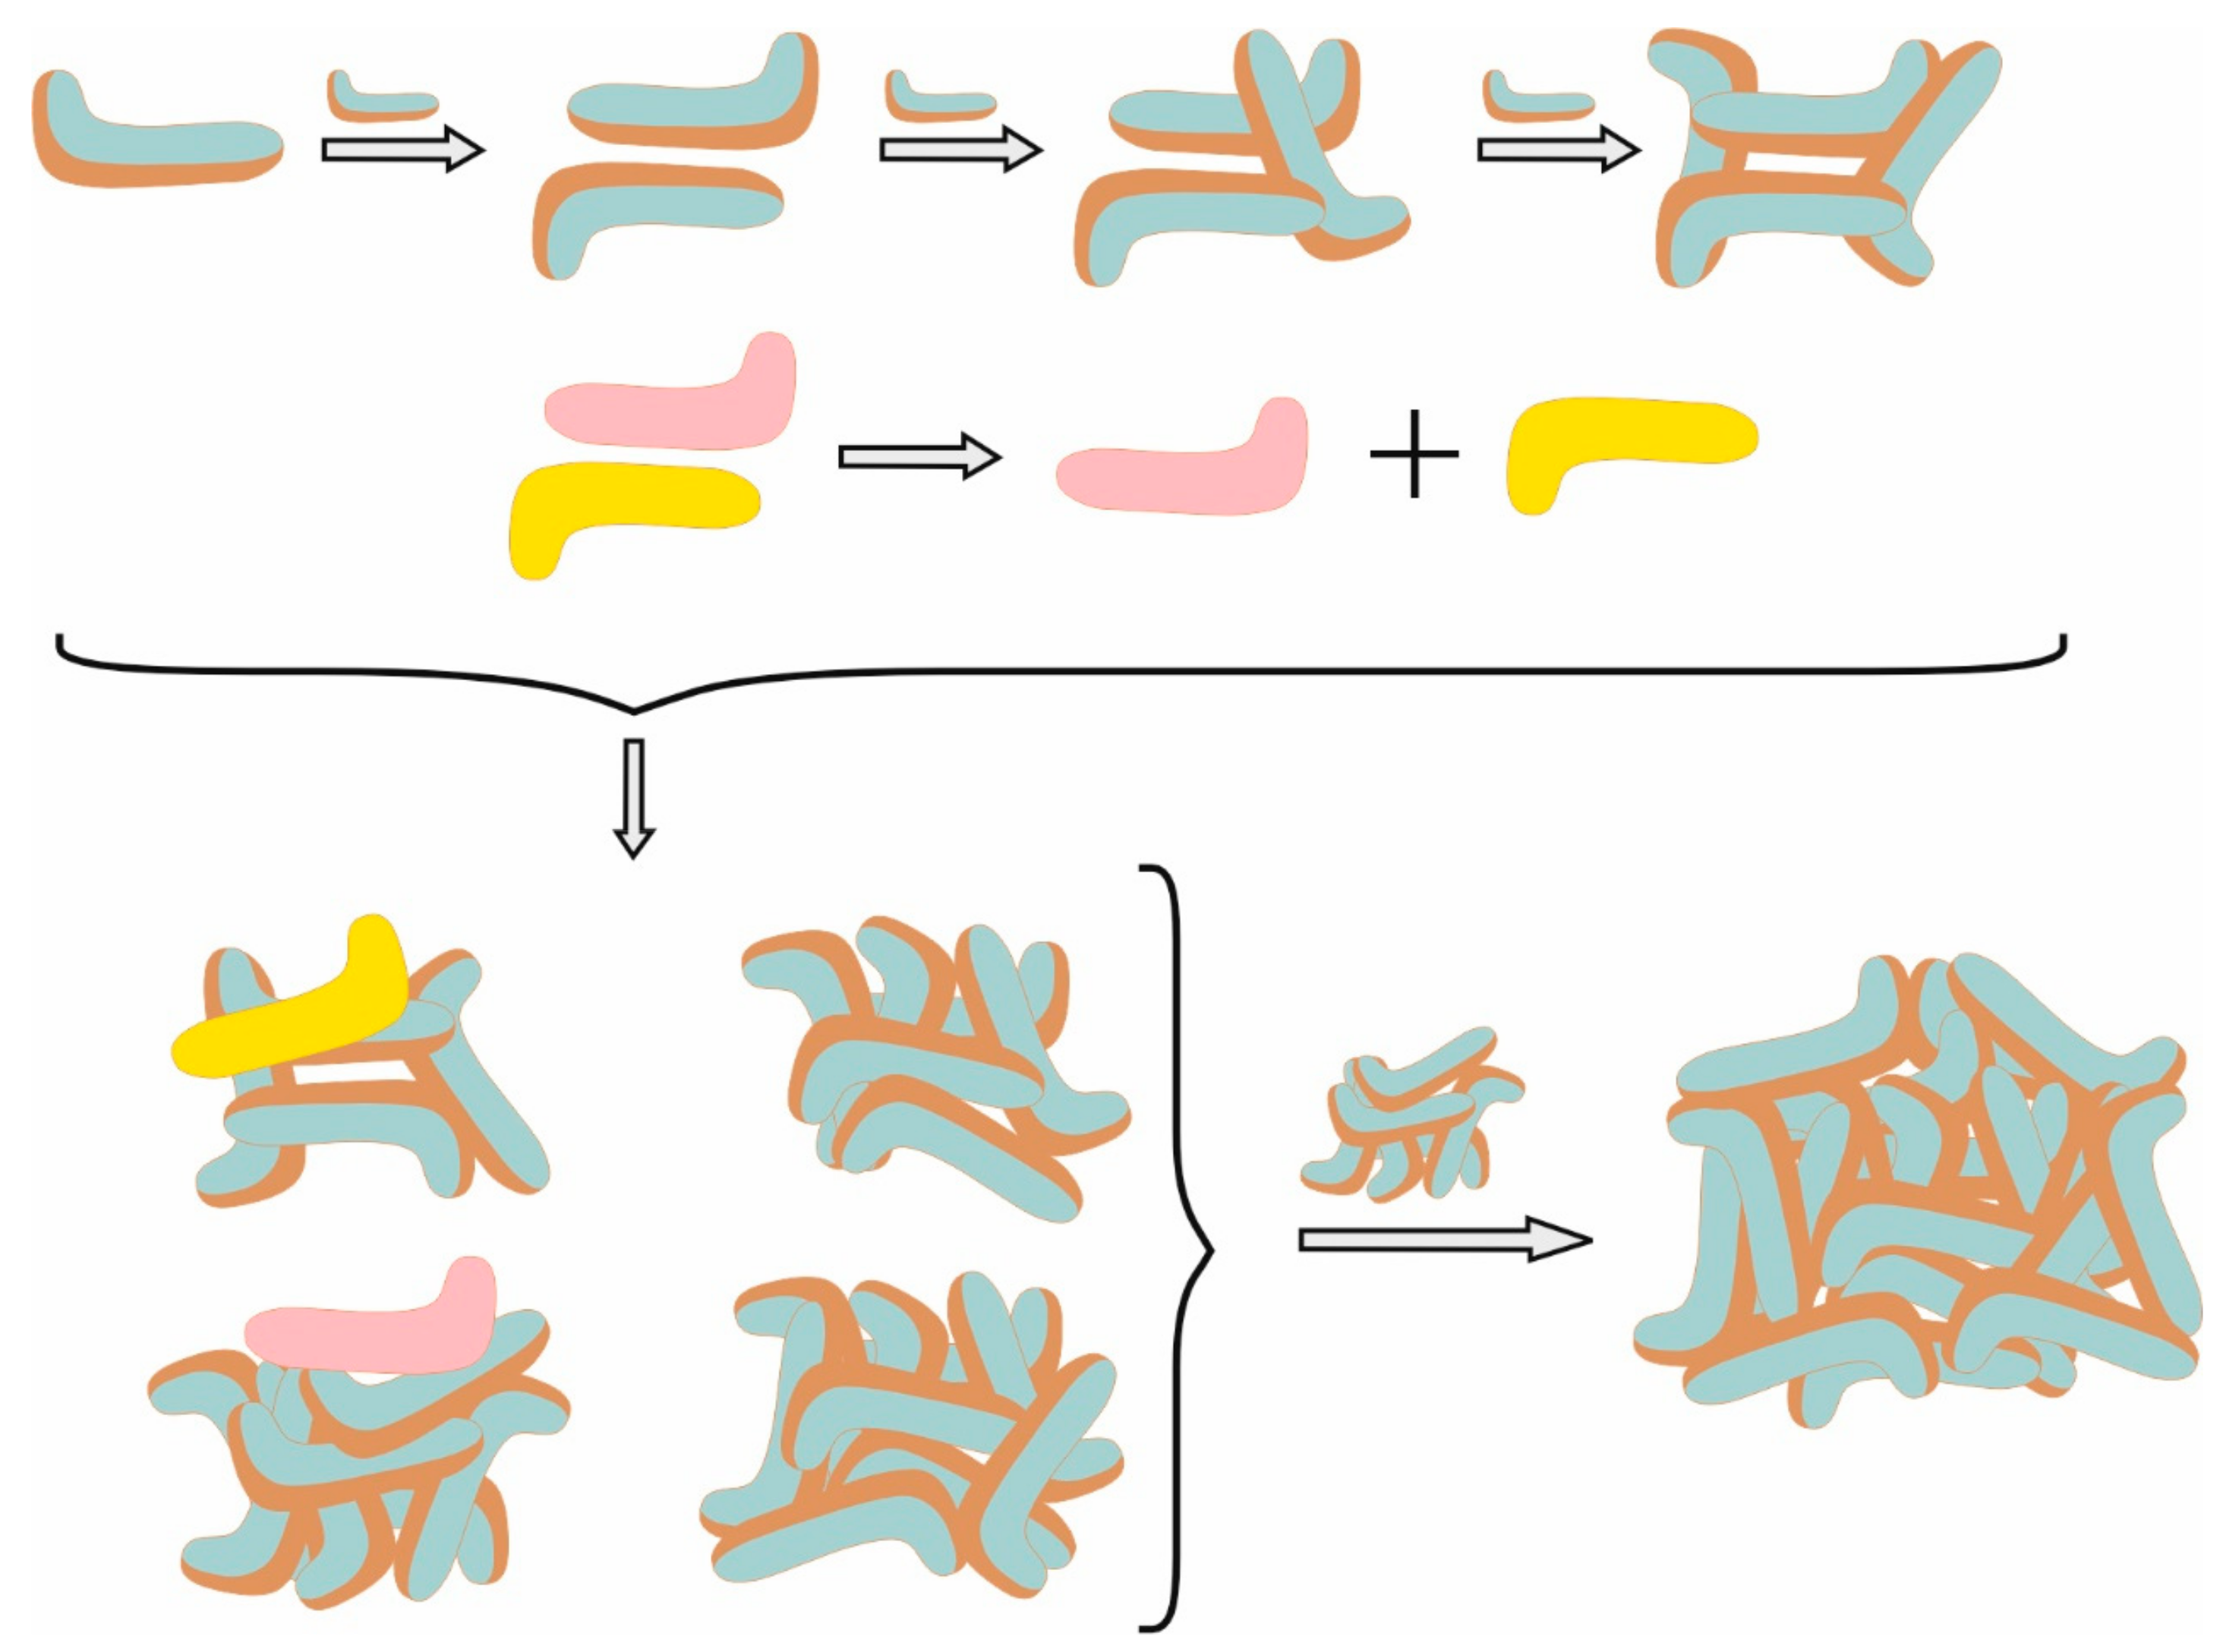
2.1.1. Kinetics and Mechanism of Formation
2.1.2. Morphology of the Micelles
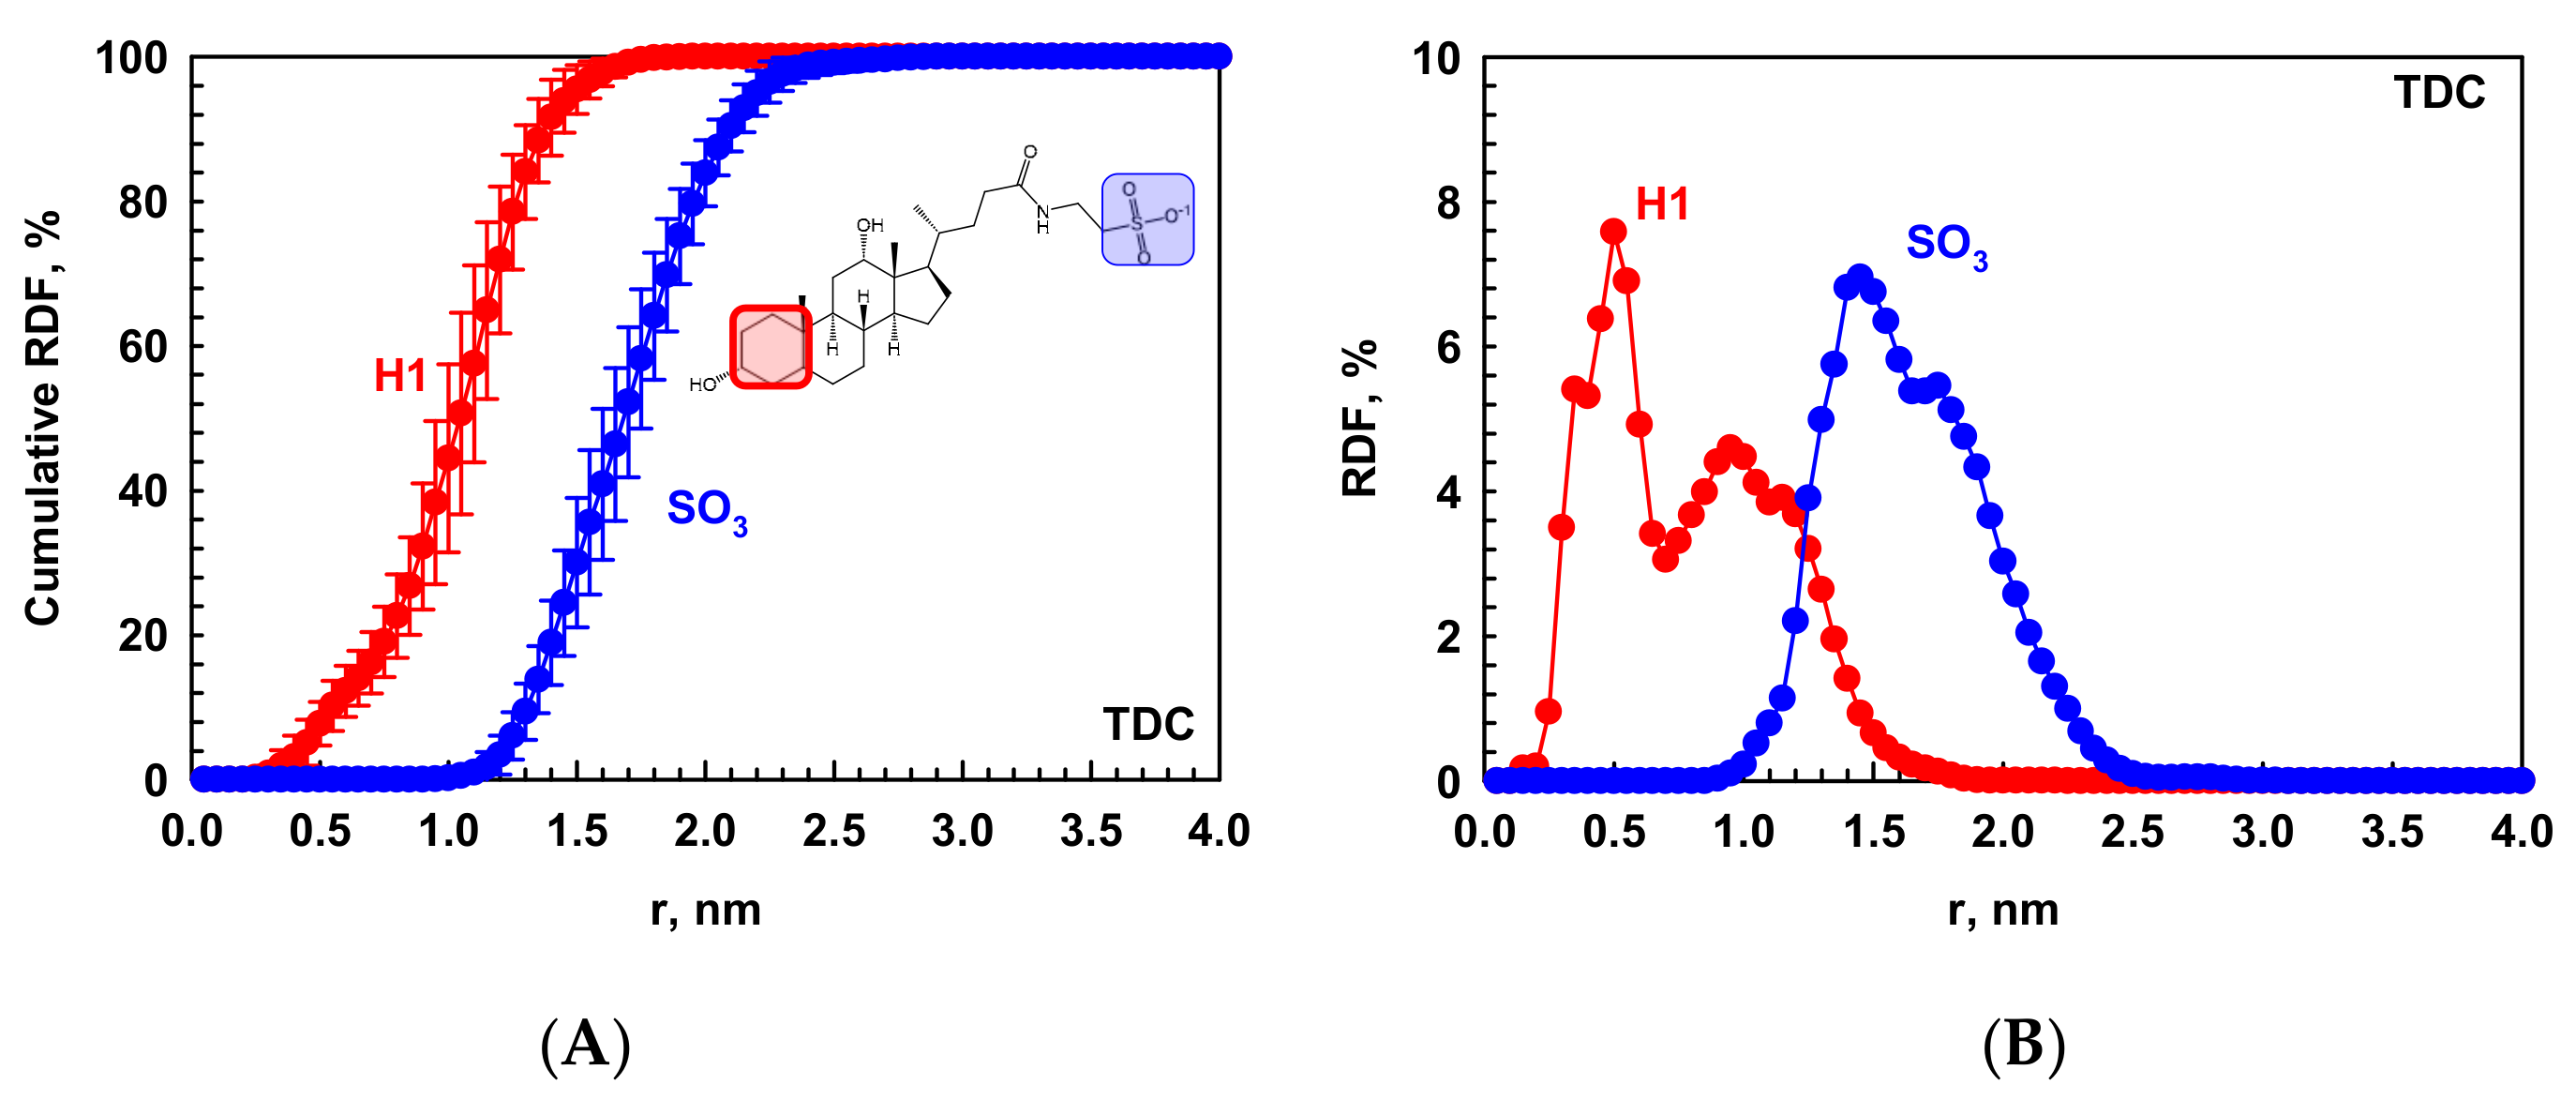
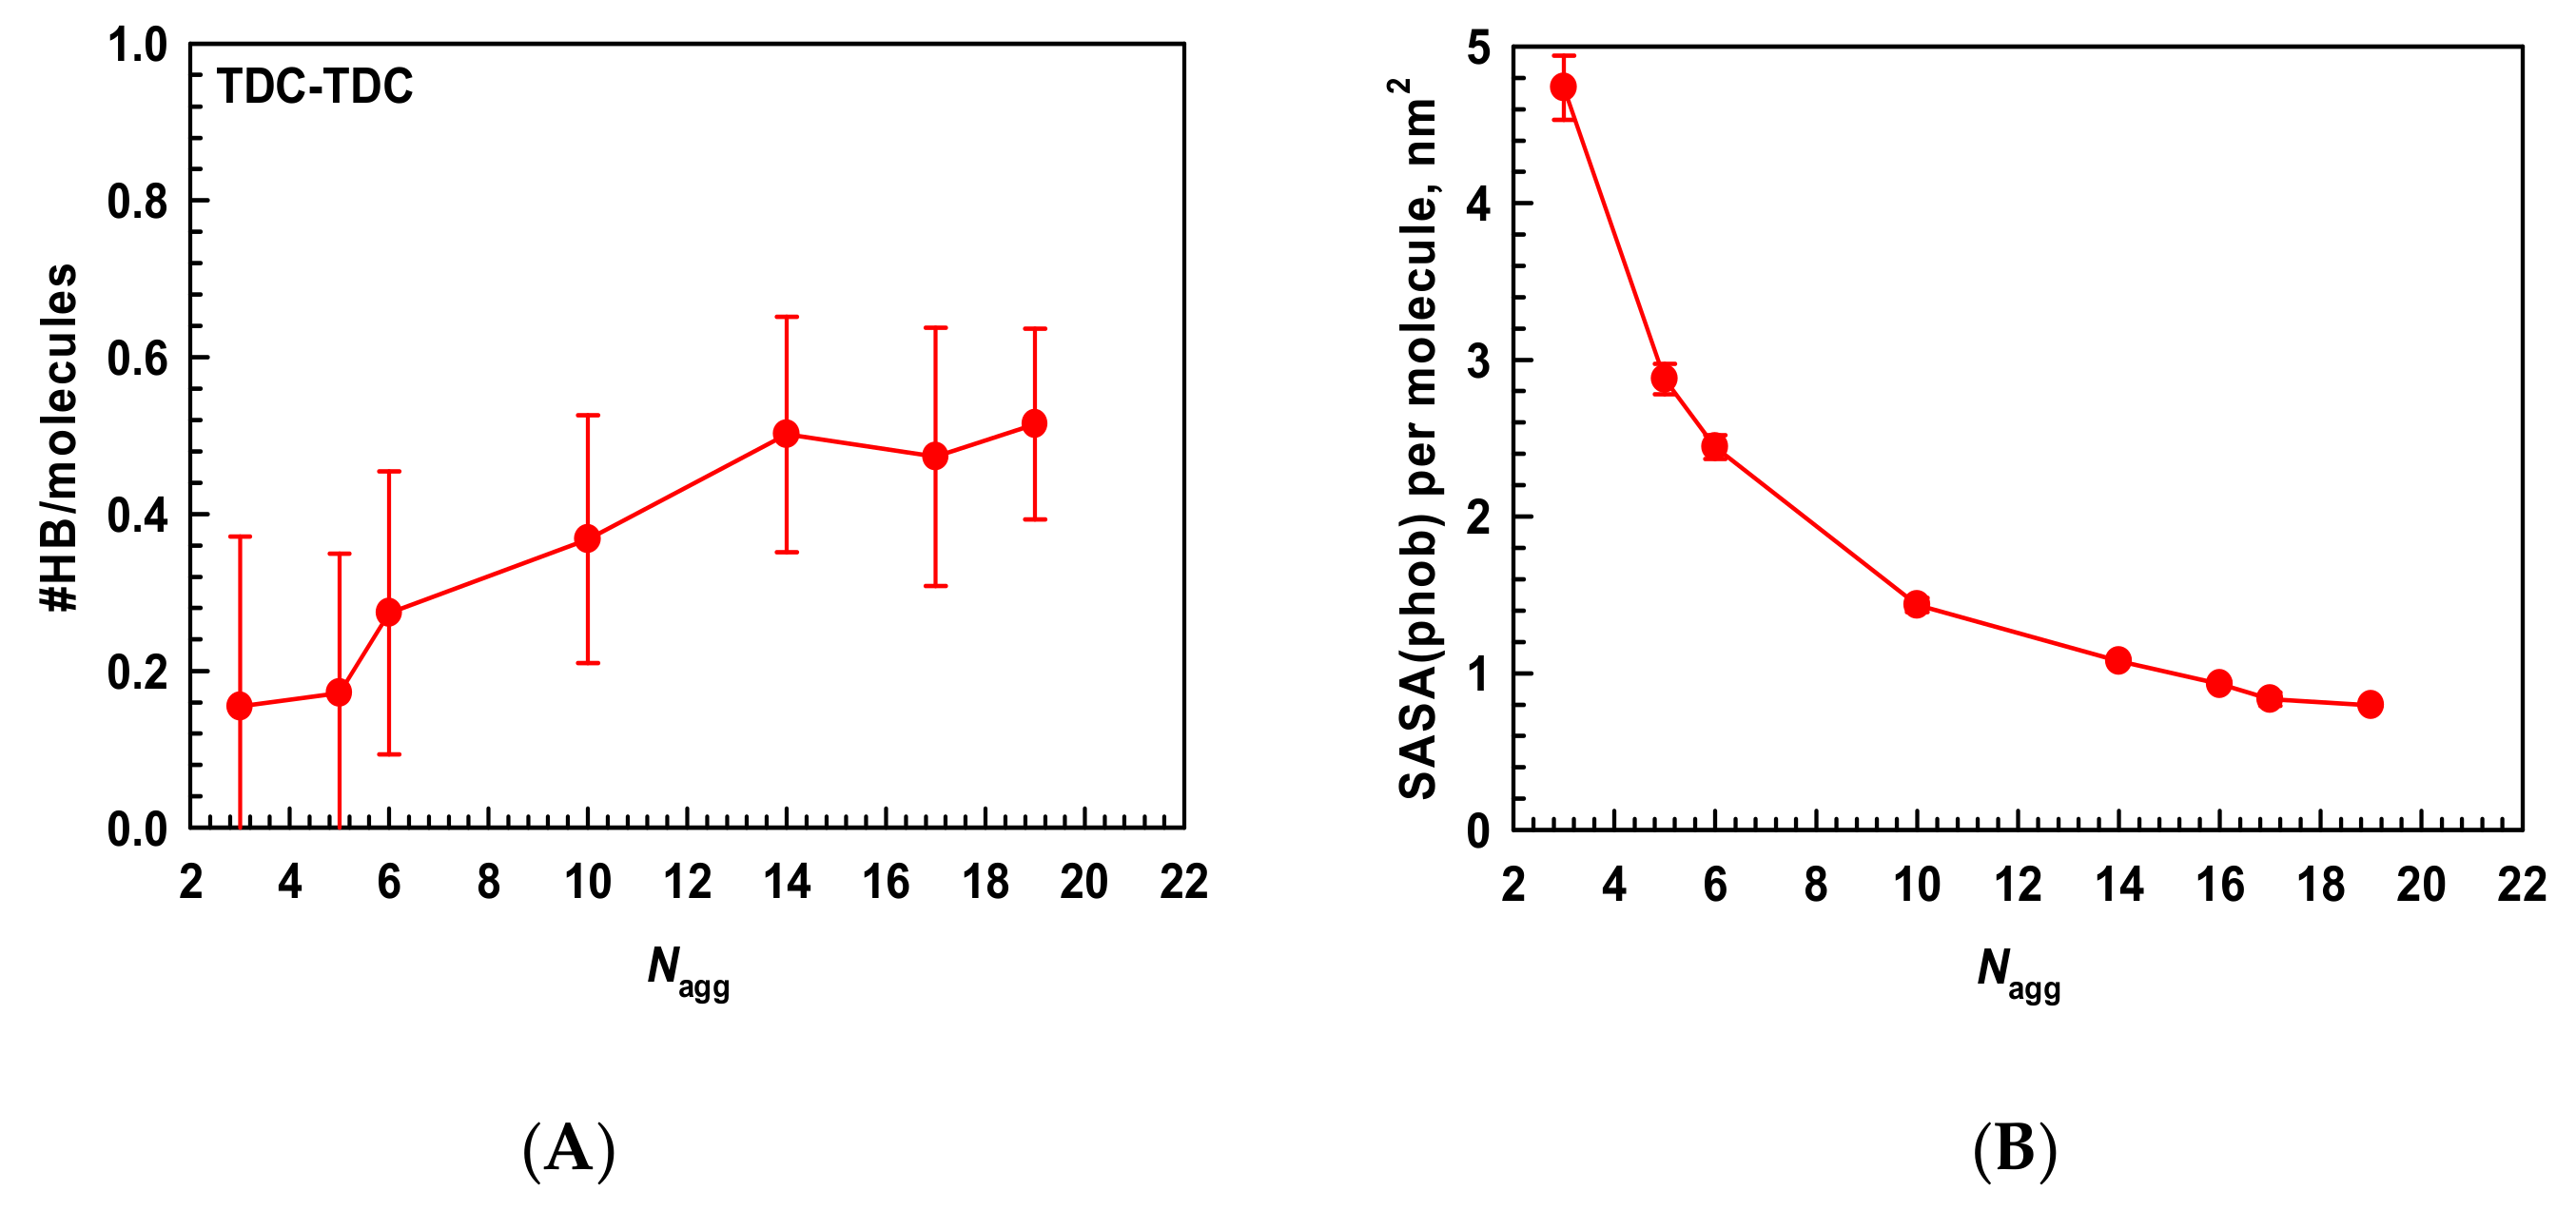
2.1.3. Driving Forces for the Micellization
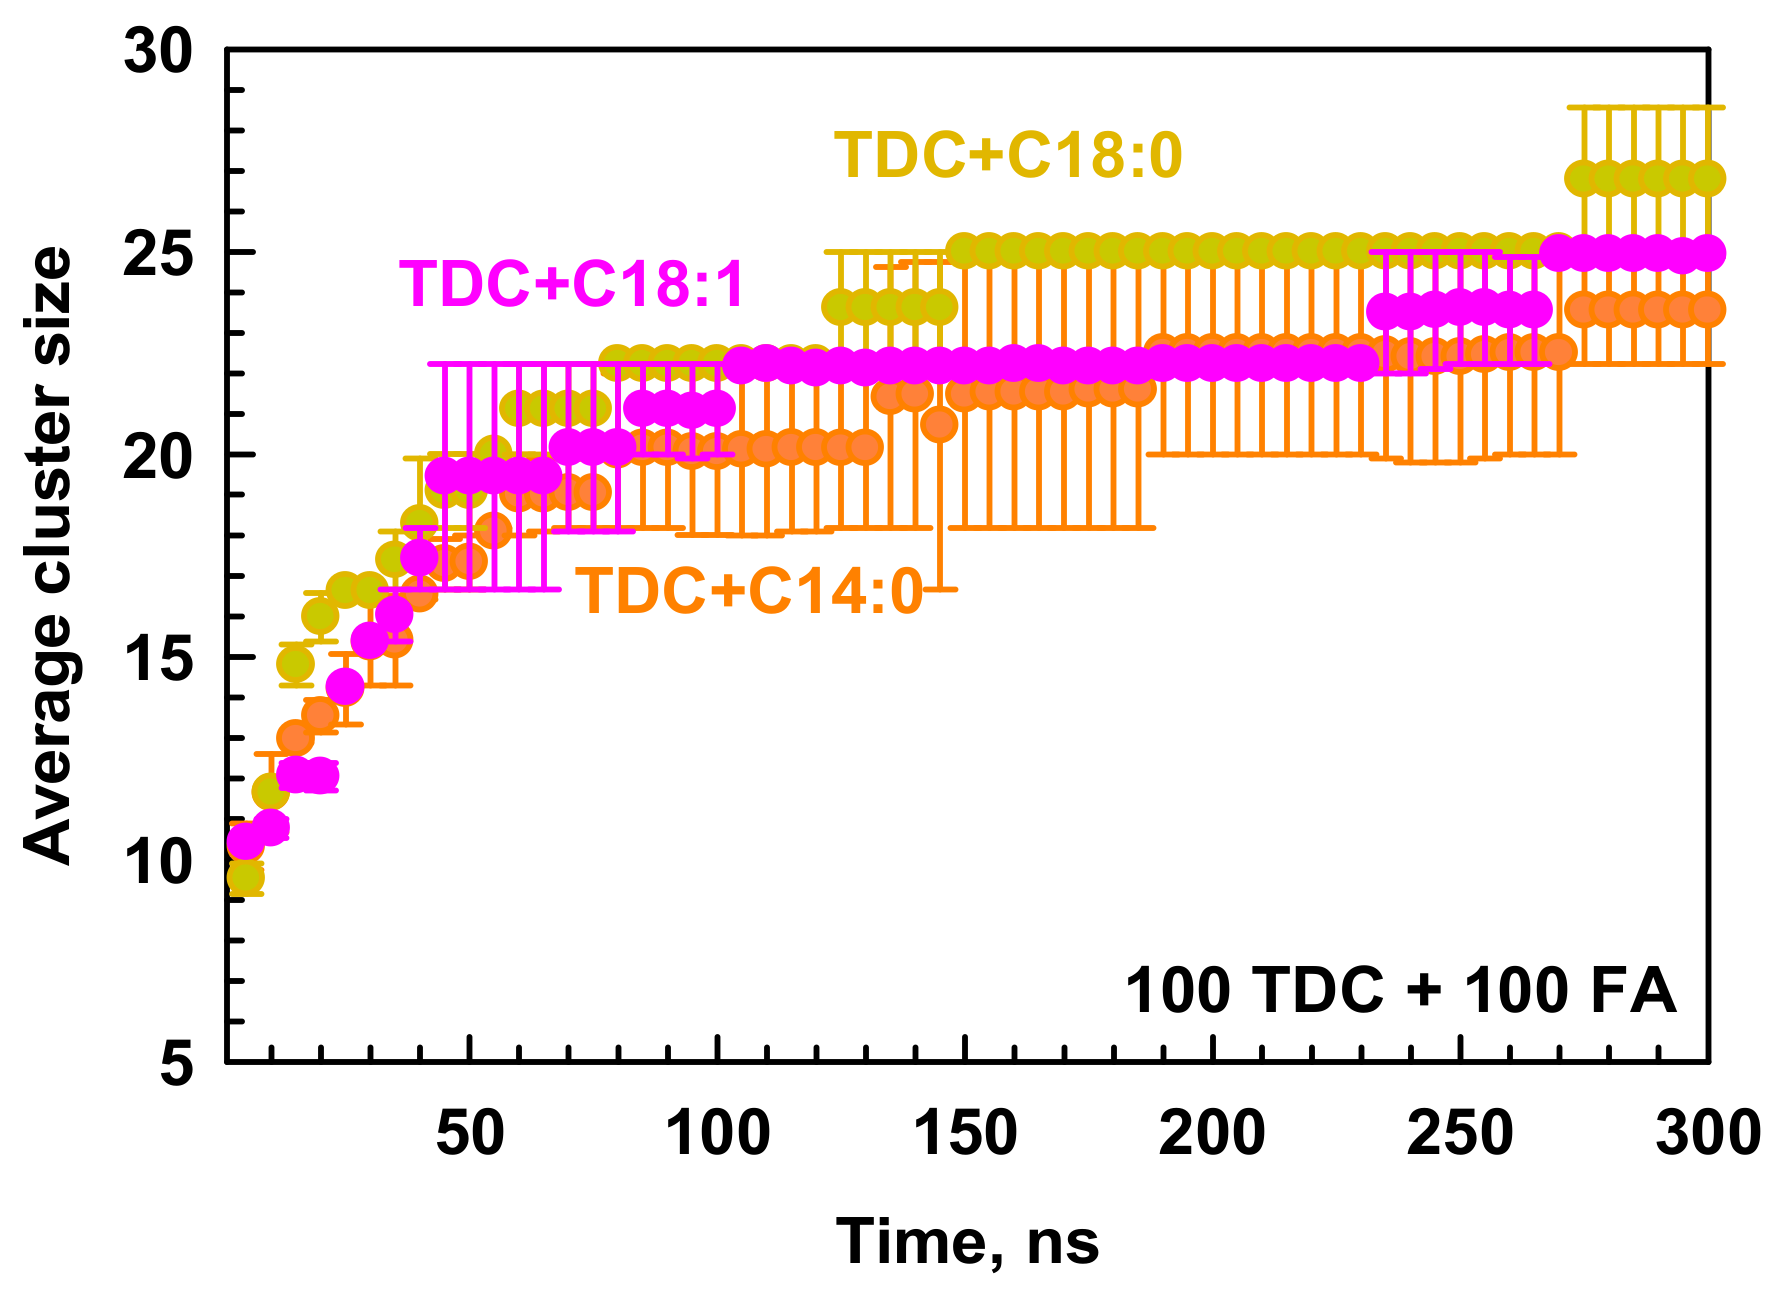
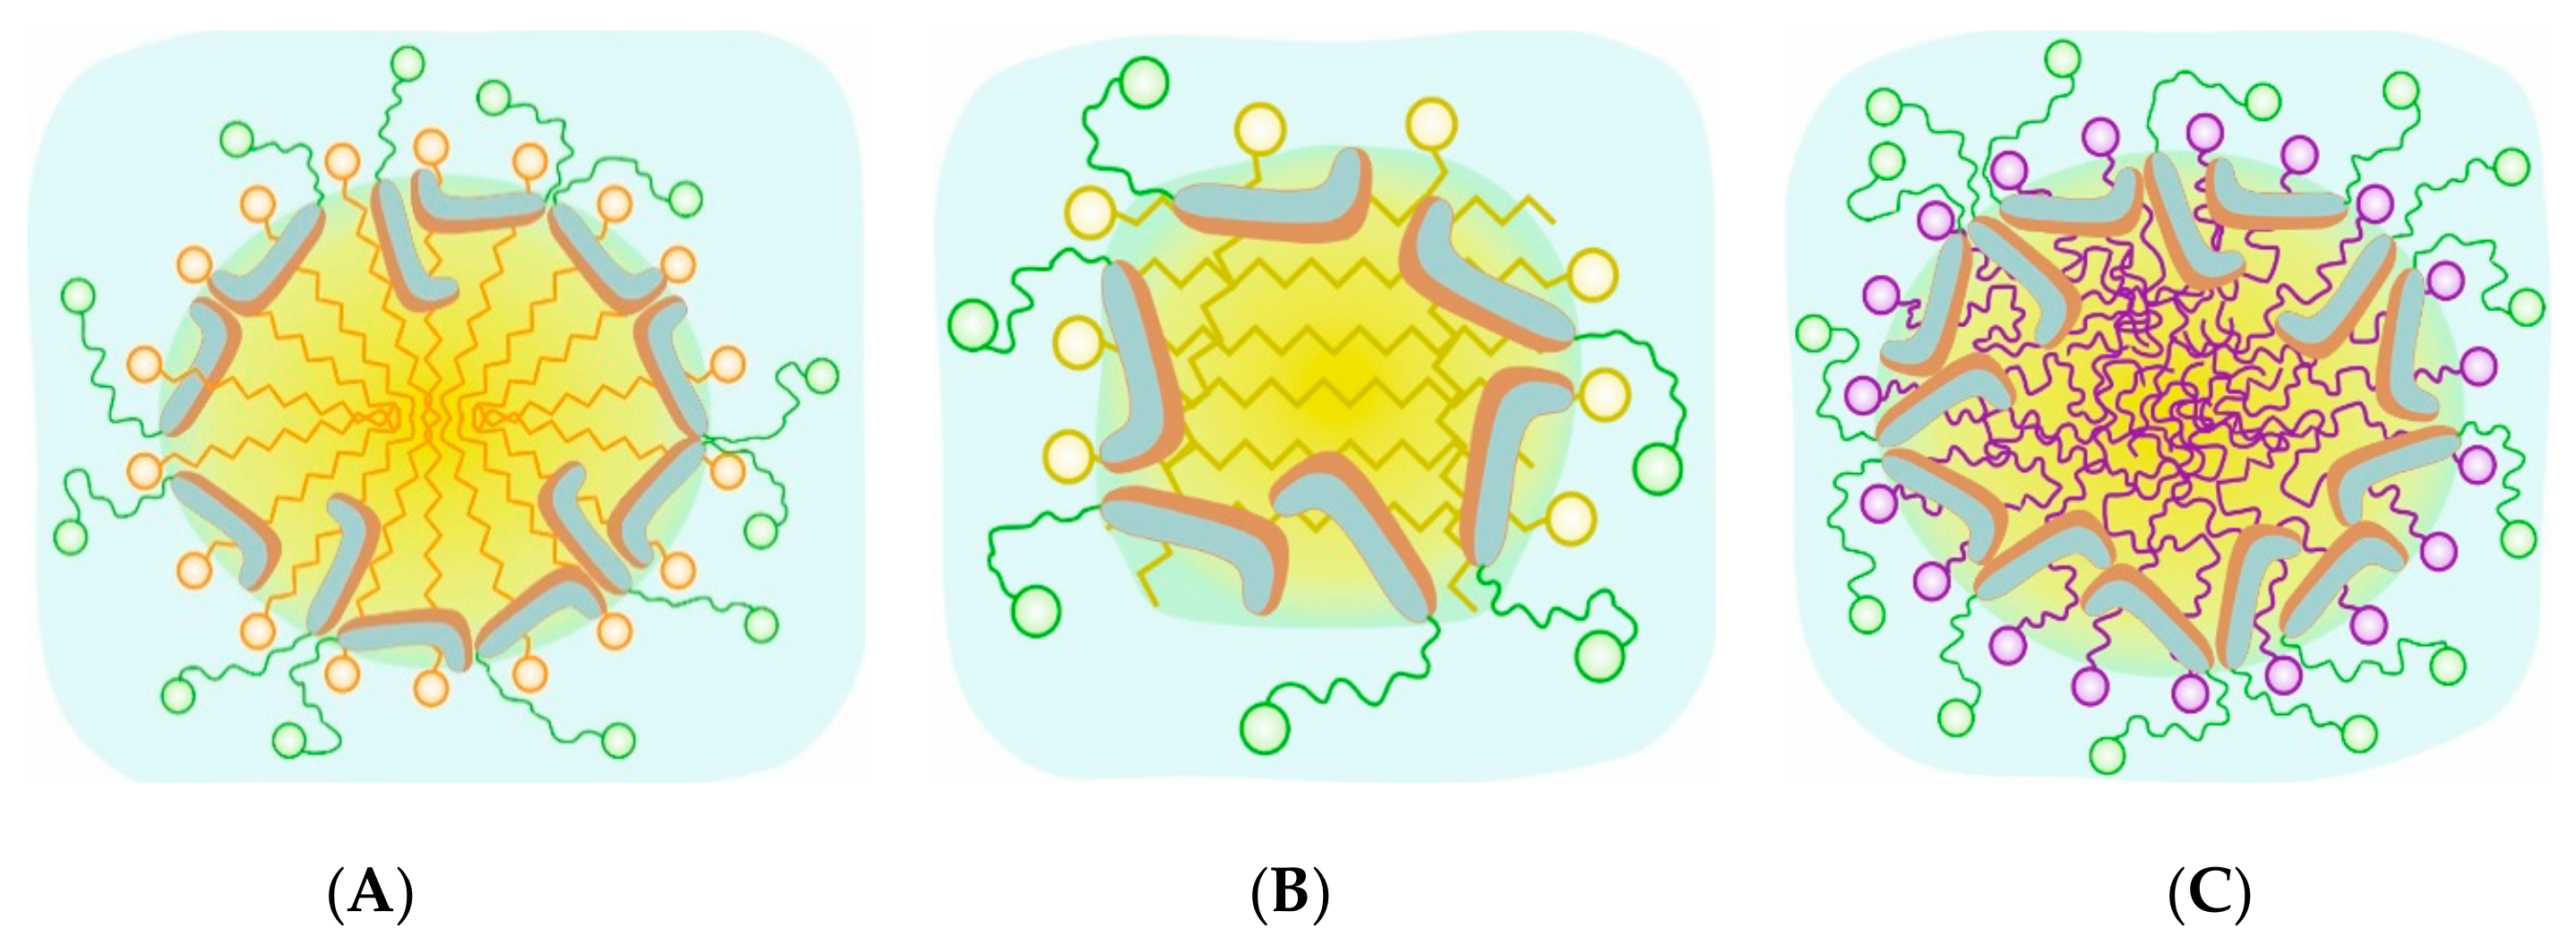
2.2. Mixed Micelles of TDC and Fatty Acids
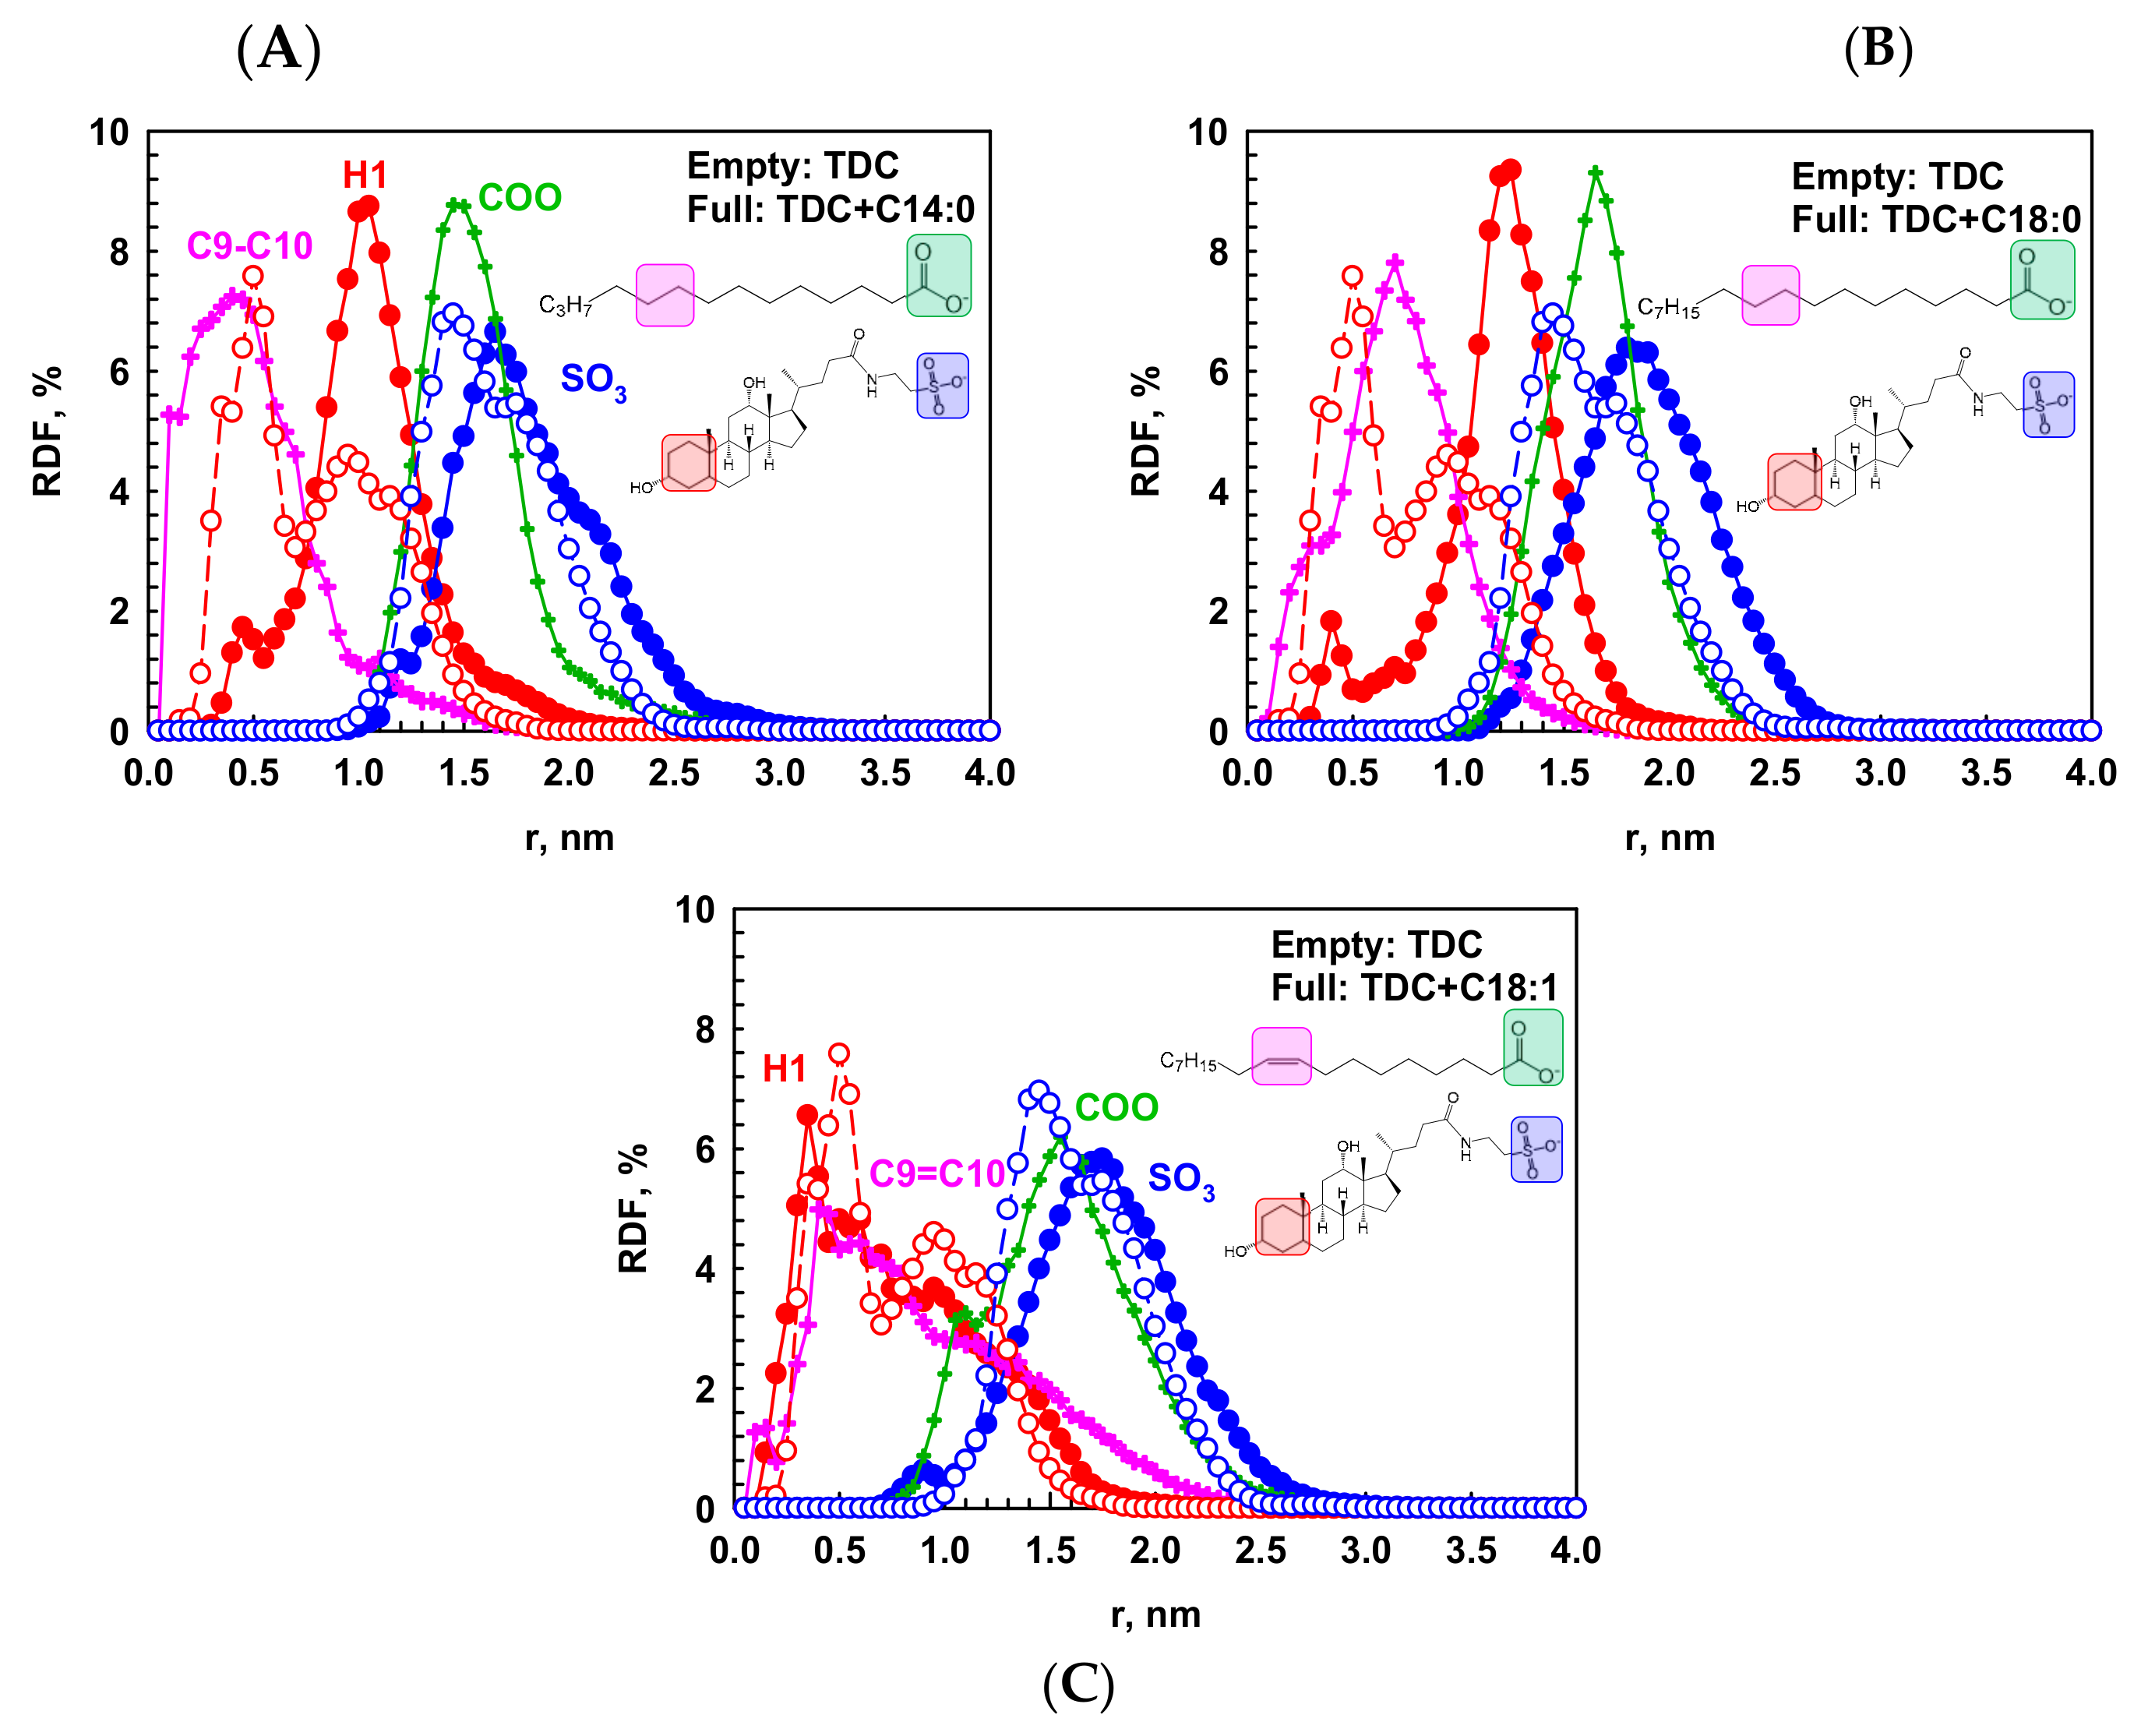
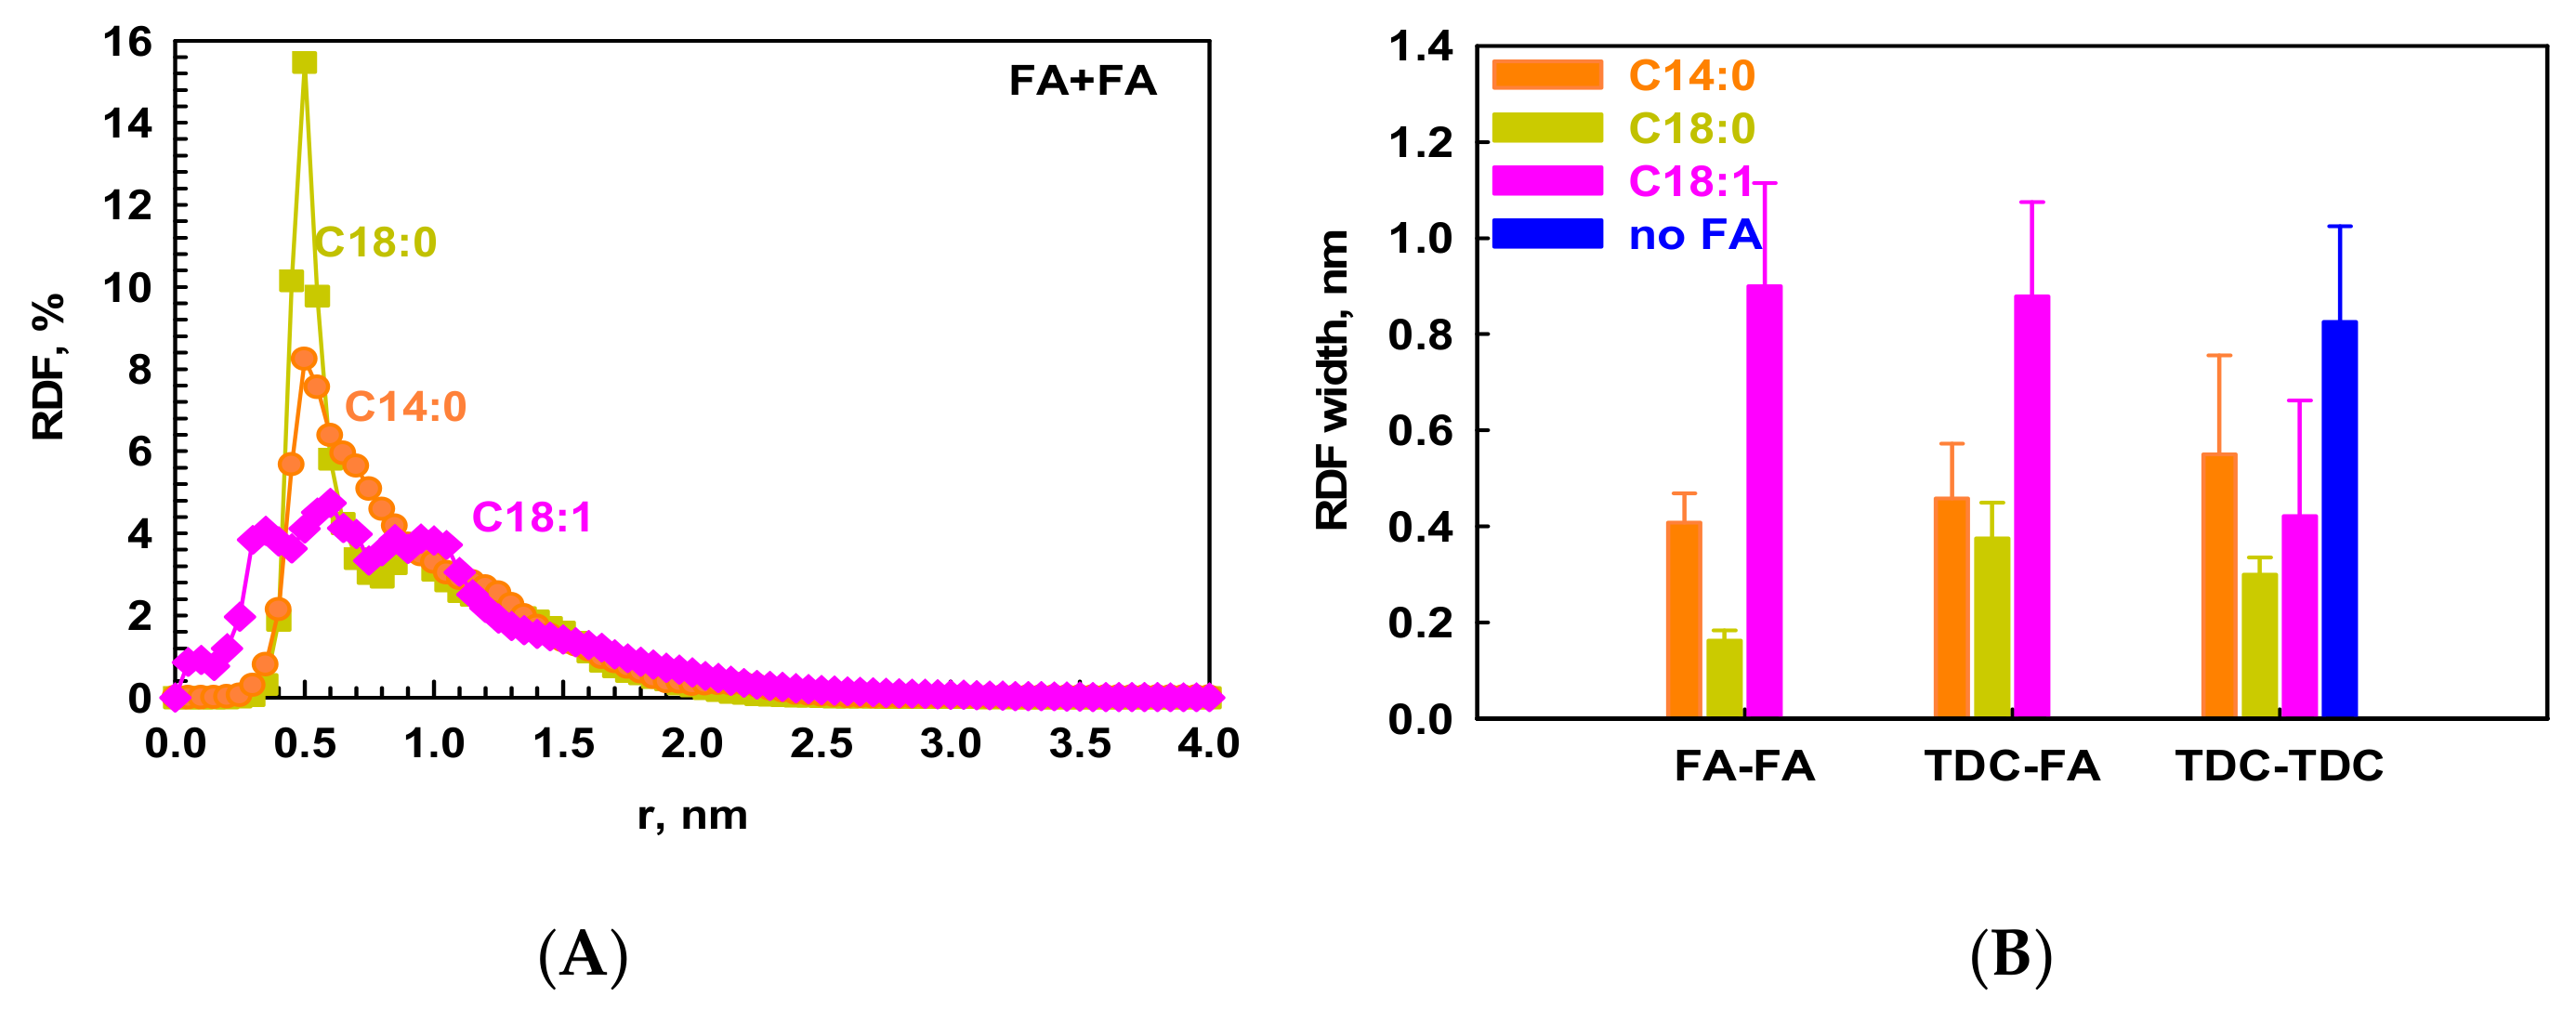
2.2.1. Micelle Composition and Morphology

| System | TDC | TDC + C14:0 | TDC + C18:0 | TDC + C18:1 |
|---|---|---|---|---|
| FA in the mixed micelle, % | - | 42 ± 15 | 41 ± 14 | 44 ± 23 |
| Nagg | 19 ± 2 | 25 ± 11 | 25 ± 8 | 25 ± 6 |
| Experiment | 18 *; 15.9 ** | - | - | - |
| Radius of gyration, rg, nm | 1.25 ± 0.07 | 1.35 ± 0.20 | 1.39 ± 0.17 | 1.46 ± 0.14 |
| Volume, nm3 | 8.20 ± 1.30 | 11.00 ± 5.02 | 11.50 ± 3.21 | 12.63 ± 5.26 |
| I1/I2 | 0.80 ± 0.06 | 0.75 ± 0.04 | 0.87 ± 0.11 | 0.76 ± 0.04 |
| I2/I3 | 0.88 ± 0.04 | 0.89 ± 0.04 | 0.88 ± 0.02 | 0.85 ± 0.04 |
| Shape | Irregular sphere | Irregular ellipsoid | Irregular sphere | Irregular ellipsoid |
2.2.2. Intermolecular Interactions in the Micelles
3. Molecular Models and Computational Protocol
4. Conclusions
Supplementary Materials
Author Contributions
Funding
Institutional Review Board Statement
Informed Consent Statement
Data Availability Statement
Acknowledgments
Conflicts of Interest
References
- Madenci, D.; Egelhaaf, S. Self-assembly in aqueous bile salt solutions. Curr. Opin. Colloid Interface Sci. 2010, 15, 109–115. [Google Scholar] [CrossRef]
- Hofmann, A.; Hagey, L. Key discoveries in bile acid chemistry and biology and their clinical applications: History of the last eight decades. J. Lipid Res. 2014, 55, 1553. [Google Scholar] [CrossRef] [PubMed]
- Malik, N. Solubilization and Interaction Studies of Bile Salts with Surfactants and Drugs: A Review. Appl. Biochem. Biotechnol. 2016, 179, 179–201. [Google Scholar] [CrossRef] [PubMed]
- Pavlovic, N.; Golocorbin-Kon, S.; Danic, M.; Stanimirov, B.; Al-Salami, H.; Stankov, K.; Mikov, M. Bile Acids and Their Derivatives as Potential Modifiers of Drug Release and Pharmacokinetic Profiles. Front. Pharmacol. 2018, 9, 1283. [Google Scholar] [CrossRef] [PubMed]
- Holm, R.; Müllertz, A.; Mu, H. Bile salts and their importance for drug absorption. Int. J. Pharm. 2013, 453, 44–55. [Google Scholar] [CrossRef]
- Tanaka, Y.; Doi, H.; Katano, T.; Kasaoka, S. The impact of quantity of lipid-based formulations with different compositions on the oral absorption of ritonavir: A trade-off between apparent solubility and permeability. Eur. J. Pharm. Sci. 2022, 168, 106079. [Google Scholar] [CrossRef]
- Katev, V.; Vinarov, Z.; Tcholakova, S. Mechanisms of drug solubilization by polar lipids in biorelevant media. Eur. J. Pharm. Sci. 2021, 159, 105733. [Google Scholar] [CrossRef]
- Phan, S.; Salentinig, S.; Gilbert, E.; Darwish, T.; Hawley, A.; Nixon-Luke, R.; Bryant, G.; Boyd, B.J. Disposition and crystallization of saturated fatty acid in mixed micelles of relevance to lipid digestion. J. Colloid Interface Sci. 2015, 449, 160–166. [Google Scholar] [CrossRef]
- Guruge, A.G.; Warren, D.B.; Pouton, C.W.; Chalmers, D.K. Molecular Dynamics Simulation Studies of Bile, Bile Salts, Lipid-Based Drug Formulations, and mRNA−Lipid Nanoparticles: A Review. Mol. Pharm. 2023, 20, 2781–2800. [Google Scholar] [CrossRef]
- Mustan, F.; Ivanova, A.; Madjarova, G.; Tcholakova, S.; Denkov, N. Molecular Dynamics Simulation of the Aggregation Patterns in Aqueous Solutions of Bile Salts at Physiological Conditions. J. Phys. Chem. B 2015, 119, 15631–15643. [Google Scholar] [CrossRef]
- Partay, L.B.; Jedlovszky, P.; Sega, M. Molecular Aggregates in Aqueous Solutions of Bile Acid Salts. Molecular Dynamics Simulation Study. J. Phys. Chem. B 2007, 111, 9886–9896. [Google Scholar] [CrossRef] [PubMed]
- Partay, L.; Sega, M.; Jedlovszky, P. Morphology of Bile Salt Micelles as Studied by Computer Simulation Methods. Langmuir 2007, 23, 12322–12328. [Google Scholar] [CrossRef] [PubMed]
- Warren, D.; Chalmers, D.K.; Hutchison, K.; Dang, W.; Pouton, C.W. Molecular Dynamics Simulations of Spontaneous Bile Salt Aggregation. Colloids Surf. A 2006, 280, 182–193. [Google Scholar] [CrossRef]
- Turner, D.; Yin, F.; Kindt, J.; Zhang, H. Molecular Dynamics Simulations of Glycocholate-Oleic Acid Mixed Micelle Assembly. Langmuir 2010, 26, 4687–4692. [Google Scholar] [CrossRef]
- Verde, A.; Frenkel, D. Simulation Study of Micelle Formation by Bile Salts. Soft Matter 2010, 6, 3815–3825. [Google Scholar] [CrossRef]
- Pabois, O.; Ziolek, R.; Lorenz, C.; Prévost, S.; Mahmoudi, N.; Skoda, M.W.; Welbourn, R.J.; Valero, M.; Harvey, R.D.; Grundy, M.M.-L.; et al. Morphology of bile salts micelles and mixed micelles with lipolysis products, from scattering techniques and atomistic simulations. J. Colloid Interface Sci. 2021, 587, 522–537. [Google Scholar] [CrossRef]
- Parrow, A.; Larsson, P.; Augustijns, P.; Bergström, C.A.S. Molecular Dynamics Simulations on Interindividual Variability of Intestinal Fluids: Impact on Drug Solubilization. Mol. Pharm. 2020, 17, 3837–3844. [Google Scholar] [CrossRef]
- Tuncer, E.; Bayramoglu, B. Characterization of the self-assembly and size dependent structural properties of dietary mixed micelles by molecular dynamics simulations. Biophys. Chem. 2019, 248, 16–27. [Google Scholar] [CrossRef]
- Tuncer, E.; Bayramoglu, B. Molecular dynamics simulations of duodenal self assembly in the presence of different fatty acids. Colloids Surf. A Physicochem. Eng. Asp. 2022, 644, 128866. [Google Scholar] [CrossRef]
- Small, D.M. Size and Structure of Bile Salt Micelles. Adv. Chem. Ser. 1968, 84, 31–52. [Google Scholar] [CrossRef]
- Matsuoka, K.; Maeda, M.; Moroi, Y. Micelle formation of sodium glyco- and taurocholates and sodium glyco- and taurodeoxycholates and solubilization of cholesterol into their micelles. Colloids Surf. B 2003, 32, 87–95. [Google Scholar] [CrossRef]
- Parker, R.; Rigby, N.M.; Ridout, M.J.; Gunning, A.P.; Wilde, P.J. The adsorption–desorption behaviour and structure function relationships of bile salts. Soft Matter 2014, 10, 6457–6466. [Google Scholar] [CrossRef]
- Israelachvili, J.N. Intermolecular and Surface Forces, 3rd ed.; Elsevier: Amsterdam, The Netherlands, 2011. [Google Scholar] [CrossRef]
- McBain, J.W.; Sierichs, W.C. The solubility of sodium and potassium soaps and the phase diagrams of aqueous potassium soaps. J. Am. Oil Chem. Soc. 1948, 25, 221–225. [Google Scholar] [CrossRef]
- Maestre, A.; Guardado, P.; Moyá, M.L. Thermodynamic Study of Bile Salts Micellization. J. Chem. Eng. Data 2014, 59, 433–438. [Google Scholar] [CrossRef]
- Ponder, J.; Case, D. Force fields for protein simulations. Adv. Prot. Chem. 2003, 66, 27–85. [Google Scholar] [CrossRef]
- Jorgensen, W.L.; Chandrasekhar, J.; Madura, J.D.; Impey, R.W.; Klein, M.L. Comparison of simple potential functions for simulating liquid water. J. Chem. Phys. 1983, 79, 926–935. [Google Scholar] [CrossRef]
- Becke, A.D. Density-functional Exchange-energy Approximation with Correct Asymptotic Behavior. Phys. Rev. A At. Mol. Opt. Phys. 1988, 38, 3098–3100. [Google Scholar] [CrossRef]
- Becke, A.D. Density-functional Thermochemistry. III. The role of exact exchange. J. Chem. Phys. 1993, 98, 5648–5652. [Google Scholar] [CrossRef]
- Ditchfield, R.; Hehre, W.J.; Pople, J.A. Self-consistent Molecular-orbital Methods. IX. An Extended Gaussian-type Basis for Molecular-orbital Studies of Organic Molecules. J. Chem. Phys. 1971, 54, 724–728. [Google Scholar] [CrossRef]
- Bayly, C.I.; Cieplak, P.; Cornell, W.D.; Kollman, P.A. A Well Behaved Electrostatic Potential Based Method Uusing Charge Restraints for Deriving Atomic Charges—The RESP Model. J. Phys. Chem. 1993, 97, 10269–10280. [Google Scholar] [CrossRef]
- Cieplak, P.; Cornell, W.D.; Bayly, C.; Kollman, P.A. Application of the Multimolecule and Multiconformational RESP Methodology to Biopolymers—Charge Derivation for DNA, RNA, and Proteins. J. Comput. Chem. 1995, 16, 1357–1377. [Google Scholar] [CrossRef]
- Berendsen, H.J.C.; Postma, J.P.M.; Van Gunsteren, W.F.; DiNola, A.; Haak, J.R. Molecular-Dynamics with Coupling to an External Bath. J. Chem. Phys. 1984, 81, 3684–3690. [Google Scholar] [CrossRef]
- Ryckaert, J.-P.; Ciccotti, G.; Berendsen, H.J.C. Numerical Integration of the Cartesian Equations of Motion of a System with Constraints: Molecular Dynamics of n-Alkanes. J. Comput. Phys. 1977, 23, 327–341. [Google Scholar] [CrossRef]
- Miyamoto, S.; Kollman, P.A. Settle: An analytical Version of the SHAKE and RATTLE Algorithm for Rigid Water Models. J. Comput. Chem. 1992, 13, 952–962. [Google Scholar] [CrossRef]
- Darden, T.; York, D.; Pedersen, L. Particle Mesh Ewald: An N·log(N) Method for Ewald Sums in Large Systems. J. Chem. Phys. 1993, 98, 10089–10092. [Google Scholar] [CrossRef]
- Essmann, U.; Perera, L.; Berkowitz, M.L.; Darden, T.; Lee, H.; Pedersen, L.G. A Smooth Particle Mesh Ewald Method. J. Chem. Phys. 1995, 103, 8577–8593. [Google Scholar] [CrossRef]
- Lindahl, A.; Van der Spoel, H. GROMACS 2021.3 Manual (2021.3). 2021. Available online: https://zenodo.org/records/5053220 (accessed on 10 December 2024).
- Humphrey, W.; Dalke, A.; Schulten, K. VMD: Visual Molecular Dynamics. J. Mol. Graph. 1996, 14, 33–38. [Google Scholar] [CrossRef]
| Molecule | Partial RESP Charge | q1q2 | q1q2(C18:1)/q1q2(FA) | |
|---|---|---|---|---|
| TDC | 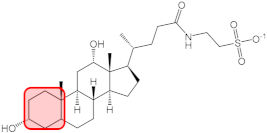 | q1 = 0.492 | 0.242 | - |
| C14:0 | 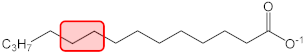 | q2 = −0.053 | −0.026 | 5 |
| C18:0 | 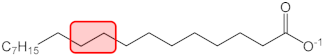 | q2 = −0.007 | −0.003 | 38 |
| C18:1 | 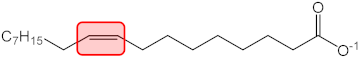 | q2 = −0.246 | −0.121 | 1 |
Disclaimer/Publisher’s Note: The statements, opinions and data contained in all publications are solely those of the individual author(s) and contributor(s) and not of MDPI and/or the editor(s). MDPI and/or the editor(s) disclaim responsibility for any injury to people or property resulting from any ideas, methods, instructions or products referred to in the content. |
© 2024 by the authors. Licensee MDPI, Basel, Switzerland. This article is an open access article distributed under the terms and conditions of the Creative Commons Attribution (CC BY) license (https://creativecommons.org/licenses/by/4.0/).
Share and Cite
Mustan, F.; Ivanova, A.; Tcholakova, S. Taurodeoxycholate Aggregation Explored by Molecular Dynamics: Primary-To-Secondary Micelle Transition and Formation of Mixed Micelles with Fatty Acids. Molecules 2024, 29, 5897. https://doi.org/10.3390/molecules29245897
Mustan F, Ivanova A, Tcholakova S. Taurodeoxycholate Aggregation Explored by Molecular Dynamics: Primary-To-Secondary Micelle Transition and Formation of Mixed Micelles with Fatty Acids. Molecules. 2024; 29(24):5897. https://doi.org/10.3390/molecules29245897
Chicago/Turabian StyleMustan, Fatmegyul, Anela Ivanova, and Slavka Tcholakova. 2024. "Taurodeoxycholate Aggregation Explored by Molecular Dynamics: Primary-To-Secondary Micelle Transition and Formation of Mixed Micelles with Fatty Acids" Molecules 29, no. 24: 5897. https://doi.org/10.3390/molecules29245897
APA StyleMustan, F., Ivanova, A., & Tcholakova, S. (2024). Taurodeoxycholate Aggregation Explored by Molecular Dynamics: Primary-To-Secondary Micelle Transition and Formation of Mixed Micelles with Fatty Acids. Molecules, 29(24), 5897. https://doi.org/10.3390/molecules29245897