Abstract
Previous studies have shown that Acanthopanax senticosus (AS) has a beneficial preventive and therapeutic effect on colitis. The fermentation of lactic acid bacteria (LAB) can alter the efficacy of AS by modifying or producing new compounds with potential bioactive properties. However, the specific components and mechanisms that enhance the efficacy are still unclear. In the present experiment, untargeted metabolomics was used to analyze the changes in active components before and after LAB fermentation of AS. The aim was to explain the mechanism of AS fermentation in treating colitis using a colitis model in mice. The results indicated that the fermentation of LAB could enhance the levels of total flavonoids and total polyphenols in FAS. Additionally, the beneficial components such as Delphinidin chloride, Diosmetin, Psoralidin, and Catechol significantly increased (p < 0.05). The colitis treatment experiment demonstrated that fermented AS could alleviate symptoms and improve the morphology of colitis in mice by enhancing antioxidant enzymes like CAT, T-SOD, and T-AOC. It also regulated the composition and abundance of intestinal flora species, such as Lactobacillus and Pseudogracilibacillus. The effectiveness of fermented AS was significantly superior to that of unfermented AS (p < 0.05). In conclusion, this study contributes to the application of lactic acid bacteria in AS fermentation and reveals the mechanism of fermentation AS for colitis.
1. Introduction
The fermentation of herbal medicine with lactic acid bacteria (LAB) can enhance the content of active ingredients or generate new secondary metabolites [1]. Currently, the assessment of fermentation effects primarily relies on evaluating changes in beneficial components such as flavonoids, polyphenols, proteins, and others, as well as their biological activity [2]. After fermentation, the chemical composition of the fermentation product is complex, with low contents and a wide variety of components, making it challenging to identify all components using traditional detection methods.
The emergence of non-targeted metabolomics technology, which can detect the changes of compounds before and after fermentation, has the advantages of high-throughput technology, simplicity, high sensitivity, and high efficiency, making it an important tool to analyze the composition changes of fermentation compounds [3]. Du et al. analyzed the chemical composition changes after the solid-state fermentation of Glycyrrhiza stems and leaves using a widely targeted metabolomic analysis and found 461 differential metabolites, with 320 downregulated and 141 upregulated. The main types of differential metabolites were phenolic acids and flavonoids [4]. Li et al. used an untargeted metabolomics analysis to identify differential markers of two Sorghum varieties for baijiu fermentation, revealing 267 metabolites within both types of fermented Sorghum. Further analyses highlighted sphingolipids, 2,5-diketopiperazines, and methionine derivatives as critical markers for quality control [5]. Moreover, research indicated that fermented products have significant advantages in the treatment of gastrointestinal diseases [6,7].
Colitis is a non-specific inflammatory disease of the intestine that mainly affects the colonic tissue and submucosa [8]. Intestinal homeostasis disorder and oxidative stress are important triggers in colitis patients [9]. Previous studies have indicated the potential of LAB-fermented plant-based products in preventing or treating colitis by regulating intestinal flora and correcting metabolic disorders [10,11].
Acanthopanax senticosus (Rupr. & Maxim.) harms (AS) has a variety of bioactive components, such as phenolic acids, flavonoids, polysaccharides, saponins, and other phytochemicals [12]. Modern medical research has shown that AS possesses a wide range of biological activities, including antioxidant, anti-fatigue, anti-inflammatory, and immunomodulatory effects [13]. Gyoung et al. screened the anti-inflammatory compounds in AS fruit (Ogaza) extract through liquid chromatography-tandem mass spectrometry (LC-MS/MS). They identified 14 and 16 compounds in the negative and positive ion modes, respectively. For example, quercetin, hyperoside, acanthoside D, oleanolic acid, and scopoletin were identified as potential anti-inflammatory components [14]. Kim et al. demonstrated that the extrusion of AS leaves (ASLs) had protective effects on acute gastric mucosal lesions in rats by reducing inflammation and oxidative stress [15]. Ma et al. demonstrated that AS fermentation by Lactobacillus rhamnosus exhibited antioxidant activity and anti-inflammatory functions in crucian carp (Carassius auratus), leading to increased levels of CAT, GSH-PX, and SOD, as well as the upregulation of C3 and C4 concentrations [16]. Kim et al. found that the fermentation extract of the bark of AS exhibited anti-inflammatory activity in lipopolysaccharide-treated RAW 264.7 macrophage cells [17]. To date, there are no reports on whether the extracts of LAB-fermented AS could be more effective in relieving the symptoms of colitis.
In this context, the objective of this study was to investigate the influence of LAB-fermented AS on the active ingredient profile and therapeutic efficacy of colitis in mice. This experiment provides a comprehensive scientific foundation for the rational processing and effective utilization of fermented AS products.
2. Results
2.1. Changes in Active Ingredient Contents after Fermentation
By measuring the contents of polyphenols, flavonoids, and saponins after solid-state fermentation by LAB, it can be found that the contents of polyphenols and flavonoids increased significantly during the fermentation of AS (p < 0.05), while the contents of saponins decreased (p > 0.05), as shown in Figure 1A. The content of flavonoids was increased by 34.39% from 10.12 ± 0.64 mg of rutin equivalent (RE)/g dry weight (DW) of the sample to 13.60 ± 0.94 mg of RE/g DW. The content of polyphenols increased from 4.41 ± 0.50 mg of gallic acid equivalent (GAE)/g DW of the sample to 7.28 ± 065 mg of GAE/g DW, an increase of 65.08% (p < 0.01). The saponin content decreased from 4.50 ± 046 mg of ginsenosides equivalent (GE)/g DW to 4.35 ± 032 mg of GE/g DW, a decrease of 3.33% (p > 0.05).
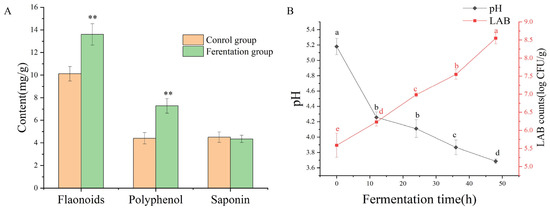
Figure 1.
The contents change of active ingredient after fermentation (A); the change of pH value and viable cell counts during fermentation (B). ** represents a significant difference in plot (A) (p < 0.01). Different letters in different positions represent significant differences in plot (B) (p < 0.05).
2.2. Changes in Viable Cell Count and PH during the Fermentation Process
As shown in Figure 1B, the pH value rapidly decreased to 4.26 ± 0.07 within the first 10 h after fermentation. Subsequently, the rate of decrease slowed down, and the final pH value was 3.69 ± 0.03. The viable cell counts of LAB increased consistently throughout the fermentation period, with the LAB population ultimately increasing by 8.55 ± 0.16 log CFU/mL. As the number of LAB increased, the pH decreased. The trends in viable cell numbers were opposite to those of pH.
2.3. Untargeted Metabolomics Analysis
2.3.1. Metabolic Profile Analysis
In positive ion mode, 1210 metabolites were identified, and 707 metabolites were identified in negative ion mode after solid-state fermentation of AS. The metabolites of positive and negative ion modes were combined and classified. The secondary classification of compounds according to the compound categories showed that the numbers of fatty acyls, prenol lipids, carboxylic acids and derivatives, organooxygen compounds, flavonoids, steroids and steroid derivatives, benzene and substituted derivatives, coumarins and derivatives, and phenols were 164, 158, 156, 123, 83, 62, 59, 36, and 34 types of compounds, respectively. The count plot of the compounds is shown in Figure S1.
2.3.2. Metabolomics Multivariate Statistical Analysis
As shown in Figure 2A, in positive mode, the PCA score plot showed 70.03% of the total variance (PC1, 63.53%; PC2, 6.50%). In negative mode (Figure 2B), the PCA score plot showed 69.5% of the total variance (PC1, 64.08%; PC2, 5.42%). The control group and fermentation group were clearly separated in each mode. The orthogonal partial least squares discriminant analysis (OPLS-DA) was used for the analysis of metabolites. The results show similar clustering patterns to the PCA. The OPLS-DA model evaluation parameters were R2 = (0.0, 0.77), Q2 = (0.0, −0.39) in positive mode, and R2 = (0.0, 0.59), Q2 = (0.0, −0.55) in negative mode (Figure 3A,C). Permutation testing showed that the model had good predictability and reproducibility without overfitting (Figure 3B,D).
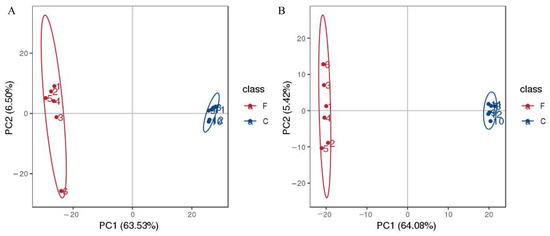
Figure 2.
Principal component analysis (PCA) of the AS samples during the fermentation; in positive mode (A); in negative mode (B).
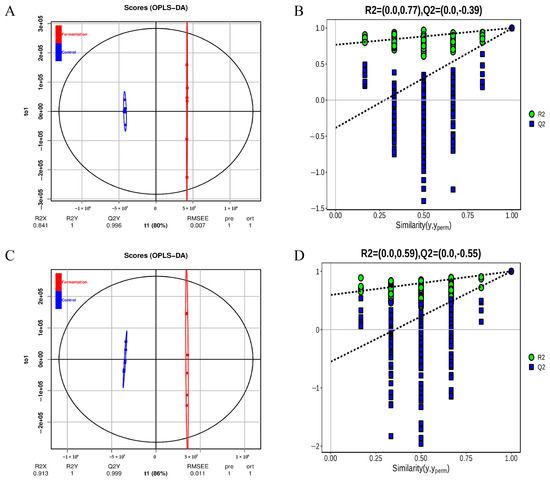
Figure 3.
The diagram of orthogonal partial least-squares discriminant analysis (OPLS-DA) of metabolites (A), and permutation test plot (B) in positive ion modes; OPLS-DA diagram (C), permutation test plot (D) in negative ion modes.
2.3.3. Differential Analysis of Key Metabolites during AS Fermentation
The screened differential metabolite signatures were visualized in the volcano plots during the fermentation process (Figure 4A,B). In positive mode, 600 compounds were identified as metabolites with significant differences (p < 0.05), 301 compounds were downregulated, and 276 compounds were upregulated. In negative mode, 367 compounds were identified as metabolites with significant differences (p < 0.05), 209 compounds were downregulated, and 142 compounds were upregulated (p < 0.05). For example, xanthurenic acid o-hexoside, 3-o-p-coumaroyl shikimic acid o-hexoside, hesperetin 5-o-glucoside, and xanthosine showed substantial downregulation, while 2,6-diaminooimelic acid, acetylcysteine, and phenylacetaldehyde exhibited remarkable upregulation.
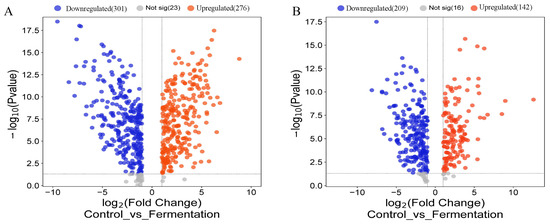
Figure 4.
Differential metabolites during AS fermentation. Volcano plot of differential metabolites in pos mode (A) and in neg mode (B).
2.3.4. Metabolic Pathway Analysis
As shown in Figure 5, metabolic pathways were the most enriched pathways, which included 144 differential metabolites (p < 0.001). The metabolic pathways of purine metabolism, pyrimidine metabolism, arginine and proline metabolism, phenylalanine metabolism, ABC transporters, and tryptophan metabolism included 23, 19, 16, 15, 15, and 11 metabolites, respectively.
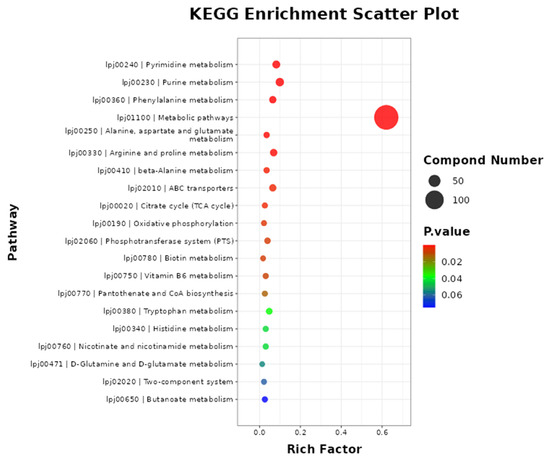
Figure 5.
The metabolic pathway enrichment of differential metabolites. Note: the metabolites pathway of differential metabolites was enriched using MBROLE 2.0: (http://csbg.cnb.csic.es/mbrole2/index.php) (accessed on 1 March 2024). The top 20 principal pathways were chosen for study with a significance level of p < 0.05.
2.4. Effect of FAS Extracts on DSS-Induced Colitis in Mice
As shown in Figure 6A, compared with the model group, the FAS treatment groups were able to alleviate weight loss in mice with a dose-dependent effect. The body weight loss of mice in the medium- and high-dose treatment groups of FAS was lower compared to the unfermented group. In all treatment groups, the disease activity index (DAI) scores decreased compared to the model group, with the highest reduction observed in the high-dose group of FAS (Figure 6B). As depicted in Figure 6C,D, the length of the colon was significantly longer in the FAS medium- and high-dose groups than in the model group (p < 0.001).
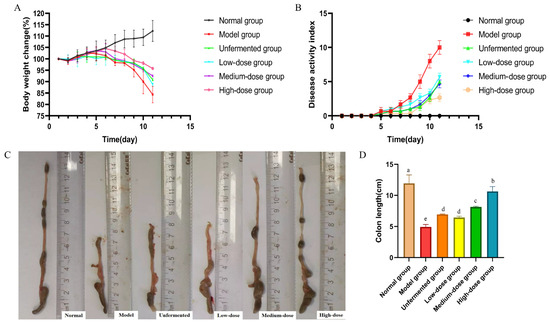
Figure 6.
Effects of FAS on colitis in mice. Body weight change. (A) DAI score during experimental colitis. (B) Images of the colon length. (C) Colonic length in mice. (D) Data are presented as mean ± SD, n = 6. Different letters represent significant difference on the different column (p < 0.05).
2.5. Histological Effects of FAS on Colitis
As shown in Figure 7A,B, it could be seen that the colonic mucosal tissues of mice in the model group were severely damaged, with the absence of glands, crypts, and cup cells, as well as a large number of inflammatory factors overflowing and a more severe cellular infiltration phenomenon. After different doses of FAS intervention, the damage in the colons of mice was reduced to varying degrees. The low-dose group showed less improvement in colitis than the model group, with only a small number of cupped cells present, and a low number of glands. The medium-dose group exhibited a more noticeable improvement in the colonic mucosa. Some cupped cells were arranged orderly, the number of glands was angular but unevenly distributed, and the overall structural damage was mild. However, the inflammatory cell infiltration was still more apparent. Colonic symptoms in the high-dose group were mild, mainly manifested by a more intact mucosal structure, partial detachment of mucosal epithelial cells, a slight infiltration of inflammatory cells around the glands, and a slight reduction in cupped cells.
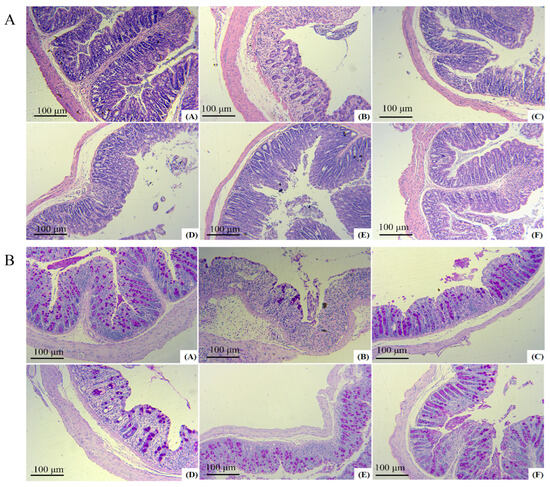
Figure 7.
Protective effects of FAS on the colon. H&E staining images of each group A. PAS staining images of each group B. Note: (A) represents the normal group, (B) represents the model group, (C) represents the unfermented group, (D) represents the low-dose group, (E) represents the medium-dose group, (F) represents the high-dose group.
2.6. Biochemical Analysis of the Serum
The levels of Alanine aminotransferase (ALT), catalase (CAT), malondialdehyde (MDA), myeloperoxidase (MPO), total antioxidant capacity (T-AOC), and total superoxide dismutase (T-SOD) were determined using a spectrophotometer following the experimental instructions provided by Nanjing Jiancheng Biological Engineering Research Institute Co., Ltd., Nanjing, China. The significant increase in MDA, ALT, and MPO contents in the serum of mice in the model group compared to that of the normal group (p < 0.05) was observed. Following treatment with AS and FAS, the MDA, ALT, and MPO contents significantly decreased in all treatment groups, with the most notable reduction seen in the high-dose group (p < 0.05). The CAT, T-AOC, and T-SOD activities were significantly reduced in the model group, while treatment with AS and FAS increased CAT, T-AOC, and T-SOD activities in all treatment groups. The most significant effect was observed in the high-dose group (p < 0.05). The effects of the medium- and high-dose groups were more efficient than those of the unfermented group (p < 0.05) (Figure 8).
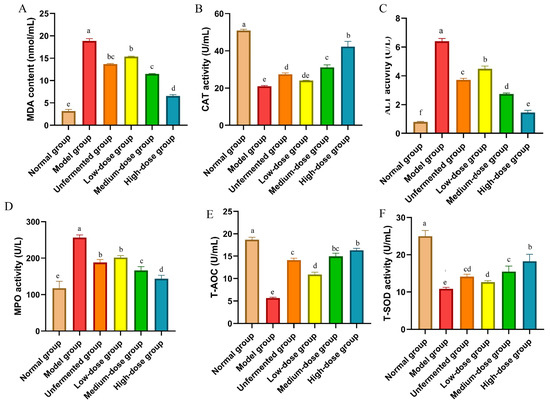
Figure 8.
Effects of FAS on expressing antioxidant parameters in the colon in DSS-induced colitis mice. (A) MDA. (B) CAT. (C) ALT. (D) MPO. (E) T-AOC. (F) T-SOD. Data are presented as mean ± SD, n = 6. Different letters represent significant difference on the different column (p < 0.05).
2.7. Influence of FAS on Bacterial Diversity
A flower plot was created using the results of operational taxonomic units (OTUs) to compare the similarity of OTUs at different taxonomic levels. Figure 9A shows that 184 OTUs were shared by all groups. Additionally, 266, 121, 147, 128, 140, and 127 OTUs were uniquely present in the normal group, model group, unfermented group, low-dose group, medium-dose group, and high-dose group, respectively. The normal group had the highest number of OTUs, and the model group had the lowest number of OTUs.
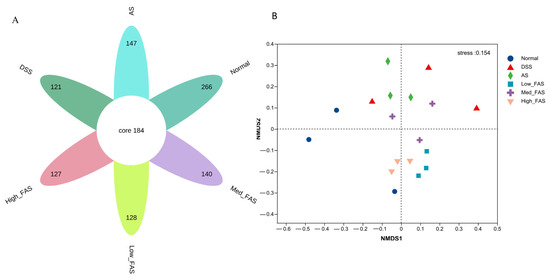
Figure 9.
The effects of FAS on the diversity of gut microbiota of DSS-induced colitis in mice. (A) Flower plot showing OTUs that differed in each group; (B) NMDS score plot showing the overall structure of gut microbiota.
As shown in Table 1, the Chao index, Ace index, and Shannon index in the model group were significantly lower than in the normal group (p < 0.05). The treatment groups increased the values of the Chao index, Ace index, and Shannon index. Additionally, the Chao index in the model group, and the Ace index and Shannon index in the medium-dose group were significantly higher than those in the model group (p < 0.05). The Simpson index in the model group was higher than in the other groups, but the difference was not significant (p > 0.05).

Table 1.
Alpha delivery analysis of the gut microbiota.
The NMDS analysis revealed a significant alteration in the structure of the gut microbiota in the model group. Following treatment with FAS and AS, a notable shift towards the normal group in the gut microbiota was observed (Figure 9B), with the high-dose group showing closer proximity to the normal group.
At the phylum level (Figure 10A), the composition of the phylum in the intestine was dominated by Firmicutes, Bacteroidota, Actinobacteriota, and Patescibacteria, which accounted for approximately 90% of the total abundance of the normal, DSS, AS, low_FAS, med_FAS, and high_FAS groups. The structure of the flora was similar among the groups, but the proportion of the composition varied greatly. Different doses of FAS had varying effects on the intestinal flora. The relative abundance of Bacteroidota in the DSS group increased compared to the normal group. Simultaneously, FAS treatment suppressed the trend of increasing Bacteroidota relative abundance and increased the relative abundance of Firmicutes in the intestine. At the genus level (Figure 10B), Staphylococcus and Lactobacillus were the two most abundant genera. The relative abundance of Staphylococcus was increased in the DSS group compared to the normal group, while the relative abundance of Lactobacillus decreased in the DSS group compared to the normal group. The AS and FAS altered the changes to some extent.
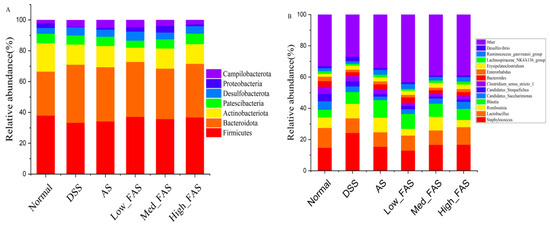
Figure 10.
FAS altered gut microbiota in mice with DSS-induced colitis. Gut microbiota abundance at the phylum level (A). Gut microbiota abundance at the genus level (B).
2.8. The Influence of FAS on the Gut Microbiome
The experimental results were also validated using a linear discriminant analysis (LDA), which showed that in Figure 11B, more significant LDA scores represented a greater effect of species abundance on the differential effect (p < 0.05). In the DSS group, Bacilli and Actinobacteria were identified as the dominant intestinal flora. Anaerotruncus, Tyzzerella, and Ruminococcaceae were the key phylotypes of the gut microbiota in the normal group. Pseudogracilibacillus was the dominant species in the AS group. Pseudogracilibacillus, Blautia, Ruminococcus_torques_group, uminococcus_gauvreauii_group, Butyricoccaceae, and Rhizobiales were the dominant species in different concentration groups of FAS, respectively.
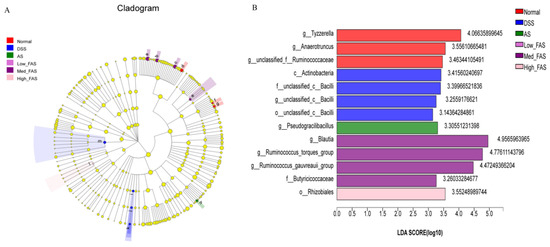
Figure 11.
Effects of FAS on the gut microbiota diversity. LEfSe analysis (A). LDA scores of the differentially abundant taxa (B). Note: a: g_Blautia; b: g_Ruminococcus_gauvreaui group; c: g_Ruminococcus_torques_group; d: g_Tyzzerella; e:f_Butyricicoccaceae; f: g_Anaerotruncus; g: g_unclassified_f_Ruminococcaceae; h: g_Pseudogracilibacillus; i: o_unclassified_c_Bacilli; j: f_unclassified_c_Bacilli; k: g_unclassified_c_ Bailli; l: o_Rhizobiales; m: c_Actinobacteria.
3. Discussion
Fermentation is one of the most widely used procedures, and it is constantly evolving as a technology for improving the nutritional value of plant-based food [18]. Much scientific evidence has demonstrated the high nutritional value and health benefits of fermented foods compared to the unfermented matrix. For example, they can increase immune defenses, have anti-inflammatory and antioxidant properties, and alleviate symptoms in colitis [19]. Present experiments have shown that components such as flavonoids and polyphenols are significantly increased when lactic acid bacteria ferment AS. This result is consistent with most of the literature [20,21]. The increase in polyphenols and flavonoids may be due to the conversion of bound polyphenols and flavonoids into free forms by lactic acid bacteria fermentation [22]. The decrease in saponin content may be attributed to some saponins being hydrolyzed [23].
Non-targeted metabolomics was used to investigate how LAB fermentation affects small molecule metabolites in AS. The results indicate that LAB fermentation substantially influences the components of AS, with 418 components increasing and 510 components decreasing. Among the differential metabolites, multiple compounds that benefit health and intestinal care were found. In particular, flavonoids with polyphenols increased the most. Non-targeted metabolomics studies showed that Delphinidin chloride increased by 5.41-fold, Diosmetin by 4.48-fold, Psoralidin by 4.37-fold, and Catechol by 48.78-fold, etc., and significantly increased in content compared to pre-fermentation. Catechins are natural polyphenols with antioxidant properties and have a variety of pharmacological effects, including anti-inflammatory, antioxidant, and antiviral effects [24]. Delphinidin chloride, a flavonoid compound, can modulate the JAK/STAT3 and MAPK signaling pathways and induce apoptosis in tumor cells [25].
Non-targeted metabolomics studies have shown that many anti-inflammatory and antimicrobial compounds undergo a significant increase after the fermentation of AS. For instance, Loxoprofen has increased by 14.28-fold after fermentation and is commonly used as an anti-inflammatory drug [26]. Nitrofurantoin content increased from 0.0305 before fermentation to 1.4692 after fermentation, which is an antibiotic compound [27]. Furthermore, 3-Phenyllactic acid showed a significant increase after fermentation (87-fold), making it an effective bacteriostatic drug [28]. Similar compounds that significantly increase after fermentation include 2,5-Dihydroxybenzaldehyde, DL-4-Hydroxyphenyllactic acid, Bialaphos, and Sorbic acid.
Additionally, in the untargeted metabolomics assay, we also observed a notable increase in compounds such as Cordycepin, Monotropein, Orientin, Engeletin, and Vitamin C. All these compounds are biologically active substances that benefit the health of the organism. Studies have shown that cordycepin alleviates inflammatory responses and oxidative stress in a variety of cells and regulates mitochondrial function [29]. Monotropein exerts its anti-tumor effects primarily by inhibiting Bcl-2 and increasing Bax, inducing G1–S cycle arrest in colorectal cancer. It might play an anti-cancer role through the Akt signaling pathway [30]. Orientin is a class of flavonoid carbon glycosides with pharmacological effects such as cardiovascular protection, anti-aging, anti-tumor, anti-inflammatory, and blood sugar regulation [31]. Therefore, the fermentation treatment can increase the content of numerous beneficial components in AS, which is advantageous for treating colitis in mice.
In this experiment, DSS-induced colitis model mice were used to evaluate the anti-inflammatory effect of FAS. Weight loss, loose stools, bleeding, and diarrhea were all observed in mice in the DSS-induced colitis model group, indicating that the mouse model of colitis has been successfully established. The AS and FAS treatments significantly ameliorated DSS-induced weight loss, diarrhea, and shortened colon in mice, indicating that AS and FAS have a therapeutic effect on colitis in mice. Furthermore, the treatment effect in the FAS medium-dose and FAS high-dose groups was better than that of the AS group.
Oxidative stress has been attributed as a pathogenic factor of colitis [32]. Antioxidant enzymes such as SOD, CAT, and AOC are severely decreased, while oxidative stress metabolites such as MDA and MPO show a significant rise. These changes have been linked to the onset and manifestations of colitis [33]. Many pieces of evidence indicate that relieving oxidative stress is useful in the treatment of UC [34]. In the present study, FAS significantly increased the levels of CAT, T-AOC, and T-SOD, and inhibited the levels of MDA, MPO, and ALT in DSS-induced colitis mice. Studies have shown that AS is effective in treating colitis because it is rich in flavonoids and polyphenols [35]. Flavonoids and polyphenols have good antioxidant activity, can relieve the symptoms of colitis, and can regulate the balance of intestinal flora [36,37]. In the present study, FAS had a higher content of flavonoids and polyphenols, which was more beneficial for the treatment of colitis.
The application of high-throughput and metagenetic sequencing technologies has led to the possibility of identifying and analyzing intestinal flora [38]. Many studies have shown that intestinal flora plays a role in the metabolism of nutrients, intestinal mucosal immunity, endocrine functions, and more [39]. The homeostasis of intestinal flora is crucial for the body’s health, garnering increasing attention from researchers and becoming a target for intervention in diseases [40]. Research on intestinal flora disorders in the pathogenesis and development of colitis is expanding. Data also indicate that several medicines, such as palmatine [41] and Valeriana jatamansi [42], can alleviate colitis by regulating intestinal flora.
Our study is consistent with the results of many studies. The balance of intestinal flora in colitis mice was obviously disturbed, and treating mice with FAS restored flora balance, which increased the number of OTUs and the degree of alpha diversity. However, the relative abundance of harmful bacteria (e.g., Escherichia, Erysipelotrichaceae, Staphylococcus, etc.) was decreased, and the relative abundance of beneficial bacteria (e.g., Lactobacillus, Parabacteroides, Lachnospiraceae, etc.) was increased. Lachnospiraceae functions as a probiotic by hydrolyzing starch and other sugars to produce butyric acid and other short-chain fatty acids [29]. Its abundance increased in the FAS group. The probiotic Lactobacillus also increased in the FAS-treated group. Erysipelotrichaceae is a harmful bacterium capable of causing arthritis in infected animals and symptoms of dengue [30]. Compared with the DSS group, FAS treatment reduced the abundance of Erysipelotrichaceae. Therefore, FAS has the potential to regulate the balance of the intestinal microbiota to alleviate the symptoms of colitis.
4. Materials and Methods
4.1. Animal
Sixty SPF male ICR rats, 5 weeks old and weighing 30 ± 2 g, were purchased from Jinan Pengyue Laboratory Animal Breeding Co., Ltd. (Jinan, China).
All animal experiments were conducted in accordance with the guidelines of the Animal Center of China. The ethics committee approved the animal experiment by the Institutional Animal Care and Use Committee of Liaocheng University (No: 2023022732).
4.2. LAB Strain and Growth Conditions
LAB were obtained from laboratory preservation strains, which were identified as lactobacillus pentosus. LAB were inoculated in De Man, Rogosa, and Sharpe (MRS) medium and incubated at 37 °C for 24 h. The concentration of bacteria was determined using a spectrophotometer at 600 nm.
4.3. Cellulase Hydrolysis of AS before Fermentation
A sterile conical flask was used to perform the hydrolysis of AS. A mass of 50 g of dried AS powder was accurately weighed and transferred to the conical flask. Citric acid buffers (0.01 M, pH 5.0) were used to regulate the pH and water content. The pH value was adjusted to 5.0, and the water content was regulated to 75%. Cellulase (10,000 units) was added to the AS powder for enzymatic digestion. Subsequently, the conical flask was placed in a water bath at 50 °C for 12 h, followed by sterilization for 20 min at 121 °C to inactivate enzymes and sterilize the solution.
4.4. LAB Fermentation of AS and Extracts Preparation
The mixing ratio of substrates was chosen based on the preliminary experiments. The sterilized samples were supplemented with 5% sucrose and inoculated with LAB at 1 × 10⁷ CFU/g, before being hermetically sealed. Subsequently, the mixture was placed in an incubator at 37 °C for 48 h. Throughout the fermentation process, samples were collected at various time points (0, 12, 24, 36, and 48 h) for further analysis. All conditions were the same in the control group, except for the absence of LAB inoculation. All the samples were tested in triplicate to ensure reproducibility. The extraction of unfermented AS and FAS samples was conducted using an ultrasonic-assisted extraction method. The extraction conditions were as follows: 60% ethanol as the extraction solvent, ultrasonic time of 40 min, ultrasonic power of 600 W, extraction temperature of 60 °C, and a material–liquid ratio of 1:30 (g: mL). After extraction, the extract was cooled, filtered, and centrifuged at 10,000 rpm for 10 min. The supernatant was collected, concentrated, and then freeze-dried for sequencing animal assays.
4.5. Measurement of the Active Ingredients
To compare the changes in the content of the active components of AS before and after fermentation, the phenol, the flavonoid, and saponin contents were determined. Phenol content was evaluated using the colorimetric Folin–Ciocalteu method, with Gallic acid as the standard. The flavonoid content was determined by spectrophotometry using the NaNO2-Al(NO3)3-NaOH system, with rutin as the reference. Saponin content was determined using the vanillin-sulfuric acid chromogenic method, with ginsenosides as the standard. Detailed measurement methods are described by Liu et al. [43].
4.6. Determination of LAB Viable Cell Counts and pH
Viable cell counts of LAB were determined using a standard plate counting method. A FE28 standard digital pH meter was utilized to measure the pH of the samples at various stages of the fermentation process [44].
4.7. Analysis of the Metabolite Profiles by Untargeted Metabolomics
The metabolite profiles of AS before and after fermentation were analyzed using untargeted metabonomic technology, and the differential metabolites were determined through multivariate statistical analysis methods. The extract was dissolved in an 80% methanol solution in water (v/v), then centrifuged at 15,000× g for 20 min at 4 °C. The supernatant was collected for subsequent experiments. UHPLC-MS/MS assays and services were conducted and supported by Wekemo Tech Group Co., Ltd. in Shenzhen, China. The procedures and steps are provided in the Supplementary Materials.
4.8. Animal Experiment of DSS-Induced Colitis in Mice
The mice were randomly divided into 6 groups (n = 6): a blank control group, a DSS model group, an AS group (200 mg/mL), a DSS + low FAS group (100 mg/mL), a DSS+ middle FAS group (200 mg/mL), and a DSS+ high FAS group (400 mg/mL), with 10 animals in each group. Each group was administered a dose of 10 mg/kg body weight via gavage for 11 d. The normal and DSS groups received saline via gavage; the AS group received an unfermented AS extract solution; and the FAS low, middle, and high groups received different concentrations of FAS extracts. Throughout the experiment, all groups were provided with purified drinking water from day 1 to day 3. From day 4 to day 10, the mice in the blank group continued to drink plain water, while the remaining groups were given a 3% DSS aqueous solution.
4.9. Assessment of Daily Disease Activity and Sample Collection
During the test period, the weight of the mice was recorded, and stool properties were observed. Fecal occult blood was detected using a hydrogen peroxide reagent. The Disease Activity Index (DAI) scores were calculated [45]. The scoring criteria are presented in Table S1. On day 11, the mice were euthanized. Their colons were promptly dissected and laid flat on a dissecting board to measure their length. Rectal fecal samples were collected in sterile E.P. tubes and frozen at −80 °C. Subsequently, blood samples were collected in the E.P. tubes and centrifuged at 5000 g for 5 min at 4 °C. The serum was then transferred to a new E.P. tube and stored at −80 °C.
4.10. Histological Changes of Colon Tissue
Colon specimens were fixed using 4% (w/v) paraformaldehyde for 24 h. Subsequently, the samples were paraffin-embedded, and 4 µm sections were sliced and stained with hematoxylin and eosin (HE) as well as periodic acid-Schiff stain (PAS), which was performed by Wuhan Servicebio Technology Co., Ltd. (Wuhan, China). The histopathological changes were examined under a light microscope.
4.11. Biochemical Analysis of Serum
The blood was collected from the eyes of mice and centrifuged at 5000 rpm for 5 min at 4 °C to obtain the serum. The levels of MDA, MPO, T-SOD, ALT, and T-AOC were measured in the serum using the spectrophotometric method with commercial kits from Nanjing Jiancheng Bioengineering Institute. The test was performed according to the instructions in the kit package insert. The OD value was determined by using a spectrophotometer (UV-8000, Yuanxin, Shanghai, China).
4.12. Gut Microbiota Analysis
The fecal samples were sent to Majorbio Bio-Pharm Technology Co., Ltd. (Shanghai, China) for 16S rRNA gene sequencing. Initially, DNA was extracted from the fecal samples using a DNA kit. The V3–V4 region of the bacterial 16S rRNA gene was amplified with primer pairs 338F (5′-ACTCCTACGGGAGGC AGCAG-3′) and 806R (5′-GGACTACHVGGGTWTCTAAT-3′). Sequencing was carried out using an Illumina MiSeq PE300 platform (Illumina, San Diego, CA, USA) in Majorbio Bio-Pharm Technology Co., Ltd. (Shanghai, China). The sequencing data processing and bioinformatics analysis were performed on the Majorbio, Cloud Platform, a free online platform (https://www.majorbio.com) (accessed on 1 March 2024).
4.13. Statistical Analysis
The statistical analysis was performed using GraphPad Prism 8.0 software. The data were expressed as mean ± standard deviation, and comparisons between groups were conducted using one-way ANOVA and LSD tests.
5. Conclusions
This study compared the composition changes of compounds before and after fermentation using untargeted metabolomics. It also contrasted the effects of fermented and unfermented compounds on a colitis mouse model. The experimental results indicate a significant increase in the content of beneficial flavonoids and saponins after fermentation. In a colitis mouse model, the treatment effect of fermented AS is superior, with studies demonstrating an increase in antioxidant capacity and a balance in the intestinal flora, suggesting its potential therapeutic mechanism, consistent with the pharmacological effects of flavonoids and polyphenols. The findings of this study also provide new insights for using LAB in fermenting medicinal plants. The next step involves investigating the mechanisms of change and the clinical effects of specific compounds that undergo significant changes during fermentation.
Supplementary Materials
The following supporting information can be downloaded at: https://www.mdpi.com/article/10.3390/molecules29174074/s1. Figure S1: The count plot of the compounds; Table S1: The score of DAI; Section S3: UHPLC-MS/MS analysis. The accession number(s) of the 16S rRNA sequence can be found at: https://www.ncbi.nlm.nih.gov/sra/PRJNA1148376 (accessed on 15 August 2024).
Author Contributions
Conceptualization, X.F. and Y.S.; methodology, X.F.; software, X.F.; validation, Y.S.; formal analysis, Y.S.; investigation, X.F.; resources, X.F.; data curation, Y.S.; writing—original draft preparation, Y.S.; writing—review and editing, Y.S.; visualization, X.F.; supervision, P.Z.; project administration, P.Z.; funding acquisition, P.Z. All authors have read and agreed to the published version of the manuscript.
Funding
This research was funded by Qingdao Upman Biotechnology Co. (No: 20240301).
Institutional Review Board Statement
The animal study protocol was approved by Ethics Committee of Liaocheng University (No: 2023022732).
Informed Consent Statement
Not applicable.
Data Availability Statement
Data will be made available on request.
Conflicts of Interest
The authors declare no conflicts of interest. The authors declare that this study received funding from Qingdao Upman Biotechnology Co. The funders had no role in study design, data collection and analysis, decision to publish, or preparation of the manuscript.
References
- Shi, H.; Zhao, Y.; Wang, W.; Zhou, Y.; Liang, Y.; Wu, R.; Wu, J. The potential of lactic acid bacteria in fermented herbs-derived food products. Food Biosci. 2024, 61, 104714. [Google Scholar] [CrossRef]
- Guo, N.; Zhu, Y.-W.; Jiang, Y.-W.; Li, H.-K.; Liu, Z.-M.; Wang, W.; Shan, C.-H.; Fu, Y.-J. Improvement of flavonoid aglycone and biological activity of mulberry leaves by solid-state fermentation. Ind. Crops Prod. 2020, 148, 112287. [Google Scholar] [CrossRef]
- Zhang, Y.; Ren, H.; Tang, X.; Liu, Q.; Xiao, W.; Zhang, Z.; Tian, Y. A GC × GC-MS method based on solid-state modulator for non-targeted metabolomics: Comparison with traditional GC-MS method. J. Pharm. Biomed. Anal. 2024, 243, 116068. [Google Scholar] [CrossRef] [PubMed]
- Du, J.; Li, X.; Liu, N.; Wang, Y.; Li, Y.; Jia, Y.; An, X.; Qi, J. Improving the quality of Glycyrrhiza stems and leaves through solid-state fermentation: Flavonoid content, antioxidant activity, metabolic profile, and release mechanism. Chem. Biol. Technol. Agric. 2024, 11, 105. [Google Scholar] [CrossRef]
- Li, Y.; Ma, Y.; Zhu, H.; Liu, Y.; Pan, S.; Chen, X.; Wu, T. Identifying distinct markers in two Sorghum varieties for baijiu fermentation using untargeted metabolomics and molecular network approaches. Food Chem. X 2024, 23, 101646. [Google Scholar] [CrossRef]
- Li, J.H.; Gu, F.T.; Yang, Y.; Zhao, Z.C.; Huang, L.X.; Zhu, Y.Y.; Chen, S.; Wu, J.Y. Simulated human digestion and fermentation of a high-molecular weight polysaccharide from Lentinula edodes mushroom and protective effects on intestinal barrier. Carbohydr. Polym. 2024, 343, 122478. [Google Scholar] [CrossRef] [PubMed]
- Wu, W.; Li, Q.; Chen, H.; Fang, X.; Niu, B.; Liu, R.; Mu, H.; Gao, H. In vitro fermentation characteristics of the dietary fiber in bamboo (Phyllostachys edulis) shoots and its regulatory effects on the intestinal microbiota and metabolites. Food Chem. 2023, 404, 134707. [Google Scholar] [CrossRef] [PubMed]
- Zhang, W.; Zou, M.; Fu, J.; Xu, Y.; Zhu, Y. Autophagy: A potential target for natural products in the treatment of ulcerative colitis. Biomed. Pharmacother. 2024, 176, 116891. [Google Scholar] [CrossRef]
- Yi, L.; Han, Y.; Shen, P.; Du, H.; Guo, X.; Zhou, Z.; Xiao, H. Dietary Porphyra tenera ameliorated dextran sodium sulfate-induced colitis in mice via modulating gut microbiota dysbiosis. Food Chem. 2024, 461, 140832. [Google Scholar] [CrossRef]
- Liu, Y.; Fang, H.; Liu, H.; Cheng, H.; Pan, L.; Hu, M.; Li, X. Goji berry juice fermented by probiotics attenuates dextran sodium sulfate-induced ulcerative colitis in mice. J. Funct. Foods 2021, 83, 104491. [Google Scholar] [CrossRef]
- Jang, S.-H.; Park, J.; Kim, S.-H.; Choi, K.-M.; Ko, E.-S.; Cha, J.-D.; Lee, Y.-R.; Jang, H.; Jang, Y.-S. Oral administration of red ginseng powder fermented with probiotic alleviates the severity of dextran-sulfate sodium-induced colitis in a mouse model. Chin. J. Nat. Med. 2017, 15, 192–201. [Google Scholar] [CrossRef] [PubMed]
- Huang, L.-Z.; Zhao, H.; Huang, B.; Zheng, C.; Peng, W.; Qin, L.J.D.P. Acanthopanax senticosus: Review of botany, chemistry and pharmacology. Pharm. Int. J. Pharm. Sci. 2011, 66, 83–97. [Google Scholar] [CrossRef]
- Jiang, Y.; Wang, M.-H. Different Solvent Fractions of Acanthopanax senticosus Harms Exert Antioxidant and Anti-Inflammatory Activities and Inhibit the Human Kv1.3 Channel. J. Med. Food 2014, 18, 468–475. [Google Scholar] [CrossRef] [PubMed]
- Kim, G.-D.; Lee, J.; Auh, J.-H. Metabolomic screening of anti-inflammatory compounds in Acanthopanax sessiliflorus fruit (Ogaza) extract. Appl. Biol. Chem. 2024, 67, 56. [Google Scholar] [CrossRef]
- Kim, H.K.; Kim, M.-G.; Leem, K.-H. Extrusion process of Acanthopanax senticosus leaves enhances the gastroprotective effect of compound 48/80 on acute gastric mucosal lesion in rats. J. Tradit. Chin. Med. 2016, 36, 187–196. [Google Scholar] [CrossRef]
- Ma, Y.-H.; Sheng, Y.-D.; Zhang, D.; Liu, J.-T.; Tian, Y.; Li, H.; Li, X.-F.; Li, N.; Sun, P.; Siddiqui, S.A.; et al. Acanthopanax senticosus cultures fermented by Lactobacillus rhamnosus enhanced immune response through improvement of antioxidant activity and inflammation in crucian carp (Carassius auratus). Microb. Pathog. 2024, 190, 106614. [Google Scholar] [CrossRef]
- Kim, M.J.; Wang, H.S.; Lee, M.W. Anti-inflammatory effects of fermented bark of AS and its isolated compounds on lipopolysaccharide-treated RAW 264.7 macrophage cells. Evid. -Based Complement. Altern. Med. eCam 2020, 2020, 6749425. [Google Scholar] [CrossRef]
- Hur, S.J.; Lee, S.Y.; Kim, Y.-C.; Choi, I.; Kim, G.-B. Effect of fermentation on the antioxidant activity in plant-based foods. Food Chem. 2014, 160, 346–356. [Google Scholar] [CrossRef]
- Zhang, Y.; Zhang, J.; Yan, J.; Qi, X.; Wang, Y.; Zheng, Z.; Liang, J.; Ling, J.; Chen, Y.; Tang, X.; et al. Application of fermented Chinese herbal medicines in food and medicine field: From an antioxidant perspective. Trends Food Sci. Technol. 2024, 148, 104410. [Google Scholar] [CrossRef]
- Shumoy, H.; Gabaza, M.; Vandevelde, J.; Raes, K. Soluble and bound phenolic contents and antioxidant capacity of tef injera as affected by traditional fermentation. J. Food Compos. Anal. 2017, 58, 52–59. [Google Scholar] [CrossRef]
- Aung, T.; Eun, J.-B. Production and characterization of a novel beverage from laver (Porphyra dentata) through fermentation with kombucha consortium. Food Chem. 2021, 350, 129274. [Google Scholar] [CrossRef] [PubMed]
- Sarkar, P.; Abedin, M.M.; Singh, S.P.; Pandey, A.; Rai, A.K. 8—Microbial production and transformation of polyphenols. In Current Developments in Biotechnology and Bioengineering; Rai, A.K., Singh, S.P., Pandey, A., Larroche, C., Soccol, C.R., Eds.; Elsevier: Amsterdam, The Netherlands, 2022; pp. 189–208. [Google Scholar] [CrossRef]
- Zhou, H.; Jiang, J.; Zhao, Q.; Wang, Z.; Li, L.; Gao, Q.; Wang, K. Performance of high solids enzymatic hydrolysis and bioethanol fermentation of food waste under the regulation of saponin. Bioresour. Technol. 2023, 387, 129486. [Google Scholar] [CrossRef] [PubMed]
- Musial, C.; Kuban-Jankowska, A.; Gorska-Ponikowska, M. Beneficial Properties of Green Tea Catechins. Int. J. Mol. Sci. 2020, 21, 1744. [Google Scholar] [CrossRef] [PubMed]
- Sun, S.; Xu, K.; Yan, M.; Cui, J.; Zhu, K.; Yang, Y.; Zhang, X.; Tang, W.; Huang, X.; Dou, L.; et al. Delphinidin induces autophagic flux blockage and apoptosis by inhibiting both multidrug resistance gene 1 and DEAD-box helicase 17 expressions in liver cancer cells. J. Pharm. Pharmacol. 2023, 75, 253–263. [Google Scholar] [CrossRef]
- Kurauchi, Y.; Ryu, S.; Tanaka, R.; Haruta, M.; Sasagawa, K.; Seki, T.; Ohta, J.; Katsuki, H. Goreisan regulates cerebral blood flow according to barometric pressure fluctuations in female C57BL/6J mice. J. Pharmacol. Sci. 2024, 154, 47–51. [Google Scholar] [CrossRef]
- Maaland, M.G.; Jakobsen, L.; Guardabassi, L.; Frimodt-Møller, N. Pharmacokinetic and pharmacodynamic evaluation of nitrofurantoin against Escherichia coli in a murine urinary tract infection model. APMIS J. Pathol. Microbiol. Immunol. 2024, 132, 492–498. [Google Scholar] [CrossRef]
- Thierig, M.; Raupbach, J.; Wolf, D.; Mascher, T.; Subramanian, K.; Henle, T. 3-Phenyllactic Acid and Polyphenols Are Substances Enhancing the Antibacterial Effect of Methylglyoxal in Manuka Honey. Foods 2023, 12, 1098. [Google Scholar] [CrossRef]
- Yan, B.; Gong, Y.; Meng, W.; Sun, H.; Li, W.; Ding, K.; Dang, C.; Gao, X.; Sun, W.; Yuan, C.; et al. Cordycepin protects islet β-cells against glucotoxicity and lipotoxicity via modulating related proteins of ROS/JNK signaling pathway. Biomed. Pharmacother. 2023, 163, 114776. [Google Scholar] [CrossRef]
- Qiang, J.; Yang, R.; Li, X.; Xu, X.; Zhou, M.; Ji, X.; Lu, Y.; Dong, Z. Monotropein induces autophagy through activation of the NRF2/PINK axis, thereby alleviating sepsis-induced colonic injury. Int. Immunopharmacol. 2024, 127, 111432. [Google Scholar] [CrossRef]
- Mazibuko-Mbeje, S.E.; Mthembu, S.X.H.; Tshiitamune, A.; Muvhulawa, N.; Mthiyane, F.T.; Ziqubu, K.; Muller, C.J.F.; Dludla, P.V. Orientin Improves Substrate Utilization and the Expression of Major Genes Involved in Insulin Signaling and Energy Regulation in Cultured Insulin-Resistant Liver Cells. Molecules 2021, 26, 6154. [Google Scholar] [CrossRef]
- Ordás, I.; Eckmann, L.; Talamini, M.; Baumgart, D.C.; Sandborn, W.J. Ulcerative colitis. Lancet 2012, 380, 1606–1619. [Google Scholar] [CrossRef] [PubMed]
- Wang, G.; Xiu, P.; Li, F.; Xin, C.; Li, K. Vitamin A Supplementation Alleviates Extrahepatic Cholestasis Liver Injury through Nrf2 Activation. Oxidative Med. Cell. Longev. 2014, 2014, 273692. [Google Scholar] [CrossRef]
- Lee, Y.; Sugihara, K.; Gillilland, M.G.; Jon, S.; Kamada, N.; Moon, J.J. Hyaluronic acid–bilirubin nanomedicine for targeted modulation of dysregulated intestinal barrier, microbiome and immune responses in colitis. Nat. Mater. 2020, 19, 118–126. [Google Scholar] [CrossRef]
- Su, J.; Zhang, X.; Kan, Q.; Chu, X. Antioxidant Activity of Acanthopanax senticosus Flavonoids in H2O2-Induced RAW 264.7 Cells and DSS-Induced Colitis in Mice. Molecules 2022, 27, 2872. [Google Scholar] [CrossRef] [PubMed]
- Xu, F.; Yu, P.; Wu, H.; Wang, X.; Liu, M.; Liu, H.; Zeng, Q.; Wu, D. Therapeutic effect of total flavonoids of Sargentodoxa cuneata on ulcerative colitis in mice by correcting gut dysbiosis. Arab. J. Chem. 2024, 17, 105566. [Google Scholar] [CrossRef]
- Yang, C.; Yang, W.; Wang, Y.; Du, Y.; Zhao, T.; Shao, H.; Ren, D.; Yang, X. Nonextractable Polyphenols from Fu Brick Tea Alleviates Ulcerative Colitis by Controlling Colon Microbiota-Targeted Release to Inhibit Intestinal Inflammation in Mice. J. Agric. Food Chem. 2024, 72, 7397–7410. [Google Scholar] [CrossRef] [PubMed]
- Davidson, R.M.; Epperson, L.E. Microbiome Sequencing Methods for Studying Human Diseases. Methods Mol. Biol. 2018, 1706, 77–90. [Google Scholar] [CrossRef]
- Pham, V.T.; Dold, S.; Rehman, A.; Bird, J.K.; Steinert, R.E. Vitamins, the gut microbiome and gastrointestinal health in humans. Nutr. Res. 2021, 95, 35–53. [Google Scholar] [CrossRef]
- Qiu, P.; Ishimoto, T.; Fu, L.; Zhang, J.; Zhang, Z.; Liu, Y. The Gut Microbiota in Inflammatory Bowel Disease. Front. Cell. Infect. Microbiol. 2022, 12, 733992. [Google Scholar] [CrossRef]
- Zhang, X.-J.; Yuan, Z.-W.; Qu, C.; Yu, X.-T.; Huang, T.; Chen, P.V.; Su, Z.-R.; Dou, Y.-X.; Wu, J.-Z.; Zeng, H.-F.; et al. Palmatine ameliorated murine colitis by suppressing tryptophan metabolism and regulating gut microbiota. Pharmacol. Res. 2018, 137, 34–46. [Google Scholar] [CrossRef]
- Wang, L.; Zhang, H.; Tang, F.; Yan, H.; Feng, W.; Liu, J.; Wang, Y.; Tan, Y.; Chen, H. Therapeutic Effects of Valeriana jatamansi on Ulcerative Colitis: Insights into Mechanisms of Action through Metabolomics and Microbiome Analysis. J. Proteome Res. 2023, 22, 2669–2682. [Google Scholar] [CrossRef] [PubMed]
- Liu, R.; Chu, X.; Su, J.; Fu, X.; Kan, Q.; Wang, X.; Zhang, X. Enzyme-Assisted Ultrasonic Extraction of Total Flavonoids from Acanthopanax senticosus and Their Enrichment and Antioxidant Properties. Processes 2021, 9, 1708. [Google Scholar] [CrossRef]
- Peñas, E.; Martínez-Villaluenga, C.; Pihlava, J.M.; Frias, J. Evaluation of refrigerated storage in nitrogen-enriched atmospheres on the microbial quality, content of bioactive compounds and antioxidant activity of sauerkrauts. LWT Food Sci. Technol. 2015, 61, 463–470. [Google Scholar] [CrossRef]
- Eijkelkamp, N.; Heijnen, C.J.; Lucas, A.; Premont, R.T.; Elsenbruch, S.; Schedlowski, M.; Kavelaars, A. G protein-coupled receptor kinase 6 controls chronicity and severity of dextran sodium sulphate-induced colitis in mice. Gut 2007, 56, 847–854. [Google Scholar] [CrossRef] [PubMed]
Disclaimer/Publisher’s Note: The statements, opinions and data contained in all publications are solely those of the individual author(s) and contributor(s) and not of MDPI and/or the editor(s). MDPI and/or the editor(s) disclaim responsibility for any injury to people or property resulting from any ideas, methods, instructions or products referred to in the content. |
© 2024 by the authors. Licensee MDPI, Basel, Switzerland. This article is an open access article distributed under the terms and conditions of the Creative Commons Attribution (CC BY) license (https://creativecommons.org/licenses/by/4.0/).