Abstract
Atenolol (ATE) and propranolol (PRO) inclusion complexes with β-cyclodextrin have been investigated in aqueous solution. The aqueous solution was examined and characterized using UV–vis, fluorescence spectroscopy, and 1H NMR. The physical mixture was characterized using FTIR. The existence of inclusion complexes is confirmed by observing changes in spectroscopic properties. The ATE complex with β-CD exhibited an interaction as host and (β-CD) as a guest in a 1:1 ratio, with an inclusion constant K of 2.09 × 10⁻³ µM−1, as determined by the typical double-reciprocal graphs. Similarly, the PRO complex with β-CD exhibited an interaction as host and (β-CD) guest in 1:1 and 1:2 stoichiometry at the same time; the inclusion constants were K1 = 5.80 × 10⁻⁵ µM−1 and K2 = 4.67 × 10⁻⁸ µM−1, as determined by typical double-reciprocal graphs. The variables influencing the formation of the inclusion complexes were investigated and optimized. Based on the enhancement in fluorescence intensity due to the formation of inclusion complexes, spectrofluorometric methods were developed and validated for determination of each drug’s pharmaceutical formulation. The quantification of the fluorescence intensity for ATE and PRO was conducted at λex/λem 226/302 nm and λex/λem 231/338 nm, respectively. Under the optimal reaction circumstances, linear relationships with good correlation coefficients of 0.9918 and 0.99 were found in the concentration ranges of 0.3–1.7 μM, and 0.1–1.1 μM for ATE and PRO, respectively. The limits of detection (LODs) were found to be 0.13 and 0.01 μM for ATE and PRO, respectively. The suggested approach was effectively applied to the analysis of both drugs’ pharmaceutical formulations.
1. Introduction
Cyclodextrins (CDs) are chiral oligosaccharides that have a cyclic, truncated cone form and are made up of glucopyranose units linked together by (α-1-4) glucoside bonds [1]. The inside of the truncated cone is typically hydrophobic in nature, and thus, effectively traps many chemicals, particularly medications, whereas the external boundary of the truncated cone exhibits many hydroxyl groups, which contribute to its hydrophilic nature (Figure 1a) [2]. The formation of an inclusion complex has a substantial influence on the physicochemical characteristics of the guest molecule, including its solubility, spectroscopic properties, and electrochemical properties. These properties have been used in the pharmaceutical industry precisely to enhance the bioavailability and solubility of medication, by acting as conveyors for chemical compounds in biological cells and organisms [3,4]. From an analytical perspective, the incorporation of compounds enhances the emission intensity [5,6,7,8,9], and induces the separation of chiral compounds in capillary electrophoresis (CE) [10,11]. Moreover, in pharmaceutical and environmental samples, the fluorescent behavior of trapped drugs with CDs was successfully used to create several methods for identifying different chemicals [12,13].
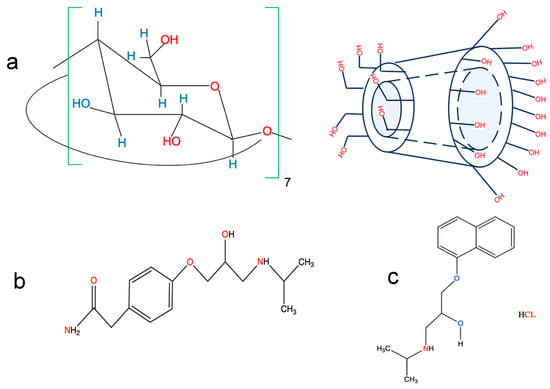
Figure 1.
Chemical structures of (a) β-CD, (b) atenolol (ATE), and (c) propranolol (PRO).
β-blockers are commonly given as cardiovascular medications. These medications are utilized in the treatment of cardiovascular conditions, angina pectoris, including hypertension, myocardial infarction, and cardiac arrhythmias [14]. Atenolol (ATE) 4-(2-hydroxy-3-isopropyl-aminopropoxy) phenylacetamide, is a cardio-selective β-blocker. It can be used independently or in combination with other antihypertensive drugs, such as hydralazine, prazosin, α-methyldopa, and thiazide-type diuretics (Figure 1b) [15]. Moreover, propranolol HCL–(PRO), (RS)-2-(4-(2-methylpropyl)phenyl)-2-propanol is the drug that has been used the most in clinical settings and indications. It is used to treat tremors, angina, hypertension, and heart rhythm disorders (Figure 1c) [16].
β-blockers have poor solubility in aqueous medium; therefore, the low solubility rate and the variability of their bioavailability directly affect the efficiency of the drug. Therefore, with the purpose of increasing the solubility, ATE and PRO were complexed with β-CD and with 2-hydroxypropyl-β-CD to form inclusion complexes [17,18]. A literature survey reveals that some methods have been used to determine ATE and PRO individually in pharmaceutical formulations and biological fluids like capillary electrophoresis [19,20], spectrophotometric methods [21,22], high-performance liquid chromatography [15,23], spectrofluorometric methods [24,25], and gas chromatography [26,27].
The inclusion complexes of ATE and PRO with β-CD were studied in solution and investigated using various spectroscopic techniques such as UV–vis spectroscopy, fluorescence spectroscopy, and 1H NMR; further, Fourier transform infrared spectroscopy (FTIR) was used for investigation of physical mixtures. To the best of our knowledge spectrofluorometric methods based on inclusion complex formation of ATE and PRO with β-CD have not been reported. Therefore, this work is devoted to the validation and development of spectrofluorometric methods for the determination of ATE and PRO in pharmaceutical formulation.
2. Results and Discussion
2.1. Absorption Spectral Characterizations
The absorption spectra of ATE and PRO were measured without and with the addition of 6 × 10³ μM β-CD, and the results are presented in Figure 2a and Figure 2b, respectively. The obtained results indicate that the wavelengths at which ATE and PRO exhibited the highest absorption wavelengths at pH 7.0 were 226 nm and 231 nm. Following the incorporation of β-CD in the solution, the wavelength of maximum absorbance remained constant. However, there was a slight increase in absorbance, leading to an increase in molar absorptivity coefficients ε (L·mol−1·cm−1) from 22,800 to 36,500 and 5800 to 16,300, for ATE and PRO, respectively.
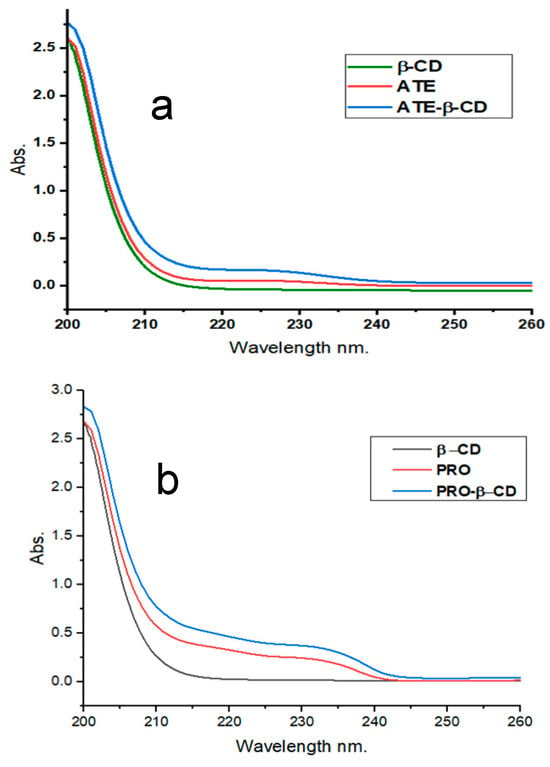
Figure 2.
Absorbance spectra for (a) ATE-β-CD, 10 μM ATE, 6 × 10³ μM β-CD, for time 10 min, at room temperature, pH 7.0; and (b) 10 μM PRO, 6 × 10³ μM β-CD, for time 10 min, at room temperature, pH 7.0.
2.2. Analysis of Infrared Spectra
In the infrared spectrum of ATE (Figure 3a), the bands were identified as follows: 3342 cm−1 for symmetric and asymmetric stretching N-H, 2961 cm−1 for alcoholic OH, 1631 cm−1 for C=O amide, and 1235 cm−1 for alkyl aryl ether. The aforementioned observations match with the FTIR spectra relating to ATE as documented in reference [21]. A number of changes in the FTIR spectra were observed after the formation of the ATE-β-CD inclusion complex. The band assigned to the N-H stretching disappeared. The band assigned to the OH group was weaker and shifted towards shorter wavelengths, to 2910 cm−1. The C=O amide band at 1636 cm−1 was shifted towards shorter wavelengths, to 1635 cm−1, and was weaker. Furthermore, the O-H in the β-CD band at 3391 cm−1 was shifted towards shorter wavelengths, to 3199 cm−1, and was weaker in the inclusion complex than in the original β-CD spectrum. The IR spectrum of the PRO (Figure 3b) includes several bands; first, at 3270 cm−1 belonging to the secondary OH group, 2919 cm−1 to N-H stretching, 1104 cm−1 for the aryl alkyl ether; also, the band at 768 cm−1 belongs to α-substituted naphthalene. The aforementioned observations match with the FTIR spectra relating to PRO as documented in reference [28]. Obviously, there were significant alterations in the FTIR spectra after the complex PRO-β-CD formed. The secondary OH group band at 3299 cm−1 was shifted to approximately 3300 cm−1. The band at 2919 cm−1 for NH stretching was shifted to a shorter wavelength at 2900 cm−1. The band belonging to the aryl alkyl ether at 1104 cm−1 was shifted to 1019 cm−1. Also, the band belonging to the α-substituted naphthalene at 768 cm−1was shorter, weaker, and shifted to a longer wavelength (blue shift), to 769 cm−1. The previously mentioned alterations can possibly be attributed to variations in the microenvironment, which contribute to van der Waals forces, and the existence of hydrogen bonding during the connection between them, which eventually leads to the formation of the complexes of inclusion between ATE and PRO and β-CD in the solid physical mixture.
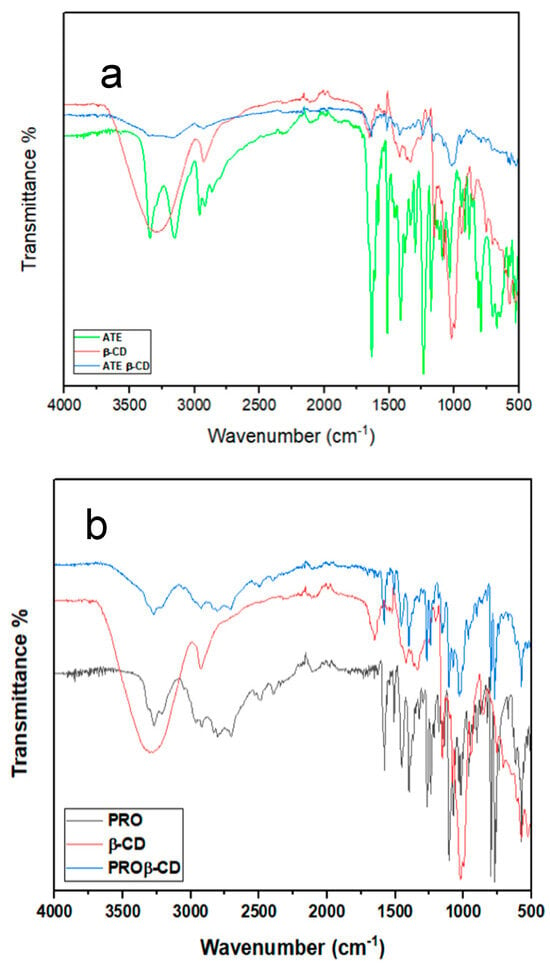
Figure 3.
FTIR spectra of (a) ATE, β-CD, and ATE-β-CD (b) PRO, β-CD, and PRO-β-CD.
2.3. 1H NMR Spectroscopy
One of the efficient methods for studying CDs complexation is 1H NMR spectroscopy [29,30]. The possibility of forming an inclusion complex can possibly be determined by analyzing the 1H NMR chemical shift pattern of the cyclodextrin (CD) and the guest molecule. Hydrophobic interactions, van der Waals forces, and hydrogen bonds are examples of non-covalent bonds that connect host and guest molecules. Their chemical shifts will change if the guest molecules ATE and PRO are trapped in the cyclodextrin β-CD cavity. The 1H chemical shift values of ATE and PRO, both before incorporation and after the formation of the inclusion complex, are shown in Table 1 and Figures S1 and S2. The values obtained clearly demonstrate that complexation induced significant chemical shifts in the ATE and PRO protons, providing confirmation of the formation of the complexes.

Table 1.
NMR of ATE and PRO and the shift after complexation with β-CD.
2.4. Emission Spectra Characterizations
Fluorescence spectroscopy is a highly sensitive and selective tool for studying host–guest molecular systems. Fluorescence analysis has significant advantages in terms of its enhanced selectivity and ability to quantify much lower concentrations when compared to spectrophotometric analysis. Initially, analysis was conducted on the spectral characteristics of ATE and PRO. The study findings indicated that the maximal emission wavelengths of ATE and PRO at pH 7.0 were 297 nm and 338 nm, respectively. When β-CD was added into each drug flask, the fluorescence intensity rose, at the same time, the emission’s maximum wavelength remained consistent, as demonstrated in Figure 4a,b. The explanation of this occurrence may be attributed to the fact that ATE and PRO are introduced into the hydrophobic cavity of β-CD, where they are included by non-covalent bondings such as hydrogen bonding and van der Waals forces.
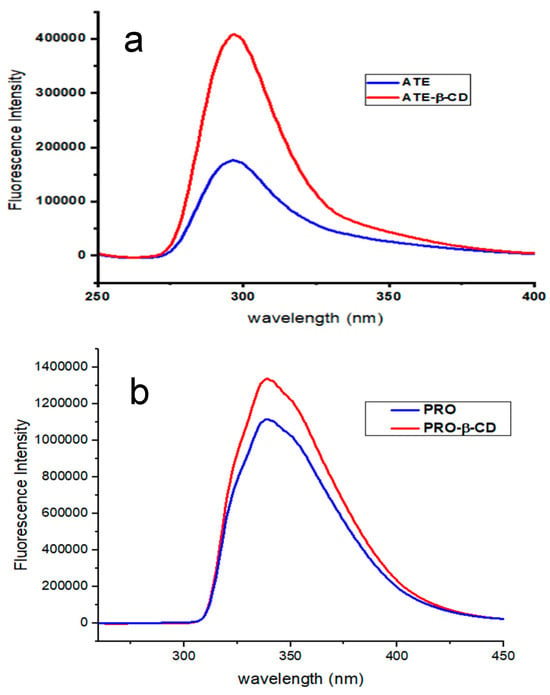
Figure 4.
Emission spectra of (a) ATE-β-CD, 10 μM ATE, 6 × 10³ μM β-CD, in 10 min period, at room temperature, pH 7.0; and (b) PRO-β-CD, 10 μM PRO, 6 × 10³ μM β-CD, in 10 min period, at room temperature, pH 7.0.
2.5. Optimization of Parameters Affecting Inclusion Complex Formation
Several factors that affect the inclusion complex formation such as the pH of the buffer, the complexation time, and the concentration of β-CD were studied.
2.5.1. Optimization of the pH of the Inclusion Complexes
The pH has a significant impact on the formation of ATE and PRO inclusion complexes with β-CD. The pH was examined in the range from 2 to 9, and the results are presented in Figure 5a,b. The results indicate that the fluorescence intensity initially remained constant, then rose sharply at pH 3.0 for ATE and at pH 6.0 for PRO; after that, it dropped back to its original values. The optimum pH values for the inclusion complexes are therefore determined to be 3.0 and 6.0, respectively. The pKa value for ATE is reportedly 9.6 and for PRO 9.4 [31]. This confirms that the protonated form is the most suitable for the inclusion complexes.
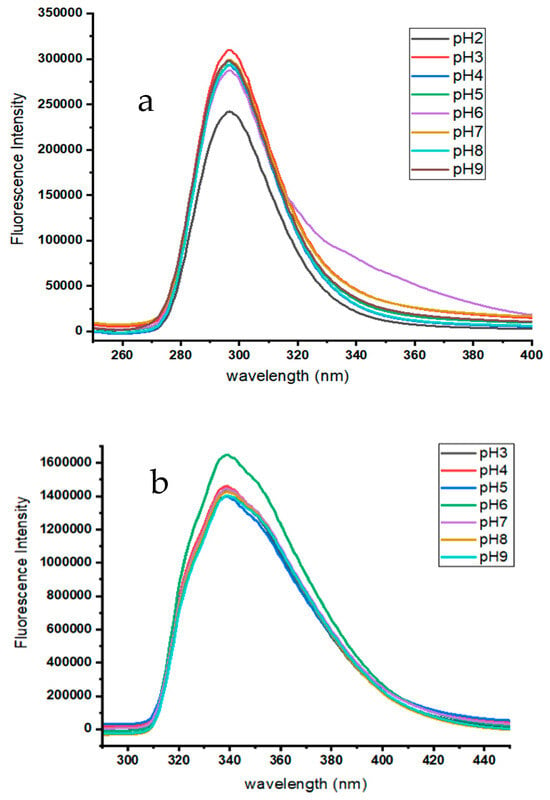
Figure 5.
Emission spectra: (a) ATE-β-CD in series of pH from pH 2.0 to pH 9.0. 10 μM ATE; 200 μM β-CD; at room temperature; time 10 min; the highest fluorescence intensity was at pH 3.0. (b) PRO-β-CD in series of pH from pH 3.0 to pH 9.0. 10 μM PRO; 200 μM β-CD; at room temperature; time 10 min; the highest fluorescence intensity was at pH 6.0.
2.5.2. Optimization of the Complexation Time
The effect of time on the fluorescence intensity of the complexes formation of ATE and PRO with β-CD was studied. The experiment was conducted at room temperature; in range from 5 to 25 min; the results obtained indicate that the highest fluorescence intensity readings were obtained at 10 and 20 min for ATE and PRO, respectively.
2.5.3. Optimization of β-CD Concentration
In order to optimize the β-CD concentration, the drug’s concentration was kept constant at 10 μM, whereas the β-CD concentration was varied between 50 and 600 μM, and 50 and 400 μM for ATE and PRO, respectively. The fluorescence intensity increased steadily until it reached a stable inclusion complex at 400 and 200 μM for ATE and PRO, respectively. Above this point the fluorescence intensity remained constant, as shown in Figure 6a,b. Therefore, these values were used as optimum values.
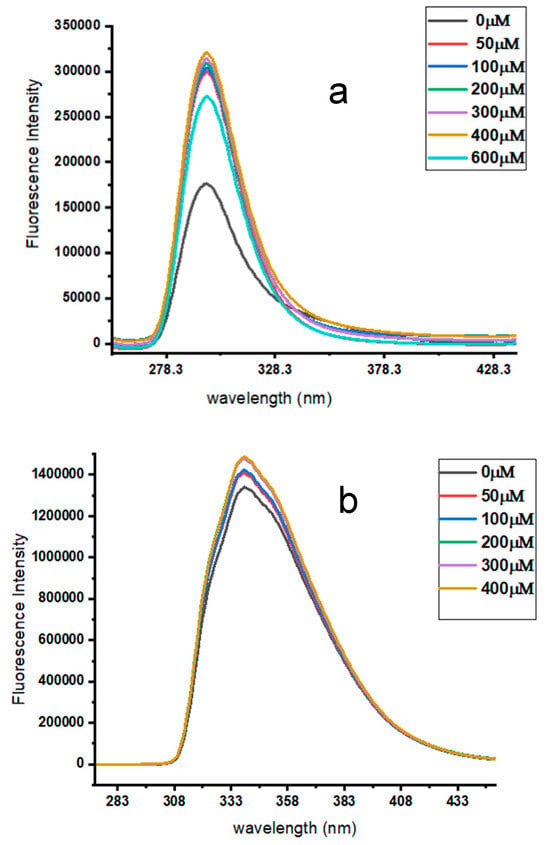
Figure 6.
Emission spectra of (a) 10 μM ATE with different concentrations of β-CD, from 50 μM to 600 μM, for a time of 10 min, pH 3.0, at room temperature; and (b) 10 μM PRO with different concentrations of β-CD, from 50 to 400 μM, in a time of 10 min, pH 6.0, at room temperature.
2.6. Stoichiometry of Inclusion Complexes
The stoichiometry of the inclusion complexes were analyzed using the experimental parameters that had been optimized earlier. It was assumed that the complexes had a 1:1 ratio. The study included an analytical technique, namely, Benesi–Hildebrand plots. The equation is formulated as follows: 1/F − F0 = 1/(F∞ − F0)K[β-CD0] + 1/F∞ − F0. In this equation, F∞ represents the fluorescence intensity when the majority of drug molecules are trapped in β-CD, [β-CD0] represents the initial concentration of β-CD, and F represents the observed fluorescence intensity at every measured concentration of β-CD. Plots of 1/F − F0 vs. 1/[β-CD0] (Figure 7a,b) suggest a 1:1 stoichiometry for the ATE-β-CD and PRO-β-CD complexes, with inclusion constants of K = 2.09 × 10⁻³ µM−1 and K = 5.80 × 10−05 µM−1, respectively. In order to precisely evaluate the value of c, the determination of the stoichiometric ratio, assuming 1:2 inclusion complexes with β-CD, a plot of 1/F − F0 = 1/(F∞ − F0)K2([β-CD0])2+1/F∞ − F0 is used. By plotting 1/(F − F0) as a function of 1/[β-CD]2 (Figure 8a) a linear correlation was obtained that confirmed that there is a possibility to form both 1:1 and 1:2 inclusion complexes of PRO with β-CD at the same time. However, by plotting 1/(F − F0) as a function of 1/[β-CD]2 for ATE-β-CD (Figure 8b), the non-linearity can be observed, from which it can be concluded that the stoichiometry of the complex is 1:1 [32].
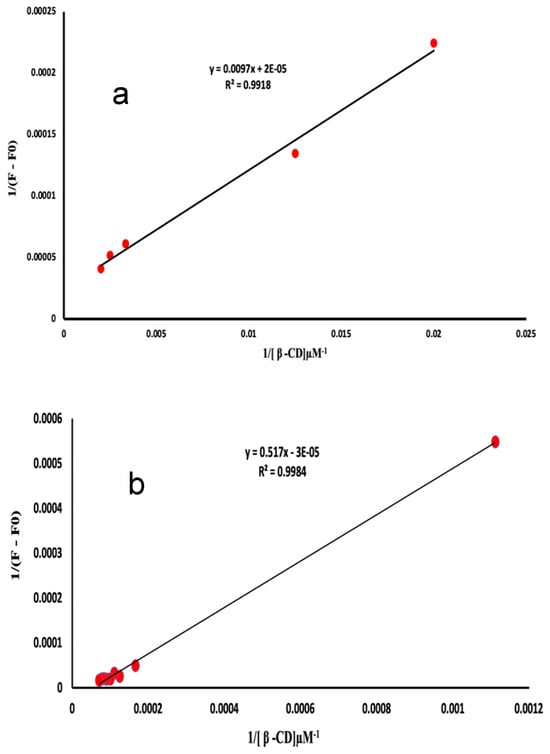
Figure 7.
Plot of (a) 1/(F − F0) vs. 1/[β-CD] of ATE-β-CD complex, 10 μM ATE, pH 3.0; and (b) plot of 1/(F − F0) vs. 1/[β-CD] of PRO-β-CD complex, 10 μM PRO, pH 6.0.
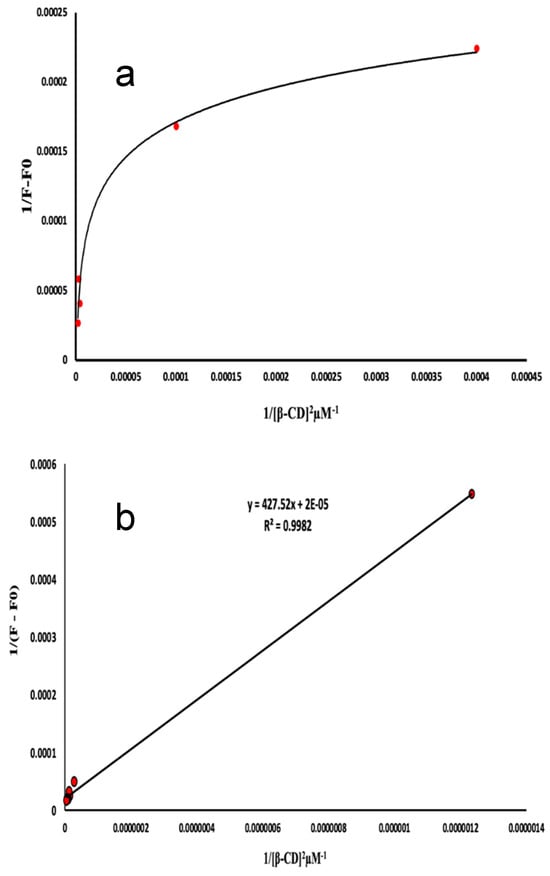
Figure 8.
Plot of (a) 1/(F − F0) vs. 1/[β-CD]2 of PRO-β-CD complex, 10 μM PRO, pH 6.0; and (b) plot of 1/(F − F0) vs. 1/[β-CD]2 of ATE-β-CD complex, 10 μM ATE, pH 3.0.
2.7. Validation of the Analytical Methods
The analytical procedures were validated in terms of linearity, and limits of detection (LODs) and quantification (LOQs), precision, accuracy, and robustness in accordance with international conference harmonization (ICH) [33].
2.7.1. Linearity, LODs, and LOQs
The suggested procedures showed a linear relationship for ATE-β-CD with a good correlation coefficient (n = 8) for concentrations ranging from 0.3 to 1.7 μM. A linear plot was generated by PRO-β-CD with n = 6, and showed a good correlation coefficient within the concentration range of 0.1–1.1 μM. Table 2 shows the quantitative parameters and statistical data. The LODs and LOQs were found to be 0.13 and 0.40 μM, and 0.01 and 0.3 μM, for ATE and PRO, respectively.

Table 2.
Parameters for ATE-β-CD and PRO-β-CD spectrofluorimetric methods.
2.7.2. Accuracy and Precision of Spectrofluorometric Methods
The accuracy and precision of the suggested procedures were assessed by examining three triplicate samples at three different concentration levels of ATE and PRO. The results obtained exhibit a significant level of consistently and accuracy (Table 3), indicating the reliability of the procedure. The high precision was ideal to use for assurance of the quality of ATE and PRO in their pharmaceutical formulation.

Table 3.
The accuracy and precision of ATE-β-CD and PRO-β-CD.
2.7.3. Robustness of Spectrofluorometric Methods
Robustness was assessed by analyzing how slight parameter changes affected the analytical results. In these experiments, the recovery was calculated on each case as a single parameter was modified while keeping the others constant. Consequently, it was found that minor changes in the technique parameters did not have a major effect on the operations. The recovery values are shown in Table 4.

Table 4.
Robustness of the spectrofluorometric method for ATE-β-CD and for PRO-β-CD.
2.7.4. Analysis of Pharmaceutical Formulations
The proposed methods were successfully used for analysis of pharmaceutical formulations of ATE and PRO with acceptable accuracy. The percentage values for ATE and PRO were 103% and 100%, respectively, based on five determinations, as presented in Table 5.

Table 5.
The method applied for analysis of ATE and PRO in pharmaceutical formulations.
3. Experimental
3.1. Chemical Reagents
β-CD, monobasic and dibasic sodium phosphate, ATE, and PRO standards were purchased from Sigma-Aldrich (St. Louis, MO, USA).
3.2. Instruments and Apparatus
The Shimadzu RF 6000 spectrofluorometer was used for conducting fluorescence spectra and intensity measurements, manufactured by Shimadzu in Japan (Kyoto, Japan), which included a 150 W xenon lamp. The spectrophotometric measurements were performed using a Shimadzu UV-1650 pc double-beam ultraviolet–visible spectrophotometer from Japan, which included a 50 W halogen lamp and a deuterium lamp. Also, IR was recorded using a spectrometer (Cary 630 FTIR). 1H NMR spectra were run using a Bruker Ascend 400 spectrometer (Bruker, Billerica, MA, USA) with the TopSpin 3.5 software.
3.3. Preparation of Standard Solutions of Drugs and Cyclodextrin
A volume of 1000 μM of ATE stock solution was made by dissolving 6.6 mg of ATE in phosphate buffer at pH 3.0; similarly, 1000 μM of PRO stock solution was generated by dissolving 7.4 mg of PRO in phosphate buffer at pH 6.0; both solutions were placed into a 25 mL standard flask and phosphate buffer with the same pH was added to them in order to achieve dilution. In order to prepare a β-CD stock solution of 15,000 μM, 1.7 g was submerged in deionized water then poured into a 100 mL standard flask, and then, more deionized water was added in order to achieve dilution.
3.4. Buffer Solutions
Buffer solutions with pH values of 6.0 and 7.0 were prepared by utilizing 0.1 M NaH2PO4 and 0.1 M Na2HPO4. Additionally, 0.1 M H3PO4 and 0.1 M NaH2PO4 were used to prepare a buffer solution with a pH of 3.0, which was adjusted using a pH meter.
3.5. UV–Visible Spectroscopy Measurement
Into separate 10 mL volumetric flasks, 0.1 mL of each drug solution was placed. Subsequently, a volume of 4 mL of the solution of β-CD was transferred to each flask. The remaining volume in each flask was then filled with phosphate buffer at pH 7.0. The final mixed solutions were exposed to oscillation at room temperature by putting them in a sonicator bath for a duration of 10 min. Next, the absorbance spectra were determined at wavelengths of 226 nm and 231 nm, for ATE and PRO, respectively.
3.6. Fluorescence Measurement
A volume of 0.1 mL of ATE (1000 μM) and 4 mL of β-CD were placed into a 10 mL volumetric flask. The final mixture was completed and diluted to the desired volume using a buffer solution of phosphate of pH 3.0 to obtain the final concentration of 10 μM. The flask was put in the sonicator at ambient temperature for 10 min. The fluorescence intensity of the complex formed was measured at λex/λem 226/297 nm. Similarly, PRO-β-CD was prepared with 0.1 mL of PRO (1000 μM) and 4 mL of β-CD added into a 10 mL volumetric flask to obtain the final concentration of 10 μM. The final mixture was completed and diluted to the desired concentration with phosphate buffer at pH 6.0, after that, the flask was put in the sonicator at ambient temperature for 10 min. The intensity of fluorescence of the inclusion complex formed by PRO and β-CD was analyzed at λex/λem 231/338 nm.
3.7. Determination of Stochiometric Ratio
The inclusion complexes’ stochiometric ratios were investigated using Benesi–Hildebrand plots. The equation is formulated as follows: 1/F − F0 = 1/(F∞ − F0)K[β-CD0] + 1/F∞ − F0. In this equation, F∞ represents the fluorescence intensity when the majority of drug molecules are trapped in β-CD, [β-CD0] represents the initial concentration of β-CD, and F represents the observed fluorescence intensity at every measured β-CD concentration.
3.8. Limits of Detection (LODs) and Limits of Quantification (LODs)
The LODs and LOQs were calculated using the following equation: LOD or LOQ = K. SDa/b, where the symbol K denotes the value 3.3 in the case of calculating LOD, and in the case of calculating LOQ is 10. The symbol SDa refers to the standard deviation of the intercept, whereas b represents the slope.
4. Conclusions
This research provided evidence that β-CDs have the ability to function as guest-complexing agents. The use of UV–visible spectroscopy, fluorescence spectroscopy, 1H NMR, and FTIR demonstrated the formation of inclusion complexes between ATE and PRO with β-CD. The methods are designed to accurately detect each drug when β-CD is present by increasing fluorescence intensity during complexation formation. The methods are simple and sensitive, comprehensively validated, and successfully employed for analysis of the two drugs in their pharmaceutical formulations.
Supplementary Materials
The following supporting information can be downloaded at: https://www.mdpi.com/article/10.3390/molecules29122875/s1, Figure S1. 1H-NMR spectra for (a) β-CD, (b) free ATE (c) ATE-β-CD complex in D2O. The molar ratio of βCD: guest is 1:1. Figure S2. 1H-NMR spectra for (a) β-CD, (b) free PRO (c) PRO-β-CD complex in D2O. The molar ratio of β-CD: guest is 1:2.
Author Contributions
Conceptualization, A.A.E.; Methodology, H.A.; Validation, H.A.; Investigation, H.A.; Writing—original draft, H.A. and A.A.E.; Writing—review & editing, A.O.A.; Supervision, A.A.E. and A.O.A.; Funding acquisition, H.A. All authors have read and agreed to the published version of the manuscript.
Funding
The authors are grateful to the Deanship of Scientific Research and Vice Presidency for Graduate Studies and Scientific Research of King Faisal University, Saudi Arabia, for their financial support via the annual financing program [GRANT No. 343].
Institutional Review Board Statement
Not applicable.
Informed Consent Statement
Not applicable.
Data Availability Statement
The data presented in this study are available in article and Supplementary Materials.
Conflicts of Interest
The authors declare no conflict of interest.
References
- Ali, S.M.; Shamim, S. Structure Elucidation of Benzhexol-β-Cyclodextrin Complex in Aqueous Medium by 1H NMR Spectroscopic and Computational Methods. J. Encapsulation Adsorpt. Sci. 2014, 4, 63–70. [Google Scholar]
- Brewster, M.E.; Loftsson, T. Cyclodextrins as Pharmaceutical Solubilizers. Adv. Drug Deliv. Rev. 2007, 59, 645–666. [Google Scholar] [CrossRef] [PubMed]
- Diez, N.M.; de la Peña, A.M.; García, M.C.M.; Gil, D.B.; Cañada-Cañada, F. Fluorimetric Determination of Sulphaguanidine and Sulphamethoxazole by Host-Guest Complexation in β-Cyclodextrin and Partial Least Squares Calibration. J. Fluoresc. 2007, 17, 309–318. [Google Scholar] [CrossRef] [PubMed]
- Elbashir, A.A.; Dsugi, N.F.A.; Aboul-Enein, H.Y. Supramolecular Study on the Interaction Between Ofloxacin and Methyl β-Cyclodextrin by Fluorescence Spectroscopy and Its Analytical Application. J. Fluoresc. 2014, 24, 355–361. [Google Scholar] [CrossRef] [PubMed]
- Zhang, Y.; Zhu, Y.X.; Huang, G.L.; Ren, F.; Zheng, F.L.; Kim, S.J. Room Temperature Phosphorescence from Inclusion Complex of Beta-Cyclodextrin and 1-Bromonaphthalene in the Presence of Phenol and 1-Butanol. Bull. Korean Chem. Soc. 2001, 22, 1397–1399. [Google Scholar]
- Linares, M.; de Bertorello, M.M.; Longhi, M. Solubilization of Naphthoquinones by Complexation with Hydroxypropyl-β-Cyclodextrin. Int. J. Pharm. 1997, 159, 13–18. [Google Scholar] [CrossRef]
- Xie, H.; Wang, H.Y.; Ma, L.Y.; Xiao, Y.; Han, J. Spectrophotometric Study of the Inclusion Complex between β-Cyclodextrin and Dibenzoyl Peroxide and Its Analytical Application. Spectrochim. Acta A Mol. Biomol. Spectrosc. 2005, 62, 197–202. [Google Scholar] [CrossRef] [PubMed]
- Chao, J.; Meng, D.; Li, J.; Xu, H.; Huang, S. Preparation and Study on the Novel Solid Inclusion Complex of Ciprofloxacin with HP-β-Cyclodextrin. Spectrochim. Acta A Mol. Biomol. Spectrosc. 2004, 60, 729–734. [Google Scholar] [CrossRef]
- Chao, J.B.; Tong, H.B.; Liu, D.S.; Huang, S.P. Preparation and Characterization of Inclusion Complexes of Pefloxacin Mesylate with Three Kinds of Cyclodextrins. Spectrochim. Acta A Mol. Biomol. Spectrosc. 2006, 64, 166–170. [Google Scholar] [CrossRef]
- Elbashir, A.A.; Saad, B.; Mohamed Ali, A.S.; Saleh, M.I.; Aboul-Enein, H.Y. Determination of Ofloxacin Enantiomers in Pharmaceutical Formulations by Capillary Electrophoresis. J. Liq. Chromatogr. Relat. Technol. 2007, 31, 348–360. [Google Scholar] [CrossRef]
- Suliman, F.E.O.; Elbashir, A.A. Enantiodifferentiation of chiral baclofen by β-cyclodextrin using capillary electrophoresis: A molecular modeling approach. J. Mol. Struct. 1019, 2012, 43–49. [Google Scholar] [CrossRef]
- Elbashir, A.A.; Dsugi, N.F.A.; Mohmed, T.O.M.; Aboul-Enein, H.Y. Spectrofluorometric Analytical Applications of Cyclodextrins. Luminescence 2014, 29, 1–7. [Google Scholar] [CrossRef] [PubMed]
- Elbashir, A.A.; Altayib Alasha Abdalla, F.; Aboul-Enein, H.Y. Host-guest inclusion complex of mesalazine and β-cyclodextrin and spectrofluorometric determination of mesalazine. Luminescence 2015, 30, 444–450. [Google Scholar] [CrossRef] [PubMed]
- Al-Ghannam, S.M. A Simple Spectrophotometric Method for the Determination of Beta-Blockers in Dosage Forms. J. Pharm. Biomed. Anal 2006, 40, 151–156. [Google Scholar] [CrossRef] [PubMed]
- de Abreu, L.R.P.; de Castro, S.A.C.; Pedrazzoli, J. Atenolol Quantification in Human Plasma by High-Performance Liquid Chromatography: Application to Bioequivalence Study. AAPS PharmSci. 2003, 5, 21. [Google Scholar] [CrossRef] [PubMed]
- Mohammed, I.S.; Ibrahim, M.K.; Al, A.F.D. A Simple and Sensitive Colorimetric Method for the Determination of Propranolol Hydrochloride in Pure and Pharmaceutical Preparation via Oxidative Coupling Organic Reaction. J. Pharm. Sci. 2018, 10, 3025–3030. [Google Scholar]
- Ficarra, R.; Ficarra, P.; Di Bella, M.R.; Raneri, D.; Tommasini, S.; Calabrò, M.L.; Villari, A.; Coppolino, S. Study of the Inclusion Complex of Atenolol with Beta-Cyclodextrins. J. Pharm. Biomed. Anal 2000, 23, 231–236. [Google Scholar] [CrossRef]
- Nikolić, V.; Nikolić, L.; Stanković, M.; Kapor, A.; Popsavin, M.; Cvetković, D. A Molecular Inclusion Complex of Atenolol with 2-Hydroxypropyl-β- Cyclodextrin; the Production and Characterization Thereof. J. Serbian Chem. Soc. 2007, 72, 737–746. [Google Scholar] [CrossRef]
- Arias, R.; Jiménez, R.M.; Alonso, R.M.; Télez, M.; Arrieta, I.; Flores, P.; Ortiz-Lastra, E. Determination of the Beta-Blocker Atenolol in Plasma by Capillary Zone Electrophoresis. J. Chromatogr. A 2001, 916, 297–304. [Google Scholar] [CrossRef] [PubMed]
- Assi, K.A.; Clark, B.J.; Altria, K.D. Enantiomeric Purity Determination of Propranolol by Capillary Electrophoresis Using Dual Cyclodextrins and a Polyacrylamide-Coated Capillary. Electrophoresis 1999, 20, 2723–2725. [Google Scholar] [CrossRef]
- de Castro, R.A.E.; Canotilho, J.; Barbosa, R.M.; Redinha, J.S. Infrared Spectroscopy of Racemic and Enantiomeric Forms of Atenolol. Spectrochim. Acta A Mol. Biomol. Spectrosc. 2007, 67, 1194–1200. [Google Scholar] [CrossRef] [PubMed]
- Habeeb, E.D.H.; Sulaiman, I.D. Spectrophotometric Determination of Propranolol Hydrochloride via Oxidative Coupling Reaction with 2, 4-Dinitrophenyl Hydrazine. Int. J. Drug Deliv. Technol. 2021, 11, 29–35. [Google Scholar]
- Bhavar, G.; Chatpalliwar, V.A. Quantitative Analysis of Propranolol Hydrochloride by High Performance Thin Layer Chromatography. Indian J. Pharm. Sci. 2008, 70, 395–398. [Google Scholar] [PubMed]
- Abdine, H.; Sultan, M.A.; Hefnawy, M.M.; Belal, F. Spectrofluorometric Determination of Some Beta-Blockers in Tablets and Human Plasma Using 9,10-Dimethoxyanthracene-2-Sodium Sulfonate. Pharmazie 2005, 60, 265–268. [Google Scholar] [PubMed]
- Madrakian, T.; Afkhami, A.; Mohammadnejad, M. Simultaneous Spectrofluorimetric Determination of Levodopa and Propranolol in Urine Using Feed-Forward Neural Networks Assisted by Principal Component Analysis. Talanta 2009, 78, 1051–1055. [Google Scholar] [CrossRef] [PubMed]
- Yilmaz, B.; Arslan, S. GC–MS Determination of Atenolol Plasma Concentration after Derivatization with N-Methyl-N-(Trimethylsilyl)Trifluoroacetamide. Chromatographia 2009, 70, 1399–1404. [Google Scholar] [CrossRef]
- Di Salle, E.; Baker, K.M.; Bareggi, S.R.; Watkins, W.D.; Chidsey, C.A.; Frigerio, A.; Morselli, P.L. A Sensitive Gas Chromatographic Method for the Determination of Propranolol in Human Plasma. J. Chromatogr. 1973, 84, 347–353. [Google Scholar] [CrossRef] [PubMed]
- Hernawan, H.; Nurhayati, S.; Nisa, K.; Indrianingsih, A.W.; Darsih, C.; Kismurtono, M. formulation and in vitro study of propranolol hydrochloride controlled release from carboxymethyl chitosan-based matrix tablets. Indones. J. Chem. 2013, 13, 242–247. [Google Scholar] [CrossRef][Green Version]
- Sompornpisut, P.; Deechalao, N.; Vongsvivut, J. An Inclusion Complex of β-Cyclodextrin-L-Phenylalanine: 1H NMR and Molecular Docking Studies. ScienceAsia 2002, 28, 263. [Google Scholar] [CrossRef]
- Upadhyay, S.K.; Ali, S.M. Solution Structure of Loperamide and β-Cyclodextrin Inclusion Complexes Using NMR Spectroscopy. J. Chem. Sci. 2009, 121, 521–527. [Google Scholar] [CrossRef]
- Raoufi, A.; Ebrahimi, M.; Bozorgmehr, M.R. Application of Response Surface Modeling and Chemometrics Methods for the Determination of Atenolol, Metoprolol and Propranolol in Blood Sample Using Dispersive Liquid-Liquid Microextraction Combined with HPLC-DAD. J. Chromatogr. B Anal. Technol. Biomed. Life Sci. 2019, 1132, 121823. [Google Scholar] [CrossRef] [PubMed]
- Nevado, J.J.; Pulgarín, J.A.; Laguna, M.A. Spectrofluorimetric Study of the Beta-Cyclodextrin:Vitamin K3 Complex and Determination of Vitamin K3. Talanta 2001, 53, 951–959. [Google Scholar] [CrossRef] [PubMed]
- Borman, P.; Elder, D. Q2(R1) Validation of Analytical Procedures: Text and Methodology. In ICH Quality Guidelines; Teasdale, A., Elder, D., Nims, R.W., Eds.; Wiley: Hoboken, NJ, USA, 2017; pp. 127–166. [Google Scholar]
Disclaimer/Publisher’s Note: The statements, opinions and data contained in all publications are solely those of the individual author(s) and contributor(s) and not of MDPI and/or the editor(s). MDPI and/or the editor(s) disclaim responsibility for any injury to people or property resulting from any ideas, methods, instructions or products referred to in the content. |
© 2024 by the authors. Licensee MDPI, Basel, Switzerland. This article is an open access article distributed under the terms and conditions of the Creative Commons Attribution (CC BY) license (https://creativecommons.org/licenses/by/4.0/).