
Evidence of a Proximity Effect in a (AgI)x − C(1−x) Mixture Using a Simulation Model Based on Random Variable Theory


Abstract
1. Introduction
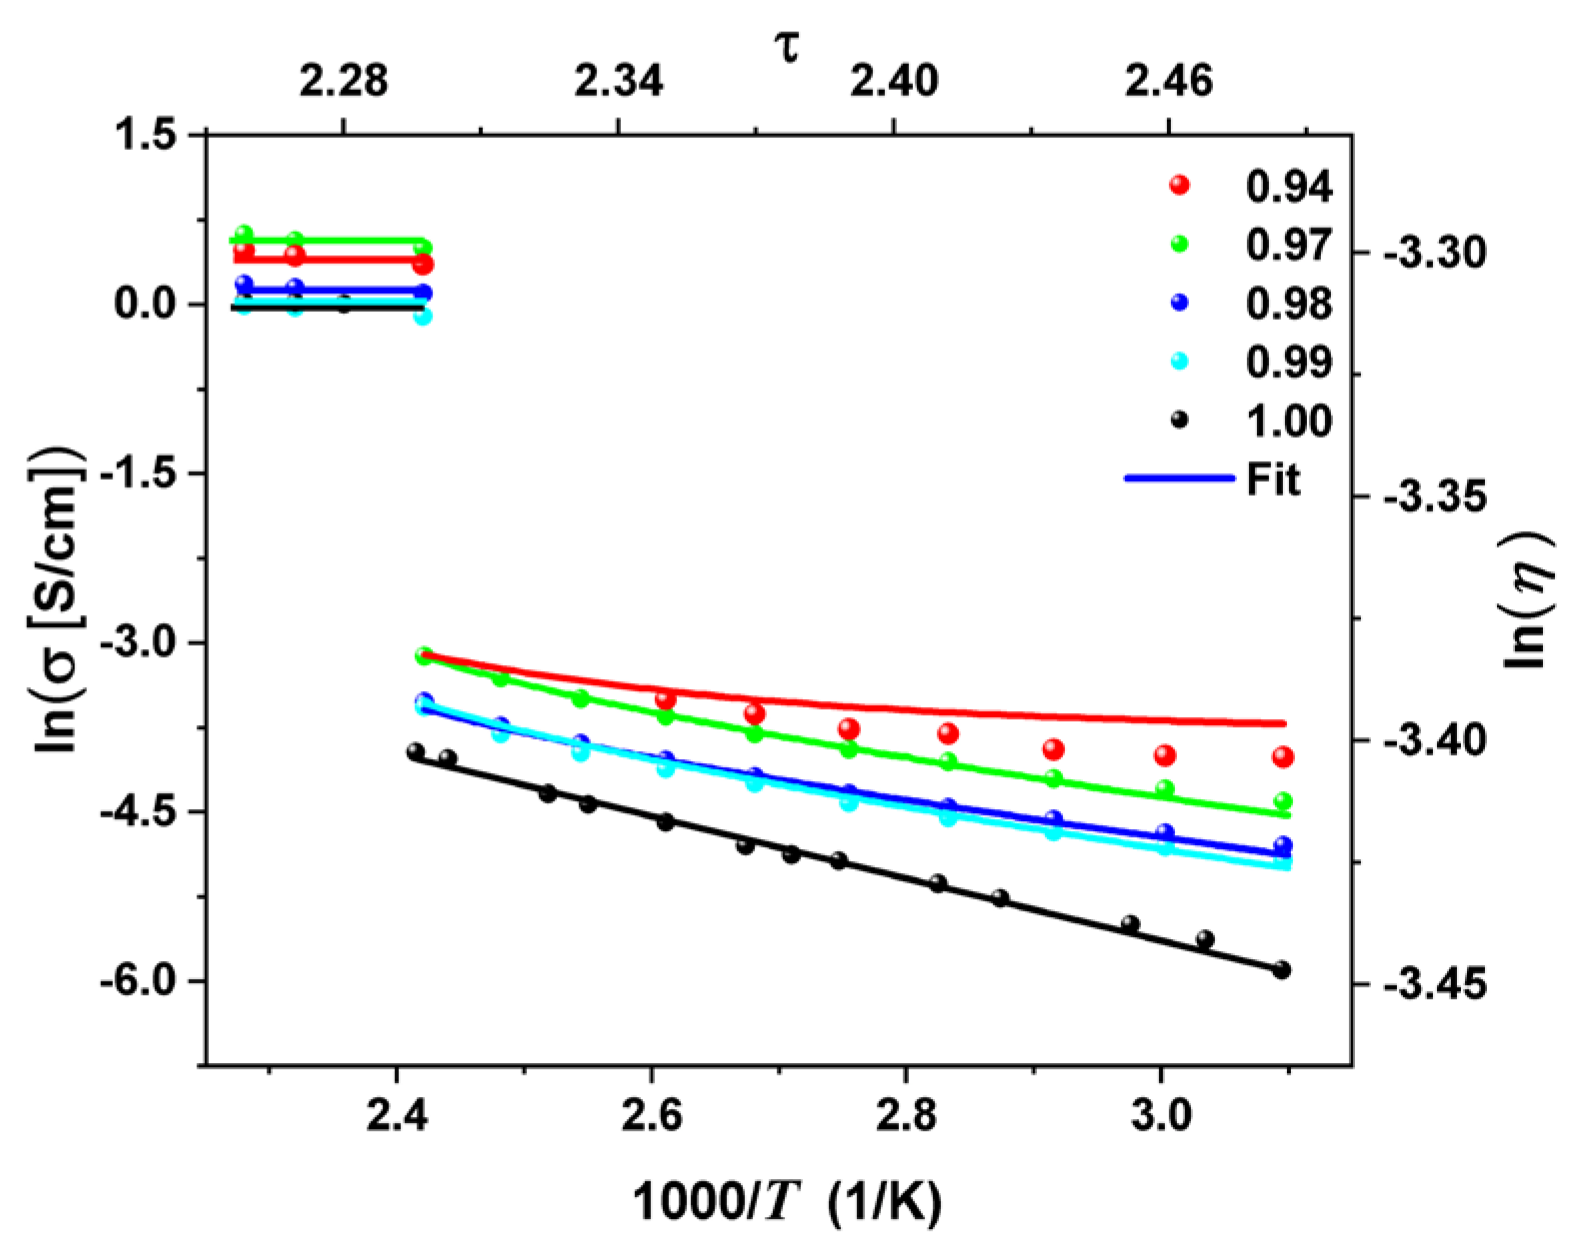
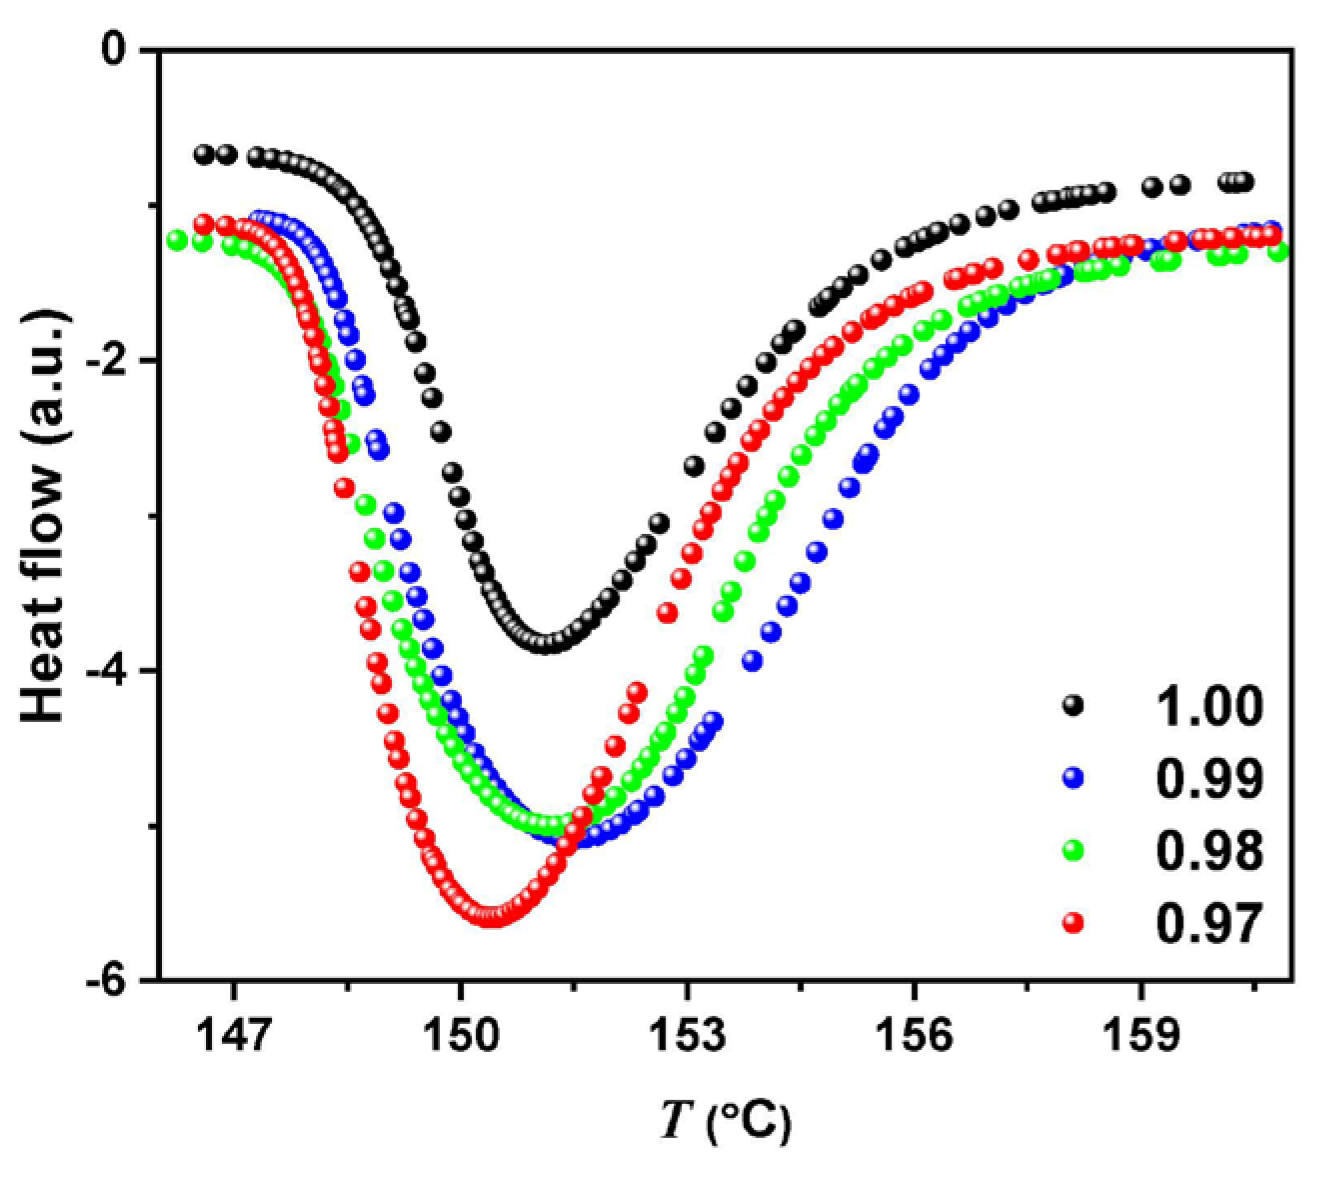
2. Results
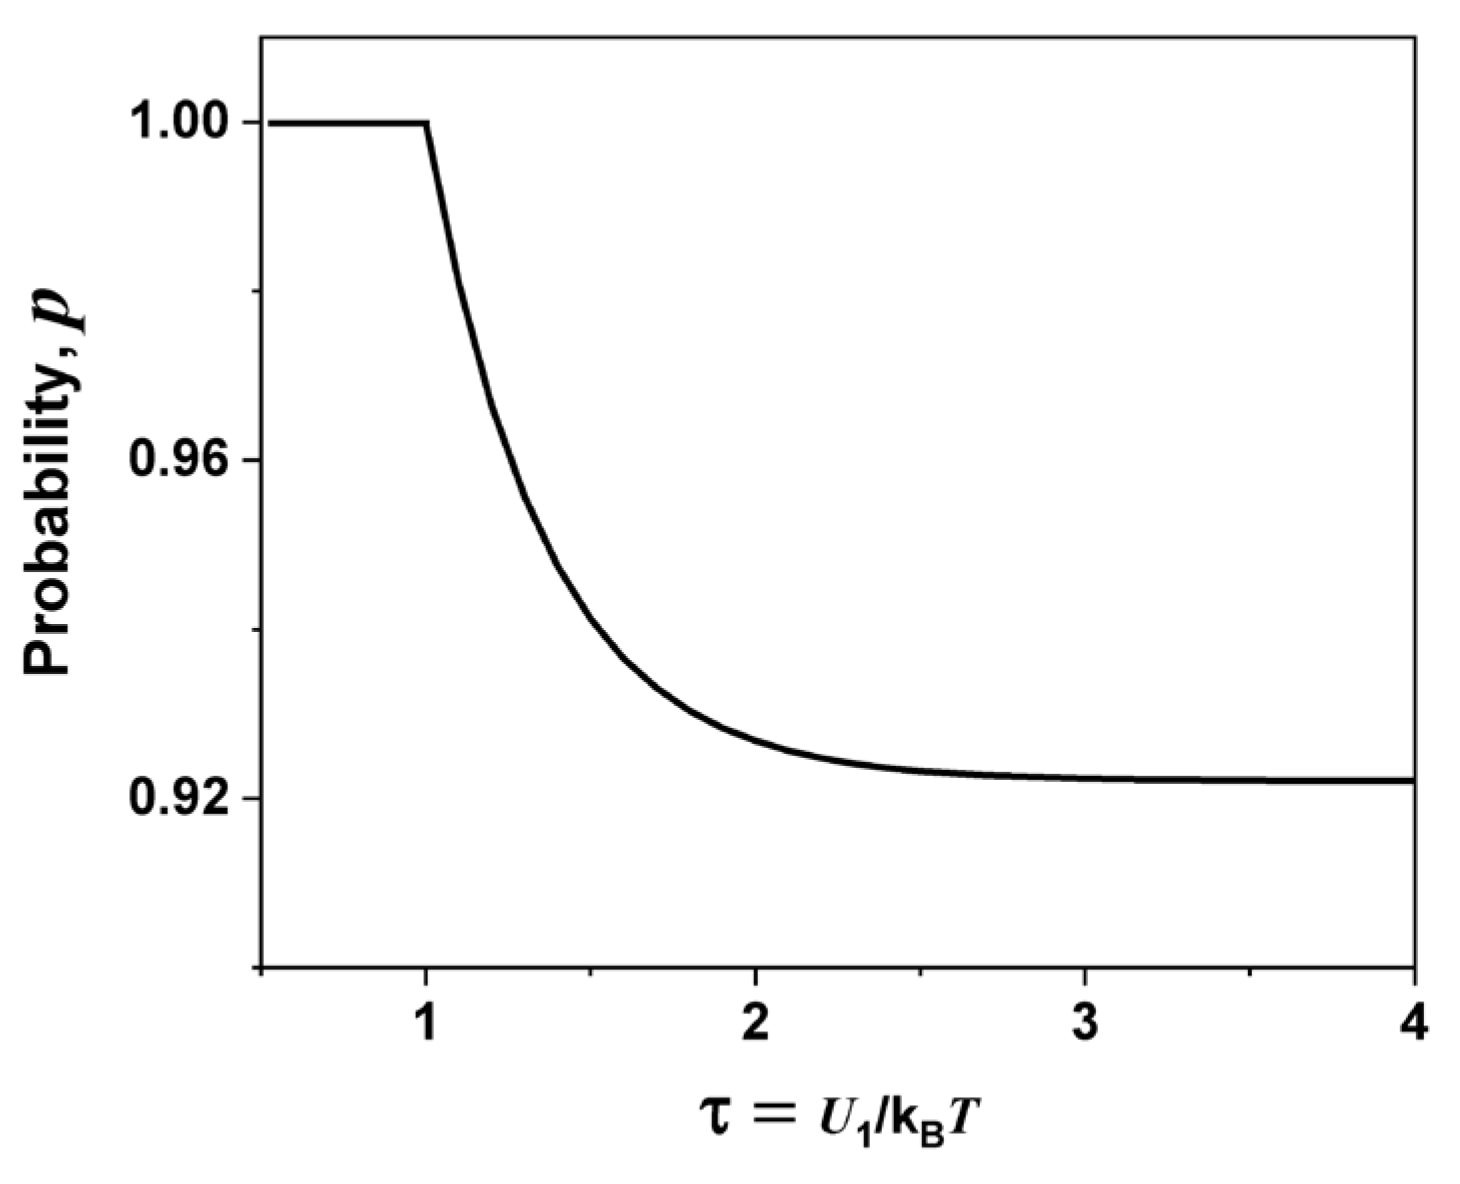
3. Discussion
4. Materials and Methods
Phenomenological Model
5. Conclusions
Author Contributions
Funding
Institutional Review Board Statement
Informed Consent Statement
Data Availability Statement
Acknowledgments
Conflicts of Interest
References
- Tubandt, C.; Lorenz, E. Molekularzustand und Elektrisches Leitvermögen Kristallisierter Salze. Z. Phys. Chem. 1914, 87, 513–542. [Google Scholar] [CrossRef]
- Hoshino, S. Crystal structure and phase transition of some metallic halides (IV) on the anomalous structure of α-AgI. J. Phys. Soc. Jpn. 1957, 12, 315–326. [Google Scholar] [CrossRef]
- Bührer, W.; Nicklow, R.M.; Brüesch, P. Lattice dynamics of β-(silver iodide) by neutron scattering. Phys. Rev. B 1978, 17, 3362–3370. [Google Scholar] [CrossRef]
- Boyce, J.B.; Hayes, T.M.; Mikkelsen, J.C. Extended-X-ray-absorption-fine-structure investigation of mobile-ion density in superionic AgI, CuI, CuBr, and CuCl. Phys. Rev. B. 1981, 23, 2876–2896. [Google Scholar] [CrossRef]
- Vogel, M.; Brinkmann, C.; Eckert, H.; Heuer, A. Silver dynamics in silver iodide/silver phosphate glasses studied by multidimensional 109Ag NMR. Phys. Chem. Chem. Phys. 2002, 4, 3237–3245. [Google Scholar] [CrossRef]
- Tahara, S.; Ueno, H.; Ohara, K.; Kawakita, Y.; Takeda, S.; Kohara, S.; Ohno, S. Concentration Effects of Silver Ions on Forming Cooperative Conduction Path in Superionic Melts. J. Phys. Soc. Jpn. Suppl. A 2010, 79, 133–136. [Google Scholar] [CrossRef]
- Yamamoto, T.; Maesato, M.; Hirao, N.; Kawaguchi, S.I.; Kawaguchi, S.; Ohishi, Y.; Kubota, Y.; Kobayashi, H.; Kitagawa, H. The Room-Temperature Superionic Conductivity of Silver Iodide Nanoparticles under Pressure. J. Am. Chem. Soc. 2017, 139, 1392–1395. [Google Scholar] [CrossRef] [PubMed]
- Huberman, B.A. Cooperative Phenomena in Solid Electrolytes. Phy. Rev. Lett. 1974, 32, 1000–1002. [Google Scholar] [CrossRef]
- Rice, M.J.; Strässler, S.; Toombs, G.A. Superionic Conductors: Theory of the Phase Transition to the Cation Disordered State. Phys. Rev. Lett. 1974, 32, 596–599. [Google Scholar] [CrossRef]
- Welch, D.O.; Dienes, J. Phenomenological and microscopic models of sublattice disorder in ionic crystals. J. Phys. Chem. Solids 1977, 38, 311–317. [Google Scholar] [CrossRef]
- Pietronero, L.; Strässler, S. Cooperative Phenomena in Superionic Conductors within Generalized Lattice Gas Models. Z. Phys. B 1979, 32, 339–346. [Google Scholar] [CrossRef]
- Sunandana, C.S.; Senthil Kumar, P. Theoretical approaches to superionic conductivity. Bull. Mater. Sci. 2004, 27, 1–17. [Google Scholar] [CrossRef]
- Catti, M. Kinetic Mechanisms of the Pressure-Driven Phase Transitions of AgI. Phys. Rev. B 2005, 72, 064105. [Google Scholar] [CrossRef]
- Aniya, M. Understanding the mechanism of superionic transport from trends of materials properties. Phys. Proc. 2013, 44, 25–34. [Google Scholar] [CrossRef]
- Aniya, M.; Ikeda, M.A. Model for Non-Arrhenius Ionic Conductivity. Nanomaterials 2019, 9, 911. [Google Scholar] [CrossRef] [PubMed]
- Vashishta, P.; Rahman, A. Ionic motion in α-AgI. Phys. Rev. Lett. 1978, 40, 1337–1340. [Google Scholar] [CrossRef]
- Parrinello, M.; Rahman, A.; Vashishta, P. Structural transitions in superionic conductors. Phys. Rev. Lett. 1983, 50, 1073–1076. [Google Scholar] [CrossRef]
- Shimojo, F.; Kobayashi, M. Molecular dynamics studies of molten AgI. I. Structure and dynamical properties. J. Phys. Soc. Jpn. 1991, 60, 3725–3735. [Google Scholar] [CrossRef]
- Gotlib, I.Y.; Ivanov-Schitz, A.K.; Murin, I.V.; Petrov, A.V.; Zakalyukin, R.M. Computer simulation of ionic transport in silver iodide within carbon nanotubes. Sol. Stat. Ionics 2011, 118, 6–14. [Google Scholar] [CrossRef]
- Ahmad, S.; Khan, M.A.; Wahab, M.A. Molecular Dynamics Study of Silver Iodide. Mater. Focus 2013, 2, 293–297. [Google Scholar] [CrossRef]
- Zielke, S.A.; Bertram, A.K.; Patey, G.N. Molecular Mechanism of Ice Nucleation on Model AgI Surfaces. J. Phys. Chem. B 2015, 119, 9049–9055. [Google Scholar] [CrossRef] [PubMed]
- Peña Lara, D.; Correa, H.; Diosa, J.E. Molecular Dynamics Study of Structural and Transport Properties of Silver Iodide Using Effective Charges. Molecules 2022, 27, 6132. [Google Scholar] [CrossRef] [PubMed]
- Burley, G. Polymorphism of silver iodide. Am. Mineralogist 1963, 48, 1266–1276. [Google Scholar]
- Patnaik, J.R.G.; Sunandana, C.S. Studies on gamma silver iodide. J. Phys. Chem. Sol. 1998, 59, 1059–1069. [Google Scholar] [CrossRef]
- Cava, R.J.; Rietman, E.A. Ionic conductivity of β-AgI. Phys. Rev. B 1984, 30, 6896–6962. [Google Scholar] [CrossRef]
- Maskasky, J.E. High phase-transition temperature for β-AgI to α-AgI and an explanation of the memory effect. Phys. Rev. B 1991, 43, 5769–5772. [Google Scholar] [CrossRef]
- Funke, K. Marking the Centennial of the Discovery of Alpha Silver Iodide. 2016. Available online: https://www.scientific.net/DF.6.1 (accessed on 30 May 2022).
- Hull, S. Superionics: Crystal structures and conduction processes. Rep. Prog. Phys. 2004, 67, 1233–1314. [Google Scholar] [CrossRef]
- Lu, J.; Yan, F.; Texter, J. Advanced applications of ionic liquids in polymer science. Prog. Poly. Sci. 2009, 34, 431–448. [Google Scholar] [CrossRef]
- Iwahara, H. Encyclopedia of Materials: Science and Technology; Elsevier: Amsterdam, The Netherlands, 2001. [Google Scholar]
- Subbarao, E.C. Solid Electrolytes and Their Applications; Plenum Press: New York, NY, USA, 1980. [Google Scholar]
- Kuwata, N.; Kawamura, J.; Nakamura, Y. New organic-inorganic hybrid superionic conductor glasses consisting of silver iodide and alkylbis-trimethylammonium diodides. Sol. Stat. Comm. 2002, 124, 221–226. [Google Scholar] [CrossRef]
- Annan, C.; Conghang, Q.; Yusheng, S.; Feifei, S. Die Berechnung Optischer und Elektrostatischer Gitterpotentiale. 2020. Available online: https://www.frontiersin.org/articles/10.3389/fenrg.2020.571440/full (accessed on 30 May 2022).
- Funke, K. Jump relaxation model and coupling model—A comparison. J. Non-Crystal. Solids 1994, 172–174, 1215–1221. [Google Scholar] [CrossRef]
- Pierson, H.O. Graphite, Diamond and Fullerenes: Properties, Processing and Applications; Noyes Publications: Park Ridge, NJ, USA, 1993. [Google Scholar]
- Chung, D.D.L. Review Graphite. J. Mat. Sci. 2002, 37, 1475–1489. [Google Scholar] [CrossRef]
- Iwahara, H. Crystal Structure; John Wiley & Sons: New York, NY, USA, 1965. [Google Scholar]
- Lafuente, B.; Downs, R.T.; Yang, H.; Stone, N. The power of databases: The RRUFF project. In Highlights in Mineralogical Crystallography; Armbruster, T., Danisi, R.M., Eds.; W. De Gruyter: Berlin, Germany, 2015; pp. 1–30. Available online: https://rruff.info/Graphite/R090047 (accessed on 11 May 2023).
- Han, Y.H.; Wang, H.B.; Troyan, A.; Gao, C.X.; Eremets, M.I. Pressure induced ionic-superionic transition in silver iodide at ambient temperature. J. Chem. Phys. 2014, 140, 044708. [Google Scholar] [CrossRef] [PubMed]
- Ohno, H.; Fukumoto, K. Progress in Ionic Liquids for Electrochemical Reaction Matrices. Electrochemistry 2008, 76, 16–23. [Google Scholar] [CrossRef]
- Peña Lara, D.; Vargas, R.A.; Correa, H. Solid electrolyte transition and conductivity in 0.1 NaI–0.9 AgI. Sol. Stat. Ionics 2004, 175, 451–454. [Google Scholar] [CrossRef]
- Montaño, C.J.; Burbano, J.C.; Peña Lara, D.; Diosa, J.E.; Vargas, R.A. Proton conduction in the binary system (1 − x)CsHSeO4−xKHSeO4 studied with a free-energy model. Phase Trans. 2011, 84, 916–923. [Google Scholar] [CrossRef]
- Burbano, J.C. Estudio de Conductores Superiónicos con una Densidad Aleatoria en los Portadores 2009. Bachelor’s Thesis, Universidad del Valle, Cali, Colombia.
- Burbano, J.C.; Vargas, R.A.; Peña Lara, D.; Lozano, C.A.; Correa, H. Defect interaction and solid electrolyte transition in AgI-based materials. Sol. Stat. Ionics 2009, 180, 1553–1557. [Google Scholar] [CrossRef]
- Peña Lara, D.; Correa, H.; Suescún Díaz, D. (AgI)(1−x) − (Al2O3)x nanocomposite system: Ionic conductivity simulations by a random variable theory. Ionics 2022, 28, 2911–2917. [Google Scholar] [CrossRef]


Disclaimer/Publisher’s Note: The statements, opinions and data contained in all publications are solely those of the individual author(s) and contributor(s) and not of MDPI and/or the editor(s). MDPI and/or the editor(s) disclaim responsibility for any injury to people or property resulting from any ideas, methods, instructions or products referred to in the content. |
© 2024 by the authors. Licensee MDPI, Basel, Switzerland. This article is an open access article distributed under the terms and conditions of the Creative Commons Attribution (CC BY) license (https://creativecommons.org/licenses/by/4.0/).
Share and Cite
Correa, H.; Peña Lara, D.; Mosquera-Vargas, E. Evidence of a Proximity Effect in a (AgI)x − C(1−x) Mixture Using a Simulation Model Based on Random Variable Theory. Molecules 2024, 29, 2491. https://doi.org/10.3390/molecules29112491
Correa H, Peña Lara D, Mosquera-Vargas E. Evidence of a Proximity Effect in a (AgI)x − C(1−x) Mixture Using a Simulation Model Based on Random Variable Theory. Molecules. 2024; 29(11):2491. https://doi.org/10.3390/molecules29112491
Chicago/Turabian StyleCorrea, Hernando, Diego Peña Lara, and Edgar Mosquera-Vargas. 2024. "Evidence of a Proximity Effect in a (AgI)x − C(1−x) Mixture Using a Simulation Model Based on Random Variable Theory" Molecules 29, no. 11: 2491. https://doi.org/10.3390/molecules29112491
APA StyleCorrea, H., Peña Lara, D., & Mosquera-Vargas, E. (2024). Evidence of a Proximity Effect in a (AgI)x − C(1−x) Mixture Using a Simulation Model Based on Random Variable Theory. Molecules, 29(11), 2491. https://doi.org/10.3390/molecules29112491