Article

An Aggregation-Induced Fluorescence Probe for Detection H2S and Its Application in Cell Imaging

School of Pharmacy, Yancheng Teachers University, Yancheng 224051, China
*
Authors to whom correspondence should be addressed.
Molecules 2024, 29(10), 2386; https://doi.org/10.3390/molecules29102386
Submission received: 26 April 2024 / Revised: 13 May 2024 / Accepted: 14 May 2024 / Published: 19 May 2024
(This article belongs to the Section Analytical Chemistry)

Abstract

:
Monitoring hydrogen sulfide (H2S) in living organisms is very important because H2S acts as a regulator in many physiological and pathological processes. Upregulation of endogenous H2S concentration has been shown to be closely related to the occurrence and development of tumors, atherosclerosis, neurodegenerative diseases and diabetes. Herin, a novel fluorescent probe HND with aggregation-induced emission was designed. Impressively, HND exhibited a high selectivity, fast response (1 min) and low detection limit (0.61 μM) for H2S in PBS buffer (10 mM, pH = 7.42). Moreover, the reaction mechanism between HND and H2S was conducted by Job’s plot, HR-MS, and DFT. In particular, HND was successfully employed to detect H2S in HeLa cells.

Graphical Abstract

1. Introduction

H2S is considered to be an important endogenous gaseous transmitter and plays a crucial role in the regulation of intracellular redox status, angiogenesis and anti-inflammatory effects in living organisms [1,2,3]. It is generated from L-cysteine or catalyzed by cysteine sulfide β-synthases and cysteine sulfide γ-lyase [4]. Evidence showed that the upregulation of H2S concentration is closely related to the occurrence and development of tumors, atherosclerosis, neurodegenerative diseases, diabetes and so on [5,6,7,8,9]. Therefore, it is necessary to construct a new H2S instantaneous detection method with high sensitivity and selectivity to evaluate H2S levels in biological systems.
Currently, many H2S-activatable small-molecule fluorescent probes have been developed based on different reaction mechanisms, such as the removal of copper ion via copper sulfide precipitation, nucleophilic addition or the reduction of azides/or nitros to amines mediated by the thiolysis of dinitrophenyl ether [7,10,11,12,13,14,15]. However, some of them are based on hydrophobic organic fluorescent groups, which have the disadvantage of poor water solubility and easy aggregation to form precipitates in aqueous solutions, thereby reducing the responsivity to the analyte and limiting the practical application of organic fluorescent molecular probes in biological imaging. Due to the advantages of excellent photostability and biocompatibility of aggregation-induced emission (AIE), a lot of fluorescent probes with AIE effect for H2S have been synthesized. However, most of the fluorescent probes with AIE effect are based on the molecular skeleton of tetrastyrene (TPE) [16,17] and have relatively complex molecular structures, which increases the difficulty of AIE molecular design and synthesis. Therefore, the design of efficient AIE bioluminescent materials with simple molecular structures and simple synthesis remains a challenge.
In this paper, a novel AIE activity fluorescent probe, named 2-hydroxy-1-naphthalaldehyde N-(dimethylamino)benzaldehyde (HND) was conducted. The mechanism was tested by Job’s plot, HR-MS, and DFT, and revealed that the two C=N double bonds in the structure of HND were used to provide a receptor unit for H2S. Compared with early reports (Table S1), HND exhibits a comparable limit of detection and a fast response. Furthermore, HND realized the detection of H2S in HeLa cells.

2. Results and Discussion

2.1. AIE Effect of HND in Solution

To better understand the AIE effect of HND, the fluorescence properties of HND in a mixed solvent system of DMSO and H2O were first investigated. As an exception, HND showed no fluorescence signal when dissolved in the good solvent DMSO, while the fluorescence signal at 536 nm could be turned on and gradually increased with the increase in water volume fraction; an 8.23-fold increase was observed when the water volume fraction increased to 60% (as shown in Figure 1a). With the water volume fraction increased from 60% to 100%, the fluorescence signal reduced slightly. The photographs given in Figure 1d show the color change in HND with increasing water content. A clear yellow fluorescence was observed under a 365 nm lamp. These results indicated that the compound HND is a typical aggregation-induced emission (AIE) active compound in the aqueous medium [18]. Herein, DMSO is a good solvent and water is a poor solvent for HND [19]. The reason for the fluorescence enhancement of HND in DMSO is because the radiation channel was opened, leading to an increase in fluorescence intensity due to the restricted intramolecular rotations (RIRs) of the coumarin matrix and thiosemicarbazide [20].
Particle size analysis was a useful method to further verify the formation of aggregates of HND. As shown in Figure 1b, the average particle size of HND (5.0 μM) in DMSO solution was 45.69 nm, while the average diameter in PBS (10 mM, pH = 7.40) was approximately 128.52 nm, indicating that HND does indeed have aggregates in aqueous solutions. Furthermore, the diameter of HND was supplemented by transmission electron microscopy (TEM). The TEM results showed that the particle size of HND is approximately 100 nm, which is consistent with the results of particle size analysis (128.52 nm). In addition, TEM showed that the morphology of HND was almost elliptical and it had a structural feature with a darker color in the center and a thin film coating at the periphery (Figure S4).
To better understand the properties of AIE, we conducted analyses of the fluorescence spectra of HND (5.0 μM) in different CH3OH/glycerin mixtures. As shown in Figure 1c, the fluorescence intensity at 536 nm increased with the increase in glycerol fractions. The results indicated that the sticky glycerin could block the nonradiative intramolecular rotation [18]. This means that HND is a typical AIE compound [13,19].

2.2. Selectivity and Competition

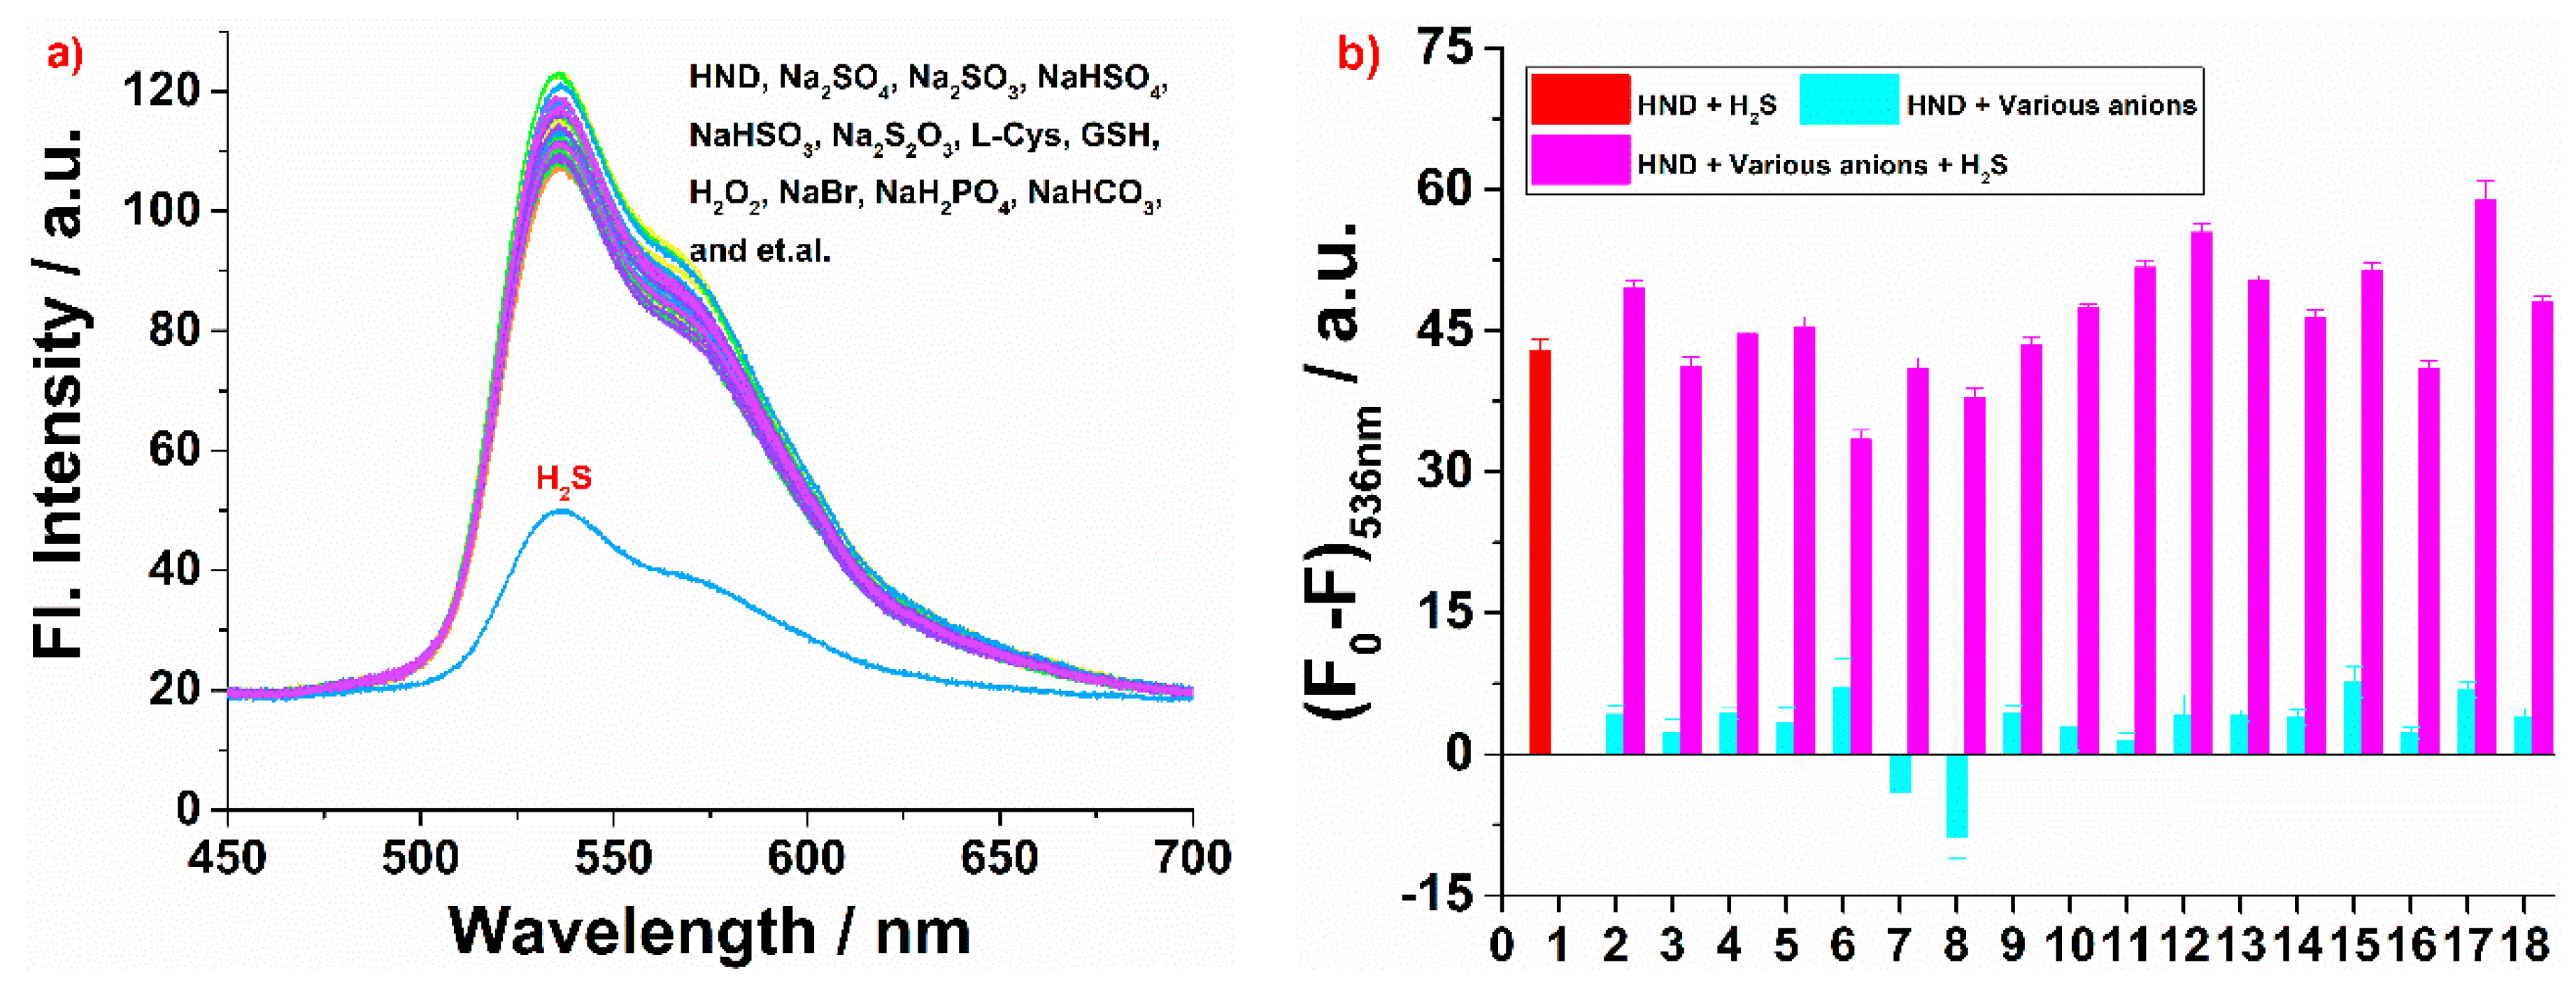
Many H2S probes based on nucleophilic addition reaction have been reported in recent years [15,21,22,23,24]. To identify the interaction between HND and H2S (Na2S was employed as H2S donor), as shown in Figure 2a, an extremely strong yellow fluorescence with λmax = 536 nm was observed in PBS buffer solution (10 mM, pH = 7.40). However, the fluorescence intensity of HND (5.0 μM) was dramatically reduced after the addition of 100 eq. H2S in PBS buffer solution (10 mM, pH = 7.40). The fluorescence intensity of HND was decreased to almost no fluorescence. There are other biologically relevant reactive sulfurs (RSS), such as Na2SO4, Na2SO3, NaHSO4, NaHSO3, Na2S2O3, L-Cys and GSH, which could react with HND; here, it is necessary to verify the specificity of HND. In addition, many anions and cations, such as PO43−, HCO3, NO2, Br, NO3, F, CO32−, Cl, C2O42−, I, etc., were also investigated. The results indicated that no detectable responses were observed when 100 eq. of other RSS or many anions were added to HND, respectively. The response of HND to H2O2 was also conducted; it was found that H2O2 could not respond to HND.
In addition, a lot of metal ions, such as Mn2+, Cu2+, Ag+, Co3+, Fe3+, Al3+, Ca2+, K+, Ni2+, Cd2+, Cr3+ and so on, which coexist in the human body, were also investigated; except for Cu2+, all other tested metal ions have no interference with HND (Figures S5 and S6). All of the results showed that HND has high selectivity for H2S.
To further demonstrate the ability of HND to respond to H2S in the presence of other biologically relevant reactive RSS, anions and H2O2, the competition of HND was also examined (Figure 2b). It was found that HND could also respond to H2S in the presence of other biologically relevant reactive RSS, anions and H2O2, and the fluorescence intensity was similar to that of HND directly responding to H2S. This informed us that the RSS, anions and H2O2 tested had a negligible interfering effect on the detection of H2S by HND. Similarly, when metal ions and H2S coexisted, the decrease in fluorescence intensity of HND was also observed (Figure S6).

2.3. H2S Response by Probe HND

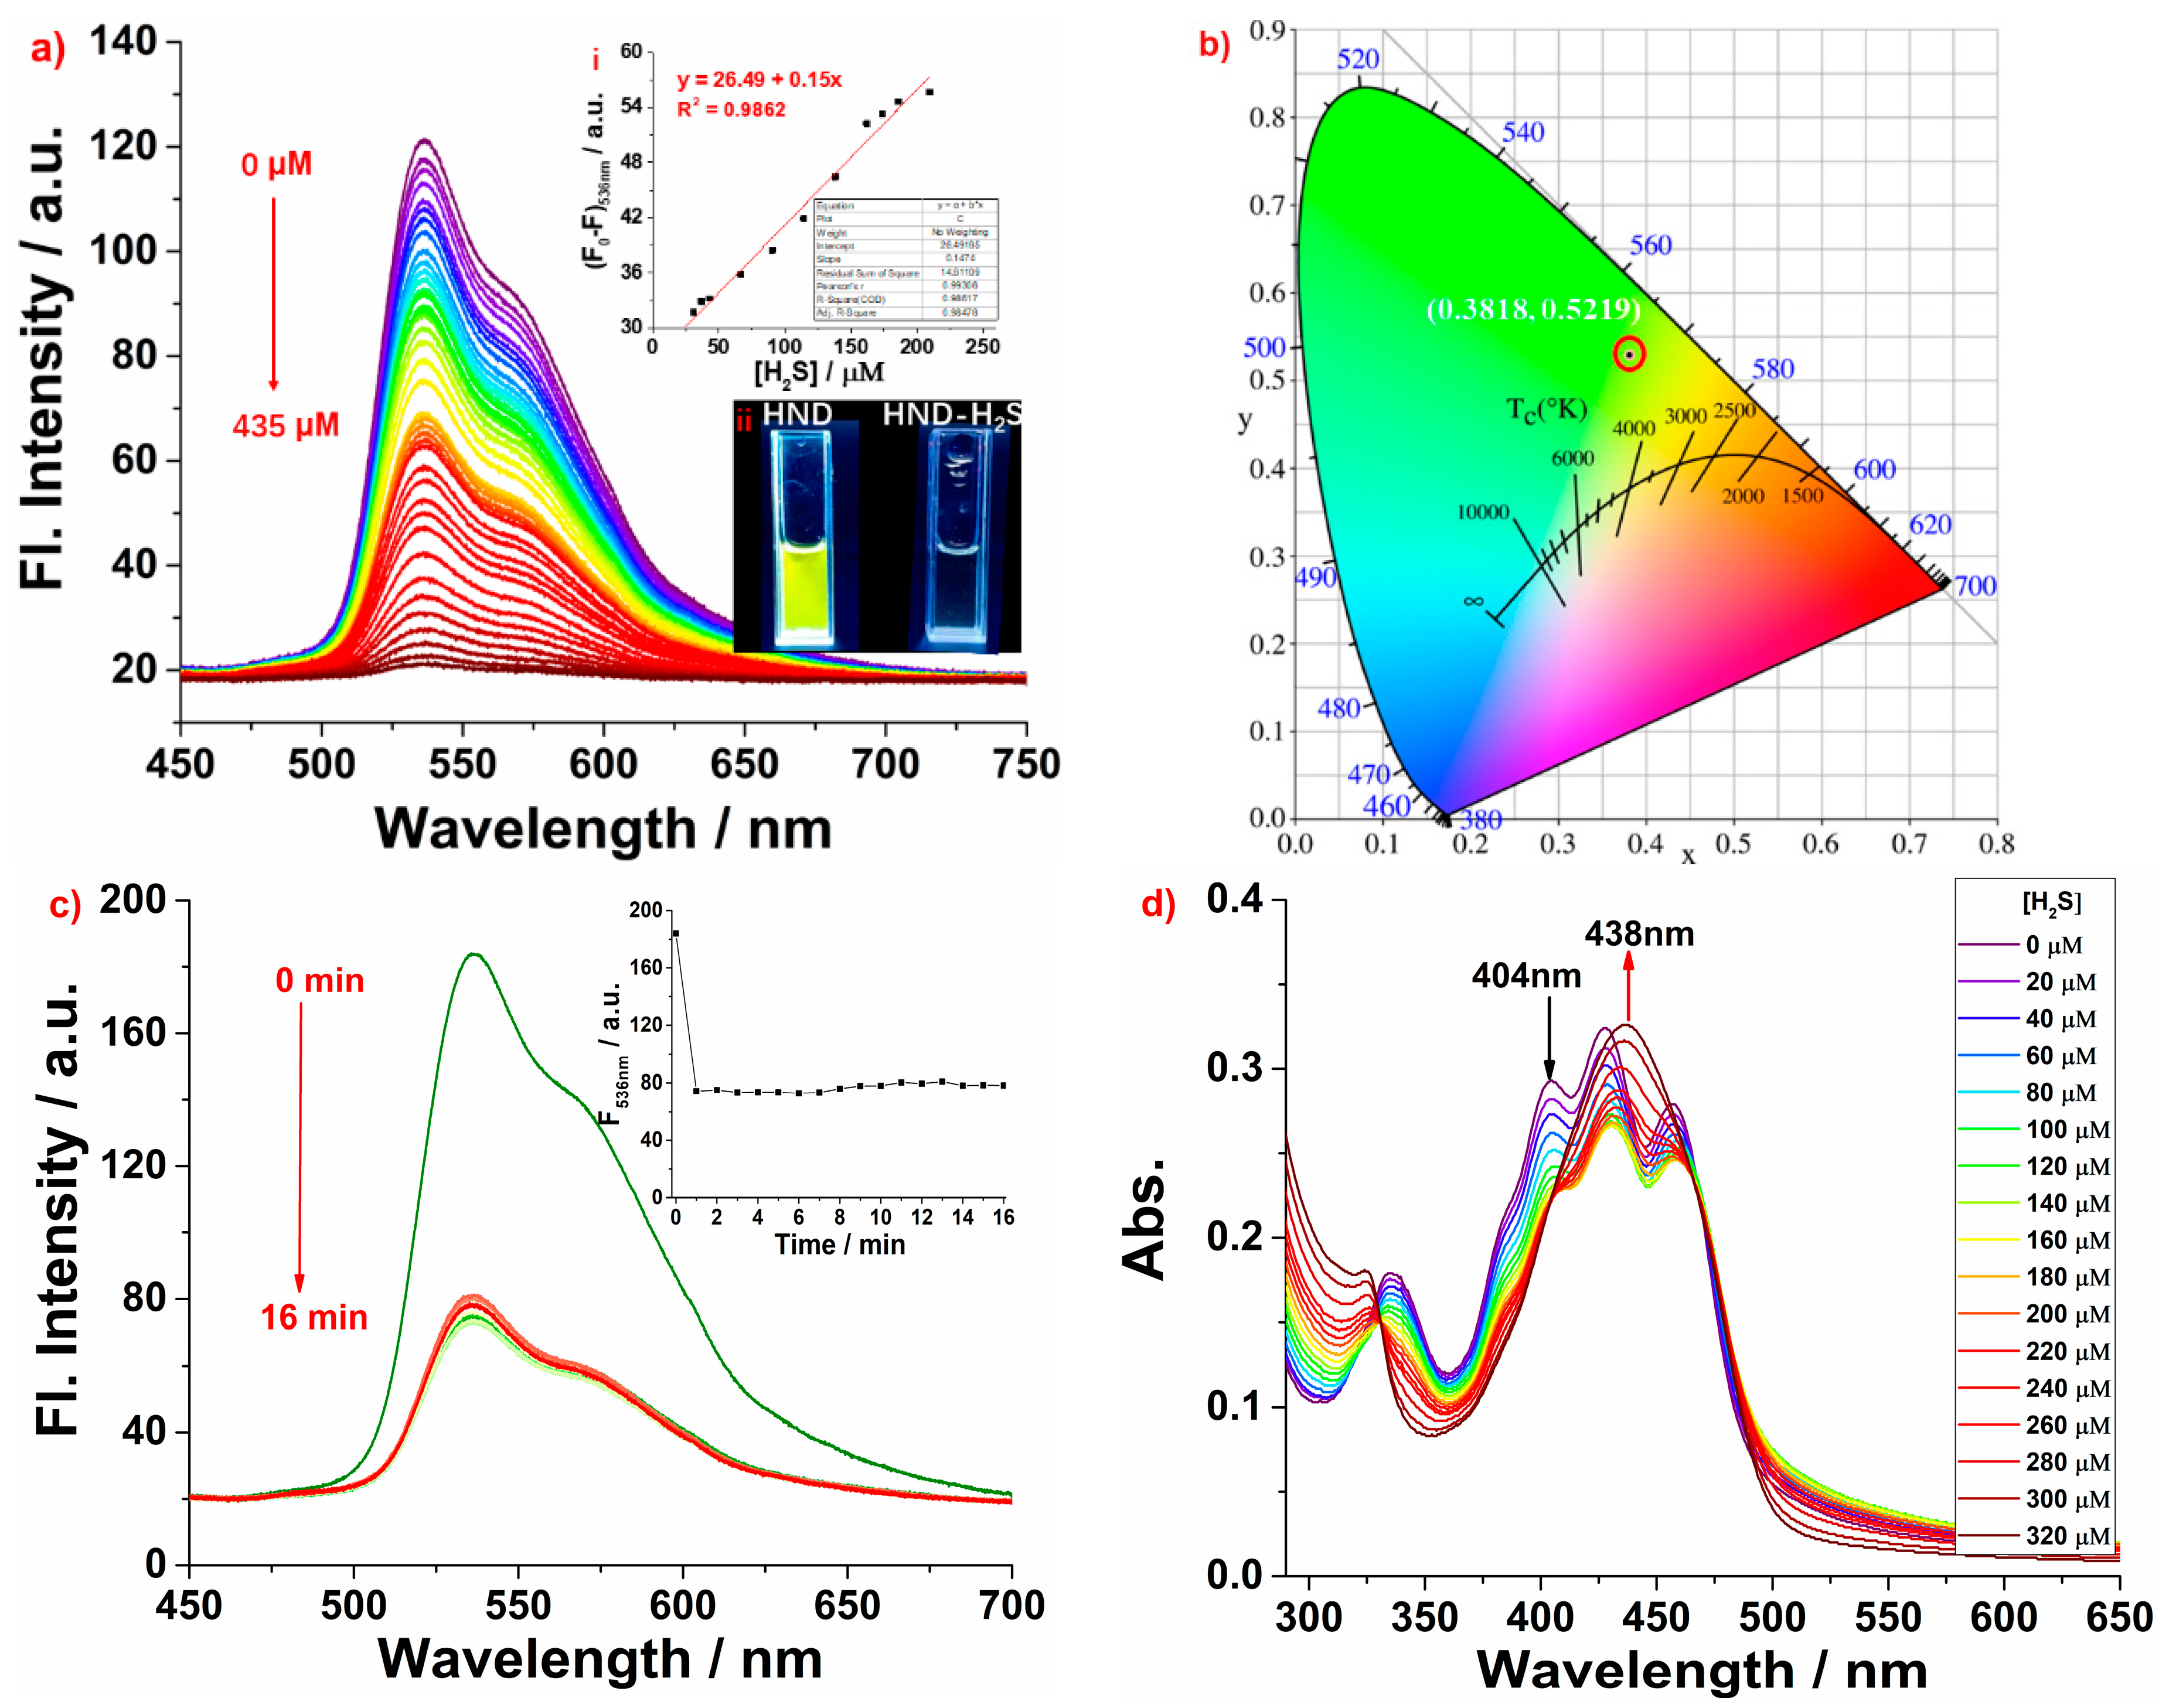
Figure 3a shows the relationship between HND and the concentrations of H2S. The fluorescence intensity of HND in PBS buffer solution (10 mM, pH = 7.40) at 536 nm decreased with the gradual addition of H2S at different concentrations. When 435 μM H2S was added, a 5.71-fold quenching of the fluorescence was observed. The fluorescence color changed from light yellow to colorless (shown in Figure 3a inset). A good linear relationship was observed between the fluorescence intensities at 536 nm, as well as the H2S concentration from 25 to 210 μM; moreover, the value of the linear correlation R2 was 0.9862 (Figure 3a inset). Followed by the equation LOD = K × Sb1/S [25], the detection limit for H2S was estimated to be 0.61 μM. Compared with the early results (as shown in Table S1), the LOD value is consistent with the reports by Lu and Jose [26,27,28] and good compared with the reports by Zhang [29,30]. Additionally, the pH-dependent responses of probe HND and HND to H2S were carried out. From Figure S7, it can be seen that probe HND could only respond to H2S at pH 7.42. At other pH values, such as 4.00, 6.86, 9.18 and 10.01, HND could not respond to H2S. Therefore, PBS buffer (10 mM, pH 7.4) was chosen as the reaction system.
CIE chromaticity was used to better understand the chromaticity changes in the fluorescence spectra of HND upon the addition of H2S [31]. CIE chromaticity coordinates were also calculated from the emission spectrum [32]. A two-dimensional space (XY plane) could be found in the CIE where each point of the chromaticity map stands for a particular color. From Figure 3b, the CIE chromaticity of HND was found to be x = 0.3818, y = 0.5219, while after the addition of H2S, the CIE chromaticity was converted to be x = 0.3618, y = 0.4174. This is an indication of a gradual shift in the color (Figure S8).
Response time is one of the most important parameters for a sensor. Therefore, kinetic studies were conducted to investigate the response time. A total of 10 eqiv. of H2S was added to HND (5.0 μM) and the fluorescence intensity at 536 nm was monitored over time until the spectrum became constant (Figure 3c). The results showed that it takes almost 1 min for HND to react completely with H2S. This is a fast reaction rate compared to the first report [13,28,33,34].
Furthermore, the absorption spectra of HND (15 μM) treated with different concentrations of H2S in PBS buffer solution (10 mM, pH = 7.40) were recorded. As shown in Figure 3d, four peaks at 457 nm, 427 nm, 404 nm and 355 nm were observed; with the addition of H2S, the peaks at 457 nm, 427 nm, 404 nm and 355 nm were decreased and two new peaks at 438 nm and 326 nm appeared and gradually increased. An isoabsorption point at 329 nm was found. The isoabsorptive point indicated that a new compound was formed between HND and H2S [31,35].

2.4. Mechanism Investigation

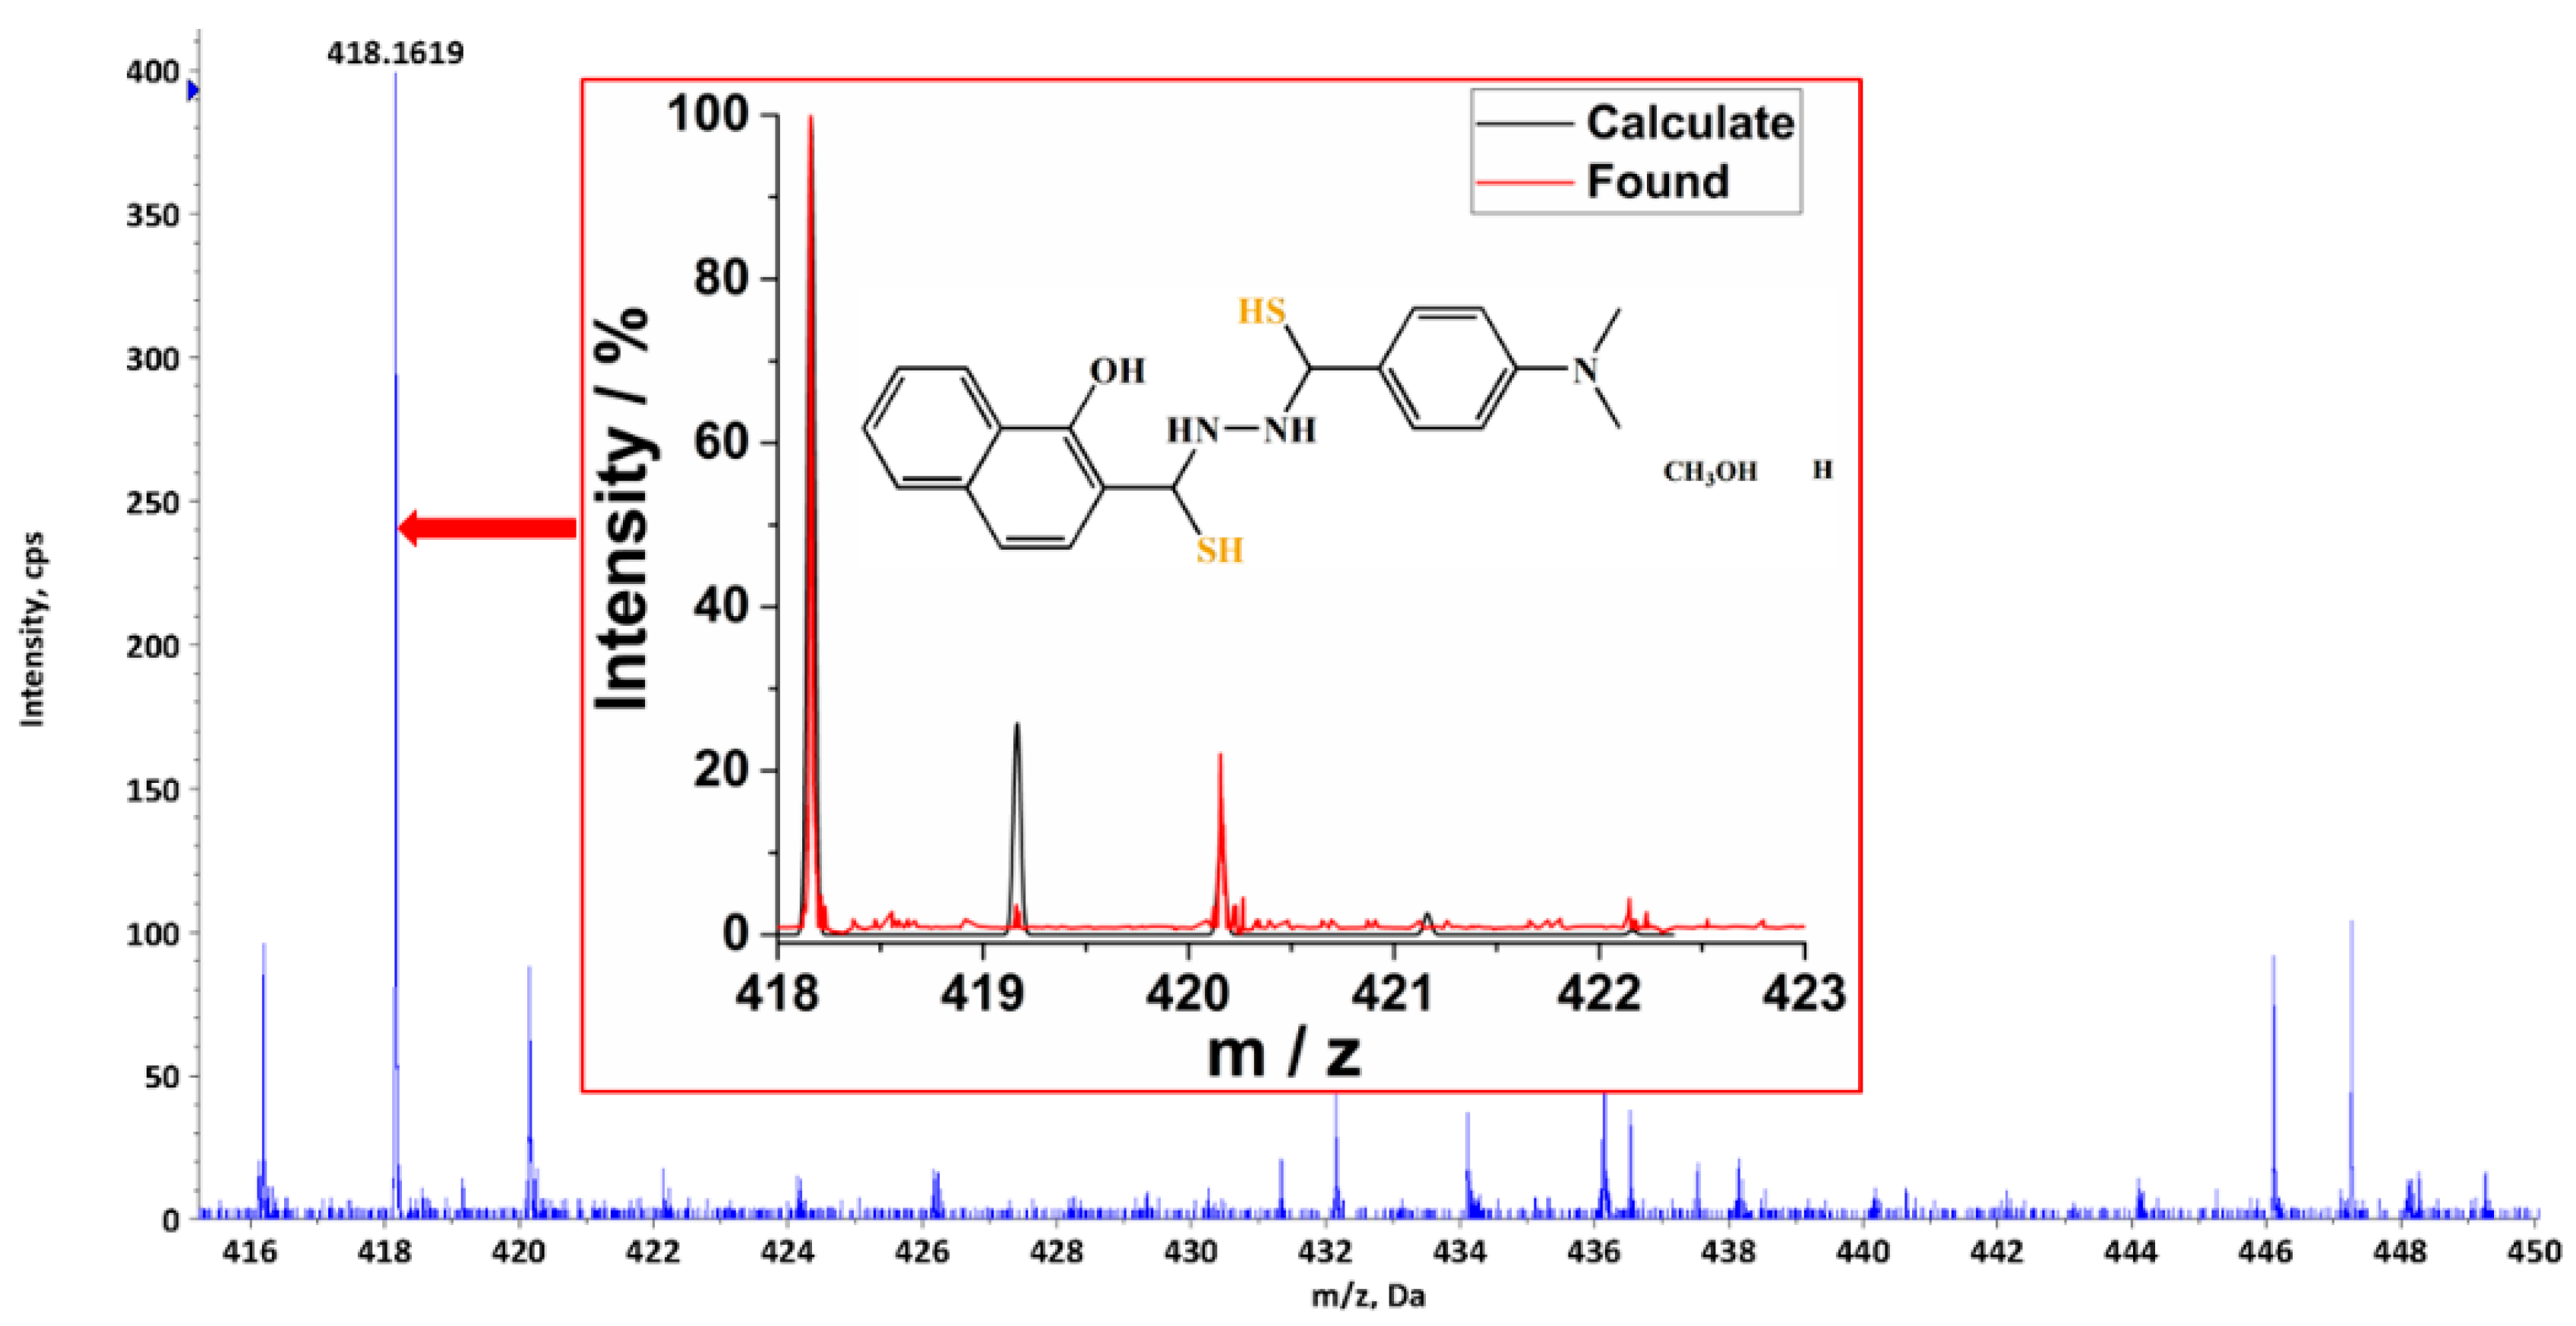
HR-MS was used to further investigate the mechanism involved in the fluorescence quenching between HND and Na2S. The HR-MS of HND shows a strong peak at m/z = 318.1606 [HND + H] + (Figure S2). After the addition of an excess of Na2S, a new peak appears at m/z = 418.1619 [HND -HS + CH3OH + H]+, which indicates clearly that the C=N of HND were formed through nucleophilic addition by H2S in aqueous solution (Figure 4). The recognition mechanism is similar to the other reports [36,37,38,39].
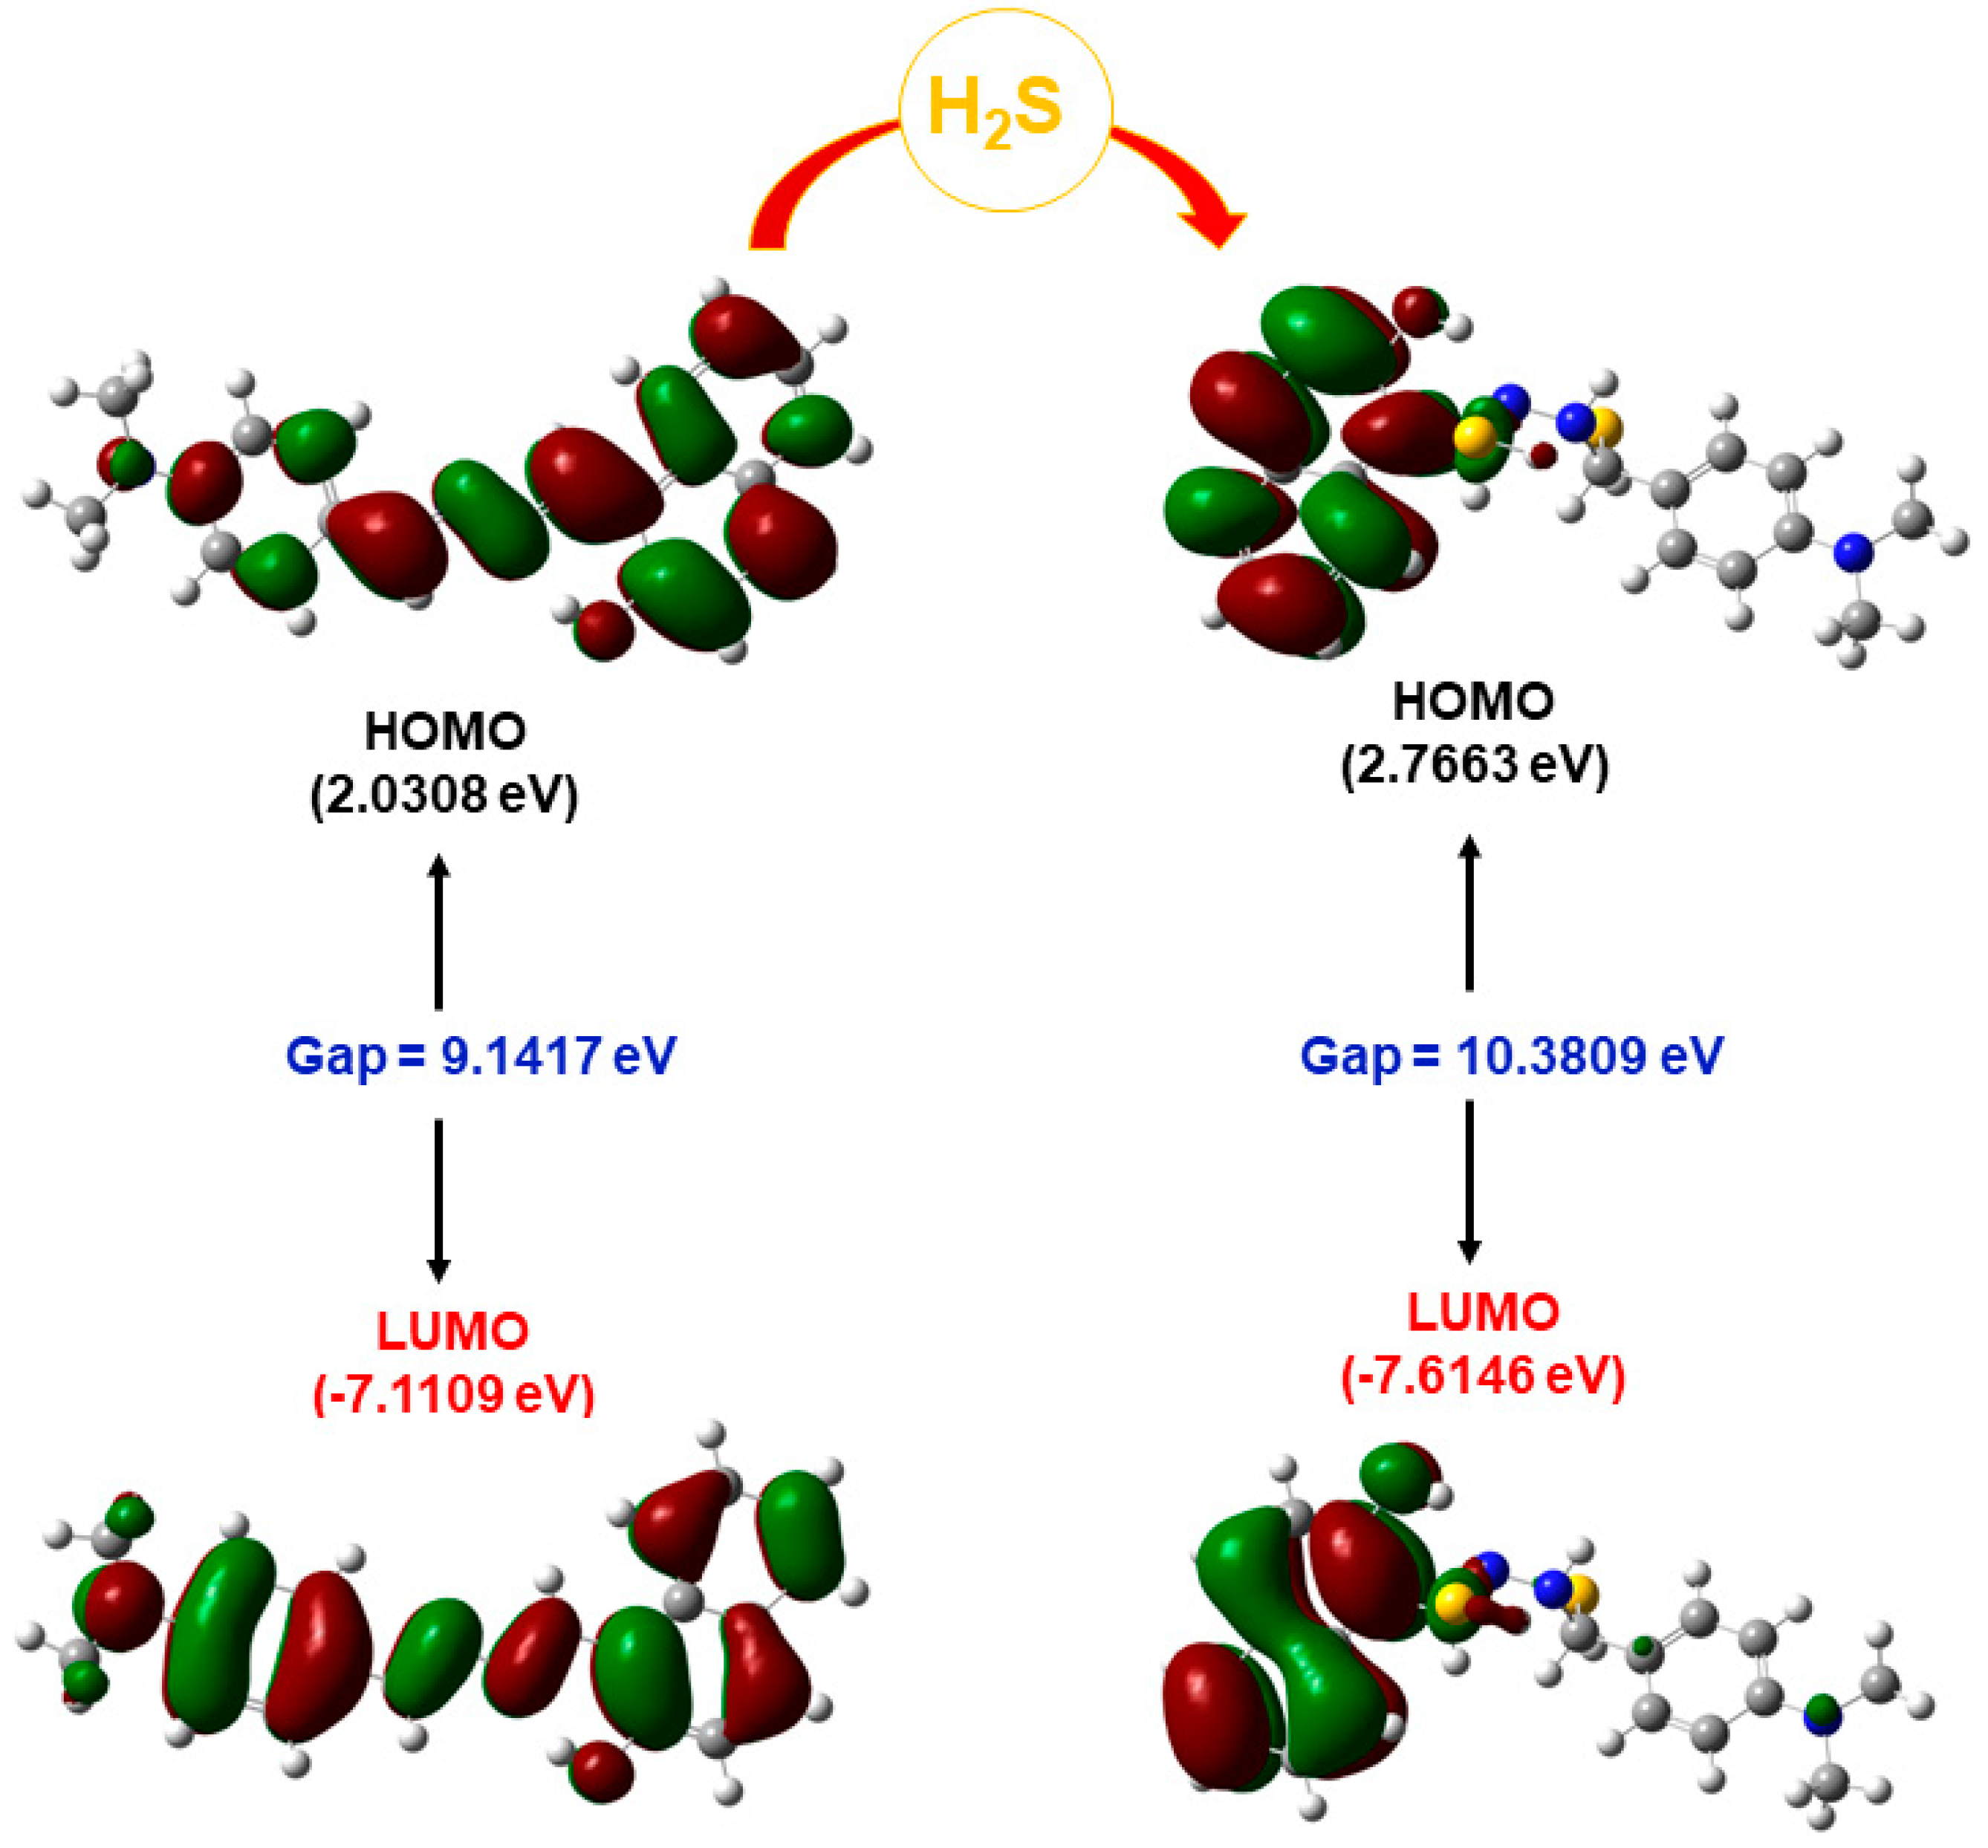
DFT with B3LYP/6-31G(d) (the Gaussian 09) was carried out to further investigate the electron distributions and orbital energies of HND and H2S [40,41]. From Figure 5, we find that the highest occupied molecular orbitals (HOMOs) and the lowest occupied molecular orbitals (LOMOs) of HND were mainly distributed over the whole molecule, so HND showed a strong fluorescence due to the absence of electron transfer. The HOMOs and LUMOs of HND -HS were mainly distributed on the 2-hydroxy-1-naphthylaldehyde group. The HOMO-LUMO energy gaps of HND and HND -HS were 9.1417 ev and 10.3809 ev, respectively. The HOMO-LUMO band gap of HND -HS was higher than that of HND, which could be clearly explained by the blue shift in the emission maxima of HND -HS [32,42].

2.5. Fluorescence Imaging

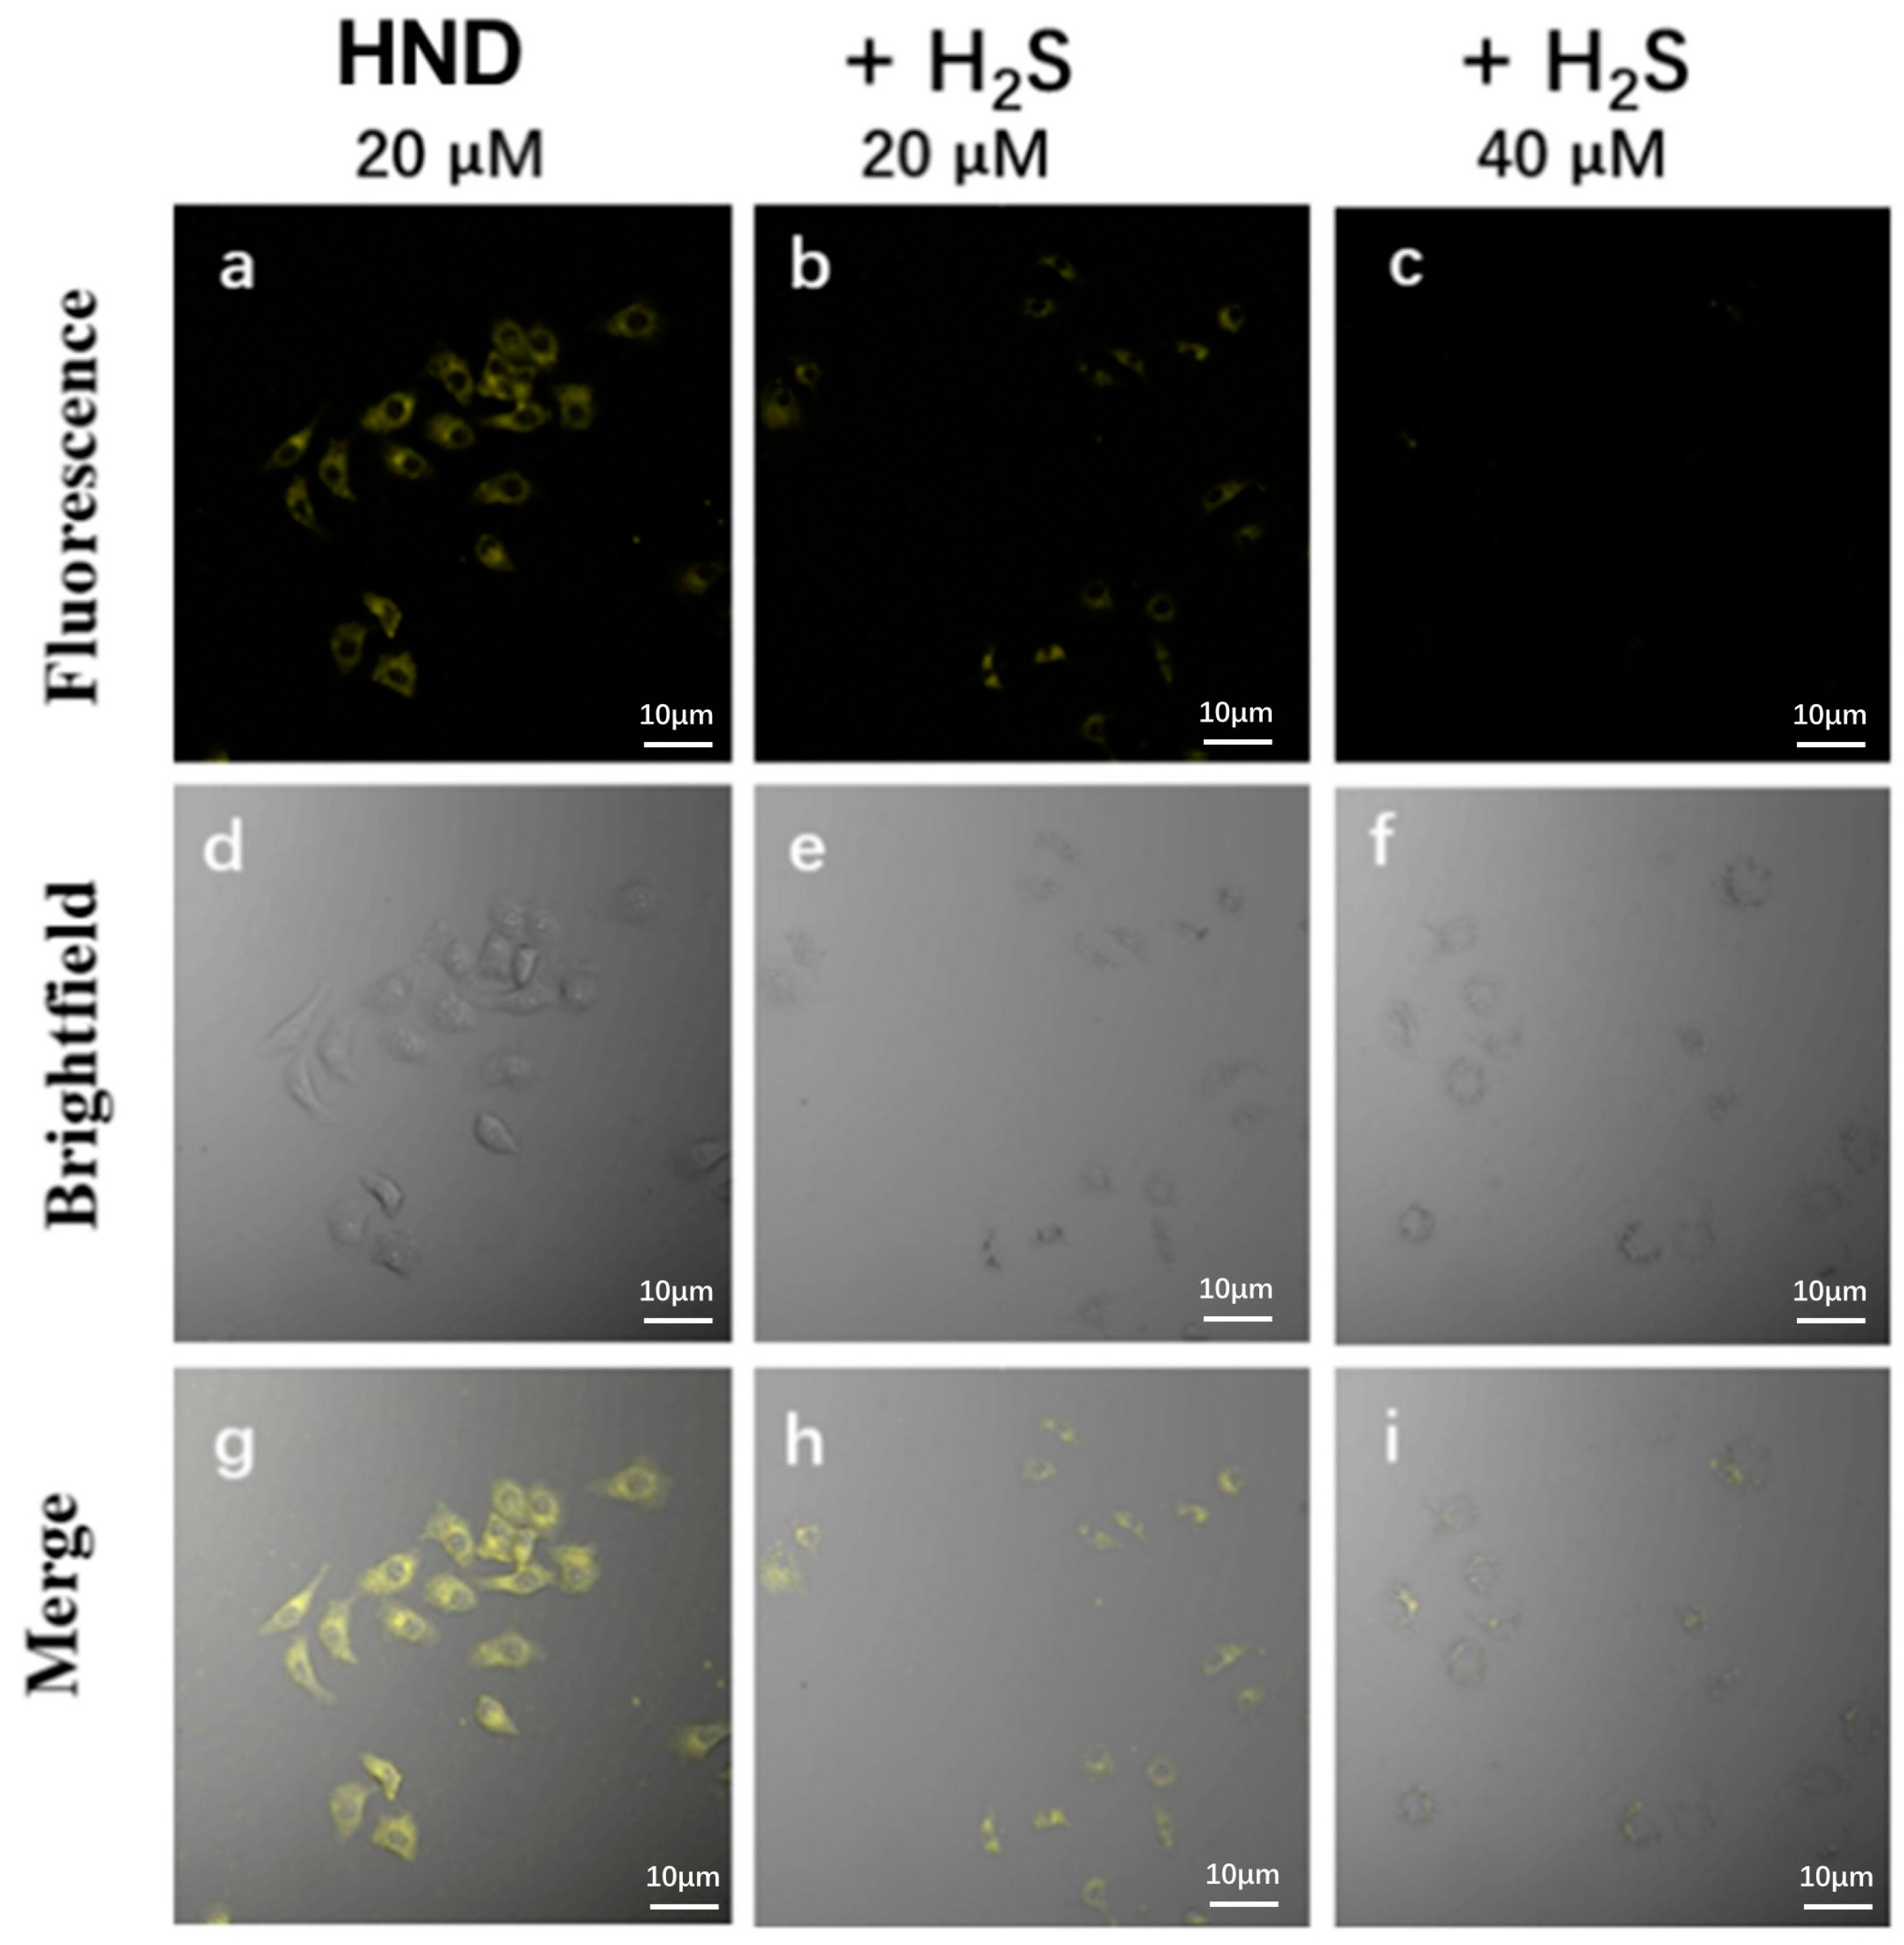
The applicability of HND in biological systems was investigated by analyzing H2S imaging in living cells. Bright yellow fluorescence was obtained when HeLa cells were incubated with 20 μM of HND for 20 min. However, the bright yellow fluorescence of HeLa cells was gradually quenched when the cells were treated with HND for 20 min and then treated with H2S (the concentrations of H2S were 20 μM and 40 μM, respectively) for another 20 min (Figure 6b,c). The results indicated that HND has good biocompatibility and is able to image different concentrations of H2S in living cells.

3. Materials and Methods

3.1. Materials

All reagents were purchased through a commercial method and used without further purification. 1H-NMR was obtained using a Bruker DRX 400 spectrometer with TMS as the internal standard. High-resolution mass spectrometry (HR-MS) was performed on a Triple TOF TM 5600+ system. Fluorescence spectra were obtained at room temperature using a CRT-970 fluorescence spectrophotometer. The absorption spectra were measured by Shimadzu UV1800. Imaging of probe HND and HND with Na2S was conducted on a confocal laser scanning microscope L700 with HeLa cells.

3.2. The Synthesis Process

As shown in Scheme 1, first, the mixture of ethanol (30 mL), 2-hydroxynaphthalene-1-carbaldehyde (0.344 g, 2.0 mmol) and hydrazine hydrate (400 μL) were first refluxed in a flask. After 10 h, the reaction was stopped by TLC. Yellow solids were obtained, named 2-hydroxynaphthalene-1-carbaldehyde hydrazone (1). Next, 1 (0.279 g, 1.5 mmol) and 4-(dimethylamino)benzaldehyde (0.1491 g, 1.0 mmol) were mixed in 30 mL ethanol, a few drops of DMF was added as a catalyst, and then the above mixture was heated and refluxed for 24 h. The yellow powder HND was obtained after the mixture was cooled and washed by ethanol three times; then, it was recrystallized by CH3CH2OH. Yield, 0.17 g (54%). 1H-NMR (400 MHz, DMSO-d6) δ 12.90 (s, 1H), 10.01 (s, 1H), 8.66 (d, J = 8.6 Hz, 1H), 8.05 (d, J = 8.9 Hz, 1H), 7.93 (d, J = 7.3 Hz, 1H), 7.63 (t, J = 7.7 Hz, 1H), 7.45 (t, J = 7.1 Hz, 1H), 7.29 (d, J = 9.0 Hz, 1H), 1.23 (s, 6H) (Figure S1). HR-MS: m/z = 318.1606 [HND + H]+, [HND + H]+ found 318.1606 (Figure S2). HND showed the yellow fluorescence in the solid under 365 nm UV lamp illumination (Figure S3).

3.3. Fluorescence Spectral Property

Na2S was dissolved in water and used as the donor of H2S [36]. Stock solution of probe HND (10−3 M) was prepared in DMSO. The fluorescence spectra of HND with H2S were obtained by the addition of various concentrations of Na2S to HND (5.0 μM) in PBS buffer (10 mM, pH 7.4). The fluorescence spectra were excited by 420 nm.

4. Conclusions

In conclusion, a novel fluorescent probe HND with AIE activity was synthesized. The results showed that HND could be used for the detection of H2S in aqueous solution and HeLa cells. HND exhibited obvious fluorescence quenching and excellent selectivity/competitiveness toward H2S with a limit of detection of 0.64 μM and a response time of 1 min. We assumed that H2S reacted with HND through nucleophilic addition reaction and the mechanism was proven by HR-MS and DFT calculations. In addition, HND was successfully applied to image the H2S in HeLa cells.

Supplementary Materials

The following supporting information can be downloaded at: https://www.mdpi.com/article/10.3390/molecules29102386/s1, Figure S1: 1H-NMR of HND. Figure S2: HR-MS of HND. Figure S3: The color of HND as a solid. (Right) under 365 nm UV lamp illumination; (left) under visible light. Figure S4: TEM of HND (5.0 μM) in 100% PBS. Figure S5: Selectivity profile of 5 μM HND toward various metal ions (500 μM) in PBS buffer (10 mM, pH 7.4), λex = 420 nm. Figure S6: Fluorescence intensity changes of 5.0 μM HND upon addition of 100 equiv. H2S and 100 equiv. of various metal ions, λem = 536 nm. Figure S7: The pH-dependent responses of probe HND and HND to H2S. Figure S8: CIE diagram of the HND -HS in PBS buffer solution (10 mM, pH = 7.40). Figure S9: Time-dependent fluorescence intensity of HND (5.0 μM) in PBS (pH 7.4, 10 mM). Table S1: Comparison of HND for the detection of H2S. References [43,44,45] are cited in Supplementary Materials.

Author Contributions

Data curation, X.-H.T. and H.-N.Z.; Investigation, X.-H.T. and H.-N.Z.; Data curation, W.-L.W.; Writing—original draft preparation, X.-H.T.; Writing—review and editing, Q.-M.W. All authors have read and agreed to the published version of the manuscript.

Funding

This research received no external funding.

Institutional Review Board Statement

Not applicable.

Data Availability Statement

The original contributions presented in the study are included in the article/supplementary material, further inquiries can be directed to the corresponding authors.

Acknowledgments

We would like to thank Cheng Yu from Hebei University of Science and Technology for his help with DFT.

Conflicts of Interest

The authors declare no conflicts of interest.

References

  1. Yang, G.; Wu, L.; Jiang, B.; Yang, W.; Qi, J.; Cao, K.; Meng, Q.; Mustafa, A.K.; Mu, W.; Zhang, S.; et al. H2S as a Physiologic Vasorelaxant: Hypertension in Mice with Deletion of Cystathionine γ-Lyase. Science 2008, 322, 587–590. [Google Scholar] [CrossRef] [PubMed]
  2. Wallace, J.L. Hydrogen sulfide-releasing anti-inflammatory drugs. Trends Pharmacol. Sci. 2007, 28, 501–505. [Google Scholar] [CrossRef] [PubMed]
  3. Li, Y.; Quan, W.; Song, W.; Zhan, J.; Lin, W. Near-infrared fluorescent probe for visualizing hydrogen sulfide fluctuations during arthritis and its treatment. Microchem. J. 2023, 191, 108856. [Google Scholar] [CrossRef]
  4. Singh, S.; Padovani, D.; Leslie, R.A.; Chiku, T.; Banerjee, R. Relative Contributions of Cystathionine β-Synthase and γ-Cystathionase to H2S Biogenesis via Alternative Trans-sulfuration Reactions. J. Biol. Chem. 2009, 284, 22457–22466. [Google Scholar] [CrossRef] [PubMed]
  5. Yu, C.; Li, X.; Zeng, F.; Zheng, F.; Wu, S. Carbon-dot-based ratiometric fluorescent sensor for detecting hydrogen sulfide in aqueous media and inside live cells. Chem. Commun. 2013, 49, 403–405. [Google Scholar] [CrossRef]
  6. Giuliani, D.; Ottani, A.; Zaffe, D.; Galantucci, M.; Strinati, F.; Lodi, R.; Guarini, S. Hydrogen sulfide slows down progression of experimental Alzheimer’s disease by targeting multiple pathophysiological mechanisms. Neurobiol. Learn. Mem. 2013, 104, 82–91. [Google Scholar] [CrossRef] [PubMed]
  7. Wang, B.; Wang, X.; Zeng, A.; Leng, J.; Zhao, W. Engineering a mitochondria-targeted ratiometric fluorescent probe with a large Stokes shift for H2S-specific assaying in foodstuffs and living cells. Sens. Actuators B Chem. 2021, 343, 130095. [Google Scholar] [CrossRef]
  8. Wu, L.; Ishigaki, Y.; Hu, Y.; Sugimoto, K.; Zeng, W.; Harimoto, T.; Sun, Y.; He, J.; Suzuki, T.; Jiang, X.; et al. H2S-activatable near-infrared afterglow luminescent probes for sensitive molecular imaging in vivo. Nat. Commun. 2020, 11, 446. [Google Scholar] [CrossRef] [PubMed]
  9. Yang, W.; Yang, G.; Jia, X.; Wu, L.; Wang, R. Activation of KATP channels by H2S in rat insulin-secreting cells and the underlying mechanisms. J. Physiol. 2005, 569, 519–531. [Google Scholar] [CrossRef]
  10. Chen, S.; Li, H.; Hou, P. A novel imidazo [1,5-α]pyridine-based fluorescent probe with a large Stokes shift for imaging hydrogen sulfide. Sens. Actuators B Chem. 2018, 256, 1086–1092. [Google Scholar] [CrossRef]
  11. Wang, J.; Wen, Y.; Huo, F.; Yin, C. Based ‘successive’ nucleophilic substitution mitochondrial-targeted H2S red light emissive fluorescent probe and its imaging in mice. Sens. Actuators B Chem. 2019, 297, 126773. [Google Scholar] [CrossRef]
  12. Jin, L.; Tan, X.; Dai, L.; Bai, H.; Wang, Q. Modulation of fluorescence sensing properties of coumarin-based fluorescent probe for H2S and its application in cell imaging. Spectrochim. Acta A Mol. Biomol. Spectrosc. 2019, 221, 117187. [Google Scholar] [CrossRef] [PubMed]
  13. Zhao, B.; Yang, Y.; Wu, Y.; Yang, B.; Chai, J.; Hu, X.; Liu, B. To re-evaluate the emission mechanism, AIE activity of 5-azidofluorescein and its reaction with H2S and NO. Sens. Actuators BChem. 2018, 256, 79–88. [Google Scholar] [CrossRef]
  14. Gunduz, H.; Almammadov, T.; Dirak, M.; Acari, A.; Bozkurt, B.; Kolemen, S. A mitochondria-targeted chemiluminescent probe for detection of hydrogen sulfide in cancer cells, human serum and in vivo. RSC Chem. Biol. 2023, 4, 675–684. [Google Scholar] [CrossRef] [PubMed]
  15. Zhu, T.; Ren, N.; Liu, X.; Dong, Y.; Wang, R.; Gao, J.; Sun, J.; Zhu, Y.; Wang, L.; Fan, C.; et al. Probing the Intracellular Dynamics of Nitric Oxide and Hydrogen Sulfide Using an Activatable NIR II Fluorescence Reporter. Angew. Chem. 2021, 60, 8450–8454. [Google Scholar] [CrossRef]
  16. Zhu, A.; Ali, S.; Jiao, T.; Wang, Z.; Xu, Y.; Ouyang, Q.; Chen, Q. Facile synthesis of fluorescence-SERS dual-probe nanocomposites for ultrasensitive detection of sulfur-containing gases in water and beer samples. Food Chem. 2023, 420, 136095. [Google Scholar] [CrossRef]
  17. Yu, H.; Ryu, K.; Park, J.; Subedi, S.; Lee, K.-H. Design and synthesis of fluorescent peptide-based probes with aggregation-induced emission characteristic for detecting CH3Hg+ and Hg2+ in aqueous environment: Tuning fluorescent detection for CH3Hg+ by replacing peptide receptors. Dye. Pigment. 2022, 204, 110461. [Google Scholar] [CrossRef]
  18. Nicol, A.; Qin, W.; Kwok RT, K.; Burkhartsmeyer, J.M.; Zhu, Z.; Su, H.; Luo, W.; Lam JW, Y.; Qian, J.; Wong, K.S.; et al. Functionalized AIE nanoparticles with efficient deep-red emission, mitochondrial specificity, cancer cell selectivity and multiphoton susceptibility. Chem. Sci. 2017, 8, 4634–4643. [Google Scholar] [CrossRef]
  19. Zhao, B.; Yang, B.; Hu, X.; Liu, B. Two colorimetric and ratiometric fluorescence probes for hydrogen sulfide based on AIE strategy of alpha-cyanostilbenes. Spectrochim. Acta A Mol. Biomol. Spectrosc. 2018, 199, 117–122. [Google Scholar] [CrossRef]
  20. Fang, W.; Zhang, G.; Chen, J.; Kong, L.; Yang, L.; Bi, H.; Yang, J. An AIE active probe for specific sensing of Hg2+ based on linear conjugated bis-Schiff base. Sens. Actuators B Chem. 2016, 229, 338–346. [Google Scholar] [CrossRef]
  21. Hou, J.; Huang, Y.; Fu, L.; Sun, M.; Wang, L.; Guo, R.; Chen, L.; Lv, C. Evaluating the Effect of Hydrogen Sulfide in the Idiopathic Pulmonary Fibrosis Model with a Fluorescent Probe. Anal. Chem. 2023, 95, 5514–5521. [Google Scholar] [CrossRef] [PubMed]
  22. Wang, R.; Gu, X.; Li, Q.; Gao, J.; Shi, B.; Xu, G.; Zhu, T.; Tian, H.; Zhao, C. Aggregation Enhanced Responsiveness of Rationally Designed Probes to Hydrogen Sulfide for Targeted Cancer Imaging. J. Am. Chem. Soc. 2020, 142, 15084–15090. [Google Scholar] [CrossRef] [PubMed]
  23. He, L.; He, L.H.; Xu, S.; Ren, T.B.; Zhang, X.X.; Qin, Z.J.; Zhang, X.B.; Yuan, L. Engineering of Reversible NIR-II Redox-Responsive Fluorescent Probes for Imaging of Inflammation In Vivo. Angew. Chem. Int. Ed. Engl. 2022, 61, e202211409. [Google Scholar] [CrossRef] [PubMed]
  24. Lu, Z.; Tan, J.; Wu, Y.; You, J.; Xie, X.; Zhang, Z.; Li, Z.; Chen, L. NIR Light-Activated Mitochondrial RNA Cross-Linking Strategy for H2S Monitoring and Prolonged Colorectal Tumor Imaging. Anal. Chem. 2023, 95, 17089–17098. [Google Scholar] [CrossRef] [PubMed]
  25. Shortreed, M.; Kopelman, R.; Kuhn, M.; Hoyland, B. Fluorescent fiber-optic calcium sensor for physiological measurements. Anal. Chem. 1996, 68, 1414–1418. [Google Scholar] [CrossRef] [PubMed]
  26. Zhao, H.; Qi, F.; Xiong, Y.; Lu, J. A chemiluminescent sensor for imaging endogenous hydrogen polysulfides in a living system. Analyst 2023, 148, 3347–3353. [Google Scholar] [CrossRef] [PubMed]
  27. Sharma, N.; Kumar, V.; Jose, D.A. A ruthenium nitrosyl complex-based highly selective colorimetric sensor for biological H2S and H2S-NO cross-talk regulated release of NO. Dalton Trans. 2023, 52, 675–682. [Google Scholar] [CrossRef] [PubMed]
  28. Wang, K.; Yang, X.; Guo, M.-Y.; Chen, X.-Y.; Li, T.; Yan, R.; Yang, Y.-S.; Zhu, H.-L.; Hu, Z.-G. Imaging the dynamic processes of hydrogen sulfide using a rapid “turn-on” mitochondria-targeting fluorescent probe. Sens. Actuators B Chem. 2022, 369, 132285. [Google Scholar] [CrossRef]
  29. Zhang, C.L.; Liu, C.; Ding, Y.W.; Wang, H.T.; Nie, S.R.; Zhang, Y.P. A novel fluorescent probe based on naphthimide for H2S identification and application. Anal. Biochem. 2023, 677, 115232. [Google Scholar] [CrossRef]
  30. Du, Y.; Wang, H.; Zhang, T.; Wen, W.; Li, Z.; Bi, M.; Liu, J. An ESIPT-based fluorescent probe with fast-response for detection of hydrogen sulfide in mitochondria. Spectrochim. Acta A Mol. Biomol. Spectrosc. 2022, 265, 120390. [Google Scholar] [CrossRef]
  31. Zeng, S.; Li, S.J.; Sun, X.J.; Li, M.Q.; Ma, Y.Q.; Xing, Z.Y.; Li, J.L. A naphthalene-quinoline based chemosensor for fluorescent “turn-on” and absorbance-ratiometric detection of Al3+ and its application in cells imaging. Spectrochim. Acta A Mol. Biomol. Spectrosc. 2018, 205, 276–286. [Google Scholar] [CrossRef] [PubMed]
  32. Wang, L.; Li, W.; Zhi, W.; Huang, Y.; Han, J.; Wang, Y.; Ren, Y.; Ni, L. A new coumarin schiff based fluorescent-colorimetric chemosensor for dual monitoring of Zn2+ and Fe3+ in different solutions: An application to bio-imaging. Sens. Actuators B Chem. 2018, 260, 243–254. [Google Scholar] [CrossRef]
  33. Chen, G.; Xu, J.; Zhan, Z.; Gao, X.; Jiao, M.; Ren, M.; Lv, L.; Chen, T.; Li, Y.; Liu, Y. A bright two-photon fluorescence probe with large stokes shift for deep tissue imaging of H2S during metabolism. Dye. Pigment. 2020, 172, 107850. [Google Scholar] [CrossRef]
  34. Liu, C.; Liu, Q.; Cai, S.; Ding, H.; He, S.; Zhao, L.; Zeng, X.; Gong, J. Novel near-infrared spectroscopic probe for visualizing hydrogen sulfide in lysosomes. Spectrochim. Acta A Mol. Biomol. Spectrosc. 2022, 271, 120917. [Google Scholar] [CrossRef] [PubMed]
  35. Chen, X.; He, D.; Yang, X.; Yuan, F.; Yang, S.; Yang, Y.; Wang, K.; Qian, J.; Long, L. Construction of bifunctional fluorescent probe for two-step cascade recognition of hydrogen sulfide and biothiols in biological system. Sens. Actuators B Chem. 2023, 381, 133440. [Google Scholar] [CrossRef]
  36. Zhu, J.; Hu, X.; Yang, B.; Liu, B. Dual sites fluorescence probe for hydrogen sulfide: AIEE activity and supramolecular assembly with β-cyclodextrin. Sens. Actuators B Chem. 2019, 282, 743–749. [Google Scholar] [CrossRef]
  37. Ma, Y.; Wang, X.; Wang, Z.; Zhang, G.; Chen, X.; Zhang, Y.; Luo, Y.; Gao, G.; Zhou, X. A water-soluble NIR fluorescent probe capable of rapid response and selective detection of hydrogen sulfide in food samples and living cells. Talanta 2023, 256, 124303. [Google Scholar] [CrossRef] [PubMed]
  38. Yang, Y.; Feng, Y.; Jiang, Y.; Qiu, F.; Wang, Y.; Song, X.; Tang, X.; Zhang, G.; Liu, W. A coumarin-based colorimetric fluorescent probe for rapid response and highly sensitive detection of hydrogen sulfide in living cells. Talanta 2019, 197, 122–129. [Google Scholar] [CrossRef] [PubMed]
  39. Du, Y.; Wang, H.; Qin, L.; Zhao, M.; Pan, C. Rational development of an ESIPT-based fluorescent probe with large Stokes shift for imaging of hydrogen sulfide in live cells. Bioorg Chem. 2022, 129, 106158. [Google Scholar] [CrossRef]
  40. Zhou, Y.; Yan, J.; Zhang, N.; Li, D.; Xiao, S.; Zheng, K. A ratiometric fluorescent probe for formaldehyde in aqueous solution, serum and air using aza-cope reaction. Sens. Actuators B Chem. 2018, 258, 156–162. [Google Scholar] [CrossRef]
  41. Li, Y.; Chu, T.S. DFT/TDDFT study on the sensing mechanism of a fluorescent probe for hydrogen sulfide: Excited state intramolecular proton transfer coupled twisted intramolecular charge transfer. J. Phys. Chem. A 2017, 121, 5245–5256. [Google Scholar] [CrossRef] [PubMed]
  42. Samanta, S.; Manna, U.; Ray, T.; Das, G. An aggregation-induced emission (AIE) active probe for multiple targets: A fluorescent sensor for Zn2+ and Al3+ & a colorimetric sensor for Cu2+ and F. Dalton Trans. 2015, 44, 18902–18910. [Google Scholar] [PubMed]
  43. Qin, X.; Liu, X.; Wang, J.; Chen, H.; Shen, X.C. A NIR ratiometric fluorescent probe for the rapid detection of hydrogen sulfide in living cells and zebrafish. Talanta 2024, 266, 125043. [Google Scholar] [CrossRef] [PubMed]
  44. Xiong, J.; Xia, L.; Huang, Q.; Huang, J.; Gu, Y.; Wang, P. Cyanine-based NIR fluorescent probe for monitoring H2S and imaging in living cells and in vivo. Talanta 2018, 184, 109–114. [Google Scholar] [CrossRef]
  45. Ou, P.; Wang, Y.; Hao, C.; Peng, Y.; Zhou, L.Y. Naphthalimide-based a highly selective two-photon fluorescent probe for imaging of hydrogen sulfide in living cells and inflamed tissue of mouse model. Spectrochim. Acta A Mol. Biomol. Spectrosc. 2021, 245, 118886. [Google Scholar] [CrossRef]
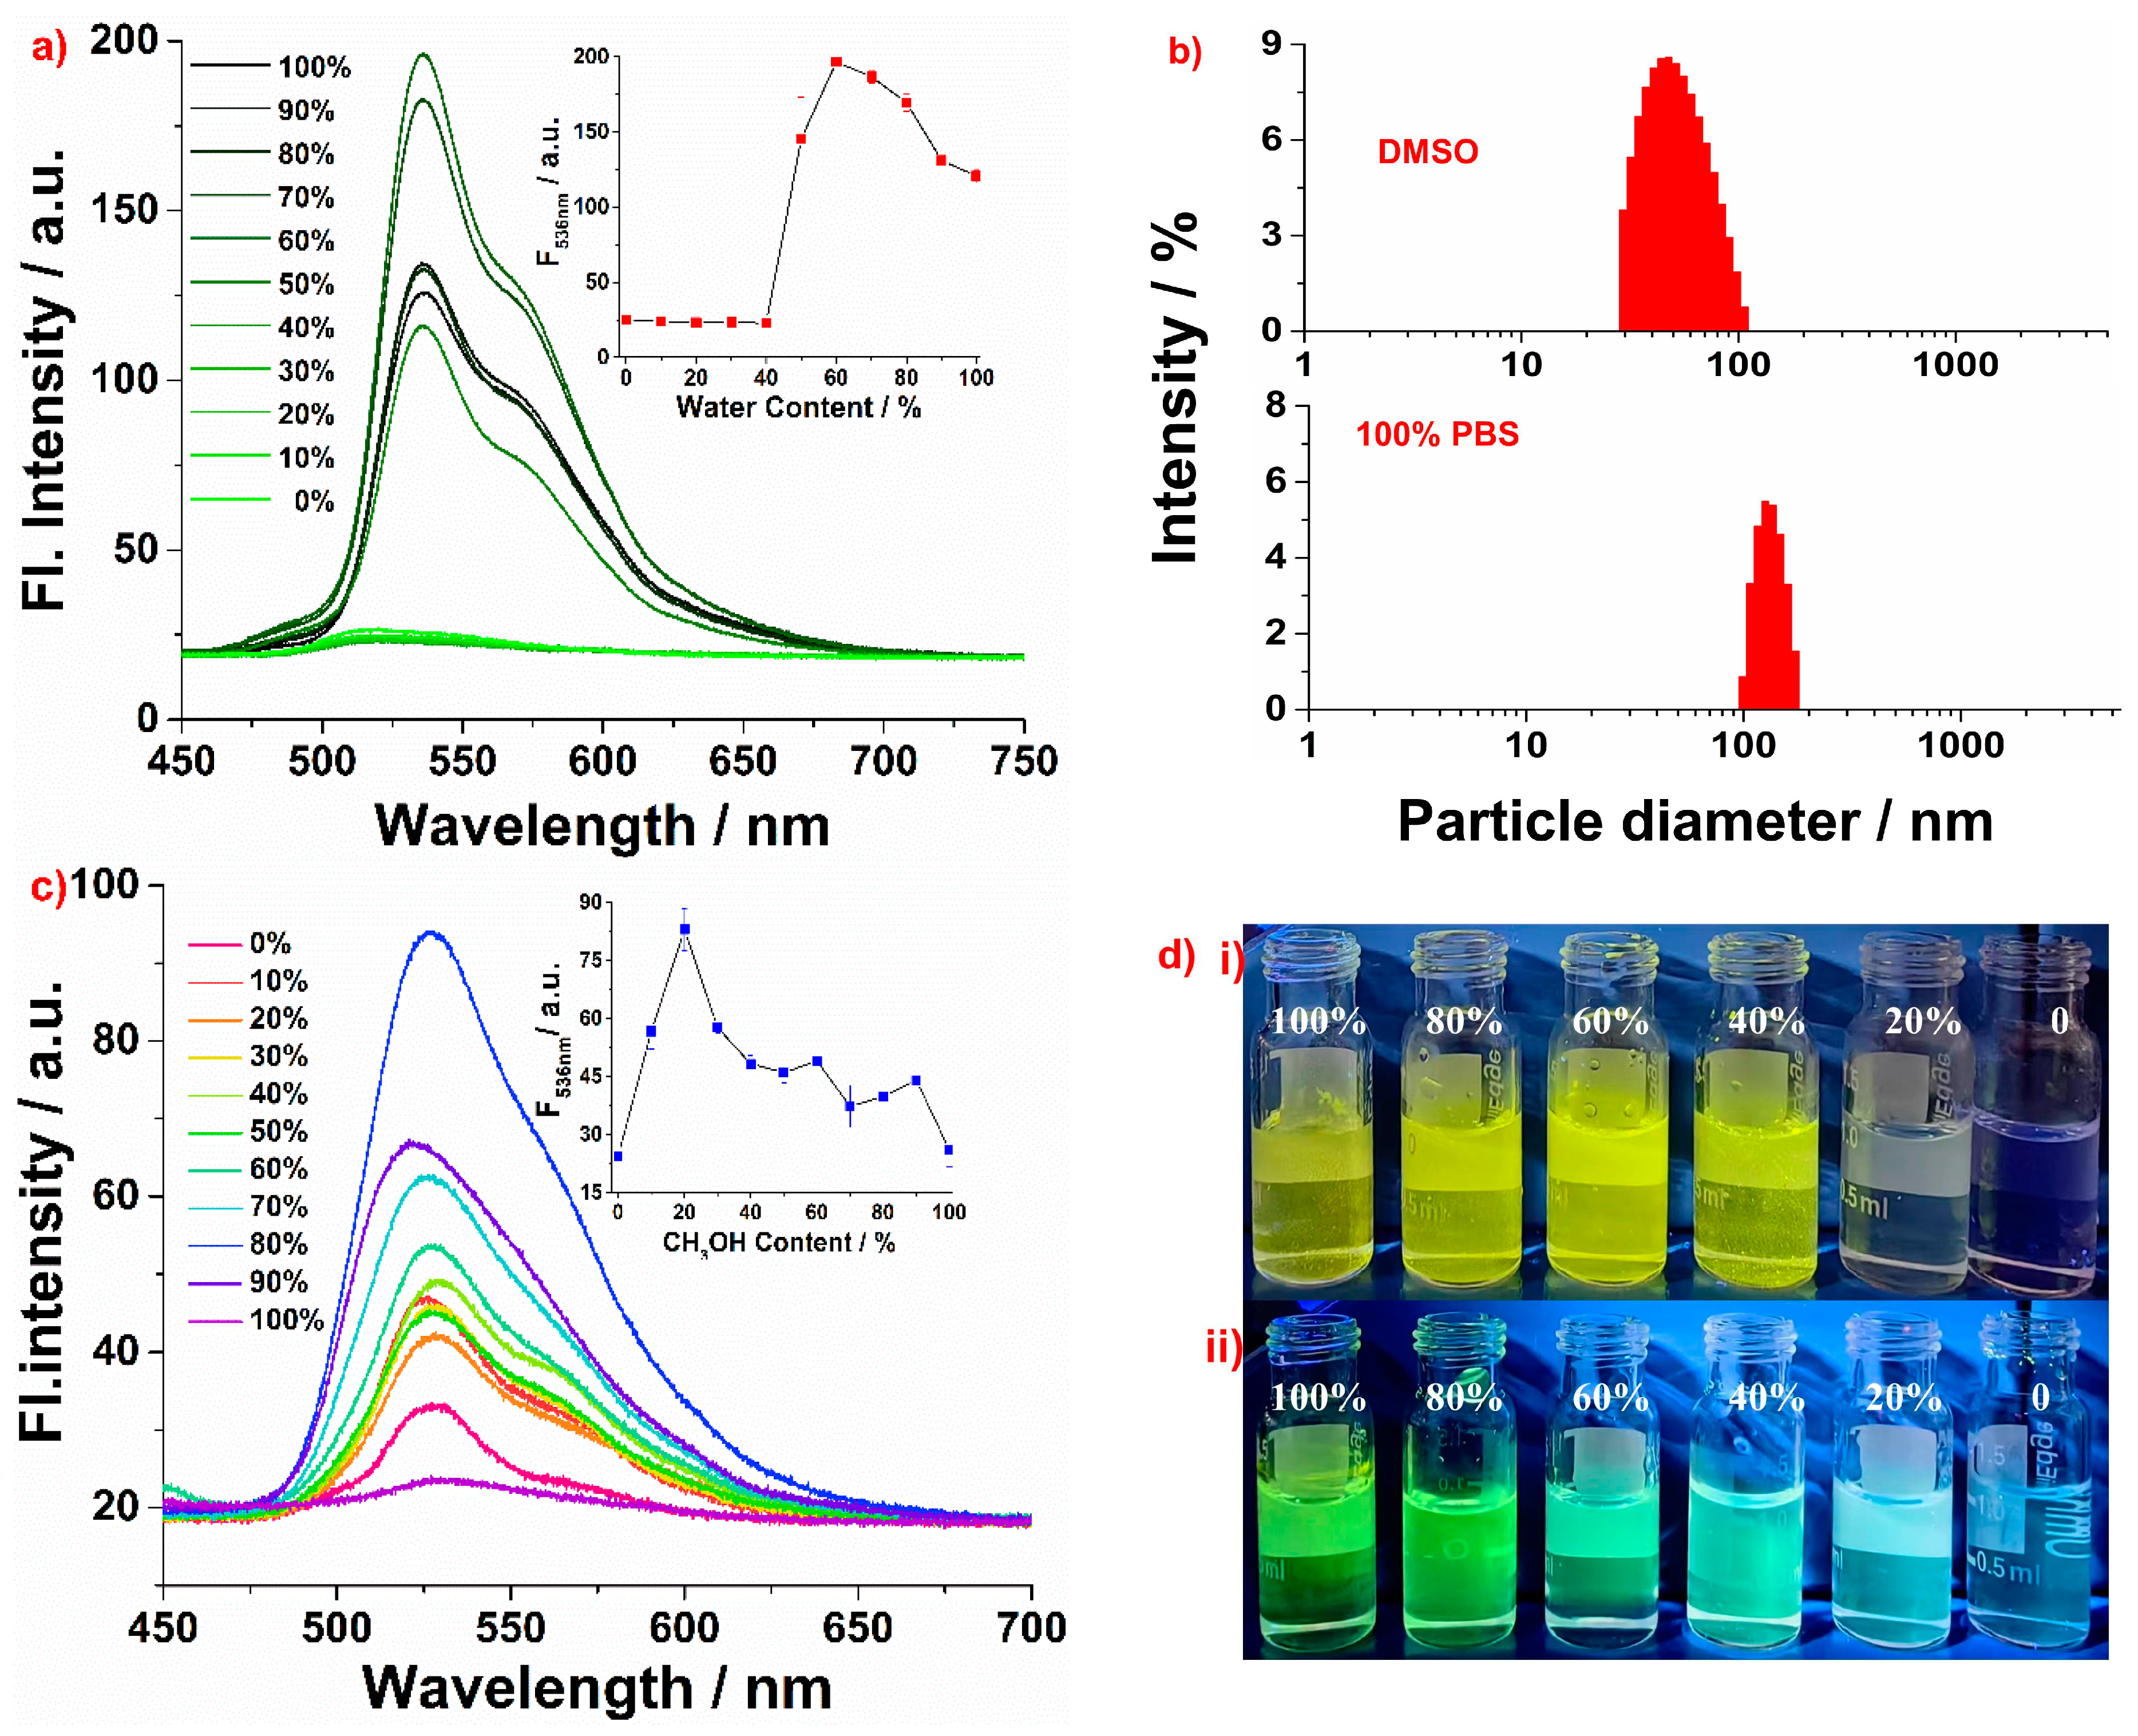
Figure 1. (a) Fluorescence spectra of HND (5.0 μM) in DMSO/water mixtures with different water fractions, pH 7.4. (b) Particle size analysis of HND in DMSO and PBS. (c) Fluorescence spectra of HND (5.0 μM) in CH3OH/glycerin mixtures with different glycerin fractions, λex = 420 nm. (d) The corresponding fluorescence images of HND under 365 nm UV lamp illumination ((i) different PBS/DMSO mixtures; (ii) different CH3OH/glycerin mixtures).
Molecules 29 02386 g001
Figure 2. (a) Selectivity profile of 5.0 μM HND toward the RSS, various anions and H2O2 (500 μM) in PBS buffer (10 mM, pH 7.4), λex = 420 nm. (b) Fluorescence intensity changes of 5.0 μM HND upon addition of 100 equiv. H2S and 100 equiv. of the RSS, various anions and H2O2, λem = 536 nm (1–18: HND, Na2S2O3, NaHSO3, Na2SO4, Na2SO3, L-Cys, GSH, H2O2, Na3PO4, NaI, NaF, NaCl, NaBr, Na2CO3, NaHCO3, Na2C2O4, NaNO3, NaNO2).
Molecules 29 02386 g002
Figure 3. (a) The fluorescence titration curve of 5.0 μM HND in the presence of different concentrations of H2S. Inset: (i) The corresponding fluorescence images of HND and HND mixed with H2S under 365 nm UV lamp illumination. (ii) Changes in emission intensity at 536 nm with incremental additions of H2S. (b) CIE diagram of the HND in PBS buffer solution (10 mM, pH = 7.40). (c) Changes in emission intensity of HND (5.0 μM) at 536 nm in the presence of 10 equiv. of H2S as the function of time. (d) Absorption spectra of HND (15 μM) treated with different concentrations of H2S.
Molecules 29 02386 g003
Figure 4. ESI mass spectrum of HND upon addition of excess Na2S.
Molecules 29 02386 g004
Figure 5. HOMOs and LUMOs of HND and HND -HS.
Molecules 29 02386 g005
Figure 6. Fluorescence microscopy images of HeLa cells. (a,d,g) HeLa cells incubated with HND (20 μM) for 20 min. (b,e,h) HeLa cells pretreated with HND (20 μM) and then treated with H2S (20 μM) for 20 min. (c,f,i) HeLa cells pretreated with HND (20 μM) and then treated with H2S (40 μM) for 20 min.
Molecules 29 02386 g006
Scheme 1. Design and synthesis of the HND.
Molecules 29 02386 sch001
Disclaimer/Publisher’s Note: The statements, opinions and data contained in all publications are solely those of the individual author(s) and contributor(s) and not of MDPI and/or the editor(s). MDPI and/or the editor(s) disclaim responsibility for any injury to people or property resulting from any ideas, methods, instructions or products referred to in the content.