Article

Effect of Equivalence Ratio on Pollutant Formation in CH4O/H2/NH3 Blend Combustion

1
School of Energy and Environment, Anhui University of Technology, Ma’anshan 243002, China
2
School of Materials Science and Engineering, Anhui University of Technology, Ma’anshan 243032, China
*
Author to whom correspondence should be addressed.
Molecules 2024, 29(1), 176; https://doi.org/10.3390/molecules29010176
Submission received: 28 November 2023 / Revised: 25 December 2023 / Accepted: 25 December 2023 / Published: 28 December 2023

Abstract

:
This paper investigates the effect of equivalence ratio on pollutant formation characteristics of CH4O/H2/NH3 ternary fuel combustion and analyzes the pollutant formation mechanisms of CO, CO2, and NOX at the molecular level. It was found that lowering the equivalence ratio accelerates the decomposition of CH4O, H2, and NH3 in general. The fastest rate of consumption of each fuel was found at φ = 0.33, while the rates of CH4O and NH3 decomposition were similar for the φ = 0.66 and φ = 0.4. CO shows an inverted U-shaped trend with time, and peaks at φ = 0.5. The rate and amount of CO2 formation are inversely proportional to the equivalence ratio. The effect of equivalence ratio on CO2 is obvious when φ > 0.5. NO2 is the main component of NOX. When φ < 0.66, NOX shows a continuous increasing trend, while when φ ≥ 0.66, NOX shows an increasing and then stabilizing trend. Reaction path analysis showed that intermediates such as CH3 and CH4 were added to the CH4O to CH2O conversion stage as the equivalence ratio decreased with φ ≥ 0.5. New pathways, CH4O→CH3→CH2O and CH4O→CH3→CH4→CH2O, were added. At φ ≤ 0.5, new intermediates CHO2 and CH2O2 were added to the CH2O to CO2 conversion stage, and new pathways are added: CH2O→CO→CHO2→CO2, CH2O→CO→CO2, CH2O→CHO→CO→CHO2→CO2, and CH2O→CH2O2→CO2. The reduction in the number of radical reactions required for the conversion of NH3 to NO from five to two directly contributes to the large amount of NOX formation. Equivalent ratios from 1 to 0.33 corresponded to 12%, 21.4%, 34%, 46.95%, and 48.86% of NO2 remaining, respectively. This is due to the fact that as the equivalence ratio decreases, more O2 collides to form OH and some of the O2 is directly involved in the reaction forming NO2.

Graphical Abstract

1. Introduction

Currently, the global transportation industry relies mainly on fossil energy sources [1], but the combustion of these traditional fossil energy sources causes a lot of pollution. Clean, efficient, and sustainable are the current trends in energy development [2,3]. Hydrogen and ammonia are both ideal clean and renewable fuels, which have received extensive attention from scholars at home and abroad. Hydrogen is renewable and characterized by good combustibility, low ignition energy, and fast combustion speed [4,5]. However, the difficulties in storing and transporting hydrogen, the premature ignition and backfire caused by overly fast combustion speeds, and the high combustion temperature that produces NOX pollution have all limited the practical popularization of the use of pure hydrogen fuel [6]. Ammonia, as a good zero-carbon hydrogen storage carrier, can be obtained from biomass or other renewable sources. It is considered a sustainable fuel that can be transported and applied remotely [7]. Currently, ammonia is widely used as a fuel in automobile engines [8], marine engines [9], and generator internal combustion engines [10], where the low viscosity of ammonia helps in fuel atomization and droplet formation during fuel injection [11]. Ammonia also has a high octane rating, which makes it suitable for engines with high compression ratios and reduced detonation [12]. However, the disadvantages of ammonia’s low combustion rate [13] and high auto-ignition temperature [14], as well as narrow combustible limits, tend to lead to incomplete combustion, which results in poor engine performance. Therefore, it is difficult to use as a single fuel for direct combustion [15,16]. The use of hydrogen as a combustion aid and ammonia miscombustion was found to be one of the ways to improve ammonia combustion efficiency [17]. This not only leads to improved in-cylinder combustion [18] but also reduces the requirement for engine modifications (material compatibility), thus ensuring a cost-effective transition to hydrogen energy [19]. Wang et al. [20] found that engine exhaust heat can crack some of the ammonia into hydrogen and nitrogen to form reformed gases, making this method much more maneuverable. A study by Alam et al. [21] indicated that although hydrogen–ammonia blending can reduce carbon emissions including CO and others in diesel internal combustion engines, incomplete combustion of the fuel and higher NOX emission phenomena were observed.
Blending oxygenated fuels as a combustion aid is also an effective way to improve combustion performance and pollutant emissions in diesel engines [22,23]. Methanol, as the saturated monohydric alcohol with the simplest structure, is inexpensive and simple to synthesize. It is a high-quality representative for studying the combustion-enhancing effect of oxygenated fuels [24,25]. Methanol is ideal for fuel-lean combustion. However, obtaining high energy and reliable ignition is one of the biggest challenges of fuel-lean combustion [26]. The reformed gas in the engine can provide exactly this energy due to the presence of H2. Li et al. [27] investigated the ignition delay time of ammonia/methanol blends with equivalence ratios of 0.5, 1.0, and 2.0 and temperatures in the temperature range of 1250–2150 K. The results showed that the ignition delay time of ammonia/methanol blends was mainly affected by free radicals such as OH, O, HO2, and H. Li et al. [28] found that blending a small amount of methanol into ammonia combustion made the blend more reactive due to the fact that the addition of methanol introduced a new reaction sequence, CH3OH→CH2OH/CH3O→CH2O→CHO, which enriched the O/H radical library.
However, there are very few studies on CH4O/H2/NH3 blend combustion. Given the complexity of engine in-cylinder combustion and pollutant formation characteristics, it is not conducive to the isolated exploration of chemical reaction kinetics and mixed fuel combustion pollutant laws under different operating parameters [29]. This leads to the fact that the mechanism of blended combustion action is not yet well clarified.

2. Results and Discussion

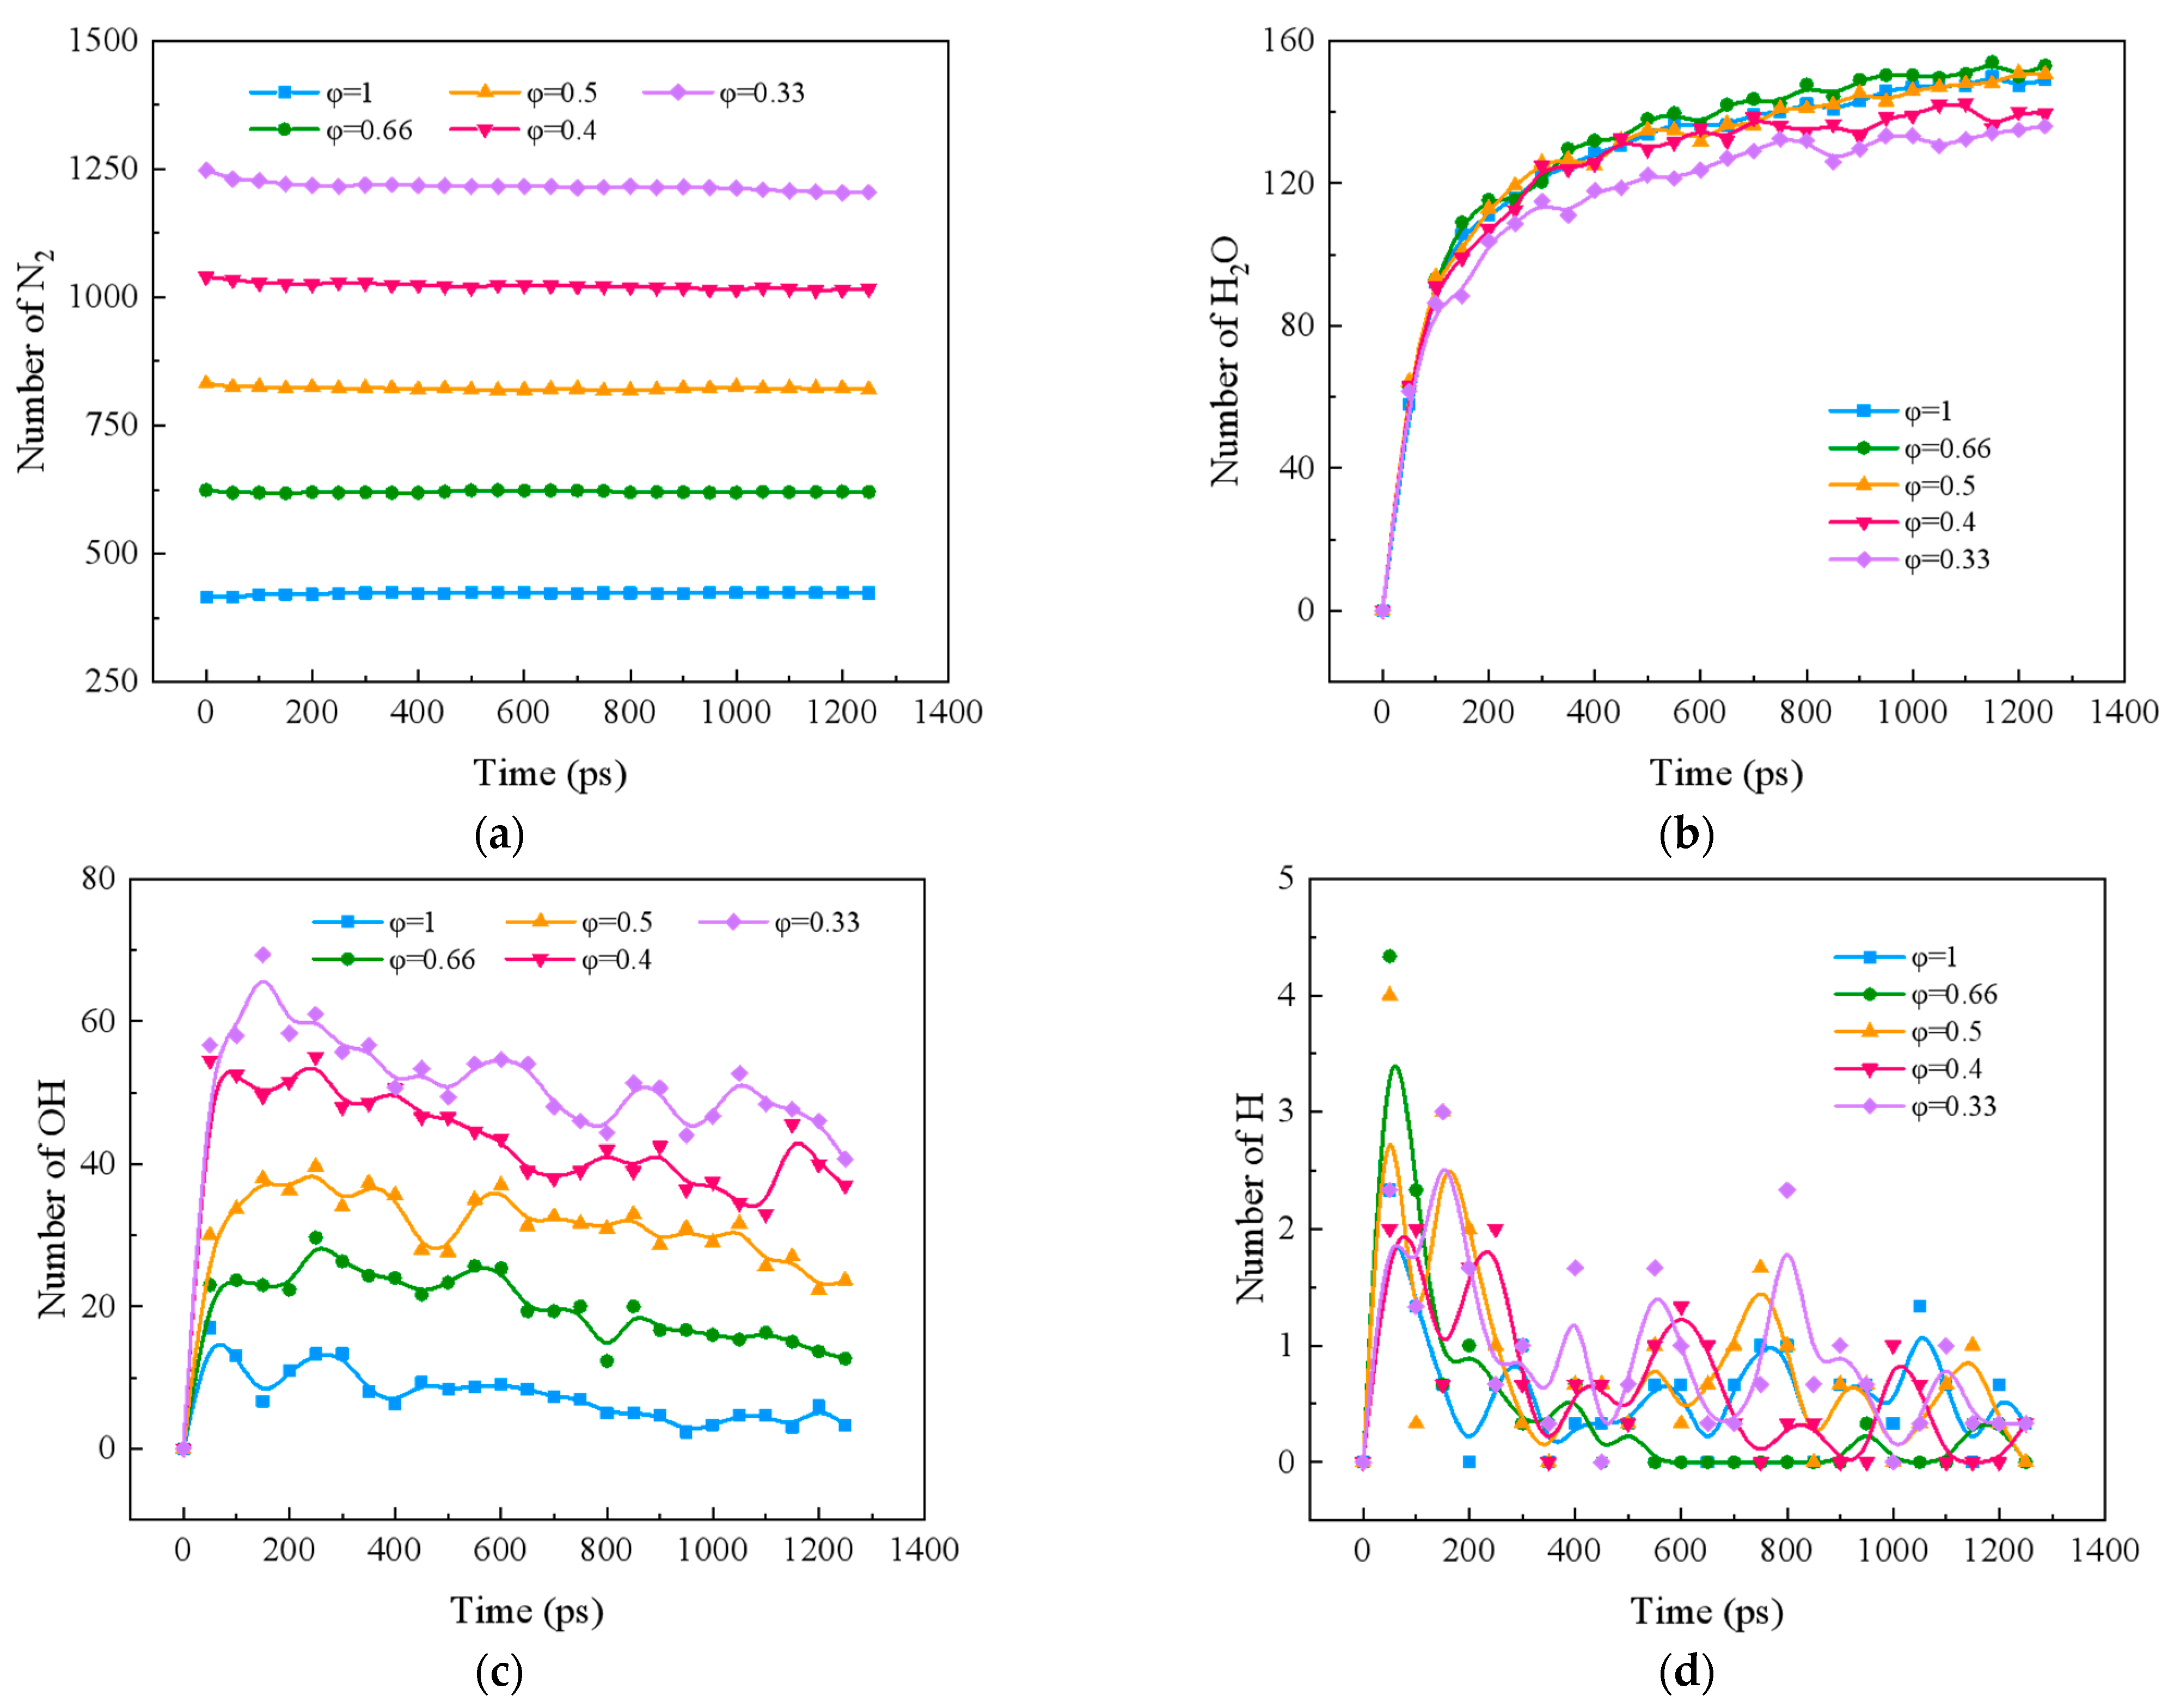
2.1. Effect of Equivalent Ratio on Combustion Components of Ternary Carbon-Neutral Fuel Blends

Figure 1 shows the effect of different equivalence ratios on the four reactant components, CH4O, NH3, H2, and O2, during the blended combustion process of ternary carbon-neutral fuels. Lowering the equivalence ratio accelerates the decomposition of CH4O, NH3, and H2 in general. As the equivalence ratio is lowered, the decomposition rate of CH4O is the fastest at φ = 0.33 throughout the reaction. As the reaction proceeds, the decomposition rate of the φ = 0.5 condition becomes progressively higher, gradually replacing the φ = 0.4 condition. At this time, the decomposition rate of CH4O was similar between φ = 0.4 and φ = 0.66. The decomposition rate of NH3 increased linearly with the decrease in the equivalence ratio, and the consumption rate of O2 increased with the increase in the equivalence ratio when φ ≤ 0.5, and its consumption rate was the smallest when φ = 0.4. The curves of H2 showed a similar trend to that of CH4O, and the highest consumption rate was found in the case of φ = 0.33; this was next to that in the case of φ = 0.5, but it was different from that of φ = 0.4. φ = 0.4 is not notably different.
Figure 2 shows the variation of major products and radicals during combustion of ternary carbon-neutral fuels at different equivalence ratios. Figure 2a indicates that there is almost no change in N2 with time for different equivalence ratios. Only N2 at φ = 1 has an increase, and the decreasing trend of N2 becomes more and more obvious as the equivalence ratio decreases at φ ≤ 0.66. This is because at a reaction temperature of 2000 K, oxygen becomes more and more abundant as the equivalence ratio decreases, and more N2 reacts with O to produce more thermodynamic NOX. Figure 2b shows the trend of H2O over time. There is no strict linear relationship between the amount of H2O generated and the equivalence ratio. The maximum amount of H2O is generated at φ = 0.66, and there is little difference between φ = 1 and φ = 0.5.
Figure 2c,d show the effect of different equivalence ratios on the formation of OH and H during the blending process of ternary carbon-neutral fuels, respectively. Comparing the two figures, it can be seen that the effect of equivalence ratio on OH is more pronounced. OH increases rapidly and then decreases slowly as time progresses. The higher the equivalence ratio, the higher the amount of low OH. OH may be the key radical leading to the depletion of CH4O, H2, and NH3. This conclusion will be confirmed in Section 2.3. The H curve shows a tendency to rise and then fall, with a small but fluctuating overall number. The peak occurs at φ = 0.66. H also assumes an important role in the reaction.

2.2. Effect of Equivalence Ratio on Pollutant Formation in Blended Combustion of Ternary Carbon-Neutral Fuels

2.2.1. Effect of Equivalent Ratio on CO and CO2 Formation in Blended Combustion of Ternary Carbon-Neutral Fuels

Figure 3a shows the formation of CO during the blending process of ternary carbon-neutral fuels at different equivalence ratios. CO shows an inverted U-shape trend with time, the peak value of CO shifts backward with the increase in the equivalence ratio, and the rate of CO formation increases with the decrease in the equivalence ratio in the early stage of the reaction. The CO peaks were 9.33, 8.67, 9.67, 9.33, and 8.67 for the equivalence ratios from 1 to 0.33, respectively. The maximum CO peak was observed at φ = 0.5. This may be due to the fact that there is more CO production and less CO consumption at φ = 0.5. The detailed pathway analysis will be carried out at the molecular level in Section 2.3 for the specific causes.
Figure 3b shows the CO2 formation during the combustion of ternary carbon-neutral fuel blends with different equivalence ratios. The CO2 formation rate and amount are inversely proportional to the size of the equivalence ratio. The equivalence ratio has little effect on the amount of CO2 when φ ≤ 0.5. When the equivalence ratio φ > 0.5, the effect of the equivalence ratio on CO2 is more obvious.

2.2.2. Effect of Equivalent Ratio on NOX Formation in Blended Combustion of Ternary Carbon-Neutral Fuels

Figure 4 shows the effect of equivalence ratio on the formation of NOX (NO, NO2, and NO3) in the combustion of ternary carbon-neutral fuel blends. From Figure 4a, it can be seen that as the combustion proceeds, NO shows a trend of rapid increase followed by a slow decrease. The peak value of NO increases with the decrease in the equivalence ratio. From Figure 4b,c, it can be seen that both NO2 and NO3 gradually increase with the reaction; NO2 is the main component of NOX. NO3 shows an overall trend of increasing and then slowly decreasing, and the peak value increases with the decrease in the equivalence ratio, and the peak time is also delayed. In the middle and late stages of the reaction, NO3 at φ = 0.33 was significantly higher than other working conditions.
As can be seen from Figure 4d, when φ 0.66, NOX shows a tendency to increase and then stabilize as the reaction proceeds. When φ < 0.66, NOX shows a continuous growth trend. and the growth rate decreases around 200ps. However, the NOX growth rate in the middle and late stages when φ < 0.44 is significantly higher than that in the case of φ 0.44.

2.3. Mechanism Analysis of CO, CO2, and NOX Formation in the Combustion of Ternary Blended Fuel as Affected by Equivalence Ratio

In order to further discuss the impact of ternary blended fuel combustion on the mechanism of CO, CO2, and NOX formation as affected by the equivalence ratios, this paper generates reaction network diagrams for five operating conditions and discusses the N and C migration paths of ternary blended fuel combustion at different equivalence ratios as simulated using ReaxFF MD. Figure 5 represents the network diagrams of CO and CO2 formation paths during the combustion of ternary carbon-neutral fuels at equivalence ratios of 1, 0.66, 0.5, 0.4, and 0.33, respectively. The percentage in the network diagram indicates the reactant conversion rate in order to highlight the main paths of the reaction network, and the reaction paths with a conversion rate of less than 15% are ignored in all network diagrams in this study.
As can be seen in Figure 5a, all of the CH4O is converted to CH2O at φ = 1. A proportion of 40% of the CH2O is generated as CO, and 77% of the CH2O is converted to CO2. This is consistent with the numerical ratios of CO and CO2 in Section 2.2. From Figure 5b, it can be seen that all CH4O is also converted to CH2O at φ = 0.66. The difference with φ = 1 is that, in this case, CH4O undergoes a direct reduction reaction with H, and this reaction produces CH3. The conversion of CH2O to CO and CO2 in this case is both 20%.
As can be seen from Figure 5c, the complexity of the reaction path at φ = 0.5 is mainly reflected in the transition from CH4O to CH2O. There are three main paths in this part, which are: CH4O→CH3O→CH2O, CH4O→CH3→CH2O, and CH4O→CH3→CH4→CH2O. Among them, CH3 and CH4 can also be converted to each other. In terms of conversion rate, only 80% of CH4O is converted to CH2O through intermediates such as CH3O, CH3, and CH4. Statistically, 69% of CH4O is converted to CO. A total of 37% of CH4O is converted to CO2. From Figure 5d, it can be seen that all of the CH4O is converted to CH2O when φ = 0.4. The conversion rates of CH2O to CO and CO2 are 60.2% and 46.5%, respectively. From Figure 5e, it can be seen that at φ = 0.33, 80% of CH4O is converted to CH2O from CH3O. The conversion rates of CH4O to CO and CO2 are 32% and 80%, respectively. The path diagram for this case is also complex, unlike at φ = 0.5, where the complexity is mainly in the conversion phase of CH2O to CO and CO2. There are four main reaction paths in this stage, namely CH2O→CHO2→CO2, CH2O→CO→CO2, CH2O→CHO→CO→CO2, and CH2O→CH2O2→CO2.
Comparing with Figure 5, it is found that the number of pre-reaction paths increases as the equivalence ratio decreases for φ ≥ 0.5. At φ = 1, there are only two paths from CH4O to CH2O, CH4O→CH2O and CH4O→CH3O→CH2O. At φ = 0.66, the path of direct conversion of CH4O to CH2O disappears, and the new path CH4O→CH3→CH2O is added. At φ = 0.5, the new path CH4O→CH3→CH4→CH2O is added compared with φ = 0.66. Combined with Figure 2d, this is because there is more H at φ = 0.5 and φ = 0.66. For φ ≤ 0.5, the variety of paths in the later stages of the reaction increases as the equivalence ratio decreases. The intermediate CHO2 is added at φ = 0.5 compared to φ > 0.5. The reaction paths from CH2O to CO2 are only CH2O→CHO→CO→CO2 and CH2O→CHO2→CO2. The new paths CH2O→CO→CHO2→CO2, CH2O→CO→CO2, and CH2O→CHO→CO→CHO2→CO2 are added at φ = 0.4 compared with φ = 0.5. The new paths CH2O→CO→CO2 and CH2O→CH2O2→CO2 are added at φ = 0.33. Statistics show that the highest CO production rate is achieved at φ = 0.5. This validates the conclusion in Section 2.1 that the peak CO occurs at φ = 0.5. The equivalence ratios from 0.66 to 0.33 correspond to CO2 production rates of 20%, 36.9%, 46.5%, and 80%, respectively. The increase with decreasing equivalence ratio is in line with the trend of CO2 formation observed in Section 2.2. It was also found that the lowest CO and CO2 production rates were both 20% at φ = 0.66, and their consumption rates were also the lowest. The combined analysis reveals that the lowest percentage of total CO and CO2 remaining is found at φ = 0.66. Analyzed in conjunction with Figure 2c,d, this is the result of the higher H/OH ratio at φ = 0.66.
Figure 6 represents the network diagram of NOX formation reaction paths in the combustion process of ternary fuels at equivalence ratios of 0.1, 0.66, 0.5, 0.4, and 0.33, respectively. As can be seen from the figure, all NOX in the reaction is converted from NO. As can be seen from Figure 6a, the reaction generates more N2 at φ = 1. There are four main paths of N2 formation. They are NH3→N2H5→N2, NH3→NH2→N2H→N2, NH3→NH2→HNO→N2, and NH3→NH2→NH→N2. This is a result of the fact that less OH radicals are generated by the lower O2 at the high equivalence ratios. NO→HNO2→NO2 is the main path in this case. From Figure 6b, 60% of NH3 is converted to NO at φ = 0.66. NH3→NH2→NH→HNO→NO→HNO2→NO2 is the main conversion path. Compared with φ = 1, a new pathway of NO3 formation and consumption is added: NH3→NH2→NH→HNO→NO→HNO2→NO2→HNO3→NO3→NO2. From Figure 6c, it can be seen that at φ = 0.5, NH3 is fully converted to NO through two different pathways: NH3→NH2→HNO→NO and NH3→NH→HNO→NO. This also leads to the subsequent production of more NOX. As can be seen from Figure 6d, the conversion of NH3 to NO is reduced to 65% at φ = 0.4. There are also two main paths: NH3→NH2→HNO→NO and NH3→HNO→NO. The path from NH3 to NO is shorter compared to that at φ = 0.5. From Figure 6e, the main path is NH3→NH2→H2NO→NO→HNO2→NO2→NO3 at φ = 0.33. The conversion rate of NH3 to NO is 80%. The two conversion paths are NH3→NH2→NO and NH3→HNO→NO. Fewer intermediates are required for the conversion of NH3 to NO in this case than in other cases, and the conversion of NO to NO3 is more direct: NO→NO2→NO3.
A comparison of Figure 6 shows that the main conversion path of NH3 to NO shifts from NH3→NH2→NH→NO, NH3→NH2→NH→HNO→NO, and NH3→NH2→HNO→NO to NH3→HNO→NO and NH3→NH2→NO as the equivalence ratio decreases. The reaction path becomes progressively shorter, which is caused by more O2 in the reaction as the equivalence ratio decreases. With more O2, more OH and O radicals are produced in the reaction, and at low equivalence ratios, O2 also participates directly in the reaction as a free radical. NO2 is the main component of NOX. Statistics show that the remaining proportions of NO2 corresponding to equivalence ratios from 1 to 0.33 are 12%, 21.4%, 34%, 46.95%, and 48.86%, respectively. The remaining proportion of NO2 increases with decreasing equivalence ratios, which explains the conclusion of Section 3.1 that the amount of NO2 increases with decreasing equivalence ratios. The main reaction paths for each case are NH3→NH2→NH→NO→HNO2→NO2, NH3→NH2→NH→HNO→NO→HNO2→NO2→NO, NH3→NH2→HNO→NO→NO2→NO, NH3→HNO→NO→HNO2→NO2→NO, and NH3→NH2→H2NO→NO→HNO2→NO2→NO3. Only φ = 0.33 contains NO3 production in the main pathway. Combined with the conversion analysis, the conversion of NH3 to NO3 is 0, 2.9%, 8.5%, 0, and 19.95%, respectively. This is due to the fact that there are more OH radicals in the tether at low equivalence ratios. It explains the observation in Section 2.1 that NO3 is much higher at φ = 0.33 than other cases.

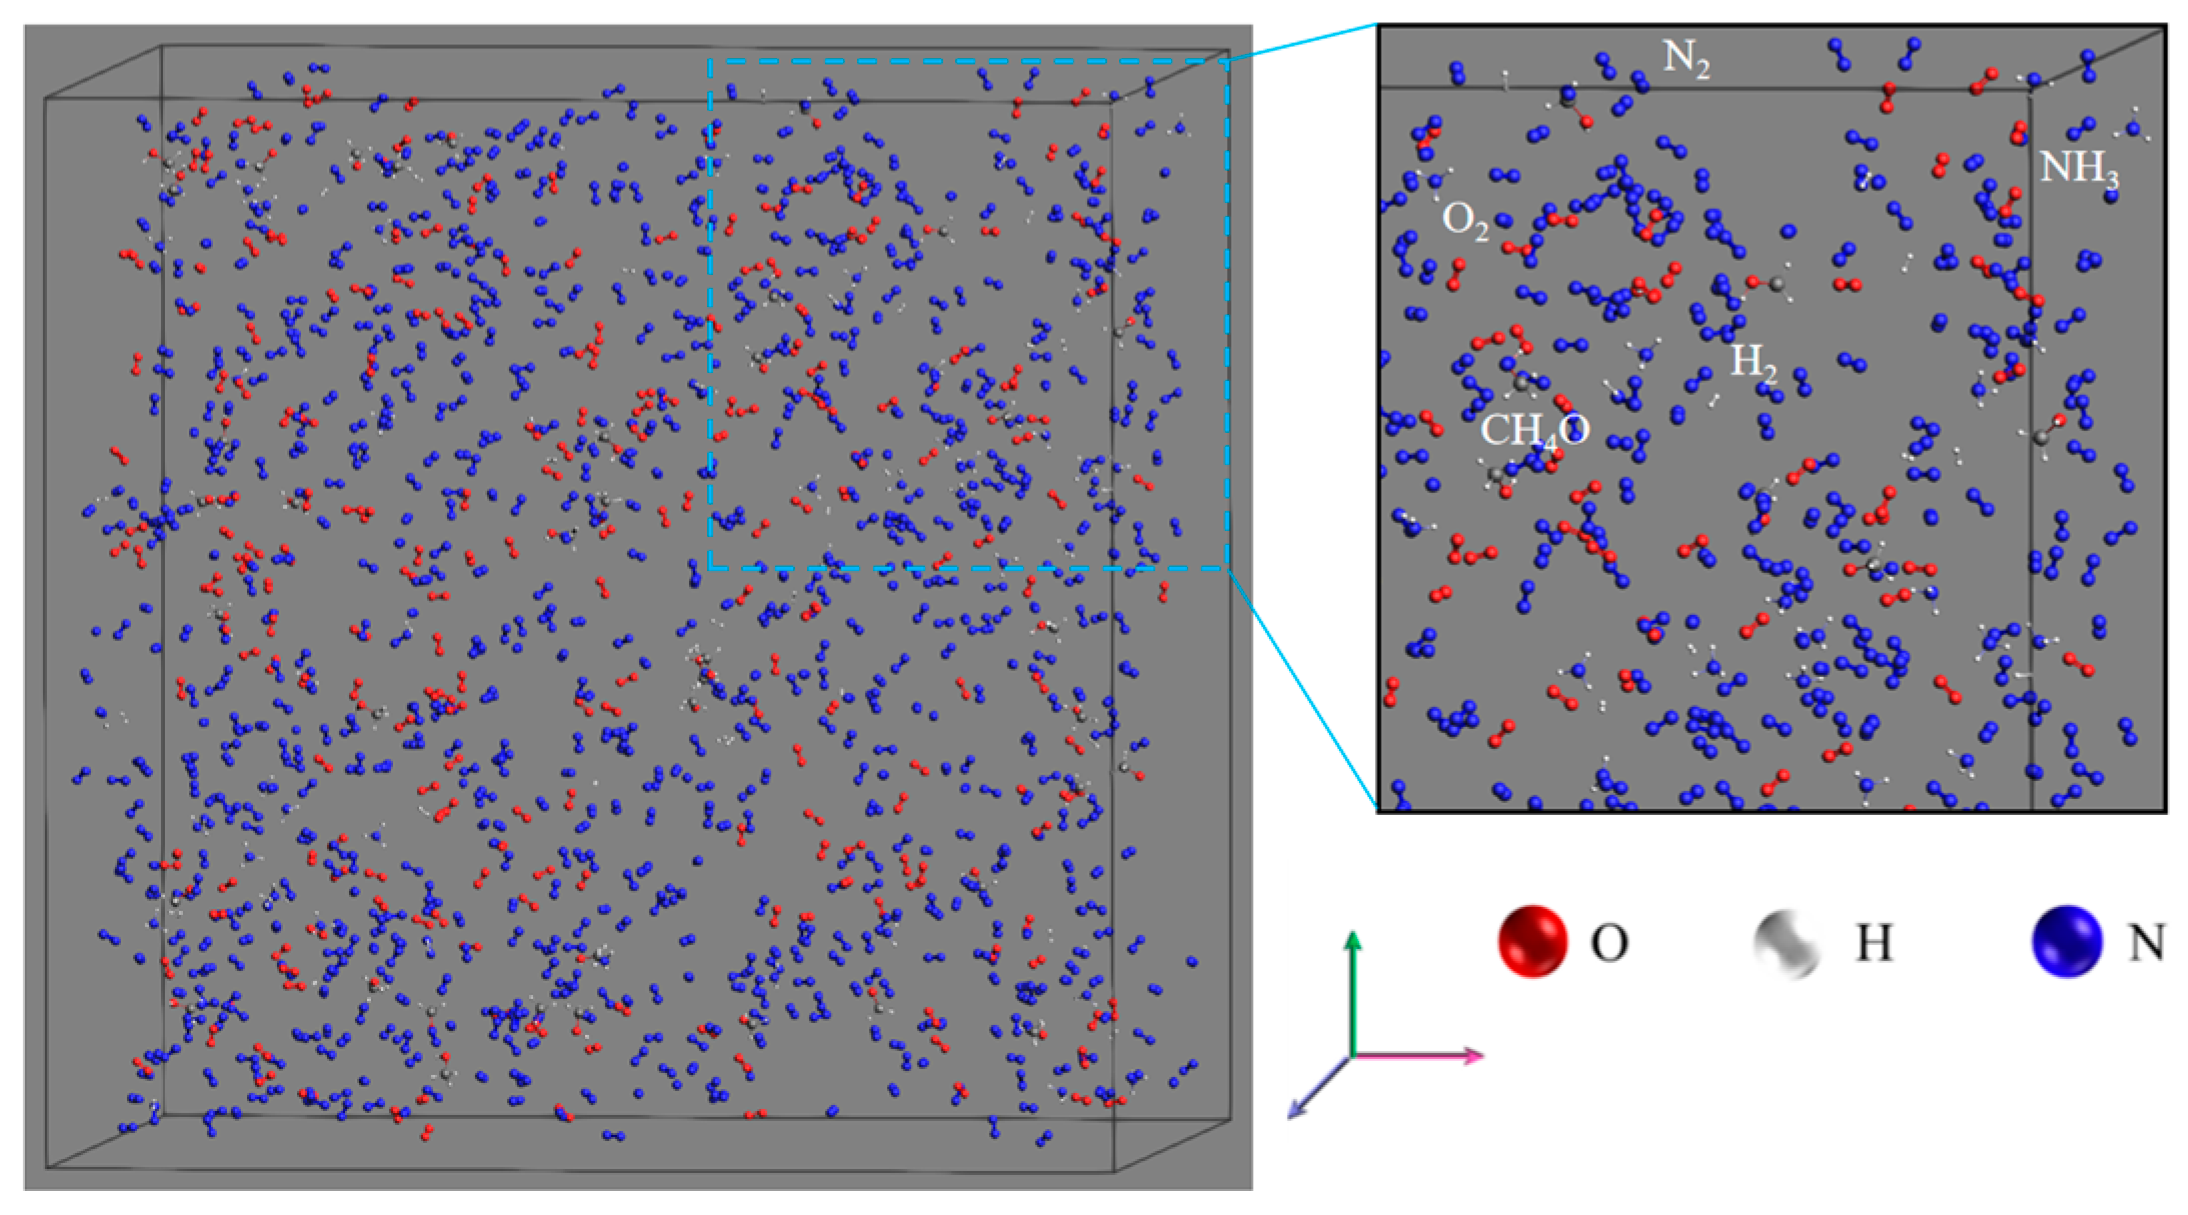
3. Materials and Methods

3.1. Reactive Force Field Molecular Dynamics (ReaxFF MD)

ReaxFF MD is a molecular dynamics simulation combined with the calculation of reaction force fields. Its reactive force field potential function is derived from experimental data and density functional theory, so the accuracy is close to quantum computation and does not require the predetermination of chemical reaction paths in the system [30]. ReaxFF MD has been widely used in the study of pyrolysis [31], combustion [32], explosions [33], oxidation [34], catalytic [35], and other systems involving physical chemistry. It provides a promising means of exploring the chemical behavior of complex molecular systems. Bond-order-dependent characterization is achieved through detailed parameterization of the atomic, bonding, angular, and torsional properties of each particle, and the interactions within the system [36]. The total energy of the system can be calculated by summing all partial energy terms as described in R1:
Esystem = Ebond + Eover + Eunder + Eval + Epen + Etors + Econj + EvdWaals + Ecoulomb
where Ebond, Eover, Eunder, Eval, Epen, Etors, and Econj correspond to bond energy, over-coordination energy, under-coordination energy, bond angle energy, compensation energy, torsion energy, and four-body conjugation energy. The non-bonding terms mainly consist of van der Waals force energy (EvdWaals) and Coulomb force energy (Ecoulomb). When calculating non-bonding interactions, the charged atoms cross the truncation radius of the non-bonding interactions, thus leading to a jump in energy. Therefore, the ReaxFF force field is additionally corrected by introducing a seventh-order polynomial Taper function, which ensures that at the truncation radius, the non-bonding interaction’s first-, second-, and third-order derivatives of the energy term are all zero [37]. The ReaxFF force field also takes better account of charge polarization by employing the electronegativity equalization method [38] and updates the atomic charges at each time step [39]. The detailed meaning of the ReaxFF force field parameters, the setup of the molecular structure, and the applicability of the reaction force field have been described in detail in a previous study [40].

3.2. Case Set-Ups

Table 1 lists all the CH4O/H2/NH3 blended combustion ReaxFF MD simulation cases under the high-pressure environment in this paper. The system density (ρ), temperature (T), and simulation time are 0.1 g/cm3, 2000 K, and 1.25 ns, respectively. Cases 1 to 5 denote the combustion of CH4O/H2/NH3 blends at fuel equivalent ratios (φ) of 0.5, 1, 0.66, 0.4, and 0.33, respectively. Each condition is calculated three times, keeping the initial settings constant. All results in this paper are averaged over three simulations. Through further comparative analyses, the mechanisms of CO, CO2, and NOX pollutant formation at different equivalence ratios are analyzed at the molecular level.

3.3. Computational Details and Post-Processing

All the cases listed in Table 1 were carried out in the ReaxFF module of AMS [41,42,43]. In this study, the HE2.ff force field [44] and the regular system with constant atomic number, volume, and temperature (NVT) were used. To ensure the overall stability of hydrocarbon fuel combustion, the energy, and configuration of all simulated cases were first optimized using the “Geometry Optimization” and “Energy Optimization” plug-ins. Figure 7 shows the optimized systematic for case 1, which shows that the fuel and oxidant are uniformly blended, similar to a premixed flame, and similar to the cyclone burner we previously employed [45]. A Berendsen thermostat was used to control the temperature with a time step of 0.25 fs. Periodic boundary conditions were applied in all three xyz directions, and the soot intermediate components and product distributions were analyzed from trajectories using a 0.3 Å bond level cut-off.

3.4. Validation of the ReaxFF MD Method

The reliability and validity of the ReaxFF MD method have been widely used and verified in previous studies [36,37,46,47,48,49]. Among them, Wang et al. [36] constructed the reaction pathway of high-pressure combustion by tracking the trajectories of reacting atoms through ReaxFF MD. To understand the NOX formation mechanism of NH3/CH4 combustion at different temperatures and pressures. The results showed that the high temperature accelerated the rate of NH3 consumption, which was consistent with the experimental results. The high pressure complicated the reaction pathway of NH3/CH4 combustion through the emergence of new intermediates and primitive reactions. In addition, they pointed out that ReaxFF MD is a valuable tool for revealing the reaction mechanisms of combustion and pollutant formation in depth. Liu et al. [49] investigated the chemical reactivity effects of NO on the oxidation of CH4 using ReaxFF MD simulations and found that increasing the blending ratio of NO accelerated the rate of CH4 consumption. This is mainly due to the fact that, on the one hand, the conversion of NO to NO2 generates OH radicals, which accelerates the CH4 consumption; on the other hand, NO can also inhibit the CH4 consumption by combining with reactive radicals. Wang et al. [46] applied ReaxFF MD and Py-GC/MS to investigate the characteristics of the soot particulate formation in the process of hydrogen-doped combustion of methane and ethylene, and both experimental and numerical results reflected that PAHs and ethylene were not the most important pollutants in the combustion process of CH4. The experimental and numerical results reflect the evolution of PAHs and initial soot particles, as well as the different chemical effects of hydrogen doping on PAHs and soot formation.

4. Conclusions

In this paper, the effects of different reactant equivalence ratios on the combustion reaction rates and the formation characteristics of CO, CO2, and NOX pollutants during the combustion of CH4O/H2/NH3 ternary carbon-neutral blended fuels have been investigated for the first time using ReaxFF MD. The mechanisms of CO, CO2, and NOX formation in ternary blended fuels with different equivalence ratios were investigated at the molecular level. The conclusions of this paper are summarized as follows:
(1)
Reducing the equivalence ratio accelerates the decomposition of CH4O, NH3, and H2 in general. The rate of consumption of each fuel is fastest at φ = 0.33. The rates of CH4O and NH3 decomposition are similar at φ = 0.66 and φ = 0.4.
(2)
CO showed an “inverted U” shaped trend of increasing and then decreasing over time. The CO peak appeared at φ = 0.5. CO2 shows a continuous increase as the reaction proceeds. The rate and amount of CO2 formation are inversely proportional to the magnitude of the equivalence ratio. When φ > 0.5, the effect of equivalence ratio on CO2 is more obvious. NO2 is the main component of NOX. When φ ≥ 0.66, NOX shows a tendency to increase and then stabilize as the reaction proceeds. When φ < 0.66, NOX shows a continuous increasing trend.
(3)
C migration path analysis showed that for φ ≥ 0.5, the intermediates CH3 and CH4 are added to the CH4O to CH2O conversion stage as the equivalence ratio decreases. The new pathways are CH4O→CH3→CH2O and CH4O→CH3→CH4→CH2O. At φ ≤ 0.5, new intermediates CHO2 and CH2O2 are added to the CH2O to CO2 phase as the equivalence ratio decreases. The added paths are CH2O→CO→CHO2→CO2, CH2O→CO→CO2, CH2O→CHO→CO→CHO2→CO2, and CH2O→CH2O2→CO2.
(4)
N migration pathway analysis showed that the conversion pathway of NH3 to NO shifted from the long reaction chains of NH3→NH2→NH→NO, NH3→NH2→NH→HNO→NO, and NH3→NH2→HNO→NO, to the shorter reaction chains of NH3→HNO→NO and NH3→NH2→NO as the equivalence ratio decreased. This is due to the fact that as the equivalence ratio decreases, more O2 collides to form OH and some of the O2 is directly involved in the reaction. NO2 is the main component of NOX. Statistics show that the equivalence ratios from 1 to 0.33 correspond to 12%, 21.4%, 34%, 46.95%, and 48.86% of NO2 remaining, respectively. This is also caused by the influence of the equivalence ratio on the OH radical concentration.

Author Contributions

J.S.: investigation, data curation, visualization, analysis, writing—original draft, writing—editing. Q.L.: investigation, data curation, visualization. M.G.: writing—review and editing. supervision, project administration, funding acquisition. Y.W.: analysis, writing—review, supervision. All authors have read and agreed to the published version of the manuscript.

Funding

This research was funded by the National Natural Science Foundation of China (52376008), the Natural Science Foundation of Anhui Province (2308085QE168), University synergy innovation program of Anhui province (GXXT-2022-025), and the Funding for Postdoctoral Researchers’ Scientific Research Activities in Anhui Province (2023B718).

Institutional Review Board Statement

Not applicable.

Informed Consent Statement

Not applicable.

Data Availability Statement

Data are contained within the article.

Conflicts of Interest

The authors declare no conflicts of interest.

References

  1. Jisoo, S.; Sungwook, P. Numerical analysis for optimizing combustion strategy in an ammonia-diesel dual-fuel engine. Energy Convers. Manag. 2023, 284, 116980. [Google Scholar]
  2. Zhang, L.; Sun, R.; Wang, Z.; Zhu, W.; Wang, X.; Qi, H. Application of experiments and density function theory on the formation mechanism of NH during O/Ar and O/HO combustion process of demineralized coals. Fuel 2023, 331, 125730. [Google Scholar] [CrossRef]
  3. Wang, J.; Li, X.; Li, J.; Xie, Y.; Fan, M.; Jiang, L. Study on the ignition characteristics of CH4/H2/air mixtures in a micro flow reactor with a controlled temperature profile. Int. J. Hydrogen Energy 2023, 51, 818–829. [Google Scholar] [CrossRef]
  4. Yan, Z.; Yang, Y.; Li, Q.; Yan, Y.; Tian, Z.; Song, C.; Huang, Z. Study on effects of NH3 and/or H2 addition on the characteristics of soot formation and gas emissions in a laminar ethylene diffusion flame. Fuel Process Technol. 2023, 242, 107633. [Google Scholar] [CrossRef]
  5. Xuan, J.; He, L.; Wen, W.; Feng, Y. Hydrogenase and Nitrogenase: Key Catalysts in Biohydrogen Production. Molecules 2023, 28, 1392. [Google Scholar] [CrossRef] [PubMed]
  6. Wang, Y.; Gu, M.; Zhu, Y.; Cao, L.; Zhu, B.; Wu, J.; Lin, Y.; Huang, X. A review of the effects of hydrogen, carbon dioxide, and water vapor addition on soot formation in hydrocarbon flames. Int. J. Hydrogen Energy 2021, 46, 31400–31427. [Google Scholar] [CrossRef]
  7. Zhang, F.; Li, S.; Liu, Q.; Sun, J.; Wei, X.; Gu, M.; Wang, Y.; Huang, X. Effect of ammonia on the soot surface characteristics in ammonia/ethylene co-flow diffusion flames. Fuel 2023, 341, 127633. [Google Scholar] [CrossRef]
  8. Arun, K.; Ganesh, D.; Nagarajan, G.; Abul, K. An innovative method of ammonia use in a light-duty automotive diesel engine to enhance diesel combustion, performance, and emissions. Int. J. Hydrogen Energy 2020, 45, 98–118. [Google Scholar]
  9. Xu, L.; Xu, S.; Bai, X.; Juho, A.; Saana, H.; Jari, H. Performance and emission characteristics of an ammonia/diesel dual-fuel marine engine. Renew. Sust. Energy Rev. 2023, 185, 113631. [Google Scholar] [CrossRef]
  10. Sanchez, A.; Castellano, E.; Martín, M.; Vega, P. Evaluating ammonia as green fuel for power formation: A thermo-chemical perspective. Appl. Energy 2021, 293, 116956. [Google Scholar] [CrossRef]
  11. Fenghour, A.; Wakeham, A.; Vesovic, V.; Watson, J.; Millat, J.; Vogel, E. The viscosity of ammonia. J. Phys. Chem. Ref. Data 1995, 24, 1649–1667. [Google Scholar] [CrossRef]
  12. Frigo, S.; Gentili, R. Analysis of the behaviour of a 4-stroke Si engine fuelled with ammonia and hydrogen. Int. J. Hydrogen Energy 2013, 38, 1607–1615. [Google Scholar] [CrossRef]
  13. Chai, W.; Bao, Y.; Jin, P.; Tang, G.; Zhou, L. A review on ammonia, ammonia-hydrogen and ammonia-methane fuels. Renew. Sustain. Energy Rev. 2021, 147, 111254. [Google Scholar] [CrossRef]
  14. Zhang, R.; Chen, L.; Wei, H.; Li, J.; Chen, R.; Pana, J. Understanding the difference in combustion and flame propagation characteristics between ammonia and methane using an optical SI engine. Fuel 2022, 324, 124794. [Google Scholar] [CrossRef]
  15. Nozari, H.; Karabeyouglu, A. Numerical study of combustion characteristics of ammonia as a renewable fuel and establishment of reduced reaction mechanisms. Fuel 2015, 159, 223–233. [Google Scholar] [CrossRef]
  16. Charles, L.; Pierre, B.; Francesco, C.; Christine, M. Experimental investigation on ammonia combustion behavior in a spark-ignition engine by means of laminar and turbulent expanding flames. Proc. Combust. Inst. 2021, 38, 5859–5868. [Google Scholar]
  17. Chen, D.; Li, J.; Li, X.; Deng, L.; He, Z.; Huang, H.; Noriyuki, K. Study on combustion characteristics of hydrogen addition on ammonia flame at a porous burner. Energy 2022, 263, 125613. [Google Scholar] [CrossRef]
  18. Wang, S.; Li, Y.; Lv, J.; Liu, Z.; Gao, S.; Hu, J.; Zhang, J.; Zhong, J.; Zhao, Z. Evaluation of hydrogen addition on combustion and emission characteristics of dual-fuel diesel engines with different compression ratios. Processes 2023, 11, 2675. [Google Scholar] [CrossRef]
  19. Kurien, C.; Mittal, M. Review on the production and utilization of green ammonia as an alternate fuel in dual-fuel compression ignition engines. Energy Convers. Manag. 2022, 251, 114990. [Google Scholar]
  20. Wang, W.; Herreros, J.; Tsolakis, A.; York, A. Ammonia as hydrogen carrier for transportation; investigation of the ammonia exhaust gas fuel reforming. Int. J. Hydrogen Energy 2013, 38, 9907–9917. [Google Scholar] [CrossRef]
  21. Alam, M.; Goto, M.; Sugiyama, S.; Kajiwara, K.; Mori, M.; Konno, M.; Motohashi, M.; Oyama, K. Performance and emissions of a DI diesel engine operated with LPG and ignition improving additives. SAE Int. J. Engines 2001, 01, 3680. [Google Scholar]
  22. Miller, J.; Nagarajan, G.; Renganarayanan, S. LPG fueled diesel engine using diethyl ether with exhaust gas recirculation. Int. J. Therm. Sci. 2008, 47, 450–457. [Google Scholar] [CrossRef]
  23. Karabektas, M.; Ergen, G.; Hosoz, M. The effects of using diethylether as additive on the performance and emissions of a diesel engine fuelled with CNG. Fuel 2014, 115, 855–860. [Google Scholar] [CrossRef]
  24. Tomislav, P.; Martina, P.; Franjo, S.; Larisa, Z.; Tomaz, U. A Simple two-dimensional model of methanol. J. Mol. Liq. 2018, 262, 46–57. [Google Scholar]
  25. Liu, M.; Dong, D.; Wei, F.; Long, W.; Wang, Y.; Cong, L.; Dong, P.; Tian, H.; Wang, P. Chemical mechanism of ammonia-methanol combustion and chemical reaction kinetics analysis for different methanol blends. Fuel 2023, 314, 127697. [Google Scholar] [CrossRef]
  26. Wei, F.; Wang, Q.; Cao, J.; Cui, Z.; Long, W.; Tian, H. Experimental study of the ignition chamber with accelerating cavity applying to methanol lean combustion. Fuel 2024, 355, 129358. [Google Scholar] [CrossRef]
  27. Li, X.; Ma, Z.; Jin, Y.; Wang, X.; Xi, Z.; Hu, S.; Chu, X. Effect of methanol blending on the high-temperature auto-ignition of ammonia: An experimental and modeling study. Fuel 2023, 339, 126911. [Google Scholar] [CrossRef]
  28. Li, M.; He, X.; Hashemi, H.; Glarborg, P.; Lowe, V.; Marshall, P.; Fernandes, R.; Shu, B. An experimental and modeling study on auto-ignition kinetics of ammonia/methanol mixtures at intermediate temperature and high pressure. Combust. Flame 2022, 242, 112160. [Google Scholar] [CrossRef]
  29. Hong, C.; Ji, C.; Wang, S.; Xin, G.; Wang, Z.; Meng, H.; Yang, J. An experimental study of various load control strategies for an ammonia/hydrogen dual-fuel engine with the Miller cycle. Fuel Process Technol. 2023, 247, 107780. [Google Scholar] [CrossRef]
  30. van Duin, A.; Dasgupta, S.; Lorant, F.; Goddard, W.A. ReaxFF: A reactive force field for hydrocarbons. J. Phys. Chem. A 2001, 105, 9396–9409. [Google Scholar] [CrossRef]
  31. Gao, M.; Li, X.; Guo, L. Pyrolysis simulations of Fugu coal by large-scale ReaxFF molecular dynamics. Fuel Process Technol. 2018, 178, 197–205. [Google Scholar] [CrossRef]
  32. Cheng, Y.; Zhao, Y.; Zhao, F.; Xu, S.; Ju, X.; Ye, C. ReaxFF simulations on the combustion of Al and n-butanol nanofluid. Fuel 2022, 330, 125465. [Google Scholar] [CrossRef]
  33. Zhang, M.; Zhou, B.; Chen, Y.; Gong, H. Mechanism and safety analysis of acetylene decomposition explosion: A combined ReaxFF MD with DFT study. Fue 2022, 3227, 124996. [Google Scholar] [CrossRef]
  34. Li, Y.; Li, G.; Zhang, H.; Wang, J.; Li, A.; Liang, Y. ReaxFF study on nitrogen-transfer mechanism in the oxidation process of lignite. Fuel 2017, 193, 331–342. [Google Scholar] [CrossRef]
  35. Li, Z.; Yang, Q.; Li, T.; Ma, X.; Zhou, J.; Ye, T.; Wu, J.; Wu, R.; Ben, H. Formation mechanism of hydrogen production from catalytic pyrolysis of waste tires: A ReaxFF molecular dynamics and experimental study. Fuel 2023, 341, 127664. [Google Scholar] [CrossRef]
  36. Wang, J.; Jiang, X.; Luo, K. Exploring reaction mechanism for ammonia/methane combustion via reactive molecular dynamics simulations. Fuel 2023, 331, 125806. [Google Scholar] [CrossRef]
  37. Kwon, H.; Shabnam, S.; van Duin, A.; Xuan, Y. Numerical simulations of yield-based sooting tendencies of aromatic fuels using ReaxFF molecular dynamics. Fuel 2020, 262, 116545. [Google Scholar] [CrossRef]
  38. Mortier, W.; Ghosh, S.; Shankar, S. Electronegativity equalization method for the calculation of atomic charges in molecules. Cheminform 1986, 108, 4315–4320. [Google Scholar] [CrossRef]
  39. Chenoweth, K.; van Duin, A.; Goddard, W. ReaxFF reactive force field for molecular dynamics simulations of hydrocarbon oxidation. J. Phys. Chem. A 2008, 112, 1040–1053. [Google Scholar] [CrossRef]
  40. Bhoi, S.; Banerjee, T.; Mohanty, K. Molecular dynamic simulation of spontaneous combustion and pyrolysis of brown coal using ReaxFF. Fuel 2014, 136, 326–333. [Google Scholar] [CrossRef]
  41. Lele, A.; Kwon, H.; Ganeshan, K.; Xuan, Y.; van Duin, A. ReaxFF molecular dynamics study on pyrolysis of bicyclic compounds for aviation fuel. Fuel 2021, 297, 120724. [Google Scholar] [CrossRef]
  42. Senda, T.; Yamada, Y.; Morimoto, M.; Nono, N.; Sogabe, T.; Kubo, S.; Sato, S. Analyses of oxidation process for isotropic pitch-based carbon fibers using model compounds. Carbon 2019, 142, 311–326. [Google Scholar] [CrossRef]
  43. Wang, Y.; Gong, S.; Wang, H.; Li, L.; Liu, G. High-temperature pyrolysis of isoprenoid hydrocarbon p-menthane using ReaxFF molecular dynamics simulation. J. Anal. Appl. Pyrol. 2021, 155, 105045. [Google Scholar] [CrossRef]
  44. Zhang, L.; Zybin, S.; van Duin, A.; Dasgupta, S.; GoddardIII, W. Carbon cluster formation during thermal decomposition of octahydro-1,3,5,7-tetranitro-1,3,5,7-tetrazocine and 1,3,5-Triamino-2,4,6-trinitrobenzene high explosives from ReaxFF reactive molecular dynamics simulations. J. Phys. Chem. A 2009, 113, 10619–10640. [Google Scholar] [CrossRef] [PubMed]
  45. Lin, Q.; Jiang, Y.; Liu, C.; Chen, L.; Zhang, W.; Ding, J.; Li, J. Controllable NO emission and high flame performance of ammonia combustion assisted by non-equilibrium plasma. Fuel 2022, 319, 123818. [Google Scholar] [CrossRef]
  46. Wang, Y.; Gu, M.; Zhu, Y.; Cao, L.; Wu, J.; Lin, Y.; Huang, X. Analysis of soot formation of CH4 and C2H4 with H2 addition via ReaxFF molecular dynamics and pyrolysis–gas chromatography/mass spectrometry. J. Energy Inst. 2022, 100, 177–188. [Google Scholar] [CrossRef]
  47. Chen, Z.; Sun, W.; Zhao, L. High-temperature and high-pressure pyrolysis of hexadecane: Molecular dynamic simulation based on reactive force field (ReaxFF). J. Phys. Chem. A 2017, 121, 2069–2078. [Google Scholar] [CrossRef]
  48. Senftle, T.; Hong, S.; Islam, M.; Kylasa, S.; Zheng, Y.; Shin, Y.; Junkermeier, C.; Engel-Herbert, R.; Janik, J.; Aktulga, H.M.; et al. The ReaxFF reactive force-field: Development, applications and future directions. NPJ Comput. Mater. 2016, 2, 15011. [Google Scholar] [CrossRef]
  49. Liu, Y.; Zhang, X.; Ding, J. Chemical effect of NO on CH4 oxidation during combustion in O2/NO environments. Chem. Phys. Lett. 2019, 727, 59–65. [Google Scholar] [CrossRef]
Figure 1. Changes in reactants during combustion of carbon-neutral fuels with different equivalence ratios. (a) CH4O; (b) NH3; (c) H2; (d) O2.
Molecules 29 00176 g001
Figure 2. Changes of components and radicals during combustion at different temperatures. (a) N2; (b) H2O; (c) OH; (d) H.
Molecules 29 00176 g002
Figure 3. CO and CO2 formation with time for blended combustion. (a) CO; (b) CO2.
Molecules 29 00176 g003
Figure 4. NOX distribution during combustion of ternary carbon-neutral fuel blends with different equivalence ratios. (a) NO; (b) NO2; (c) NO3; (d) NOX.
Molecules 29 00176 g004aMolecules 29 00176 g004b
Figure 5. Main migration paths of C in ternary carbon-neutral fuel blends at different equivalence ratios. (a) φ = 1; (b) φ = 0.66; (c) φ = 0.5; (d) φ = 0.4; (e) φ = 0.33.
Molecules 29 00176 g005aMolecules 29 00176 g005b
Figure 6. Main migration paths of N in ternary carbon-neutral fuel blends at different equivalence ratios. (a) φ = 1; (b) φ = 0.66; (c) φ = 0.5; (d) φ = 0.4; (e) φ = 0.33.
Molecules 29 00176 g006aMolecules 29 00176 g006b
Figure 7. Optimization system for case 1.
Molecules 29 00176 g007
Table 1. ReaxFF MD cases of the CH4O/H2/NH3 blended combustion.
CaseCH4OH2NH3O2N2ρ, g/cm3T, KΦ
14040402208320.120000.5
24040401104160.120001
34040401656240.120000.66
440404037510400.120000.4
540404033012480.120000.33
Disclaimer/Publisher’s Note: The statements, opinions and data contained in all publications are solely those of the individual author(s) and contributor(s) and not of MDPI and/or the editor(s). MDPI and/or the editor(s) disclaim responsibility for any injury to people or property resulting from any ideas, methods, instructions or products referred to in the content.

