Article

Exploring Antioxidant and α-Glucosidase Inhibitory Activities in Mulberry Leaves (Morus alba L.) across Growth Stages: A Comprehensive Metabolomic Analysis with Chemometrics

1
Traditional Chinese Medicine Processing Technology Innovation Centre of Hebei Province, College of Pharmacy, Hebei University of Chinese Medicine, Shijiazhuang 050200, China
2
Department of Chinese Materia Medica, Hebei Institute for Drug and Medical Device Control, Shijiazhuang 050200, China
3
Department of Pharmaceutical Engineering, Hebei Chemical and Pharmaceutical College, Shijiazhuang 050026, China
*
Authors to whom correspondence should be addressed.
These authors contributed equally to this work.
Molecules 2024, 29(1), 171; https://doi.org/10.3390/molecules29010171
Submission received: 27 November 2023 / Revised: 19 December 2023 / Accepted: 25 December 2023 / Published: 27 December 2023
(This article belongs to the Special Issue Research of Phenolic Compounds from Natural Source)

Abstract

:
Metabolic product accumulation exhibited variations among mulberry (Morus alba L.) leaves (MLs) at distinct growth stages, and this assessment was conducted using a combination of analytical techniques including high-performance liquid chromatography (HPLC), gas chromatography–mass spectrometry (GC-MS), and liquid chromatography–mass spectrometry (LC-MS). Multivariate analysis was applied to the data, and the findings were correlated with antioxidant activity and α-glucosidase inhibitory effects in vitro. Statistical analyses divided the 27 batches of MLs at different growth stages into three distinct groups. In vitro assays for antioxidant activity and α-glucosidase inhibition revealed that IC50 values were highest at the Y23 stage, which corresponds to the ‘Frost Descends’ solar term. In summary, the results of this study indicate that MLs at different growth stages throughout the year can be categorized into three primary growth stages using traditional Chinese solar terms as reference points, based on the observed variations in metabolite content.

1. Introduction

Morus alba L., commonly known as mulberry, is a deciduous tree that has exhibited extensive distribution throughout China since antiquity. Because of its ability to adapt to many different climatic conditions, it is now widely grown in many countries around the world [1]. Mulberry leaves (MLs) serve a dual purpose, being utilized both as a primary food source for silkworms in sericulture and as a herbal medicine [2]. MLs were first recorded in “Shen Nong’s Herbal Classic” as “Shen Xian Ye” [3]. In Chinese medicine, it can be used to treat wind-heat colds, lung-heat and dry cough, dizziness, headache, etc. Abundant in MLs are a diverse array of bioactive and nutritional compounds, encompassing flavonoids, amino acids, α-aminobutyric acid, vitamins, polysaccharides, alkaloids, and steroids, as demonstrated by numerous studies [4,5,6]. MLs possess a wide range of pharmacological effects, especially in antioxidation, hypoglycemia, anti-cholesterol, anticancer, antiinflammation and others [7]. MLs can also be made into ML tea, ML wine, ML vinegar, ML noodles, and other foods, in addition to being a traditional Chinese medicine. In 1993, the Ministry of Health of China recognized MLs as the first batch of herbal medicines of the same source as food. Owing to the wide range of bioactivities, its application in the fields of medicine, food, and healthcare products has great development space and application prospects.
Multiple factors, including nutritional composition, functional constituents, and antioxidant potential, collectively influence the quality of MLs. These aspects collectively impact the medicinal and economic value of MLs. MLs harvested in different seasons serve diverse purposes. MLs collected during spring, summer, and autumn are primarily used for silkworm rearing and food processing. In China, there are 24 solar terms representing changes in natural rhythms, marking the establishment of the “12-month construction” in the calendar. These solar terms hold profound cultural significance deeply rooted in Chinese historical heritage. They accurately mirror shifts in natural phenomena and play a pivotal role in people’s daily lives. Traditionally, these 24 solar terms serve as crucial agricultural and harvesting milestones, often indicating the timing for planting crops, exemplified by specific solar terms as indicators for sowing seeds. In contrast, MLs harvested after the initial frost are typically reserved for medicinal applications. The content of flavonoids in MLs reaches its peak during the period following the first frost and extending into November [8]. Additionally, another study investigated the correlation between the accumulation of total flavonoids and ambient temperature, suggesting that lower temperatures promote the accumulation of flavonoid compounds [9]. Furthermore, investigations have demonstrated that MLs affected by frost exhibit a significant increase in antioxidant activity and chlorogenic acid content [10]. While various researchers have arrived at a consistent conclusion regarding the superior quality of MLs after exposure to frost, limited attention has been given to the accumulation of primary and secondary metabolites throughout the entire growth stages of MLs. The primary and secondary metabolites of MLs exhibit significant variations across different growth stages. Consequently, we conducted a study to investigate the differences in metabolites at various growth stages of MLs.
Metabolomics has emerged as an increasingly utilized analytical approach for assessing the quality of both food and herbal products, ensuring their quality through targeted and untargeted methods [11]. While untargeted analysis aims to comprehensively analyze all measurable metabolites within a sample, encompassing both known and unknown compounds, targeted metabolomics narrows its focus to specific metabolites of interest [12]. This approach enables the visualization, investigation, and comprehension of metabolite changes within a plant’s metabolome, resulting from environmental perturbations or inherent differences in metabolic profiles due to natural or altered states [13]. Liquid chromatography–mass spectrometry (LC-MS) and gas chromatography coupled to mass spectrometry (GC-MS), valued for their high sensitivity and accuracy, have now become standard analytical platforms extensively employed in plant metabolomics research [14]. GC-MS is suitable for analyzing primary metabolites such as organic acids, sugars, and amino acids after derivatization to enhance volatility. However, most secondary metabolites are thermally labile and unsuitable for GC-MS. LC-MS, on the other hand, can overcome this limitation [15]. Within chemometric techniques, principal component analysis (PCA) serves as an unsupervised pattern-recognition method, facilitating the visualization of grouping trends and identification of outliers. Orthogonal partial least squares–discriminant analysis (OPLS-DA), on the other hand, acts as a supervised pattern-recognition method capable of analyzing, classifying, and reducing the dimensionality of complex datasets. Cluster analysis (CA), a multivariate statistical method, is employed for sample or indicator classification. Additionally, a heatmap was utilized to depict the relative concentration trends of compounds across all samples. These techniques are widely employed for exploratory data overview and further discrimination purposes, respectively [16,17].
In recent years, there has been a growing recognition of the medicinal and economic value of MLs. However, a comprehensive investigation into the metabolites of MLs and their variations at different growth stages has been lacking. In this study, we employed GC-MS and LC-MS technologies in conjunction with multivariate data analysis to examine the differences in metabolite profiles of MLs across various growth stages. Furthermore, we assessed the antioxidant and α-glucosidase inhibitory activity in vitro to evaluate how MLs’ bioactivity varies with growth stages. The outcomes of this research are anticipated to enhance our comprehension of the biochemical mechanisms underlying ML development. Simultaneously, this study serves as a foundational step towards the efficient utilization and advancement of ML resources in both medicinal and economic domains.

2. Results and Discussion

For the comparative assessment of datasets obtained from various metabolomic platforms, including ultra-performance liquid chromatography (UPLC)-MS and GC-MS metabolomics, a standardized extraction method was developed, as described in Section 3.2 regarding sample preparation for both MS and HPLC analyses. Chemometric methods were applied to categorize the samples, ensuring analytical uniformity, and revealing their shared characteristics as well as differences.

2.1. GC-MS Profiling of Metabolites in ML Extract

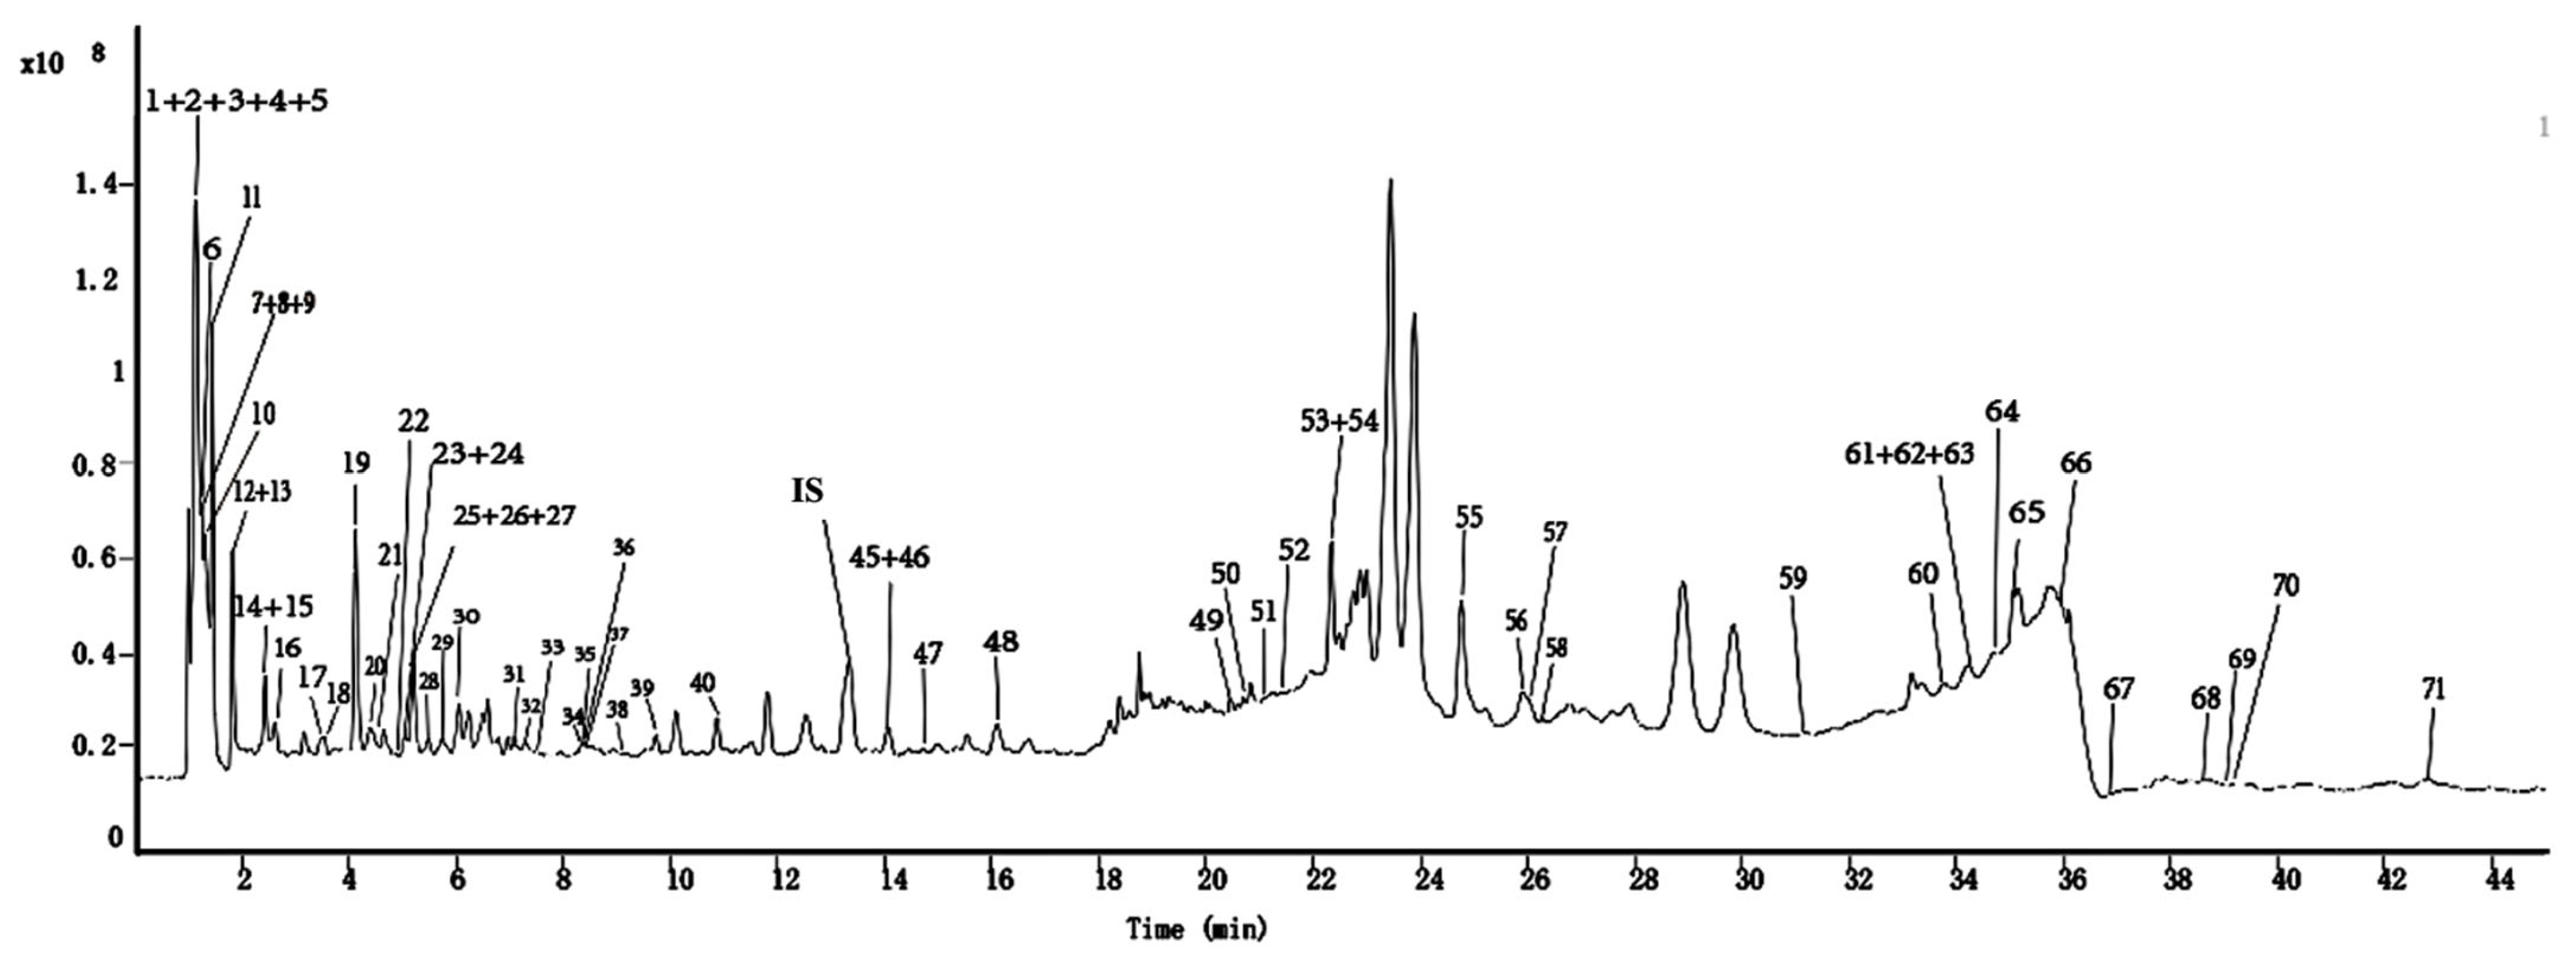
2.1.1. GC-MS Profiling of Metabolites

GC-MS analysis following post-silylation was employed to generate a comprehensive profile of primary metabolites from MLs at different growth stages. The reproducibility of the fragment patterns in the GC-MS experimental data was reliable [18] and aligned well with the National Institute of Standards and Technology 17 (NIST17) library. A total of 46 metabolites (Figure 1 and Table 1) were identified, including organic acids, sugars, and amino acids.

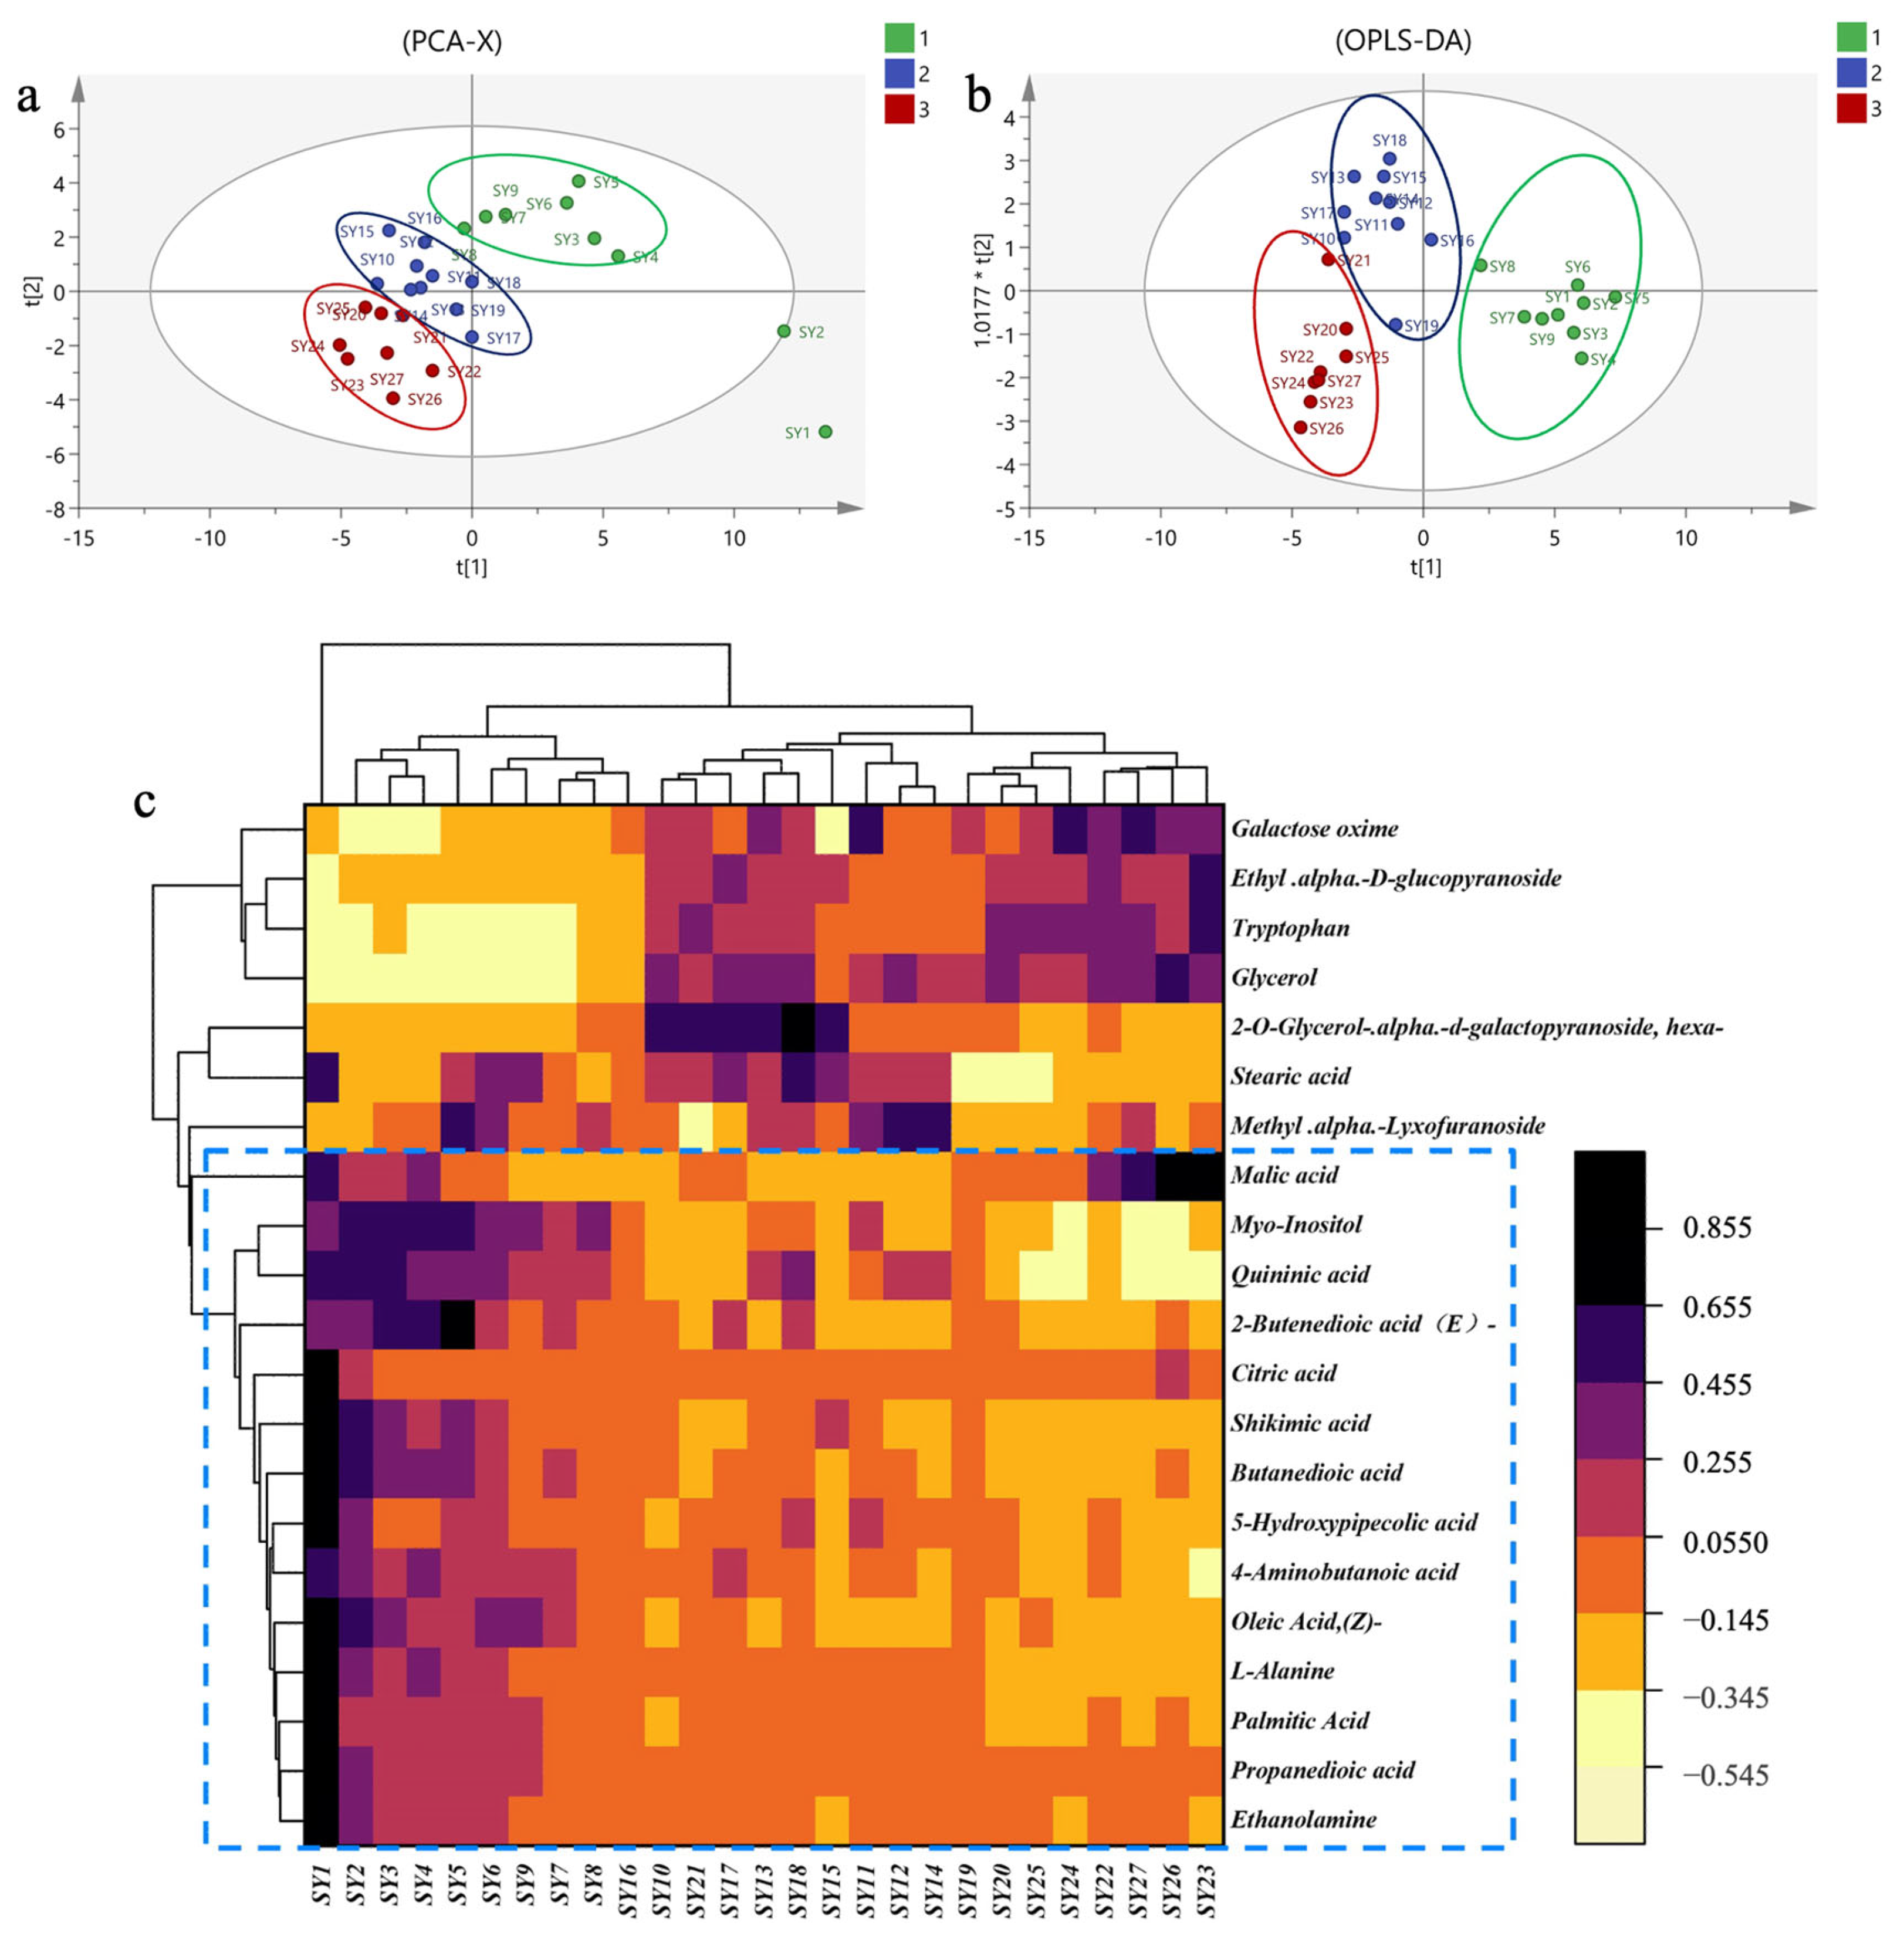
2.1.2. Multivariate Data Analysis of MLs at Different Growth Periods

Xylitol was chosen as a reference peak for the validation of the method concerning metabolites in ML extracts. The relative peak area (RPA) for each compound was determined using the area normalization approach. To gain deeper insights into the relative variations in metabolite content across different growth stages of MLs, several multivariate statistical techniques were applied, including PCA, OPLS-DA, and CA, for data analysis.
PCA was conducted using 46 compounds as independent variables. As depicted in Figure 2a, the cumulative variance interpretation parameter R2X and prediction ability parameter Q2 were found to be 0.921 and 0.391, respectively. These values indicate that the PCA model exhibited strong discriminatory and predictive capabilities. The samples could be broadly categorized into three groups, corresponding to distinct growth stages. The PCA results underscored the significant variations in the identified compound content across different growth stages of MLs.
The OPLS-DA (Figure 2b) model demonstrated cumulative interpretation parameters R2Y and Q2 of 0.812 and 0.623, respectively. These results suggest that the established model possesses robust stability and predictive ability.
To visualize the differences in metabolic profiles of MLs at different growth stages, we conducted a screening of differentially abundant metabolites based on variable importance in projection values (VIP > 1) and p-values (p < 0.05). This led to the identification of 20 differential chemical markers. Cluster analysis (CA) was performed using OriginPro 2021 (9.8, Origin Lab Corporation, Northampton, MA, USA), employing the inter-group mean connection method and Euclidean distance. The results revealed the division of 27 sample batches into three distinct categories, highlighting significant differences in the relative metabolite content (Figure 2c).
Among these 20 compounds, galactose oxime, ethyl-α-d-glucopyranoside, and glyceric acid tryptophan exhibited significantly lower relative content during the first growth stage compared to the other two growth stages. Conversely, compounds in the blue zone, including myo-inositol, quininic acid, 2-butenedioic acid (E)-, citric acid, shikimic acid, butanedioic acid, 5-hydroxypipecolic acid, 4-aminobutanoic acid, oleic acid (Z)-, ethanolamine, propanedioic acid, and L-alanine, showed significantly higher relative content during the first growth stage compared to the last two growth stages.

2.2. Secondary Metabolic Analysis

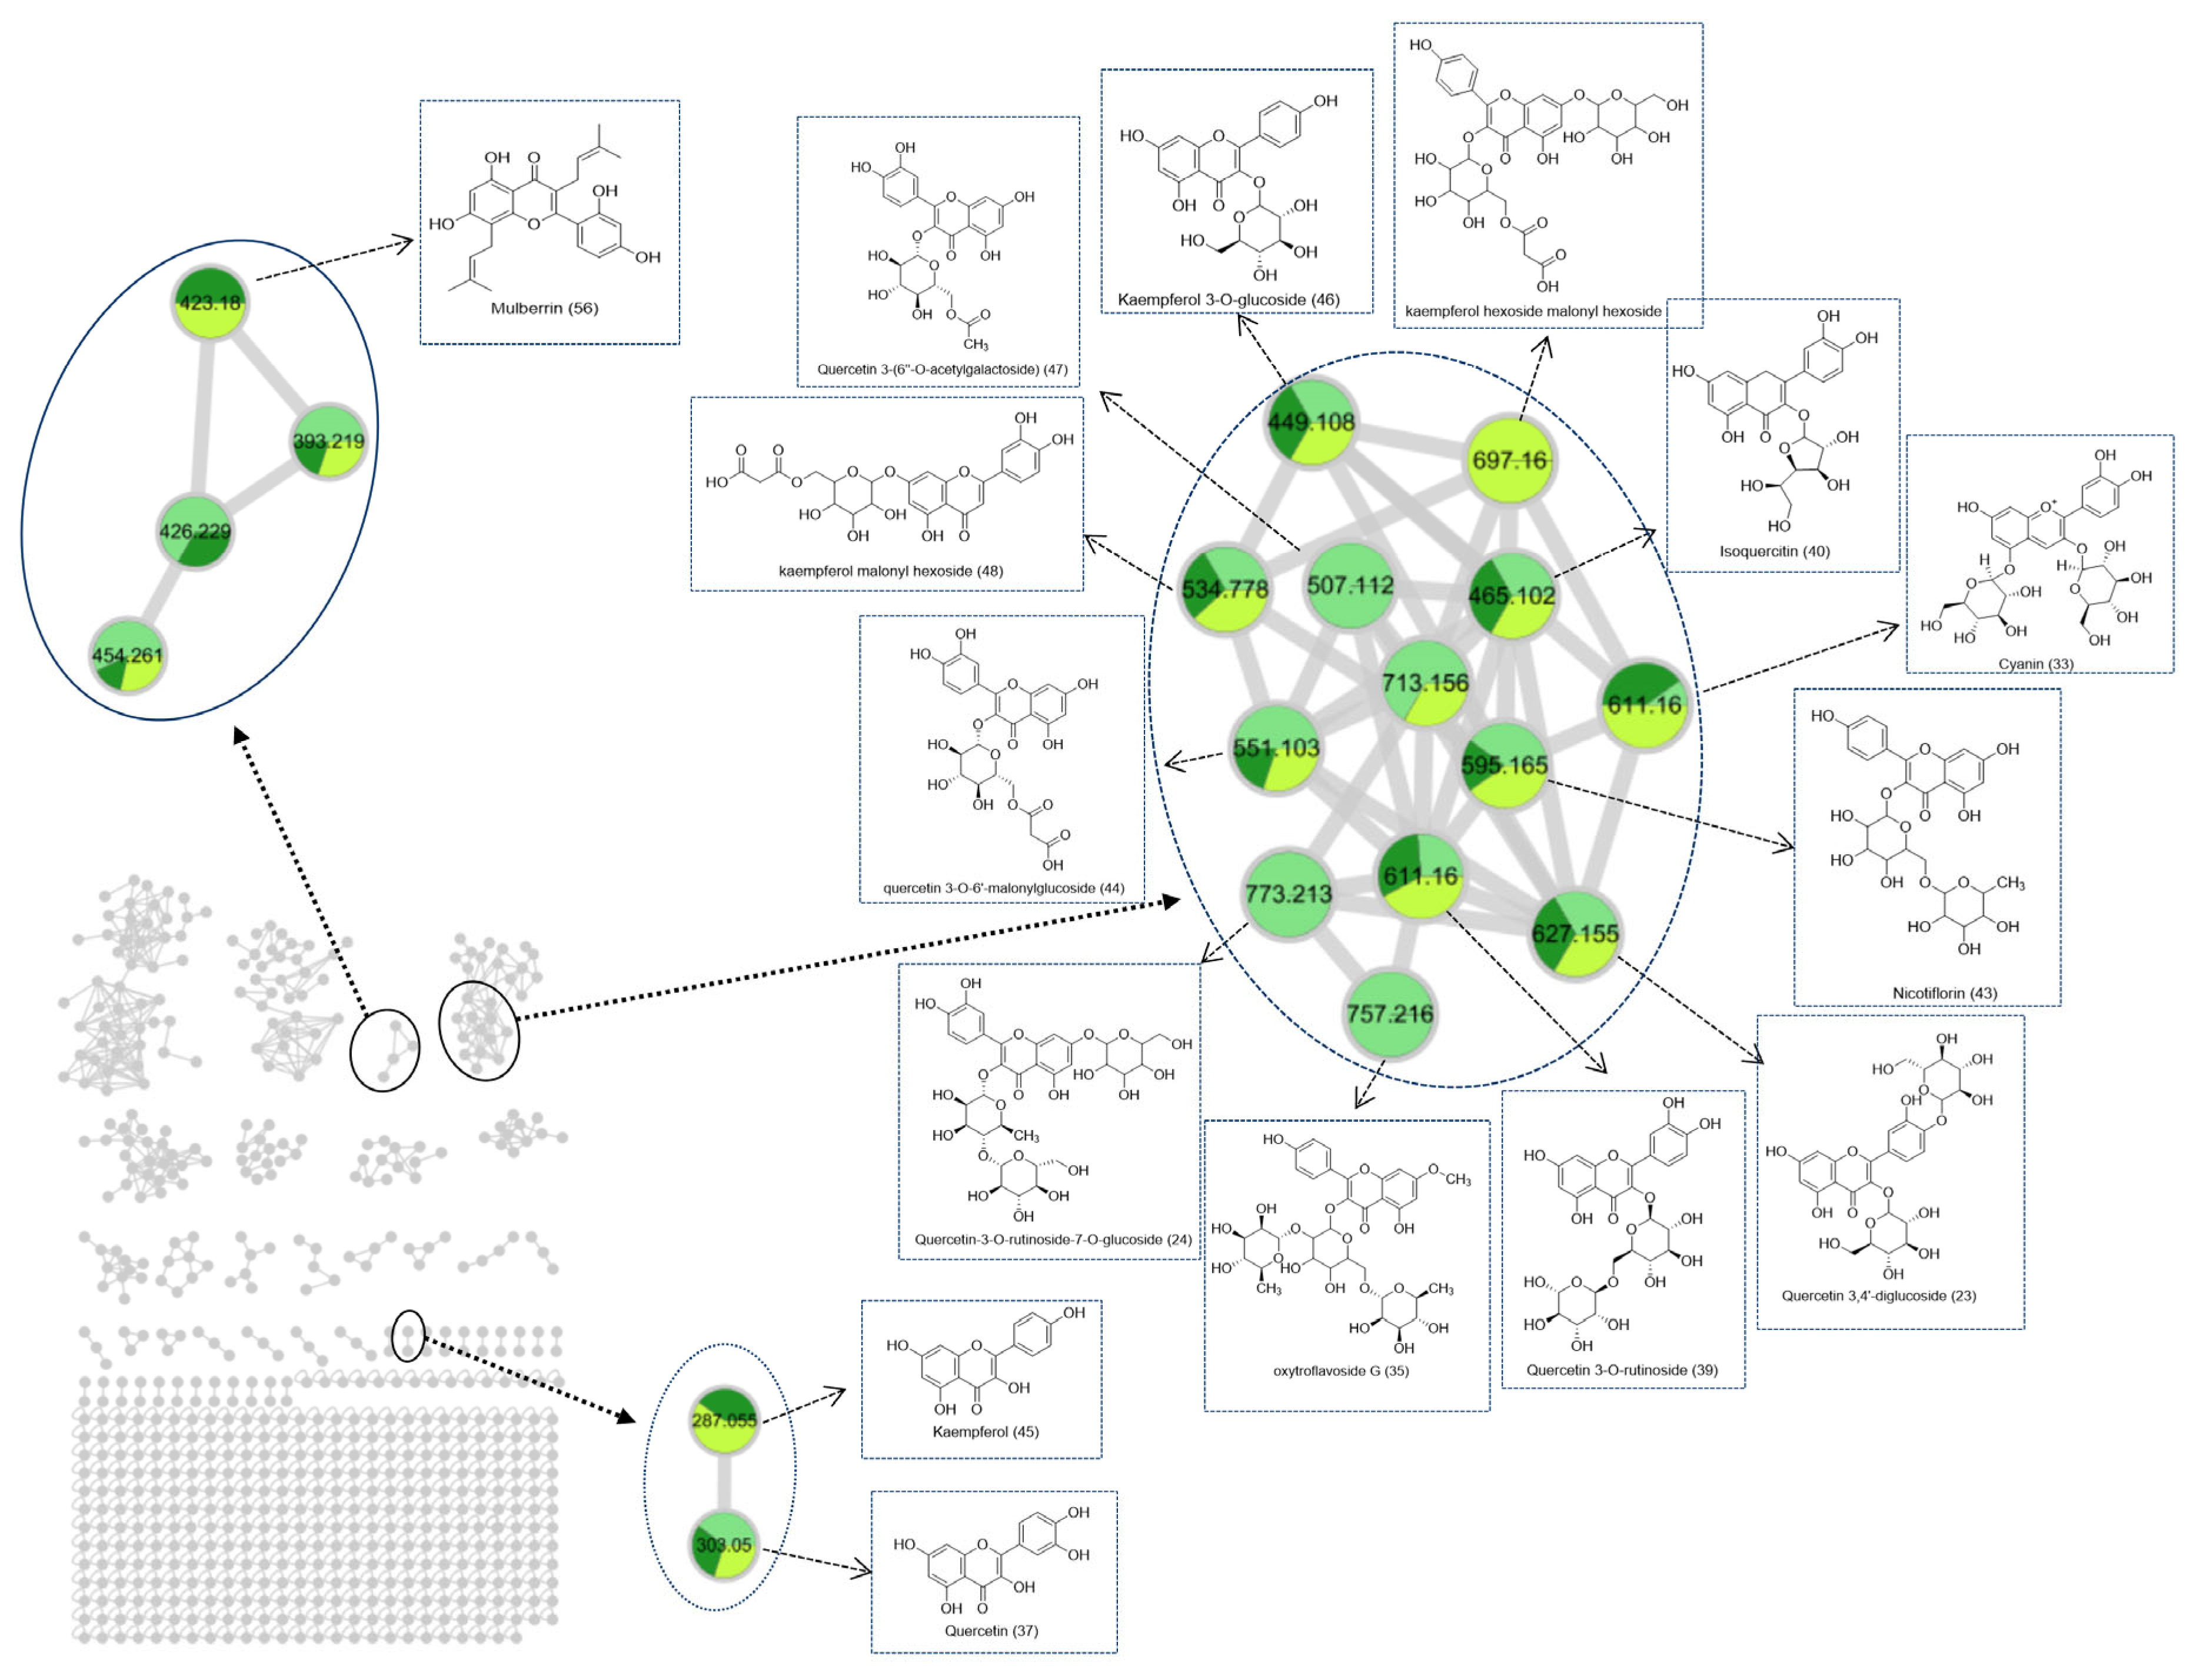
2.2.1. UPLC–Quadrupole Time-of-Flight (QTOF)–MS Data and Molecular Networking (MN) Analysis

In this investigation, a secondary metabolite analysis was performed on 27 batches of MLs at various growth stages utilizing UPLC-QTOF-MS. Figure 3 illustrates the total ion chromatogram for the MLs, while Table 2 provides the list of tentatively identified compounds. A network based on spectral similarity provides a visual tool for examining tandem mass spectrometry data. This facilitates the annotation of compounds while also allowing the observation of features distributed across various samples [19]. The creation of the MN was based on the similarity of MS/MS spectra, as visually presented in Figure 4. In the figure, the node size is indicative of the relative quantity of the respective compound, and each node is depicted as a pie chart [20]. This diagram emphasizes the primary cluster of flavonoids, which encompasses compounds such as quercetin (peak 37, m/z 303.05, [M + H]+), isoquercetin (peak 40, m/z 465.1206, [M + H]+), kaempferol (peak 45, m/z 287.0548, [M + H]+), and others [21,22]. Within each type of flavonoid structure, common substituents on the A and B rings consist of hydroxyl, methyl, and methoxy groups. The loss of these neutral fragments represents the fundamental fragmentation pathway for flavonoids. Most of the flavonoid glycosides were O-glycosides, as indicated by the neutral losses of rhamnopyranosyl (m/z 146) and glucose residues (m/z 162). MS/MS fragments of [M-162]+ were generated due to typical C-glycoside cleavages, suggesting that glycosyl groups are linked to the flavonoid glycosides through C-glycosidic bonds. For instance, quercetin 3,4-diglycosides (peak 23, m/z 627.1554, [M + H]+) represent glycosides linked to quercetin aglycones through C3 and C4 bonds [23].

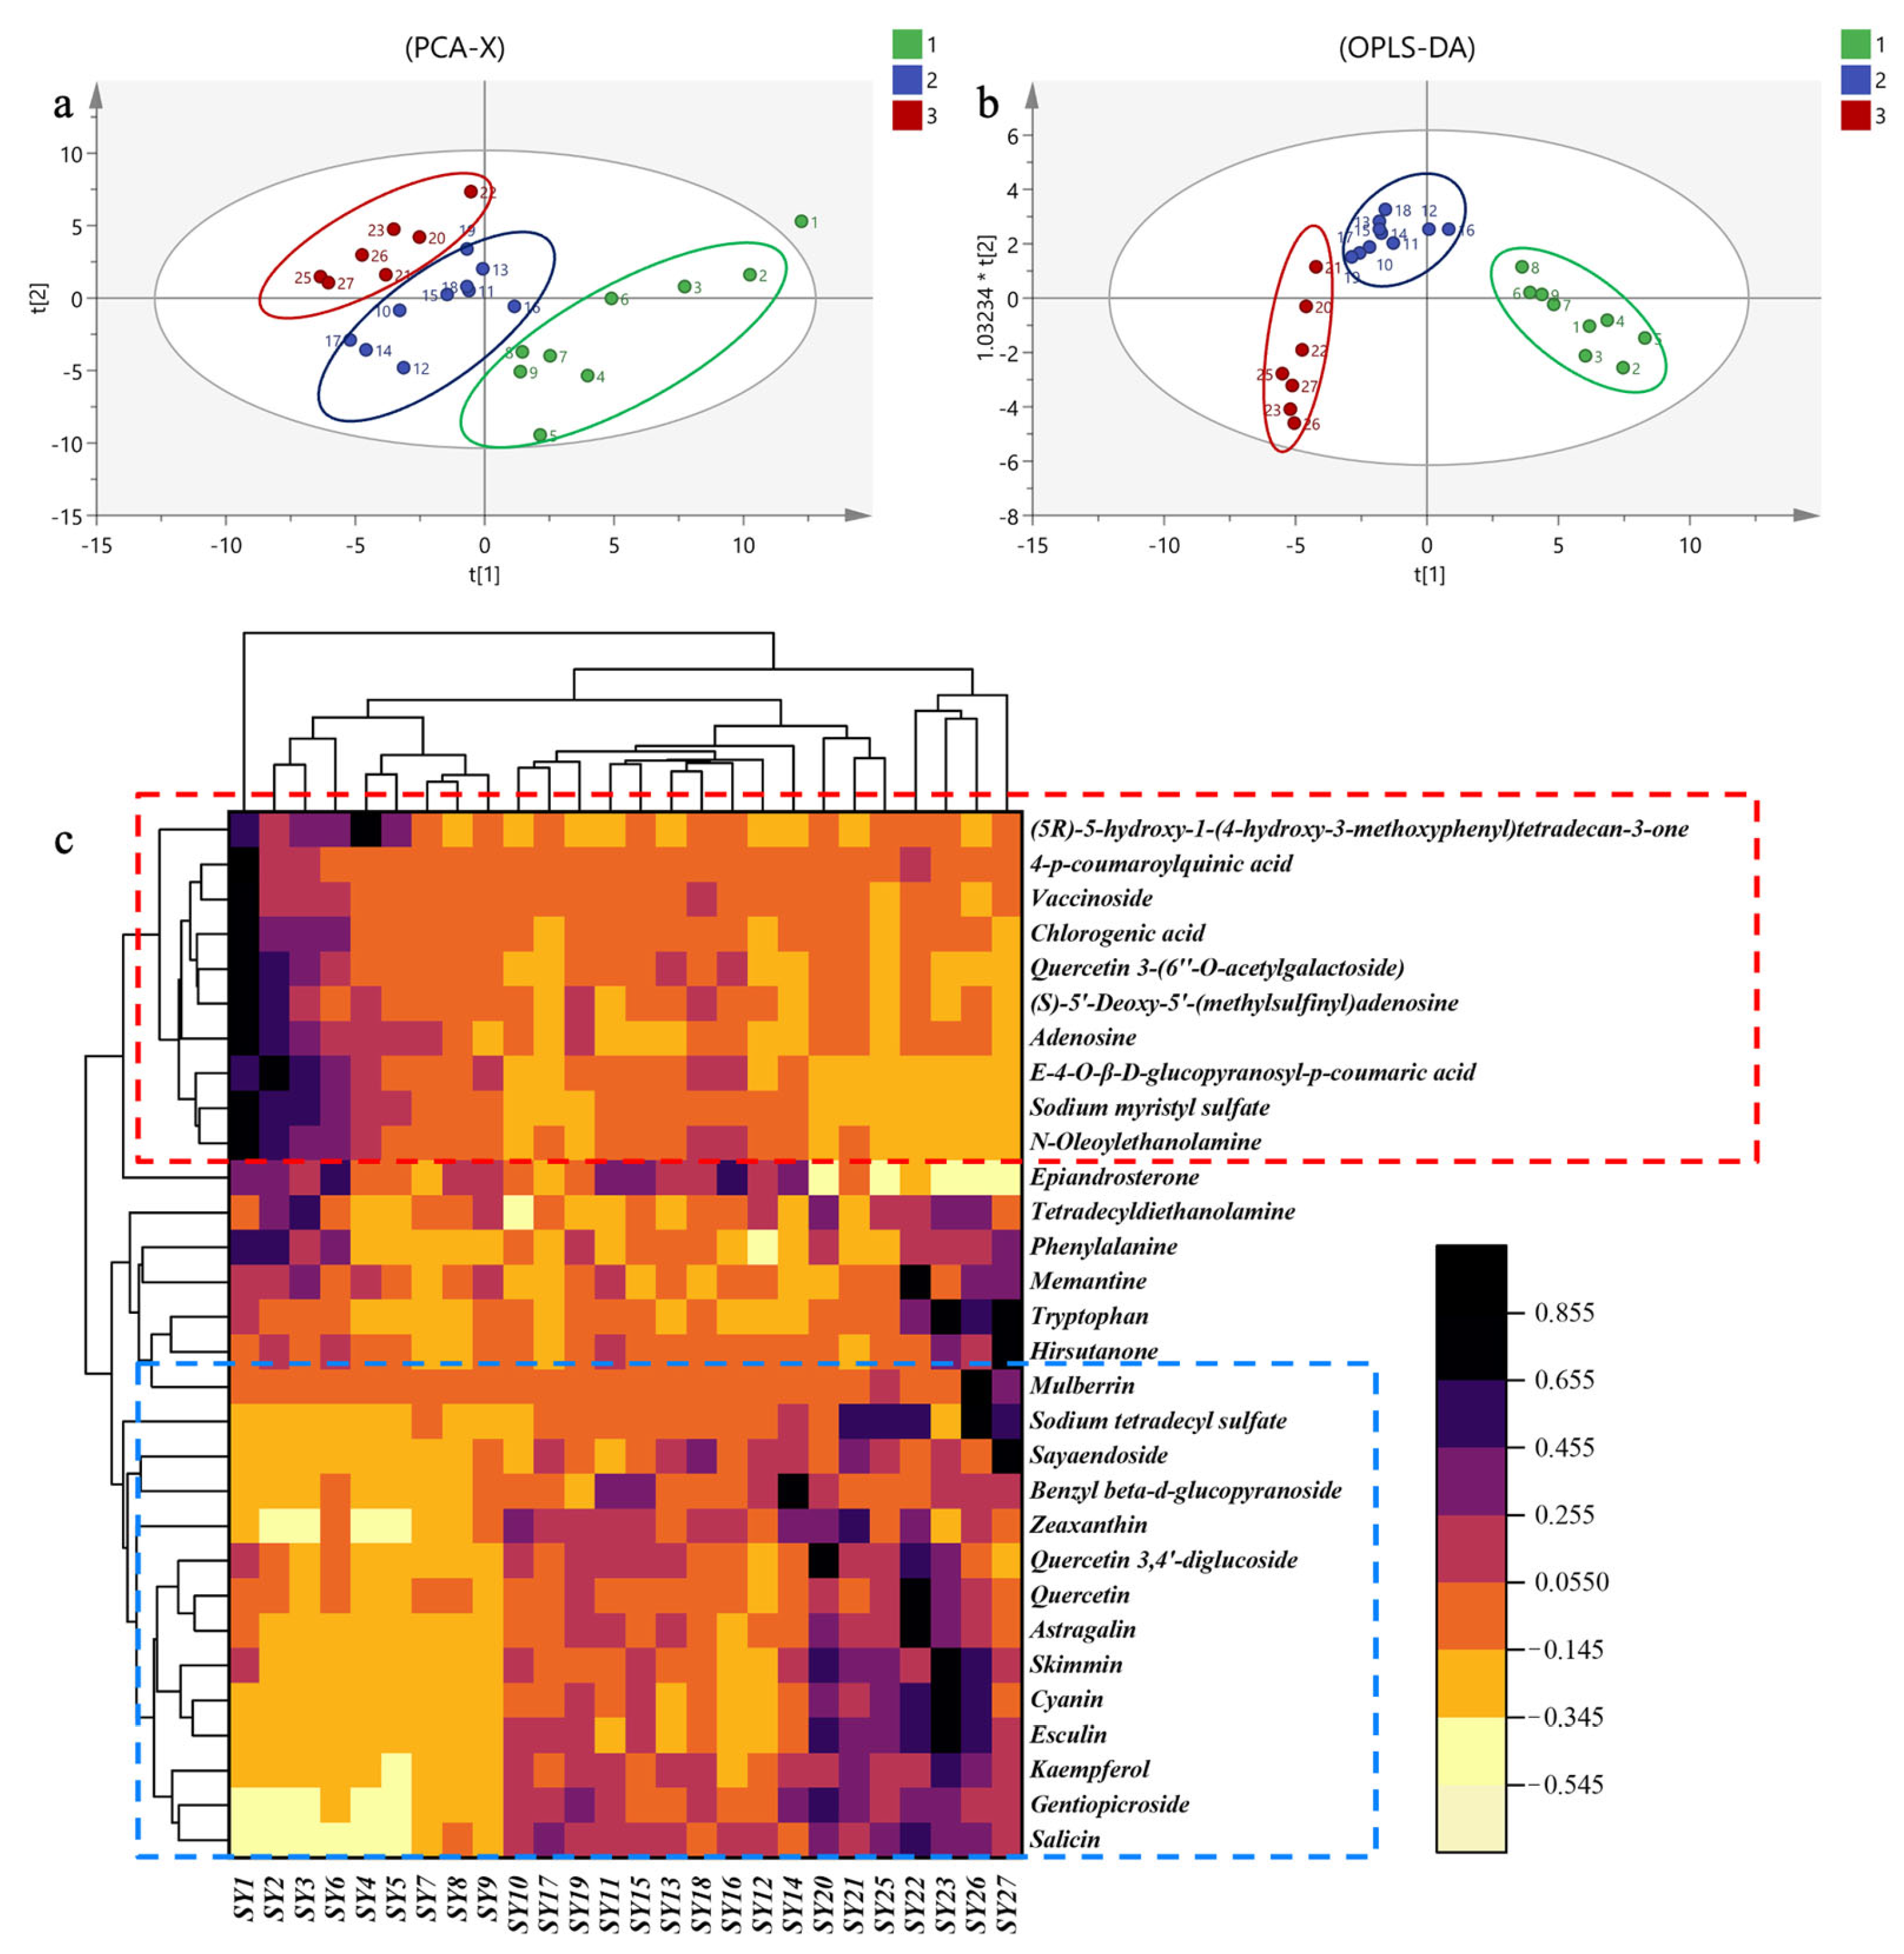
2.2.2. Secondary Metabolites of MLs at Different Growth Periods

Isochlorogenic acid A served as the reference peak during the method validation for metabolites in ML extracts. The relative peak area (RPA) for each compound was calculated using the area normalization method. Subsequently, we employed the multivariate statistical analysis software SIMCA 14.1 to conduct PCA and OPLS-DA to identify differential metabolites.
PCA was conducted on MLs at different growth stages, yielding cumulative variance explanatory (R2X) and predictive (Q2) ability parameters of 0.688 and 0.494, respectively. These values indicate the effectiveness of the PCA model in discriminating between samples. As depicted in Figure 5a, the 27 batches of samples from various growth stages were categorized into three distinct regions, suggesting notable differences in metabolite content among MLs at different growth stages.
Furthermore, OPLS-DA was employed to establish a partial least squares discriminant analysis model. The cumulative explanatory power parameters R2Y and Q2 were 0.817 and 0.682, respectively, signifying the stability and predictive capability of the model (Figure 5b). The OPLS-DA score plot also revealed a similar categorization of MLs at different growth stages into three distinct groups, consistent with the PCA results.
Differential metabolite screening in MLs at different growth stages was carried out by considering variables with a VIP score greater than 1 and a p-value less than 0.05. Consequently, 30 differential chemical markers were identified. Cluster analysis was performed using Origin software 2021 (Northampton, MA, USA), employing the inter-group mean connection method and Euclidean distance.
The clustering heatmap (depicted in Figure 5c) demonstrated that MLs at different growth stages could be clearly distinguished based on the clustering patterns of the identified compounds. These findings align with the results obtained from PCA and OPLS-DA analyses. Among the 30 compounds, those in the red zone (4-p-coumaroylquinic acid, vaccinoside, chlorogenic acid, quercetin 3-(6″-O-acetylgalactoside), (S)-5′-deoxy-5′-(methylsulfinyl) adenosine, adenosine, (E)-4-O-β-d-glucopyranosyl-p-coumaric acid, sodium myristyl sulfate) exhibited significantly higher levels during the first growth stage compared to the last two growth stages. Conversely, compounds in the blue zone (tryptophan, hirsutanone, sodium tetradecyl sulfate, salicin, gentiopicroside, kaempferol, esculin) displayed significantly lower levels during the first growth stage in comparison to the last two growth stages.

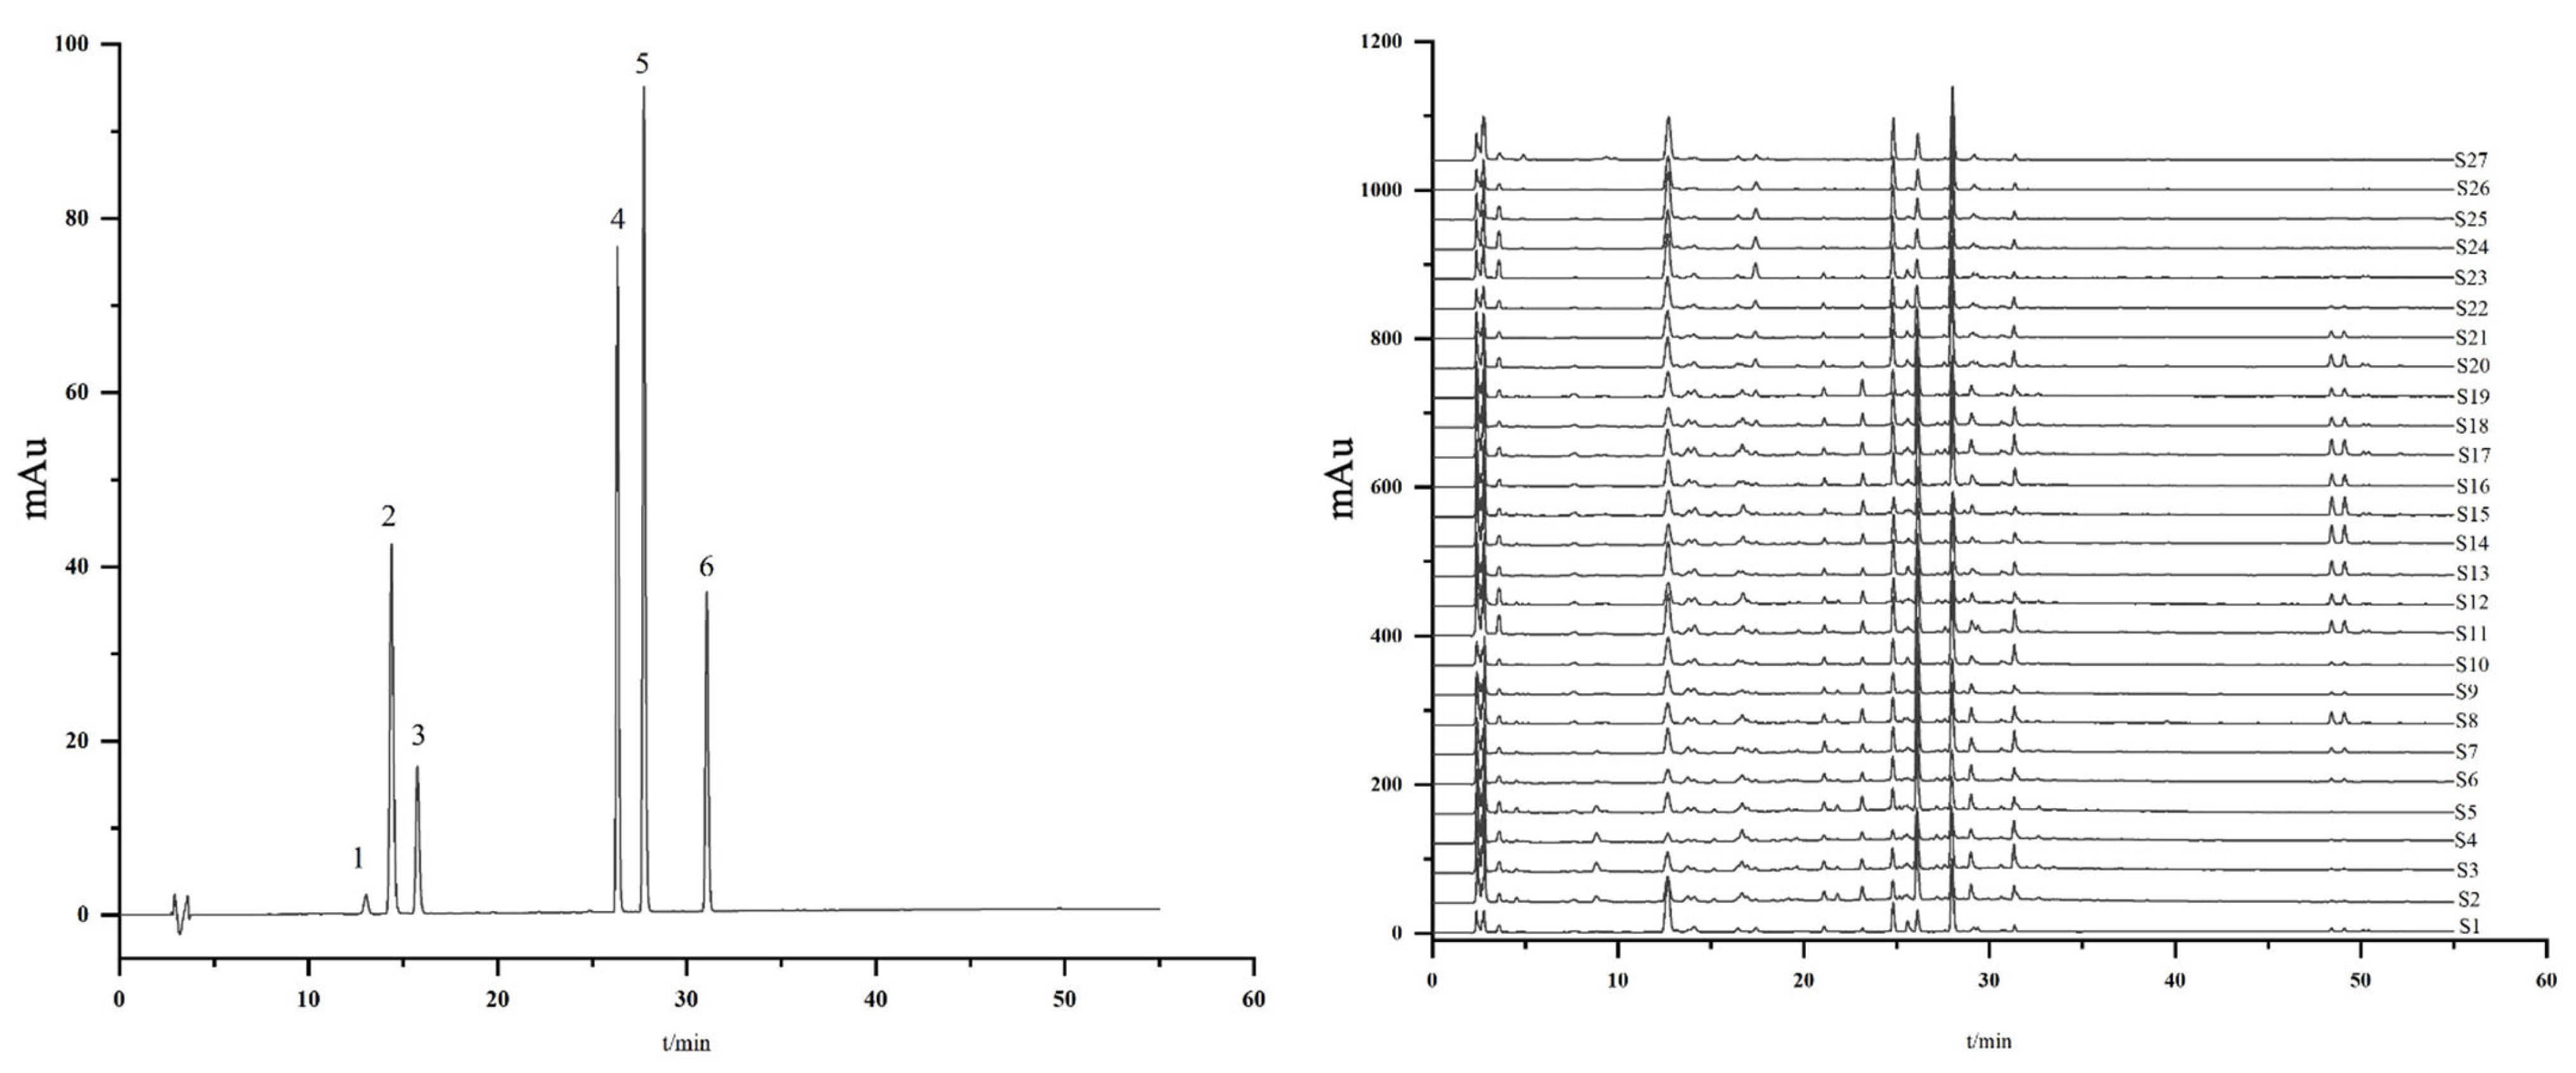
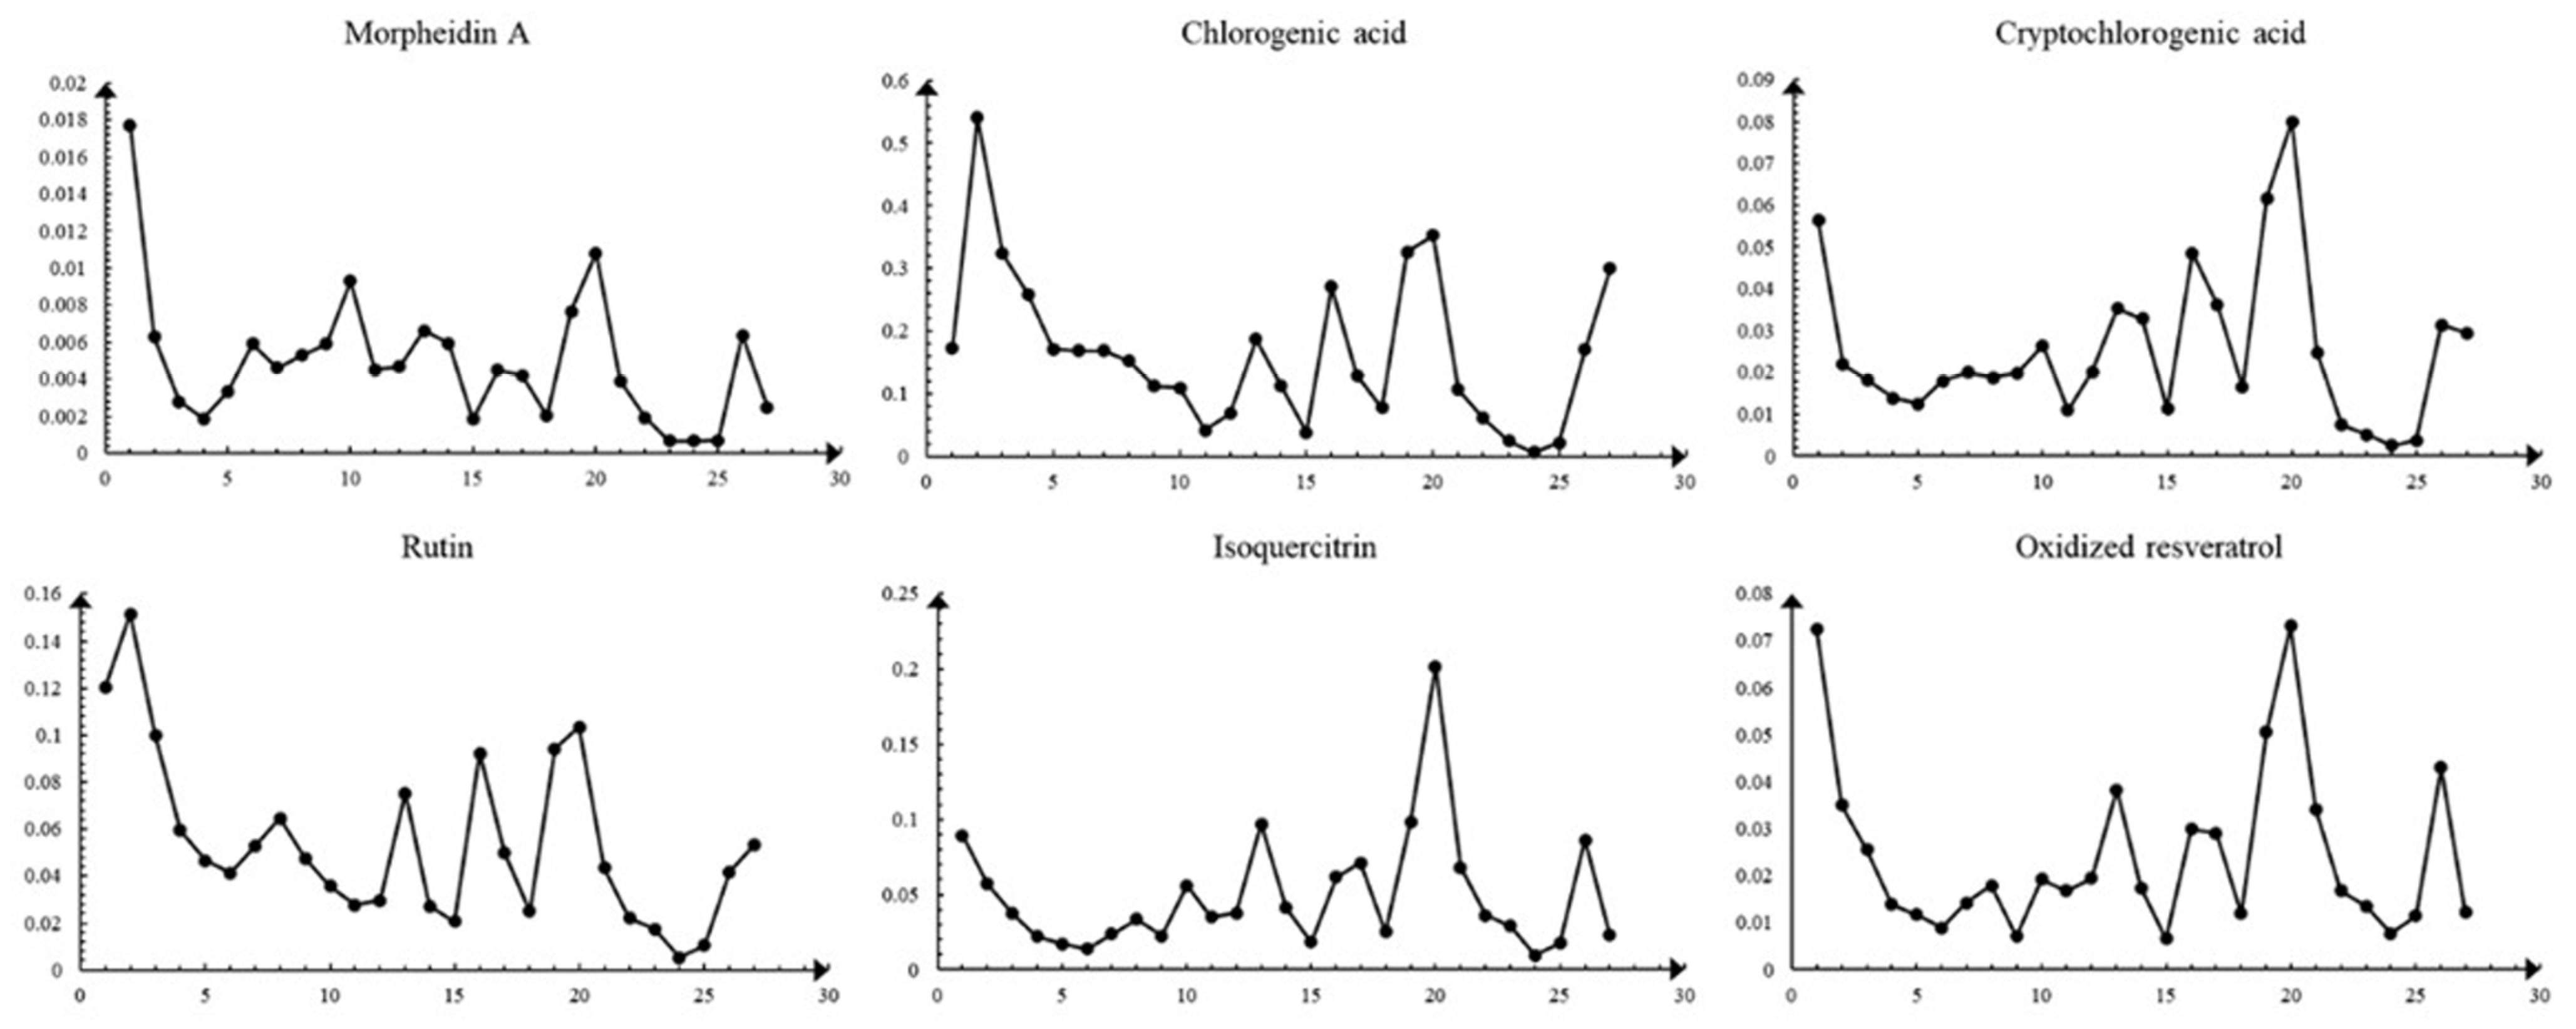
2.3. The Determination of Six Compounds from MLs by HPLC Analysis

The validation of the HPLC method encompassed the determination of parameters including linearity, repeatability, precision, stability, and recovery.

2.3.1. Linearity and Method Validation

A set of standard solutions containing six compounds was freshly formulated in methanol to establish the linear range of the analytes. The outcomes of calibration were compiled in Table 3, revealing strong correlations between the peak area (y) and the concentration of the tested compounds (x) (r > 0.9995) within the specified test ranges. This observation affirmed the acceptability and exceptional sensitivity of the analytical method.

2.3.2. Simultaneous Quantitative Analysis of Six Constituents of MLs

HPLC was employed to assess the variations in six components of MLs across different growth stages, encompassing mulberroside A, chlorogenic acid, cryptochlorogenic acid, rutin, isoquercitrin, and oxidized resveratrol. The observed changes in the content of these six compounds in MLs align with the findings from GC-MS and UPLC-QTOF-MS. Specifically, the compositional changes can be roughly categorized into three stages, with the highest content of these compounds observed at the Y20 (Table 4) stage. All results are shown in Figure 6 and Figure 7.

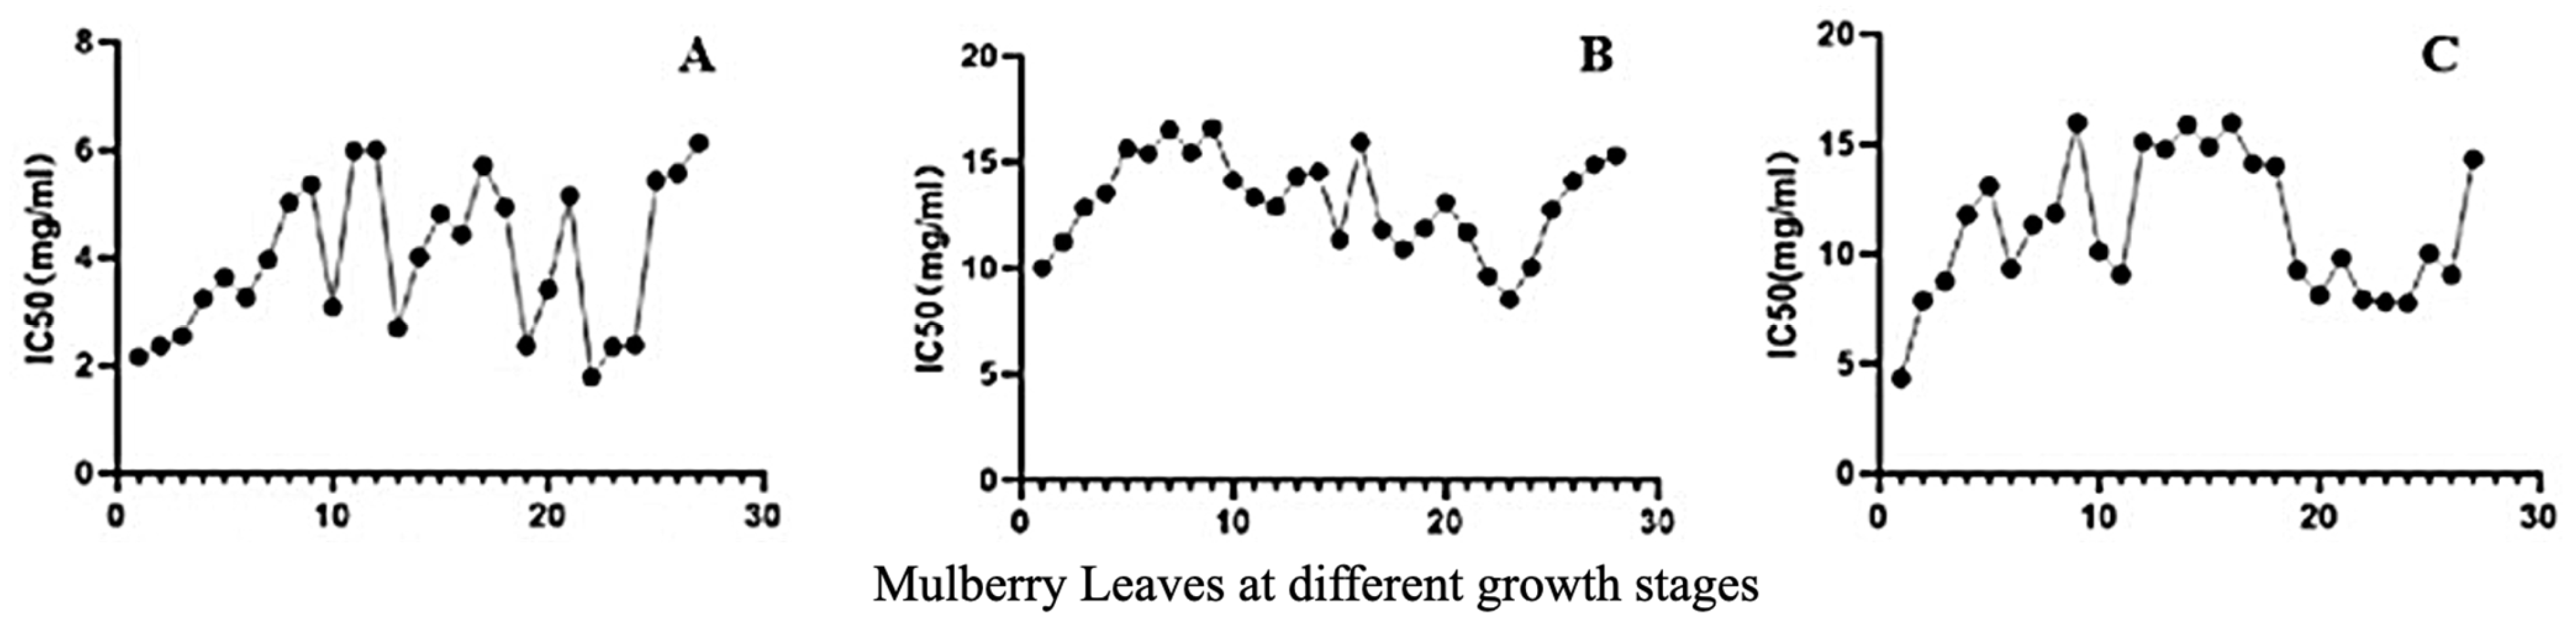
2.4. Antioxidant Activities of MLs at Different Growth Stages

Based on the data presented in Figure 8A, it can be observed that the IC50 (half maximal inhibitory concentration values), which represent the DPPH radical scavenging activity, exhibited notable variations during different stages of ML growth. Specifically, at the early growth stage of MLs, a lower IC50 value indicated a strong antioxidant activity. However, as the IC50 value increased, the antioxidant activity of MLs displayed irregular fluctuations, and around the Y23 stage, the antioxidant activity increased and then decreased.
Similarly, Figure 8B also reveals fluctuations in the scavenging capacity of MLs for hydroxyl free radicals over the course of their growth. Initially, during the early growth stages, MLs exhibited a strong ability to scavenge hydroxyl free radicals, which subsequently decreased and displayed irregular fluctuations. The scavenging ability reached its peak at Y23, followed by a decrease. Notably, these observations regarding the antioxidant activity were consistent with the trends observed for DPPH free radical scavenging.
Furthermore, Figure 8C demonstrates that MLs exhibited a low IC50 value and a high clearance rate during the early growth stage, indicating strong clearance of ABTS free radicals. However, as the growth stage progressed, the clearance rate of MLs for ABTS free radicals exhibited irregular fluctuations. Similarly, IC50 values decreased, and the clearance rate was high at the Y23 stage.

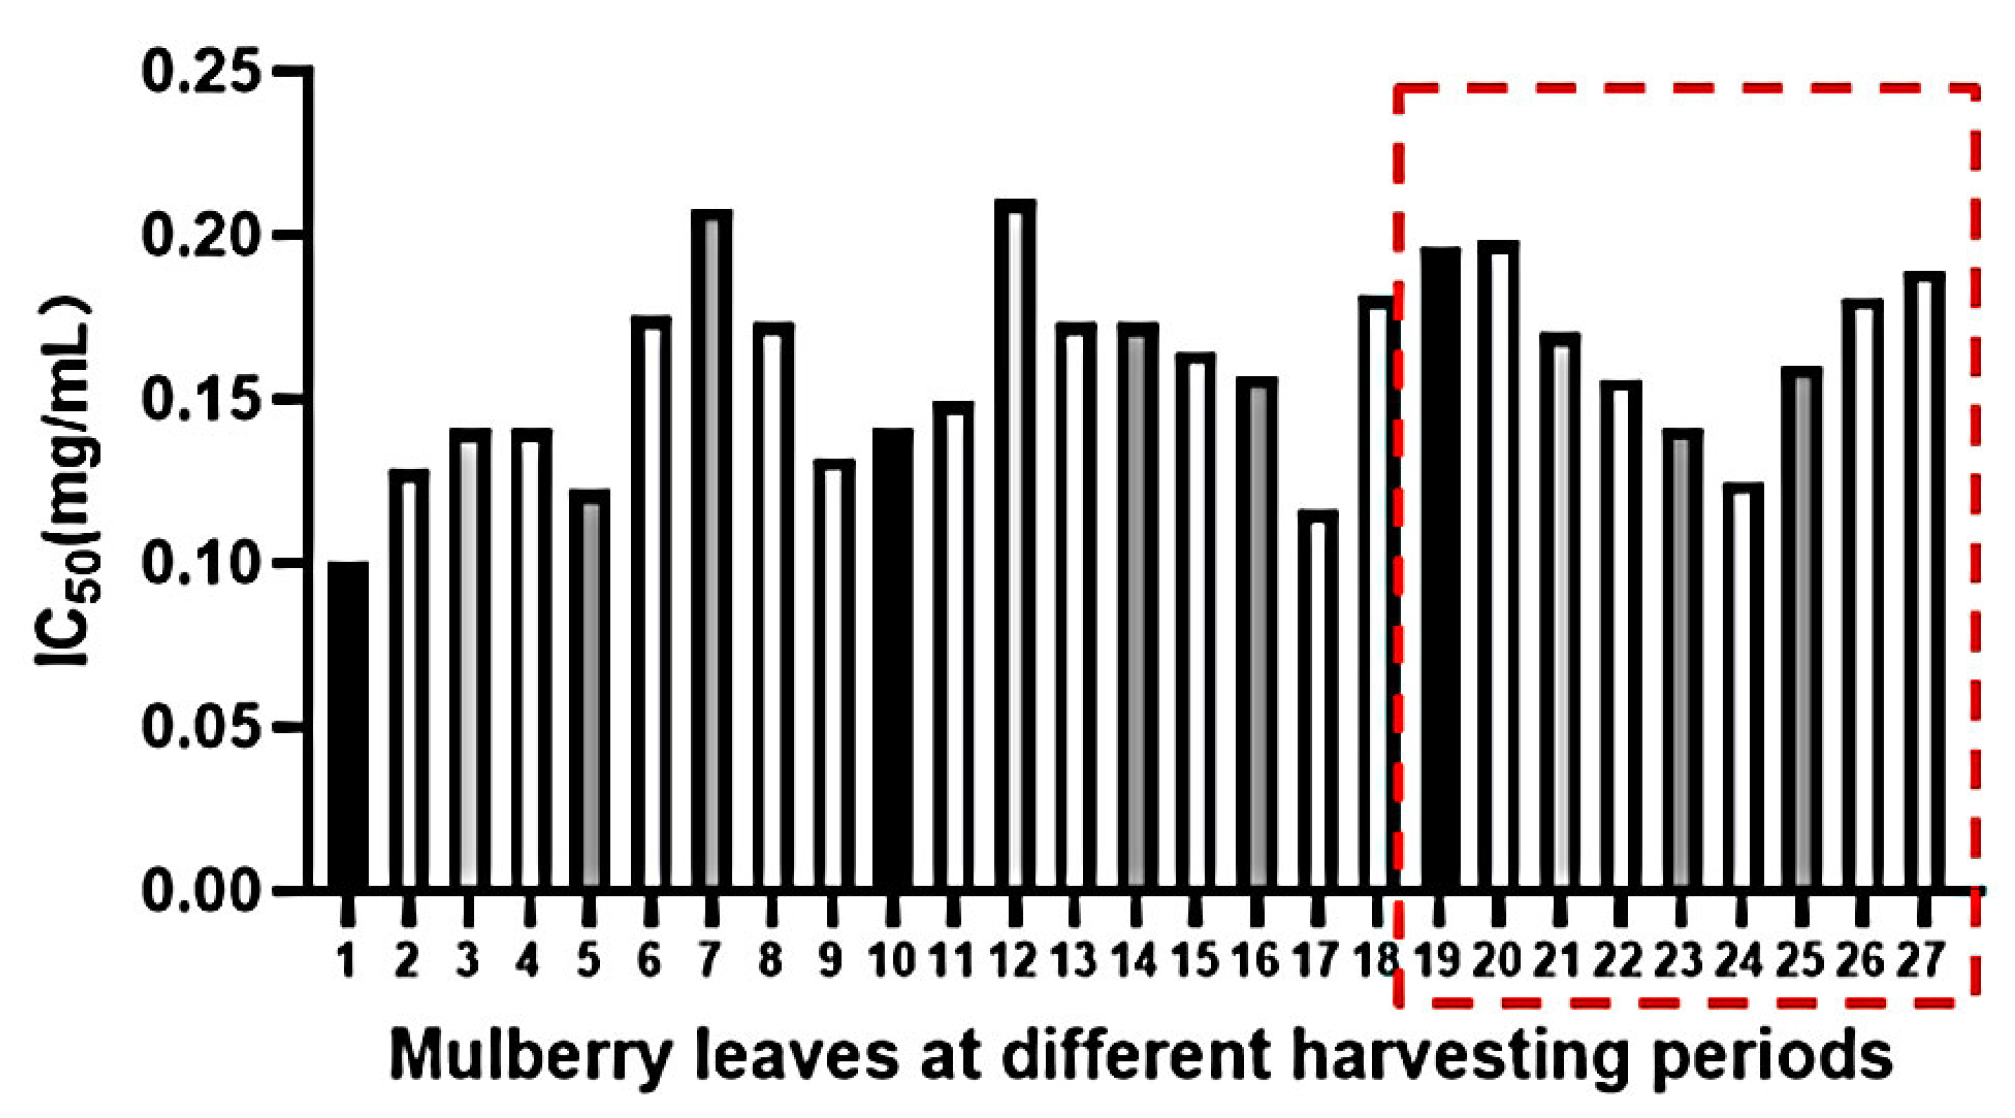
2.5. The Inhibitory Effects of MLs at Different Growth Stages on α-Glucosidase Activities

α-Glucosidase is a group of enzymes located in the brush border membrane of the small intestine. It catalyzes the hydrolysis of various polysaccharides, including starch, sucrose, and maltose, as well as oligosaccharides and disaccharides present in food, into absorbable monosaccharides, such as glucose and fructose. α-Glucosidase inhibitors competitively hinder the activity of α-glucosidase. They delay the conversion of polysaccharides, oligosaccharides, and disaccharides into monosaccharides, thereby regulating postprandial blood glucose levels and preventing sharp increases in blood glucose levels after meals [67].
The experimental method for assessing α-glucosidase activity is based on the reaction between α-glucosidase and PNPG, resulting in the production of p-nitrophenol. When a sample solution is introduced into the system, it inhibits the activity of α-glucosidase within the sample, subsequently reducing the production of p-nitrophenol and leading to a decrease in absorbance. As depicted in Figure 9, during the early stage of leaf growth, MLs exhibited a lower IC50 value, indicating a stronger inhibitory effect on α-glucosidase. The red dashed line illustrates a decrease in the IC50 value before and after the traditional Chinese solar term ‘Frost’s Descent’, followed by an increase in the later period. This suggests that MLs harvested both before and after the period of frost’s descent possess enhanced inhibition of α-glucosidase activity.

3. Materials and Methods

3.1. Plant Materials and Chemicals

3.1.1. Plant Materials

A total of 27 batches of MLs, representing various growth periods, were gathered from the medicinal plant garden at Hebei University of Chinese Medicine (coordinates: 114°20′47.16″ E, 38°3′24.27″ N, elevation 118.23 m above sea level). To ensure uniformity in sampling, leaves were collected simultaneously from multiple trees within the same area and at different heights. Three replications of the samples were collected and analyzed. These samples were subsequently authenticated by Prof. Dan Zhang. The collection dates for the 27 samples are detailed in Table 4. All specimens were securely stored at Hebei University of Chinese Medicine.

3.1.2. Chemicals

Derivatization reagents including anhydrous pyridine (high-purity grade) and the internal standard arabitol, sourced from Shanghai Aladdin Biochemical Technology Co., Ltd. (Shanghai, China), as well as methoxyamine hydrochloride (GC-grade) and N-methyl-N-trimethylsilyl-trifluoroacetamide (MSTFA, GC-grade) obtained from Sigma-Aldrich (St. Louis, MO, USA), were utilized in the study. Isochlorogenic acid B (MUST-20031602) was acquired from Chengdu Must Bio-technology Co., Ltd. (Chengdu, China). Standard substance, such as mulberroside A (PRF9070342), chlorogenic acid (110753-201415), cryptochlorogenic acid (PRF9091941), rutin (100080-202012), isoquercitrin (PRF9092807), oxidized resveratrol (MUST-20031602), and xylitol (100463-202003) were obtained from Chengdu Biopurify Phytochemicals Ltd. (Chengdu, China), and 2,4,6-Tripyridyl-s-triazine, K2S2O8, 2,2′-azinobis-(3-ethylbenzthiazoline-6-sul phonae) (ABTS), and 2,2-diphenyl-1-picryl-hydrazyl (DPPH) were obtained from Aladdin Biochemical Technology Co. Ltd. (Shanghai, China). HPLC grade methanol and acetonitrile were purchased from Fisher Scientific Co., Ltd. (Pittsburgh, PA, USA). LC-MS-grade methanol, acetonitrile, and formic acid were obtained from Fisher Scientific (Pittsburgh, PA, USA), while ultrapure water was produced using a Synergy water purification system (Millipore, Billerica, MA, USA). All other chemicals and reagents used were of analytical grade.

3.2. Sample Preparation for MS and HPLC Analyses

All samples were subjected to freeze-drying and subsequent grinding to obtain a fine powder. The resulting powder was sieved through a 40-mesh screen. An exact 0.5 g of ML powder was carefully placed into a conical bottle with a stopper, followed by the precise addition of 17.5 mL of 80% ethanol. Ultrasonication was performed for a duration of 45 min while maintaining the water temperature at a constant 60 °C. The mixture was then cooled to room temperature and weighed to compensate for any weight loss. Subsequently, centrifugation was conducted at 13,000 r·min−1 for 10 min, and the resulting supernatant was collected.
To ensure the stability of the analytical method, quality control (QC) samples were prepared by equally combining powders from all samples.

3.2.1. GC-MS Analysis

For sample preparation, 100 μL of the extract and 20 μL of arabitol solution (0.8 mg/mL) were combined in screw-cap vials and subjected to evaporation under a nitrogen gas stream at 40 °C until complete dryness. The derivatization of primary metabolites of the extracted samples was assessed using a method previously described with slight modifications [15,68,69]. An amount of 20 μL of methoxyamine in pyridine (20 mg/mL) was added to the sample tube, followed by incubation at 37 °C for 150 min in a dry bath. Subsequently, for silylation, 80 μL of N-methyl-N-(trimethylsilyl)-trifluoroacetamide (MSTFA) was added to the mixture and incubated at 37 °C for 150 min under the same conditions as previously mentioned. Finally, the sample underwent centrifugation at 13,000 r·min−1 for 10 min, and the resulting supernatant was collected for GC-MS analysis.
GC-MS analysis was performed using an Agilent 7890B GC system coupled with a 5977B MSD mass detector (Agilent Technologies, Santa Clara, CA, USA). The GC-MS instrument was equipped with an Agilent HP-5MS 5% phenyl methyl siloxane capillary column (30 m × 0.25 mm, 0.25 µm, Agilent, Santa Clara, CA, USA). A 1 µL aliquot of the prepared supernatant solution was introduced in split mode with a split ratio of 10:1, at an injection temperature of 250 °C. The oven temperature program initiated at 60 °C, then ramped up to 130 °C at a rate of 20 °C·min−1, held for 1 min, further increased to 150 °C at a rate of 5 °C·min−1, and then elevated to a maximum of 220 °C at a rate of 3 °C·min−1, with a 1-min hold. Following this, the temperature was raised to 255 °C at a rate of 5 °C·min−1 and maintained for 5 min.
Mass spectrometry parameters involved the utilization of an electron ionization ion source (EI) with an ion energy of 70 eV. The interface temperature, ion source temperature, and quadrupole temperature were maintained at 250 °C, 230 °C, and 150 °C, respectively. The scanning mass range for the total ion chromatogram (TIC) extended from m/z 50 to 500, and a solvent delay time of 3 min was applied.

3.2.2. UPLC-MS Analysis

Analysis with UPLC-Q-TOF/MS was carried out using an Agilent 1290 Infinity II system connected to an Agilent 6545 quadrupole time-of-flight mass spectrometer system (Q-TOF-MS) (Agilent Technologies, Santa Clara, CA, USA), which featured an electrospray ionization interface.
Chromatographic separation was carried out using an Agilent ZORBAX SB-18 column (4.6 × 50 mm, 1.8 μm, Santa Clara, CA, USA). The binary gradient elution system consisted of acetonitrile (B) and water with 0.1% formic acid (A). Separation was performed at a flow rate of 0.4 mL·min−1, following this gradient program: 0–5 min, from 9% to 15% B; 5–16 min, from 15% to 24% B; 16–20 min, from 24% to 52% B; 20–30 min, from 52% to 55% B; 30–33 min, from 55% to 70% B. The sample injection volume was 1 µL, and the column temperature was maintained at 25 °C.
For mass spectrometry acquisition, the parameters were configured as follows: drying gas (N2) temperature set at 320 °C; sheath gas (N2) temperature at 350 °C; drying gas (N2) flow maintained at 10.0 L·min−1; sheath gas (N2) flow at 11 L·min−1; nebulizer gas (N2) pressure maintained at 35 psi; capillary voltage held at 3500 V; fragmentor voltage at 135 V; and collision energy set to 40 eV. The analysis was performed in positive mode, covering a mass range from m/z 100 to 1000 Da. Subsequently, the data obtained were processed using MassHunter Qualitative Analysis Software Version B.10.00 (Agilent Technologies, Santa Clara, CA, USA).

3.2.3. HPLC Analysis

HPLC analysis was carried out using a Shimadzu LC-2030 3D system equipped with a photodiode-array detector (Shimadzu, Kyoto, Japan). Chromatographic separation was achieved on an Agilent ZORBAX Eclipse XDB-C18 column (5 μm, 4.6 × 250 mm, Agilent Technologies, Santa Clara, CA, USA) while maintaining the column temperature at 30 °C. Detection was performed at a wavelength of 254 nm, and a 10 μL injection volume was used. The mobile phase consisted of a gradient mixture of water containing 0.1% formic acid (A) and acetonitrile (B), flowing at a rate of 1 mL·min−1. The gradient elution program was as follows: 0–5 min: 9% B, 5–13 min: 9–13% B, 13–25 min: 13–22% B, 25–55 min: 22–48% B, 55–65 min: 48–65% B, and 65–75 min: 65–79% B.

3.3. GC-MS Profiling and Modeling of Silylated Primary Metabolites

We validated silylation following the protocol described in our previous work [69]. Metabolite identification in MLs involved comparing their retention indices (RI) to n-alkanes (C7–C40) and aligning their masses with entries in NIST17 library. After normalization, the dataset was imported into SIMCA software (version 14.0, Umetrics, Umea, Sweden) for orthogonal principal component analysis (PCA) and partial least squares discriminant analysis (OPLS-DA).

3.4. Analysis, Modeling, and Quantification of the UPLC-QTOF-MS Dataset

3.4.1. GNPS Molecular MS/MS Network

MN construction utilized UPLC-QTOF MS/MS data. All MS/MS data files were converted to 32-bit mzXML format with ProteoWizard software (https://proteowizard.sourceforge.io, accessed on 1 December 2023). These transformed files were then transferred to the GNPS platform (https://gnps.ucsd.edu, accessed on 1 December 2023) via WinSCP (https://winscp.net, accessed on 1 December 2023) to initiate MN generation following an online workflow [19]. The MN parameters were set as follows: a minimum cosine score of 0.70, a requirement of at least 6 matched peaks, a tolerance of 0.02 Da for both parent mass and fragments, a maximum connected component size of 100, a minimum cluster size of 1, and the exclusion of the run MScluster tool. Access to the resultant MN and its related parameters can be found through this link: (http://gnps.ucsd.edu/ProteoSAFe/status.jsp?task=3902109bbf36453ca44f4fa5a553c85b, accessed on 1 December 2023). Metabolites were identified based on their molecular formula and fragmentation pattern, with reference to previously reported data, public literature, libraries, and databases. The obtained results were then exported for visualization using Cytoscape 3.8.2 software (La Jolla, CA, USA).

3.4.2. Data Processing and Statistical Analysis

The LC-MS data acquisition was conducted using the MassHunter Workstation (Agilent Technologies). After data normalization, the dataset was imported into SIMCA software (version 14.0, Umetrics, Umea, Sweden) for PCA and OPLS-DA. Additionally, the data for different growth periods were designated as a Y variable and subjected to statistical analysis, which included partial least squares (PLS), partial least squares discriminant analysis (PLS-DA), and OPLS-DA. Variable importance in projection (VIP) values obtained from the OPLS-DA analysis were employed for marker compound identification in MLs during storage. Cluster analysis (CA) was carried out using OriginPro 2021 (9.8, Origin Lab Corporation, Northampton, MA, USA).

3.5. Standard Substance Solution and Sample Solution Preparation

A known quantity of standard substances was utilized to create a composite solution in methanol, which included mulberroside A, chlorogenic acid, cryptochlorogenic acid, rutin, isoquercitrin, and oxidized resveratrol, at concentrations of 0.006, 0.0944, 0.032, 0.086, 0.064, and 0.052 mg/mL, respectively.
For the sample preparation, 0.5 g of ML powder was precisely weighed and transferred to a conical vial. Then, 17.5 mL of 80% ethanol was accurately added. The mixture underwent ultrasonication for 45 min, maintaining a constant water temperature of 60 °C. After cooling to room temperature, the mass was re-measured to account for any weight change. Subsequently, centrifugation was performed at 13,000 rpm for 10 min, and the resulting supernatant was collected as the test sample solution.

3.6. Determination of Antioxidant Activities at Different Growth Stages of MLs

3.6.1. Inhibition of 1,1 diphenyl 2-picryl hydrazine (DPPH)

The DPPH scavenging activity of the extracted samples was assessed using a method previously described with slight modifications [70]. Extracts from 27 batches of ML samples were diluted to concentrations of 2 mg·mL−1, 3 mg·mL−1, 4 mg·mL−1, 5 mg·mL−1, 6 mg·mL−1, and 7 mg·mL−1, respectively. Different concentrations of ML extract solutions were accurately mixed with 180 μL of DPPH-ethanol solution, followed by incubation for 30 min at 37 °C in the absence of light. Absorbance was then measured at 517 nm. The scavenging rate was calculated using the following formula:
DPPH scavenging rate (%) = AA% = [1 − (A − A0)/B] × 100%
where A corresponds to the absorbance value of the solution with the added sample, A0 represents the control group lacking the DPPH solution, and B denotes the blank group without the sample.

3.6.2. Inhibition of Hydroxyl Radical

To assess the hydroxyl radical scavenging capacity, 27 batches of ML samples were diluted to various concentration gradients. A mixture of 30 μL hydrogen peroxide solution, 30 μL salicylic acid solution, and 30 μL ferrous sulfate solution was added to 120 μL of the ML sample extraction solution. The mixture was incubated for 30 min in the absence of light, and the absorbance was subsequently measured at 517 nm.
The hydroxyl radical scavenging rate was calculated using the following formula:
Hydroxyl radical scavenging rate (%) = AA% = [1 − (A − A0)/B] × 100%
where A represents the absorbance value of the sample solution, A0 denotes the control group without hydrogen peroxide solution, and B signifies the blank group without sample addition.

3.6.3. ABTS Radical Scavenging Activity

The ABTS cation (ABTS+•) radical inhibition assay was performed with minor adjustments, following a previously documented method [70]. Initially, ABTS was dissolved in deionized water to attain a concentration of 7 mM. ABTS+• was generated by reacting the ABTS solution with potassium persulfate, reaching a final concentration of 2.45 mM, and allowing this mixture to stand at room temperature in darkness for 12–16 h before application. In this investigation, the ABTS+• solution was thoroughly mixed with distilled water until the absorbance at 734 nm stabilized at 0.70 ± 0.002. Subsequently, 20 μL of varying extract concentrations were combined with 180 μL of the prepared ABTS+• solution and incubated for 10 min. The resulting reaction solutions were then assessed using a PerkinElmer VICTOR Nivo Multimode Plate Reader (PerkinElmer Inc., Mountain View, CA, USA) with excitation and emission wavelengths set at 734 nm. The ABTS+• scavenging rate was calculated using the following formula:
ABTS+• scavenging rate (%) = AA% = [1 − (A − A0)/B] × 100%
where A represents the absorbance value of the solution with the added sample, A0 is the control group without ABTS+• solution, and B is the blank group without the sample.

3.7. Determination of α-Glucosidase Inhibitory Activity at Different Growth Stages of MLs

The α-glucosidase inhibitory activity was determined following the protocol outlined by Guo et al. [71]. In a 96-well plate, 75 µL of PBS was added to all wells. Subsequently, 20 µL of ML sample solution at various concentrations was added to the control and background groups, while 20 µL of PBS was added to the control and background groups. Following this, 65 µL of α-glucosidase was added to the sample and control groups, and 65 µL of PBS was added to the blank and background groups. The plate was then incubated at 37 °C for 10 min. After incubation, 30 µL of p-nitrophenyl α-d-glucopyranoside (PNPG, Sigma-Aldrich Ltd., Shanghai, China) was added to all groups, followed by another 20 min of incubation at 37 °C. Finally, 50 µL of Na2CO3 was added to each well to halt the reaction. The absorbance was measured at 405 nm using the PerkinElmer VICTOR Nivo Multimode Plate Reader (PerkinElmer Inc., Mountain View, CA, USA), and the α-glucosidase inhibition rate was calculated using the following formula:
Inhibition (%) = [1 − (Aa − Ab)/Ac − Ad] × 100%
where Aa is the sample group, Ab is the blank sample group without α-glucosidase, Ac is the control group without sample, and Ad is the blank group without sample and α-glucosidase.
IC50 values were calculated using GraphPad Prism 9 (GraphPad Software, La Jolla, CA, USA).

4. Conclusions

The current study employed a non-targeted metabolomics approach based on GC-MS to determine changes in primary metabolites and UPLC-QTOF-MS to identify changes in secondary metabolites in MLs at different growth stages. Metabolite differences indicated that MLs at various growth stages could be roughly categorized into three stages. Samples 1–9 represented the initial growth stage, samples 10–19 corresponded to the intermediate growth stage, and samples 20–27 denoted the final growth stage. Importantly, significant changes in metabolite content occurred during these three growth stages, aligning with China’s 24 solar terms. The first growth stage occurred before the summer solstice, the second growth stage spanned from the summer solstice to the autumnal equinox, and the third growth stage occurred after the autumnal equinox. Seasonal divisions serve as crucial nodes symbolizing climate change in China. Variations in temperature and climate across different seasons greatly influenced metabolite changes. In vitro activity studies revealed significant variations in antioxidant activity and α-glucosidase inhibition among 27 batches of MLs at different growth periods. Enhanced activity was observed in ML samples at the beginning of the growth period and around the time of frost, aligning with the traditional harvest timing of ML medicinal herbs during the period of ‘Frost’s Descent’ in China. This study provides experimental evidence for the rational harvest of ML medicinal herbs and, concurrently, offers technical support for the development and utilization of MLs.

Author Contributions

W.L. and S.H.: Conceived and designed the experiments; Performed the experiments; Analyzed and interpreted the data; Wrote the paper. H.L., Q.A., L.Y., B.G., Z.X., Y.L. and L.G.: Analyzed and interpreted the data; Contributed reagents, materials, analysis tools or data. Y.Z. and D.Z.: Resources, Conceptualization, Supervision, Funding acquisition. All authors have read and agreed to the published version of the manuscript.

Funding

This research was funded by the Natural Science Foundation of Hebei Province (H2021423017, H2022418001), Key R&D plan of Hebei Province (23372503D, 22372503D), Science and Technology Project of National Administration of Traditional Chinese Medicine (gzy-kjs-2023-029), S&T Program of Hebei (223777127D, 226Z7714G).

Institutional Review Board Statement

Not applicable.

Informed Consent Statement

Not applicable.

Data Availability Statement

Data are contained within the article.

Conflicts of Interest

The authors declare no conflicts of interest.

References

  1. Sugiyama, M.; Katsube, T.; Koyama, A.; Itamura, H. Effect of solar radiation on the functional components of mulberry (Morus alba L.) leaves. J. Sci. Food Agric. 2016, 96, 3915–3921. [Google Scholar] [CrossRef] [PubMed]
  2. Singab, A.N.; El-Beshbishy, H.A.; Yonekawa, M.; Nomura, T.; Fukai, T. Hypoglycemic effect of Egyptian Morus alba root bark extract: Effect on diabetes and lipid peroxidation of streptozotocin-induced diabetic rats. J. Ethnopharmacol. 2005, 100, 333–338. [Google Scholar] [CrossRef] [PubMed]
  3. Han, X.; Song, C.; Feng, X.; Wang, Y.; Meng, T.; Li, S.; Bai, Y.; Du, B.; Sun, Q. Isolation and hypoglycemic effects of water extracts from mulberry leaves in Northeast China. Food Funct. 2020, 11, 3112–3125. [Google Scholar] [CrossRef] [PubMed]
  4. Yang, Y.; Zhang, T.; Xiao, L.; Chen, R.Y. Two novel flavanes from the leaves of Morus alba L. J. Asian Nat. Prod. Res. 2010, 12, 194–198. [Google Scholar] [CrossRef] [PubMed]
  5. Li, D.; Chen, G.; Ma, B.; Zhong, C.; He, N. Metabolic Profiling and Transcriptome Analysis of Mulberry Leaves Provide Insights into Flavonoid Biosynthesis. J. Agric. Food Chem. 2020, 68, 1494–1504. [Google Scholar] [CrossRef] [PubMed]
  6. Chen, A.Y.; Chen, Y.C. A review of the dietary flavonoid, kaempferol on human health and cancer chemoprevention. Food Chem. 2013, 138, 2099–2107. [Google Scholar] [CrossRef] [PubMed]
  7. Ma, G.; Chai, X.; Hou, G.; Zhao, F.; Meng, Q. Phytochemistry, bioactivities and future prospects of mulberry leaves: A review. Food Chem. 2022, 372, 131335. [Google Scholar] [CrossRef] [PubMed]
  8. Xu, D.Q.; Cheng, S.Y.; Zhang, J.Q.; Lin, H.F.; Chen, Y.Y.; Yue, S.J.; Tian, M.; Tang, Y.P.; Zhao, Y.C. Morus alba L. Leaves—Integration of Their Transcriptome and Metabolomics Dataset: Investigating Potential Genes Involved in Flavonoid Biosynthesis at Different Harvest Times. Front. Plant Sci. 2021, 12, 736332. [Google Scholar] [CrossRef]
  9. Yu, X.; Zhu, Y.; Fan, J.; Wang, D.; Gong, X.; Ouyang, Z. Accumulation of Flavonoid Glycosides and UFGT Gene Expression in Mulberry Leaves (Morus alba L.) before and after Frost. Chem. Biodivers. 2017, 14, e8760. [Google Scholar] [CrossRef]
  10. Padda, M.S.; Picha, D.H. Effect of low temperature storage on phenolic composition and antioxidant activity of sweetpotatoes. Postharvest Biol. Technol. 2008, 47, 176–180. [Google Scholar] [CrossRef]
  11. Farag, M.A.; Baky, M.H.; Morgan, I.; Khalifa, M.R.; Rennert, R.; Mohamed, O.G.; El-Sayed, M.M.; Porzel, A.; Wessjohann, L.A.; Ramadan, N.S. Comparison of Balanites aegyptiaca parts: Metabolome providing insights into plant health benefits and valorization purposes as analyzed using multiplex GC-MS, LC-MS, NMR-based metabolomics, and molecular networking. RSC Adv. 2023, 13, 21471–21493. [Google Scholar] [CrossRef] [PubMed]
  12. Chen, L.; Zhong, F.; Zhu, J. Bridging Targeted and Untargeted Mass Spectrometry-Based Metabolomics via Hybrid Approaches. Metabolites 2020, 10, 348. [Google Scholar] [CrossRef] [PubMed]
  13. Lee, S.Y.; Shaari, K. LC-MS metabolomics analysis of Stevia rebaudiana Bertoni leaves cultivated in Malaysia in relation to different developmental stages. Phytochem. Anal. 2022, 33, 249–261. [Google Scholar] [CrossRef] [PubMed]
  14. Salem, M.A.; Perez de Souza, L.; Serag, A.; Fernie, A.R.; Farag, M.A.; Ezzat, S.M.; Alseekh, S. Metabolomics in the Context of Plant Natural Products Research: From Sample Preparation to Metabolite Analysis. Metabolites 2020, 10, 37. [Google Scholar] [CrossRef] [PubMed]
  15. Zhang, L.; Zeng, Z.; Ye, G.; Zhao, C.; Lu, X.; Xu, G. Non-targeted metabolomics study for the analysis of chemical compositions in three types of tea by using gas chromatograph-mass spectrometry and liquid chromatography-mass spectrometry. Se Pu Chin. J. Chromatogr. 2014, 32, 804–816. [Google Scholar] [CrossRef] [PubMed]
  16. Carazzone, C.; Rodríguez, J.P.; Gonzalez, M.; López, G.-D. Volatilomics of natural products: Whispers from nature. In Metabolomics-Methodology and Applications in Medical Sciences and Life Sciences; IntechOpen: London, UK, 2021. [Google Scholar]
  17. Duan, P.B.; Xiao, P.T.; Yang, X.; Hao, J.H.; Li, K.; Liu, E.H. Screening of hypoglycemic components in Platycladi Cacumen by phytochemical investigation, spectrum-effect relationship, and chemometric methods. J. Sep. Sci. 2022, 45, 2591–2602. [Google Scholar] [CrossRef] [PubMed]
  18. De Vos, R.C.; Moco, S.; Lommen, A.; Keurentjes, J.J.; Bino, R.J.; Hall, R.D. Untargeted large-scale plant metabolomics using liquid chromatography coupled to mass spectrometry. Nat. Protoc. 2007, 2, 778–791. [Google Scholar] [CrossRef] [PubMed]
  19. Wang, M.; Carver, J.J.; Phelan, V.V.; Sanchez, L.M.; Garg, N.; Peng, Y.; Nguyen, D.D.; Watrous, J.; Kapono, C.A.; Luzzatto-Knaan, T. Sharing and community curation of mass spectrometry data with Global Natural Products Social Molecular Networking. Nat. Biotechnol. 2016, 34, 828–837. [Google Scholar] [CrossRef]
  20. An, Q.; Wang, L.; Ding, X.-Y.; Shen, Y.-J.; Hao, S.-H.; Li, W.-J.; Li, H.-Y.; Wang, T.; Zhan, Z.-L.; Zheng, Y.-G. Validation of Sennae Folium specification grade classification based on UPLC-Q-TOF/MS spectrum-effect relationship. Arab. J. Chem. 2022, 15, 104223. [Google Scholar] [CrossRef]
  21. Zou, X.-Y.; He, Y.-J.; Yang, Y.-H.; Yan, X.-P.; Li, Z.-B.; Yang, H. Systematic Identification of Bioactive Compositions in Leaves of Morus Cultivars Using UHPLC-ESI-QTOF-MS/MS and Comprehensive Screening of High-Quality Resources. Separations 2022, 9, 76. [Google Scholar] [CrossRef]
  22. Wang, Z.; Tang, C.; Xiao, G.; Dai, F.; Lin, S.; Li, Z.; Luo, G. Comparison of free and bound phenolic compositions and antioxidant activities of leaves from different mulberry varieties. BMC Chem. 2021, 15, 21. [Google Scholar] [CrossRef] [PubMed]
  23. D’urso, G.; Mes, J.J.; Montoro, P.; Hall, R.D.; de Vos, R.C. Identification of bioactive phytochemicals in mulberries. Metabolites 2020, 10, 7. [Google Scholar] [CrossRef] [PubMed]
  24. Zhang, L.L.; Bai, Y.L.; Shu, S.L.; Qian, D.W.; Ou-yang, Z.; Liu, L.; Duan, J.A. Simultaneous quantitation of nucleosides, nucleobases, amino acids, and alkaloids in mulberry leaf by ultra high performance liquid chromatography with triple quadrupole tandem mass spectrometry. J. Sep. Sci. 2014, 37, 1265–1275. [Google Scholar] [CrossRef] [PubMed]
  25. Li, R.; Wei, M.; Guo, G.; Li, Y.; Pan, X.; Song, X.; Rong, L.; Chen, Y.; Chen, B. Analysis of Main Components in Jujube and Mulberry Extracts by High-Sensitive HPLC-ESI-Q-TOF-MS/MS. J. Chromatogr. Sci. 2021, 59, 806–812. [Google Scholar] [CrossRef] [PubMed]
  26. Li, Y.; Ding, M.; Cui, C.; An, Q.; Wu, J.; Zhou, G.; Wan, Y.; Bao, W. Overexpression of a Gene Encoding Trigonelline Synthase from Areca catechu L. Promotes Drought Resilience in Transgenic Arabidopsis. Plants 2022, 11, 487. [Google Scholar] [CrossRef] [PubMed]
  27. Rajendran, M.; Roy, S.; Ravichandran, K.; Mishra, B.; Gupta, D.K.; Nagarajan, S.; Arul Selvaraj, R.C.; Provaznik, I. In silico screening and molecular dynamics of phytochemicals from Indian cuisine against SARS-CoV-2 M(Pro). J. Biomol. Struct. Dyn. 2022, 40, 3155–3169. [Google Scholar] [CrossRef] [PubMed]
  28. Kırmızıbekmez, H.; Tatar, D.; Erdoğan, M.; Kúsz, N.; Hohmann, J. A new depside and a new secoiridoid from the aerial parts of Gentiana olivieri from flora of Turkey. Nat. Prod. Res. 2022, 36, 2208–2214. [Google Scholar] [CrossRef] [PubMed]
  29. Zhang, X.; Wang, Z.; Luo, Z.; Chen, Y.; Huang, X. Insights into the conversion of dissolved organic phosphorus favors algal bloom, arsenate biotransformation and microcystins release of Microcystis aeruginosa. J. Environ. Sci. 2023, 125, 205–214. [Google Scholar] [CrossRef]
  30. Bati, B.; Celik, I.; Vuran, N.E.; Turan, A.; Alkan, E.E.; Zirek, A.K. Effects of Gundelia tournefortii L. on biochemical parameters, antioxidant activities and DNA damage in a rat model of experimental obesity. Braz. J. Biol. 2021, 83, e251198. [Google Scholar] [CrossRef]
  31. Adamiak, K.; Lewandowska, K.; Sionkowska, A. The Infuence of Salicin on Rheological and Film-Forming Properties of Collagen. Molecules 2021, 26, 1661. [Google Scholar] [CrossRef]
  32. Ilic-Tomic, T.; Sokovic, M.; Vojnovic, S.; Ciric, A.; Veljic, M.; Nikodinovic-Runic, J.; Novakovic, M. Diarylheptanoids from Alnus viridis ssp. viridis and Alnus glutinosa: Modulation of quorum sensing activity in Pseudomonas aeruginosa. Planta Med. 2017, 83, 117–125. [Google Scholar] [CrossRef]
  33. Luo, L.; Liu, X.; Jin, X.; Liu, Y.; Ma, J.; Zhang, S.; Zhang, D.; Chen, X.; Sheng, L.; Li, Y. Simultaneous determination of skimmin, apiosylskimmin, 7-hydroxycoumarin and 7-hydroxycoumarin glucuronide in rat plasma by liquid chromatography-Orbitrap mass spectrometry and its application to pharmacokinetics. Biomed. Chromatogr. 2022, 36, e5223. [Google Scholar] [CrossRef] [PubMed]
  34. Abe, C.; Soma, A.; Tun, T.N.N.; Zhang, Y.; Nishitani, Y.; Kayaki, H.; Kawakami, H.; Matsui, T. Pharmacokinetic profiles of 3-(4-hydroxy-3-methoxyphenyl) propionic acid and its conjugates in Sprague-Dawley rats. Biosci. Biotechnol. Biochem. 2023, 87, 516–524. [Google Scholar] [CrossRef] [PubMed]
  35. Zhang, Z.; Peng, L.; Fu, Y.; Wang, W.; Wang, P.; Zhou, F. Ginnalin A Binds to the Subpockets of Keap1 Kelch Domain To Activate the Nrf2-Regulated Antioxidant Defense System in SH-SY5Y Cells. ACS Chem. Neurosci. 2021, 12, 872–882. [Google Scholar] [CrossRef] [PubMed]
  36. Bao, T.; Xu, Y.; Gowd, V.; Zhao, J.C.; Xie, J.H.; Liang, W.K.; Chen, W. Systematic study on phytochemicals and antioxidant activity of some new and common mulberry cultivars in China. J. Funct. Foods 2016, 25, 537–547. [Google Scholar] [CrossRef]
  37. Basit, A.; Ahmad, S.; Naeem, A.; Usman, M.; Ahmed, I.; Shahzad, M.N. Chemical profiling of Justicia vahlii Roth.(Acanthaceae) using UPLC-QTOF-MS and GC-MS analysis and evaluation of acute oral toxicity, antineuropathic and antioxidant activities. J. Ethnopharmacol. 2022, 287, 114942. [Google Scholar] [CrossRef] [PubMed]
  38. Mieres-Castro, D.; Theoduloz, C.; Sus, N.; Burgos-Edwards, A.; Schmeda-Hirschmann, G.; Frank, J.; Jiménez-Aspee, F. Iridoids and polyphenols from chilean Gaultheria spp. berries decrease the glucose uptake in Caco-2 cells after simulated gastrointestinal digestion. Food Chem. 2022, 369, 130940. [Google Scholar] [CrossRef] [PubMed]
  39. Liu, Y.; Yin, X.; Sun, Y.-p.; Liu, Y.; Zhou, Y.-Y.; Pan, J.; Guan, W.; Yang, B.-Y.; Kuang, H.-X. Chemical constituent from the roots of Solanum melongena L. and their potential anti-inflammatory activity. Nat. Product. Res. 2022, 36, 1757–1764. [Google Scholar] [CrossRef] [PubMed]
  40. Wang, X.; Dong, Y.; Song, R.; Yu, A.; Wei, J.; Fan, Q.; Yao, J.; Shan, D.; Zhong, X.; Lv, F.; et al. Intestinal metabolism and absorption mechanism of multi-components in Gaultheria leucocarpa var. yunnanensis—An assessment using in situ and in vitro models, comparing gut segments in pathological with physiological conditions. J. Ethnopharmacol. 2022, 286, 114844. [Google Scholar] [CrossRef]
  41. Viet Thanh, N.T.; Thu Hien, D.T.; Minh, T.T.; Nhiem, N.X.; Yen, P.H.; Van Kiem, P. Flavonol glycosides from Phoebe poilanei Kosterm. Vietnam. J. Chem. 2018, 56, 711–716. [Google Scholar] [CrossRef]
  42. Miyase, T.; Ueno, A.; Takizawa, N.; Kobayashi, H.; Oguchi, H. Ionone and lignan glycosides from Epimedium diphyllum. Phytochemistry 1989, 28, 3483–3485. [Google Scholar] [CrossRef]
  43. Zúñiga Santamaría, T.; Yescas Gómez, P.; Fricke Galindo, I.; González González, M.; Ortega Vázquez, A.; López López, M. Pharmacogenetic studies in Alzheimer disease. Neurologia 2022, 37, 287–303. [Google Scholar] [CrossRef] [PubMed]
  44. Ju, W.T.; Kwon, O.C.; Kim, H.B.; Sung, G.B.; Kim, H.W.; Kim, Y.S. Qualitative and quantitative analysis of flavonoids from 12 species of Korean mulberry leaves. J. Food Sci. Technol. 2018, 55, 1789–1796. [Google Scholar] [CrossRef] [PubMed]
  45. Wang, X.; Ma, Q.-Y.; Liu, C.; Yang, J.; Lv, Q.-T.; Tian, Z.-H.; Jiang, H.-Q.; Rong, R. Three new C21 steroidal glycosides isolated from Metaplexis japonica and their potential inhibitory effects on tyrosine protein kinases. Nat. Product. Res. 2022, 36, 1988–1995. [Google Scholar] [CrossRef] [PubMed]
  46. Memon, A.A.; Memon, N.; Bhanger, M.I.; Luthria, D.L. Assay of phenolic compounds from four species of ber (Ziziphus mauritiana L.) fruits: Comparison of three base hydrolysis procedure for quantification of total phenolic acids. Food Chem. 2013, 139, 496–502. [Google Scholar] [CrossRef]
  47. Ma, X.; Ding, Q.; Hou, X.; You, X. Analysis of flavonoid metabolites in watercress (Nasturtium officinale R. Br.) and the non-heading Chinese cabbage (Brassica rapa ssp. chinensis cv. Aijiaohuang) using UHPLC-ESI-MS/MS. Molecules 2021, 26, 5825. [Google Scholar] [CrossRef] [PubMed]
  48. Khera, P.S.; Garg, P.K.; Tiwari, S.; Bhargava, N.; Yadav, T.; Sureka, B.; Ghosh, T.; Babu, S.; Dadhich, S.; Singh, S. Retrograde Transvenous Obliteration of Gastric Varices using Sodium Tetradecyl Sulphate: Technical Considerations and Results from a Single Institution Retrospective Study. J. Clin. Interv. Radiol. ISVIR 2021, 6, 10–17. [Google Scholar] [CrossRef]
  49. Zhang, W.; Zhou, X.; Hou, W.; Chen, E.; Ye, C.; Chen, M.; Lu, Q.; Yu, X.; Li, W. Reversing the imbalance in bone homeostasis via sustained release of SIRT-1 agonist to promote bone healing under osteoporotic condition. Bioact. Mater. 2023, 19, 429–443. [Google Scholar] [CrossRef]
  50. Jiang, X.; Yuan, Y.; Shi, M.; Zhang, S.; Sui, M.; Zhou, H. Bu-shen-zhu-yun decoction inhibits granulosa cell apoptosis in rat polycystic ovary syndrome through estrogen receptor α-mediated PI3K/AKT/mTOR pathway. J. Ethnopharmacol. 2022, 288, 114862. [Google Scholar] [CrossRef]
  51. Dunaway, S.; Fleischer, A.B., Jr. Assessing adherence to evidence-based guidelines of care for acne vulgaris. J. Dermatol. Treat. 2022, 33, 138–142. [Google Scholar] [CrossRef]
  52. Ramesh, S.; Khan, S.; Park, Y.; Ford, E.; Menegatti, S.; Genzer, J. Self-healing and repair of fabrics: A comprehensive review of the application toolkit. Mater. Today 2022, 54, 90–109. [Google Scholar] [CrossRef]
  53. Duan, H.; Wang, W.; Li, Y.; Jilany Khan, G.; Chen, Y.; Shen, T.; Bao, N.; Hua, J.; Xue, Z.; Zhai, K.; et al. Identification of phytochemicals and antioxidant activity of Premna microphylla Turcz. stem through UPLC-LTQ-Orbitrap-MS. Food Chem. 2022, 373, 131482. [Google Scholar] [CrossRef] [PubMed]
  54. Tian, M.; Wang, Y.; Lu, A.; Zhang, Q.; Li, X.; Zhang, N.; Zhang, J.; Wang, S. From metabolomic analysis to quality assessment and biosynthetic insight in traditional Chinese medicine: Mulberry tree as a case study. Phytochem. Anal. 2022, 33, 644–653. [Google Scholar] [CrossRef] [PubMed]
  55. Patil, T.V.; Patel, D.K.; Dutta, S.D.; Ganguly, K.; Santra, T.S.; Lim, K.T. Nanocellulose, a versatile platform: From the delivery of active molecules to tissue engineering applications. Bioact. Mater. 2022, 9, 566–589. [Google Scholar] [CrossRef] [PubMed]
  56. Guo, P.; Hu, X. ZIF-derived CoFe2O4/Fe2O3 combined with g-C3N4 as high-efficient photocatalysts for enhanced degradation of levofloxacin in the presence of peroxymonosulfate. J. Alloys Compd. 2022, 914, 165338. [Google Scholar] [CrossRef]
  57. Liu, X.; Wu, M.; Wang, M.; Duan, Y.; Phan, C.U.; Chen, H.; Tang, G.; Liu, B. AIEgen-Lipid Conjugate for Rapid Labeling of Neutrophils and Monitoring of Their Behavior. Angew. Chem. 2021, 133, 3212–3218. [Google Scholar] [CrossRef]
  58. El-Hawwary, S.S.; Saber, F.R.; Abd Almaksoud, H.M.; Elimam, H.; Sayed, A.M.; Abdelmohsen, U.R. Cytotoxic potential of three Sabal species grown in Egypt: A metabolomic and docking-based study. Nat. Product. Res. 2022, 36, 1109–1114. [Google Scholar] [CrossRef]
  59. Ortiz-Alvarez, L.; Xu, H.; Di, X.; Kohler, I.; Osuna-Prieto, F.J.; Acosta, F.M.; Vilchez-Vargas, R.; Link, A.; Plaza-Díaz, J.; van der Stelt, M.; et al. Plasma Levels of Endocannabinoids and Their Analogues Are Related to Specific Fecal Bacterial Genera in Young Adults: Role in Gut Barrier Integrity. Nutrients 2022, 14, 2143. [Google Scholar] [CrossRef]
  60. Choi, H.J.; Naznin, M.; Alam, M.B.; Javed, A.; Alshammari, F.H.; Kim, S.; Lee, S.H. Optimization of the extraction conditions of Nypa fruticans Wurmb. using response surface methodology and artificial neural network. Food Chem. 2022, 381, 132086. [Google Scholar] [CrossRef]
  61. Kumar, J.B.S.; Sharma, B. A review on neuropharmacological role of erucic acid: An omega-9 fatty acid from edible oils. Nutr. Neurosci. 2022, 25, 1041–1055. [Google Scholar] [CrossRef]
  62. Ahmed, A.S.; Diab, H.M.; Alkahtani, M.A.; Alshehri, M.A.; Saber, H.; Badr, H.; Dandrawy, M.K.; El-Mansi, A.A.; Shati, A.A.; Ahmed, A.E. Molecular epidemiology of virulent E. coli among rural small scale dairy herds and shops: Efficacy of selected marine algal extracts and disinfectants. Int. J. Environ. Health Res. 2022, 32, 72–94. [Google Scholar] [CrossRef] [PubMed]
  63. Eldeigdhye, S.M.; Abdelaleem, M.A.; Mater, S.N.A.; Kamal, A.M. The bioprotective role of irradiated hibiscus against harmful effects of using repeatedly frying edible oil. Braz. J. Biol. 2021, 84, e253084. [Google Scholar] [CrossRef] [PubMed]
  64. Chebbi, M.; Beltifa, A.; Alibi, S.; Di Bella, G.; Loturco, V.; Sire, O.; Ben Mansour, H.; Le Tilly, V. Estrogenic hazards of short chain phthalates and bisphenols found in cosmetic products. Int. J. Environ. Health Res. 2022, 32, 252–263. [Google Scholar] [CrossRef] [PubMed]
  65. Moazezi, M.R.; Bayat, H.; Tavakoli, O.; Hallajisani, A. Hydrothermal liquefaction of Chlorella vulgaris and catalytic upgrading of product: Effect of process parameter on bio-oil yield and thermodynamics modeling. Fuel 2022, 318, 123595. [Google Scholar] [CrossRef]
  66. De Lima, R.M.T.; Dos Reis, A.C.; de Oliveira Santos, J.V.; de Oliveira Ferreira, J.R.; de Oliveira Filho, J.W.G.; Dias, A.C.S.; de Menezes, A.-A.P.M.; da Mata, A.M.O.F.; de Alencar, M.V.O.B.; Dos Santos, T.d.J.A. Antitumoral effects of [6]-gingerol [(S)-5-hydroxy-1-(4-hydroxy-3-methoxyphenyl)-3-decanone] in sarcoma 180 cells through cytogenetic mechanisms. Biomed. Pharmacother. 2020, 126, 110004. [Google Scholar] [CrossRef] [PubMed]
  67. Yilmazer-Musa, M.; Griffith, A.M.; Michels, A.J.; Schneider, E.; Frei, B. Grape seed and tea extracts and catechin 3-gallates are potent inhibitors of α-amylase and α-glucosidase activity. J. Agric. Food Chem. 2012, 60, 8924–8929. [Google Scholar] [CrossRef] [PubMed]
  68. Weckwerth, W.; Wenzel, K.; Fiehn, O. Process for the integrated extraction, identification and quantification of metabolites, proteins and RNA to reveal their co-regulation in biochemical networks. Proteomics 2004, 4, 78–83. [Google Scholar] [CrossRef]
  69. Guo, M.; Wu, Z.; An, Q.; Li, H.; Wang, L.; Zheng, Y.; Guo, L.; Zhang, D. Comparison of Volatile Oils and Primary Metabolites of Raw and Honey-Processed Ephedrae Herba by GC–MS and Chemometrics. J. AOAC Int. 2022, 105, 576–586. [Google Scholar] [CrossRef]
  70. Biswas, A.; Dey, S.; Xiao, A.; Huang, S.; Birhanie, Z.M.; Deng, Y.; Liu, L.; Li, D. Phytochemical content and antioxidant activity of different anatomical parts of Corchorus olitorius and C. capsularis during different phenological stages. Heliyon 2023, 9, e16494. [Google Scholar] [CrossRef]
  71. Guo, W.; Xiao, Y.; Fu, X.; Long, Z.; Wu, Y.; Lin, Q.; Ren, K.; Jiang, L. Identification of novel α-glucosidase and ACE inhibitory peptides from Douchi using peptidomics approach and molecular docking. Food Chem. X 2023, 19, 100779. [Google Scholar] [CrossRef]
Figure 1. Representative GC-MS chromatograms of trimethylsilyl (TMS) derivatives of primary metabolites from mulberry leaves (MLs).
Molecules 29 00171 g001
Figure 2. The primary metabolites in MLs at different growth stages based on GC-MS. (a): PCA score plots; (b): OPLS-DA score plots. In these plots, samples from the first growth stage are highlighted in green, those from the second growth stage are shown in blue, and those from the third growth stage are marked in red. (c) Cluster analysis.
Molecules 29 00171 g002
Figure 3. Total ion flow diagram of MLs obtained by HPLC-QTOF-MS in positive ion mode.
Molecules 29 00171 g003
Figure 4. Molecular networking diagrams of MLs at different growth stages.
Molecules 29 00171 g004
Figure 5. The secondary metabolites in MLs at different growth stages analyzed by HPLC-QTOF-MS. (a): PCA score plots; (b): OPLS-DA score plots. In these plots, samples from the first growth stage are highlighted in green, those from the second growth stage are shown in blue, and those from the third growth stage are marked in red). (c): Cluster analysis.
Molecules 29 00171 g005
Figure 6. HPLC chromatogram of 27 batches of MLs. 1. Mulberroside A; 2. Chlorogenic acid; 3. Cryptochlorogenic acid; 4. Rutin; 5. Isoquercitrin; 6. Oxidized resveratrol.
Molecules 29 00171 g006
Figure 7. Changes in six compounds in MLs at different growth stages.
Molecules 29 00171 g007
Figure 8. Antioxidant activity changes of MLs at different growth stages: (A) IC50 of DPPH free radicals; (B) IC50 of hydroxyl radicals; (C) IC50 of ABTS free radicals.
Molecules 29 00171 g008
Figure 9. IC50 of α-Glucosidase in MLs at different growth periods.
Molecules 29 00171 g009
Table 1. Identification of silylated primary metabolites from MLs by GC-MS.
No.tR/minMetabolite Namem/zMolecular Formula
13.976Liactic Acid, 2TMS derivative219.1C9H22O3Si2
24.096Glycolic acid, 2TMS derivative218.1C8H20O3Si2
34.215L-Valine, TMS derivative217C8H19NO2Si
44.355L-Alanine, 2TMS derivative232.1C9H23NO2Si2
54.744Hydracrylic acid, 2TMS derivative235.1C9H22O3Si2
65.445Propanedioic acid, 2TMS derivative248.1C9H20O4Si2
75.626Valine, 2TMS derivative246.1C11H27NO2Si2
85.823Urea, 2TMS derivative233.1C7H20N2OSi2
96.316Ethanolamine, 3TMS derivative262.1C11H31NOSi3
106.415Glycerol, 3TMS derivative314.11C12H32O3Si3
116.669Niacin, TMS derivative301C9H13NO2Si
126.778L-Proline, 2TMS derivative314.1C11H25NO2Si2
136.944Butanedioic acid, 2TMS derivative299C10H22O4Si2
147.313Glyceric acid, 3TMS derivative322.1C12H30O4Si3
157.4522-Butenedioic acid (E)-, 2TMS derivative299C10H20O4Si2
167.805Serine, 3TMS derivative306.1C12H31NO3Si3
178.288L-Threonine, 3TMS derivative320.1C13H33NO3Si3
188.407Ethanolamine, 3TMS derivative299C11H31NOSi3
198.952Beta-Alanine, 3TMS derivative299.1C12H31NO2Si3
2010.265Malic acid, 3TMS derivative350.1C13H30O5Si3
2110.924Pipecolic acid, 2TMS derivative258.1C12H27NO2Si2
2211.0954-Aminobutanoic acid, 3TMS de rivative332.1C13H33NO2Si3
2312.8495-Hydroxypipecolic acid, 3TMS derivative360.2C15H35NO3Si3
2413.352L-Glutamic acid, 3TMS derivative363.11C14H33NO4Si3
2513.430L-Phenylalanine, 2TMS derivative331.1C15H27NO2Si2
2614.748Asparagine, 3TMS derivative348.2C13H32N2O3Si3
2715.791D-Lyxose, 4TMS derivative333.2C17H42O5Si4
2817.088Glycerol, 3TMS derivative394.2C12H32O3Si3
2918.899Shikimic acid, 4TMS derivative462.2C19H42O5Si4
3019.200Citric acid, 4TMS derivative465.2C18H40O7Si4
3120.606Quininic acid, 5TMS derivative462.2C22H52O6Si5
3221.087Alloxanic acid, 4TMS derivative446.2C16H36N2O5Si4
3322.303Methyl-α-Lyxofuranoside, 3TMS derivative446.3C15H36O5Si3
3425.032Palmitic Acid, TMS derivative456.1C19H40O2Si
3527.237Myo-Inositol, 6TMS derivative432.2C24H60O6Si6
3628.545Galactose oxime, 6TMS derivative319.2C24H61NO6Si6
3729.676Tryptophan, 4TMS derivative337.2C23H44N2O2Si4
3829.873Oleic Acid (Z)-, TMS derivative354.3C21H42O2Si
3930.340L-Rhamnose, 4TMS derivative361.2C18H44O5Si4
4030.605Stearic acid, TMS derivative356.3C21H44O2Si
4134.0812-O-Glycerol-α-d-galactopyranoside, hexa-, TMS361.2C27H66O8Si6
4238.689Ethyl-α-d-glucopyranoside, 4TMS derivative439.2C20H48O6Si4
4339.2751-Monopalmitin, 2TMS derivative459.3C25H54O4Si2
4441.268Sucrose, 8TMS derivative481.3C36H86O11Si8
4541.729Lactose, 8TMS derivative450.2C36H86O11Si8
4643.275Glycerol monostearate, 2TMS derivative487.3C27H58O4Si2
Table 2. Information on 70 compounds in MLs identified by HPLC-Q-TOF-MS.
No.tR/minPrecursor Ion TypePrecursor Ion (m/z)FormulaFragment Ions (m/z)IdentificationRef.
11.06[M + H]+175.1189C6H14N4O2130.0973, 116.0701, 70.0651, 60.0556Arginine[21,24]
21.079[M + H]+164.0916C6H13NO4146.0803, 128.0703, 110.0596, 82.0651, 80.0495, 69.03351-Deoxynojirimycin (1-DNJ)[21,24,23]
31.089[M + H]+156.0420C6H9N3O2110.0715, 93.0440, 82.0261Histidine[21,24]
41.172[M + H]+146.0810C6H11NO3128.0701, 100.0755N-isobutyrylglycine[21]
51.179[M + NH4]+360.1504C12H22O11101.0232, 71.0491Sucrose[25]
61.202[M + H]+116.0707C5H9NO2116.0706, 70.0652Proline[21,24]
71.22[M + H]+137.9750C7H7NO2138.0546, 94.0650, 92.0492, 78.0336Trigonelline[26]
81.31[M + H]+314.0920C11H15N5O4S164.0565, 136.0618, 97.0248(S)-5′-Deoxy-5′-(methylsulfinyl)adenosine[27]
91.308[M + H]+358.1498C16H20O9196.0965, 178.0859, 150.0906Gentiopicroside[28]
101.375[M + H]+268.1043C10H13N5O4137.0646, 136.0617Adenosine[29]
111.463[M + H]+132.1018C6H13NO286.0964, 69.0697Isoleucine[21,24]
121.82[M + H]+284.0989C10H13N5O5286.1451, 154.0846, 153.0584, 152.514Guanosine[30]
131.887[M + H]+287.1102C13H18O7107.0296Salicin[31]
142.413[M + H]+166.0862C9H11NO2103.0539, 121.0842, 120.0805, 107.0494Phenylalanine[24]
152.477[M + H]+120.0809C4H9NO3119.0705, 102.0116, 84.9590, 75.9350l-Threonine[21]
162.536[M + H]+220.1177C9H17NO5184.0949, 116.0323, 90.0548Pantothenic acid[21]
173.431[M + K]+367.1500C19H20O5131.0680, 103.0388Hirsutanone[32]
183.452[M + H]+298.0964C11H15N5O3S163.0414, 145.0314, 136.0615Vitamin L2[21]
194.08[M + H]+205.0973C11H12N2O2188.07606, 159.0917, 146.0599, 144.0808Tryptophan[24]
204.25[M + H]+341.0867C15H16O9180.0373, 179.0336, 133.0874Esculin[21]
214.446[M + H]+325.0920C15H16O8164.0425, 163.0387, 107.0494Skimmin[33]
224.816[M − H]+194.1150C10H12O4195.1212, 136.0472, 135.0435, 59.07143-(4-Hydroxy-3-methoxyphenyl) propionic acid[34]
234.999[M + H]+627.1554C27H30O17466.1064, 465.1033, 304.0536, 303.0498, 85.0281Quercetin 3,4′-diglucoside[23]
245.08[M + H]+773.2125C33H40O21465.1025, 304.0517, 303.0489, 85.0275Quercetin-3-O-rutinoside-7-O-glucoside[23]
255.11[M + H]+467.1174C20H20O13154.0219, 153.0171Ginnalin A[35]
265.189[M + H]+355.1027C16H18O9163.0388, 145.0281, 135.0438, 117.0334Chlorogenic acid[21,36]
275.276[M + NH4]+344.1340C15H18O8165.0538, 119.0482, 91.0407E-4-O-β-d-glucopyranosyl-p-coumaric acid[37]
285.575[M + H-H2O]+518.1870C25H28O13148.0472, 147.0435, 119.0484, 91.0531Vaccinoside[38]
295.74[M + NH4]+288.1400C13H18O6213.0523, 138.9628Benzyl beta-d-glucopyranoside[39]
305.983[M + H]+713.1558C30H32O20551.1035, 465.1018, 303.0498Quercetin 3-O-(6″-malonyl-glucoside) 7-O-glucoside[21,23]
317.27[M + H]+611.1604C27H31O16+615.1748, 613.1666, 612.1619, 611.1609Cyanin[27]
327.298[M + H]+339.1070C16H18O8148.0469, 147.0438, 120.0520, 119.0487, 91.05334-p-Coumaroylquinic acid[40]
337.46[M + H]+697.1603C30H32O19697.1054, 449.1069, 288.0577, 287.0547Kaempferol hexoside malonyl hexoside[21,23]
348.349[M + H]+757.2164C33H40O20611.1635, 465.0997, 303.0492Quercetin-3-O-rutinoside-7-Orhamnoside[21,23]
358.36[M + H]+757.2164C34H42O1985.0281, 71.0344Oxytroflavoside G[41]
368.377[M + NH4]+434.2020C19H28O10145.0479, 133.0550, 115.0369, 97.0284, 85.0279Sayaendoside[42]
378.41[M + H]+303.0500C15H10O7257.0420, 229.0490, 165.0149, 153.0172, 137.0226Quercetin[21,22]
389.457[M + H]+180.1017C12H21N180.1023, 163.0960, 135.1002, 121.0835Memantine[43]
399.73[M + H]+611.1600C27H30O16465.9610, 303.0491Quercetin 3-O-rutinoside (rutin)[21,44]
4011.741[M + H]+465.1206C21H20O12305.0577, 304.0529, 303.0492Isoquercitin[22]
4113.02[M + H]+373.2220C19H32O7135.1148, 109.1007Byzantionoside B[45]
4213.048[M + H]+595.1604C27H30O15287.0547, 129.0562, 127.0406, 85.0299, 71.0488Kaempferol-3-O-rutinoside[23]
4313.084[M + H]+595.1649C27H30O15287.0535, 129.0521, 127.0404, 85.0274, 71.0489Nicotiflorin[23]
4413.151[M + H]+551.1207C24H22O15304.0525, 303.0491, 159.0282, 127.0382, 109.0280Quercetin 3-O-6′-malonylglucoside[19,46]
4514.04[M + H]+287.0548C15H10O6213.0570, 165.0185, 153.01732, 121.0267Kaempferol[21]
4614.045[M + H]+449.1079C21H20O11451.3095, 289.0580, 288.0580, 287.0545Kaempferol 3-O-glucoside (astragalin)[21,23,44]
4714.809[M + H]+507.1124C23H22O13507.3026, 303.0493Quercetin 3-(6″-O-acetylgalactoside)[47]
4816.012[M + H]+535.1080C24H22O14289.0606, 288.0571, 287.0544Kaempferol malonyl hexoside[23]
4920.35[M + H]+316.3207C14H29NaO4S319.1866, 317.3239, 316.3207, 106.0861Sodium tetradecyl sulfate[48]
5020.81[M + Na]+264.2320C14H8O4203.1431Alizarin[49]
5121.11[M + H]+361.1389C21H28O5361.1395, 344.1892, 325.1344, 307.1182Prednisolone[23]
5221.66[M + H]+291.1953C19H30O2273.1829, 161.1278, 147.1172Epiandrosterone[50]
5322.22[M + K]+225.5670C9H16O4125.0944, 123.1161, 97.1005Azelaic acid[51]
5422.277[M + H]+274.2741C16H35NO2274.2740, 256.2633N-Lauryldiethanolamine[52]
5524.615M + ACN + H432.2378C22H30O6135.0799, 119.0852, 107.0861Prostratin[53]
5625.95[M + H]+423.1803C25H26O6423.1795, 311.0543, 241.0496Mulberrin[54]
5726.139[M + H]+302.3051C18H39NO2302.2048, 284.2936, 106.0851, 102.0911, 88.0755Tetradecyldiethanolamine[55]
5826.216[M + H]+302.3053C18H39NO2302.3050, 284.2935, 106.0861, 88.0752Ethanol, 2,2′-(tetradecylimino)bis-[56]
5931.35[M + H]+496.3389C24H50NO7P478.3274, 258.1112, 184.07261-Palmitoyl-sn-glycero-3-phosphocholine[57]
6033.871[M + H]+317.1800C14H29NaO4S317.3232, 106.0857Sodium myristyl sulfate[58]
6134.09[M + H]+322.2739C20H35NO2322.2739, 261.2212, 243.2112α-Linolenoyl ethanolamide[59]
6234.23[M + H]+421.1640C25H24O6365.1019, 323.0605Kuwanon A[54,60]
6334.27[M + H]+326.2687C20H39NO2326.3762, 310.0664N-oleoylethanolamine[61]
6434.814[M + K]+470.4199C21H20O10283.1673Isovitexin[58]
6534.99[M + H]+407.1852C25H26O5283.0596, 255.0648Rubraflavone A[55]
6636.10[M + H]+403.2328C20H34O8259.1531, 157.0129, 185.0806, 139.0022, 129.0180Tributyl acetylcitrate[62]
6736.95[M +H]+282.2790C18H34O269.0698, 57.0307, 55.0540cis-Octadecenoic acid[63]
6838.90[M + H]+391.2838C24H38O4167.0331, 149.0230, 71.0854, 57.0698Bis(2-ethylhexyl) phthalate[64]
6939.363[M + H]+284.2942C18H37NO285.2801, 284.2927N,N-dimethylpalmitamide[65]
7039.47[M + H]+352.3200C21H34O4177.1252, 137.09335-hydroxy-1-(4-hydroxy-3-methoxyphenyl) tetradecan-3-one[66]
Table 3. Calibration plots for the six compounds.
CompoundLinearity Range (mg/mL)Calibration EquationCorrelation Factor (r)
Mulberroside A0.0003~0.006y = 5,921,740.33 x + 467.35 0.9995
Chlorogenic acid 0.00295~0.0944y = 9,556,420.73 x + 3459.11 0.9998
Cryptochlorogenic acid0.001~0.032y = 10,673,897.94 x + 641.53 0.9999
Rutin0.00215~0.086y = 16,281,522.08 x − 332.238 0.9999
Isoquercitrin0.0016~0.064y = 27,860,160.12 x − 666.51 0.9999
Oxidized resveratrol0.0013~0.052y = 15,236,962.42 x − 989.82 0.9999
Table 4. The collected dates information for 27 batches of MLs.
No.Collecting TimeNo.Collecting Time
Y113 April 2018Y1523 August 2018
Y220 April 2018Y161 September 2018
Y327 April 2018Y178 September 2018
Y44 May 2018Y1815 September 2018
Y511 May 2018Y1921 September 2018
Y625 May 2018Y2028 September 2018
Y71 June 2018Y215 October 2018
Y88 June 2018Y2211 October 2018
Y922 June 2018Y2318 October 2018
Y106 July 2018Y2429 October 2018
Y1113 July 2018Y253 November 2018
Y1223 July 2018Y269 November 2018
Y131 August 2018Y2715 November 2018
Y148 August 2018
Disclaimer/Publisher’s Note: The statements, opinions and data contained in all publications are solely those of the individual author(s) and contributor(s) and not of MDPI and/or the editor(s). MDPI and/or the editor(s) disclaim responsibility for any injury to people or property resulting from any ideas, methods, instructions or products referred to in the content.

