Article

The Influence of the Side Chain Structure on the Photostability of Low Band Gap Polymers

1
Institut für Physikalische und Theoretische Chemie, Eberhard Karls Universität Tübingen, Auf der Morgenstelle 18, 72076 Tübingen, Germany
2
Makromolekulare Chemie (buwMakro) und Wuppertal Center for Smart Materials and Systems (CM@S), Bergische Universität Wuppertal, Gaussstrasse 20, 42119 Wuppertal, Germany
*
Author to whom correspondence should be addressed.
Molecules 2023, 28(9), 3858; https://doi.org/10.3390/molecules28093858
Submission received: 23 March 2023 / Revised: 17 April 2023 / Accepted: 27 April 2023 / Published: 3 May 2023

Abstract

:
Side chains play an important role in the photo-oxidation process of low band gap (LBG) polymers. For example, it has been shown that their photostability can be increased by the introduction of aromatic-oxy-alkyl links. We studied the photostability of prototypical LBG polymers with alkyl and oxyalkyl side chains during irradiation with white light (AM 1.5 conditions) in dry air using UV/vis and IR spectroscopy. Though its degradation kinetics were distinctly affected by the presence or absence of oxygen in the structure of the side chains, in particular cases, the stability was more affected by the presence of linear or branched side chains. Moreover, we showed that the exact position of the alkyl/oxyalkyl side chain at the polymer backbone could be crucial. Although minor effects of chemical modifications on the electronic parameters (ionization potential and gap) were observed, the molecular orientation, determined by polarization modulation-infrared reflection-absorption spectroscopy (PMIRRAS), could be affected. The aggregation and crystallinity of these polymers may distinctly affect their stability.

Graphical Abstract

1. Introduction

Low band gap (LBG) polymers have attracted huge attention for their applications in the field of polymer-based organic solar cells (OSCs) and other opto-electronic devices [1,2,3,4,5]. In this context, the photostability of conjugated polymers has been increasingly studied over the past years [1,6,7,8,9,10,11,12,13]. In view of these applications, a balance of efficiency, cost, and stability is needed [14,15].
For example, through intensive study of the photooxidation mechanism of poly-3-hexylthiophen (P3HT), two different pathways have been intensely discussed: photosensitization (most likely including the formation of singlet oxygen) and a radical chain mechanism [12,16,17,18]. The rate of this radical mechanism strongly increases towards UV light [19]. In solution, it was shown that singlet oxygen can attack the π-electron system of the P3HT backbone via cycloaddition [20,21], and superoxide radical anions were detected [22]. However, such a mechanism may depend distinctly on the detailed chemical structure of the polymer [7]. Less often, the role of side chains in the photooxidation process of polymers has been discussed [23,24,25]. For example, it has been predicted that the introduction of aromatic-oxy-alkyl links makes materials more resistant to photooxidative degradation by reducing hydrogen abstraction [26,27]. Additionally, the branching point of the side chains can play an important role, affecting the crosslinking under oxygen-free conditions [28]. Thus, side chains seem to play an important role in the understanding of the structure–property relationships impacting the photostability of conjugated materials.
In the present study, we investigate the photostability of prototypical low band gap polymers with different side chains. The studied polymers are shown in Figure 1. Due to their structural relations, they might be separated into two groups: the first group contains copolymers consisting of a backbone with cyclopentadithiophene–benzothiadiazole and thiophene moieties; its side chains are alkyl (1a/1b) or alkoxy (2a/2b) at varying positions (cf. 1a/2a or 1b/2b). The backbone of the second group consists of benzodithiophene (BDT) and fluorinated benzothiadiazole (BT) moieties, connected via thiophene units with branched (3a/3b) or linear (3c) side chains. Either branched alkyl (3a) or alkoxy (3b/3c) side chains are attached at the BDT moieties.

2. Results and Discussion

2.1. Electronic Structure and Molecular Orientation

Both the electronic structure, molecular ordering, and orientation of polymers may distinctly affect their stability. For example, it has been reported that a lowering of the highest occupied molecular orbital (HOMO) increases their resistance towards chemical oxidation [13]. Their molecular packing and arrangement significantly affect their photooxidative stability; [29] probably the best known example for the influence of ordering and morphology on their stability is the regioregularity of P3HT [16,30]. Moreover, these properties distinctly affect the device properties.
In this chapter, we will focus on the basic electronic parameters and orientations of polymers 3 (cf. Figure 1), and for the corresponding results for the other polymers, we refer to Ref. [31]. For the investigation into the electronic (interface) properties of a few nm thick films, two substrates with different work functions were chosen (PEI Φ = 3.3 eV and gold Φ = 5.2 ± 0.1 eV). The work function of the organic thin films on these substrates (Φorg), the interface dipoles Δ, and the ionization potential IP (Φorg + onset of the HOMO) are summarized in Table 1. We note that, in the case of a pinning regime, Φorg can be interpreted as the “integer charge transfer level” (see, e.g., Refs. [31,32] for polymers 1 and 2). Most importantly, the structural variations in the three polymers have only a small effect on the investigated electronic (interface) properties. Additionally, the changes in the optical gap ( E g o p t ) in Table 1, determined by ultraviolet–visible (UV/vis) spectroscopy and a Tauc plot, are rather minor. All the experimental data from the ultraviolet photoelectron spectroscopy (UPS) and UV/vis are shown in Figures S1 and S2 (Supplementary Materials). Thus, the influence of these electronic properties is most likely negligible regarding the photostability of polymers 3. In the cases of polymers 1 and 2, the changes are mostly related to the optical gap (1.43–1.94 eV), which will be discussed in context of the degradation behavior below.
A measure of the aggregation of the polymers in thin films might be the orientation of the molecular backbone with respect to the substrate surface. We determined the molecular orientation of polymers 3 using polarization modulation-infrared reflection-absorption spectroscopy (PMIRRAS, spectra are shown in Figure S3 in the Supplementary Materials). The data analysis was performed following the approach of Debe [33]. The method was based on the utilization of the surface selection rules of particular vibration bands near to a metal surface (e.g., Refs. [34,35,36,37]). For details on the application of this method to the polymer films, we referred to the literature [31,37]. For the analysis of the orientation vibrations at 1486, 1361 (1379 for 3a) and 854 cm−1 were used. The assignment of the vibrations using DFT is summarized in Table S1 (Supplementary Materials). The angles between the polymer backbone and the sample surface were obtained from the Euler angles of the molecule’s internal cartesian coordinates, with respect to the surface normal, calculated according to Equations (S1) and (S2) (Supplementary Materials). The data in Table 2 reveal that the backbones of polymers 3 were preferably oriented parallel to the substrate surface, and the largest average tilt angle was observed for polymer 3c. Changes in the orientation due to subsequent annealing, as is often performed to increase the degree of ordering, were almost negligible. Very similar average tilt angles (about 20°) were recently observed for polymers 1 and 2 [31]. Only for polymer 1b was the average tilt angle significantly increased (34°) [31], which may point to a higher degree of disorder.
Comparing polymers 3 only, the orientation of the backbone was almost identical for 3a and 3b, and somewhat different for 3c. This indicated a different molecular arrangement in the thin films, which may affect their photooxidation behavior. We note, however, that we have only considered the orientation of the polymer backbone. A possible influence of the conformation of the side chains will be discussed in the next section.

2.2. Photostability of the Investigated Low Band Gap Polymers

First, the photooxidation kinetics of all the polymer films were monitored using UV/vis absorption spectroscopy. As a consequence of the irreversible degradation of the π-conjugated system, a loss of absorbance in the UV/vis was observed. Since environmental factors (e.g., humidity and air) may have a significant influence on these degradation kinetics [10,16], all the experiments were performed in dry synthetic air under AM 1.5 conditions.
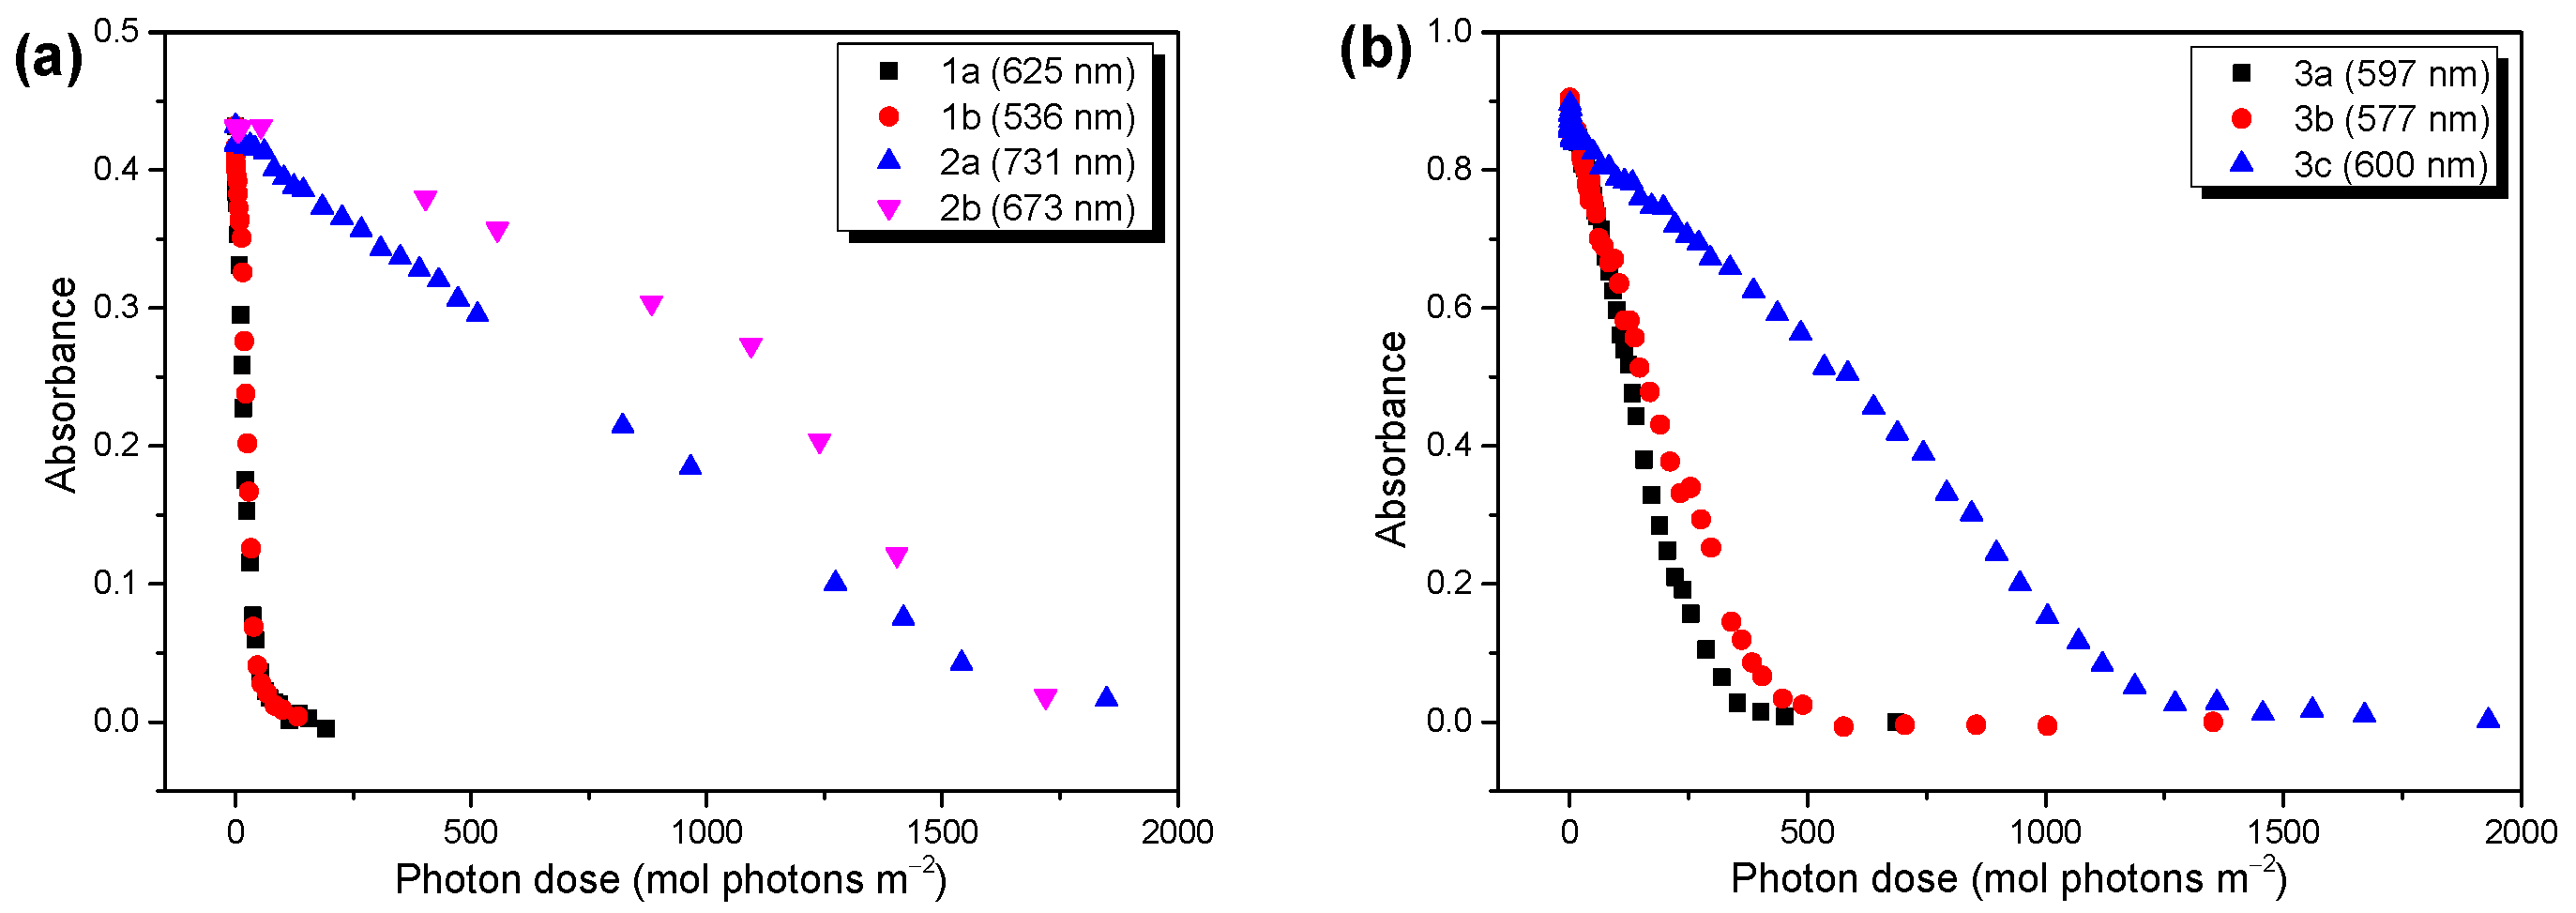
The developments of the UV/vis spectra as functions of the illumination time are summarized in Figure S4 (Supplementary Materials) for all the polymers. The UV/vis spectra of polymers 3 before degradation showed a distinct broadening with respect to the solution spectra (Figures S2 and S4, both Supplementary Materials), which can be attributed to the occurence of aggregation bands, as also observed for related (co)polymers [7,38]. The different aggregation properties of polymer 3c might be also affected by its distinctly higher molecular weight compared to the other polymers (cf. section Materials and Methods). Therefore, the decay kinetics were not evaluated from the lowest lying features, but from the development of the absorbance maxima. The photon dose was calculated from the time trace by multiplying the intensity of the solar simulator, calibrated with a reference solar cell, by the time of irradiation. The trends of the absorbance as functions of the photon dose are summarized in Figure 2. Clearly visible, the radically different decay kinetic for polymers 1a and 1b compared to 2a and 2b are shown in Figure 2a. The differences in the average decay rates, extracted from the linear fits of the data, were huge (7.9 × 10⁻³ and 8.6 × 10⁻³ (mol photons m−3)−1 for 1a and 1b, and 2.4 × 10⁻⁴ and 2.1 × 10⁻⁴ (mol photons m−3)−1 for 2a and 2b). This trend followed the expected behavior very nicely, which predicted an increased photostability for the low band gap polymers with alkoxy side groups [26]. Additionally, for polymers 3a, 3b, and 3c, different decay kinetics are observed in Figure 2b. However, in these cases, the introduction of oxygen to the side chain structure did not increase the photostability significantly, and polymers 3a (alkyl) and 3b (alkoxy) showed similar decay rates. The reaction rates, obtained from the linear fits (Figure S5, Supplementary Materials), were 2.9 × 10⁻³ and 2.1 × 10⁻³ (mol photons m−3)−1 for polymers 3a and 3b, respectively. In contrast, the average decay rate of polymer 3c, which deviated from 3b via the linear side chain at the thiophene moiety, was about three times slower compared to 3a and 3b (reaction rate 6.8 × 10⁻⁴ (mol photons m−3)−1). The reasons for the apparently surprising behavior of polymers 3 are discussed in the following sections. We also note that the electronic parameters mentioned above were not essential for the large observed differences in the degradation behavior.
Valuable information about the degradation mechanism can be gained from the infrared (IR) spectroscopy. First, we will compare the development of the (non-volatile) reaction products in the carbonyl region as a function of the irradiation time. In Figure 3, we show the typical IR spectra for the three polymers (3a, 3b, 3c) at medium degradation times.
The spectra in Figure 3 can be described by four components. For the peak fit, a Lorentzian line profile was assumed. The absorbances of these carbonyl components at the different stages of photooxidation are summarized in Figure S6 (Supplementary Materials). All the spectra exhibit main (most intense) bands at 1726–1729 cm−1 (blue curves) and 1696–1703 cm−1 (green curves). At these wavenumbers, a broad variety of different carbonyl and aldehyde species is found [19,39]. Additionally, in the region of the red component in Figure 3 (1654–1662 cm−1), carbonyl species were expected [19]. The component at the highest wavenumber (~1776 cm−1, cyan curve) might be assigned to a peracid, perester [40], or anhydride [12] species. This component was strongest for polymer 3a (alkyl group at the BDT moiety) and less pronounced for 3b and 3c, with alkoxy groups at the BDT unit. This may indicate that a mechanism including an organic peroxide group was mainly present for polymer 3a (where a formation of peroxy compounds at the BDT might be possible), whereas alternative mechanisms determined the photooxidation of polymers 3b and 3c. For the BDT moieties with alkyl chains (like polymer 3a), a mechanism via peroxide formation at the aromatic ring was proposed in the literature [41]. Another striking difference in the composition of the carbonyl species for polymer 3a and polymers 3b and 3c was the appearance of the component at the lowest wavenumbers (red curve in Figure 3). In former studies on P3HT photooxidation, a component at similar wavenumbers was assigned to a carbonyl species attached directly to the thiophene ring, formed after chain scission [40,42]. One might speculate that such a mechanism is especially important for the photooxidation of polymers 3b and 3c.
We note that the reaction products of polymers 1 and 2 also exhibited different compositions, dependent on the presence of alkyl- or alkoxy- groups (Figure S7, Supplementary Materials, for intermediate degradation times). The species at the lowest wave numbers (red) were the main features in the carbonyl spectra of polymers 1, but were minor for polymers 2. In this case, the different photooxidation reaction rates of polymers 1 and 2 could be related to the different degradation products and thus degradation mechanisms. In contrast, upon comparing polymers 3b and 3c, their different reaction rates were not associated with the different compositions of the reaction products, indicating that the mechanism did not determine the photooxidation rate in this case.
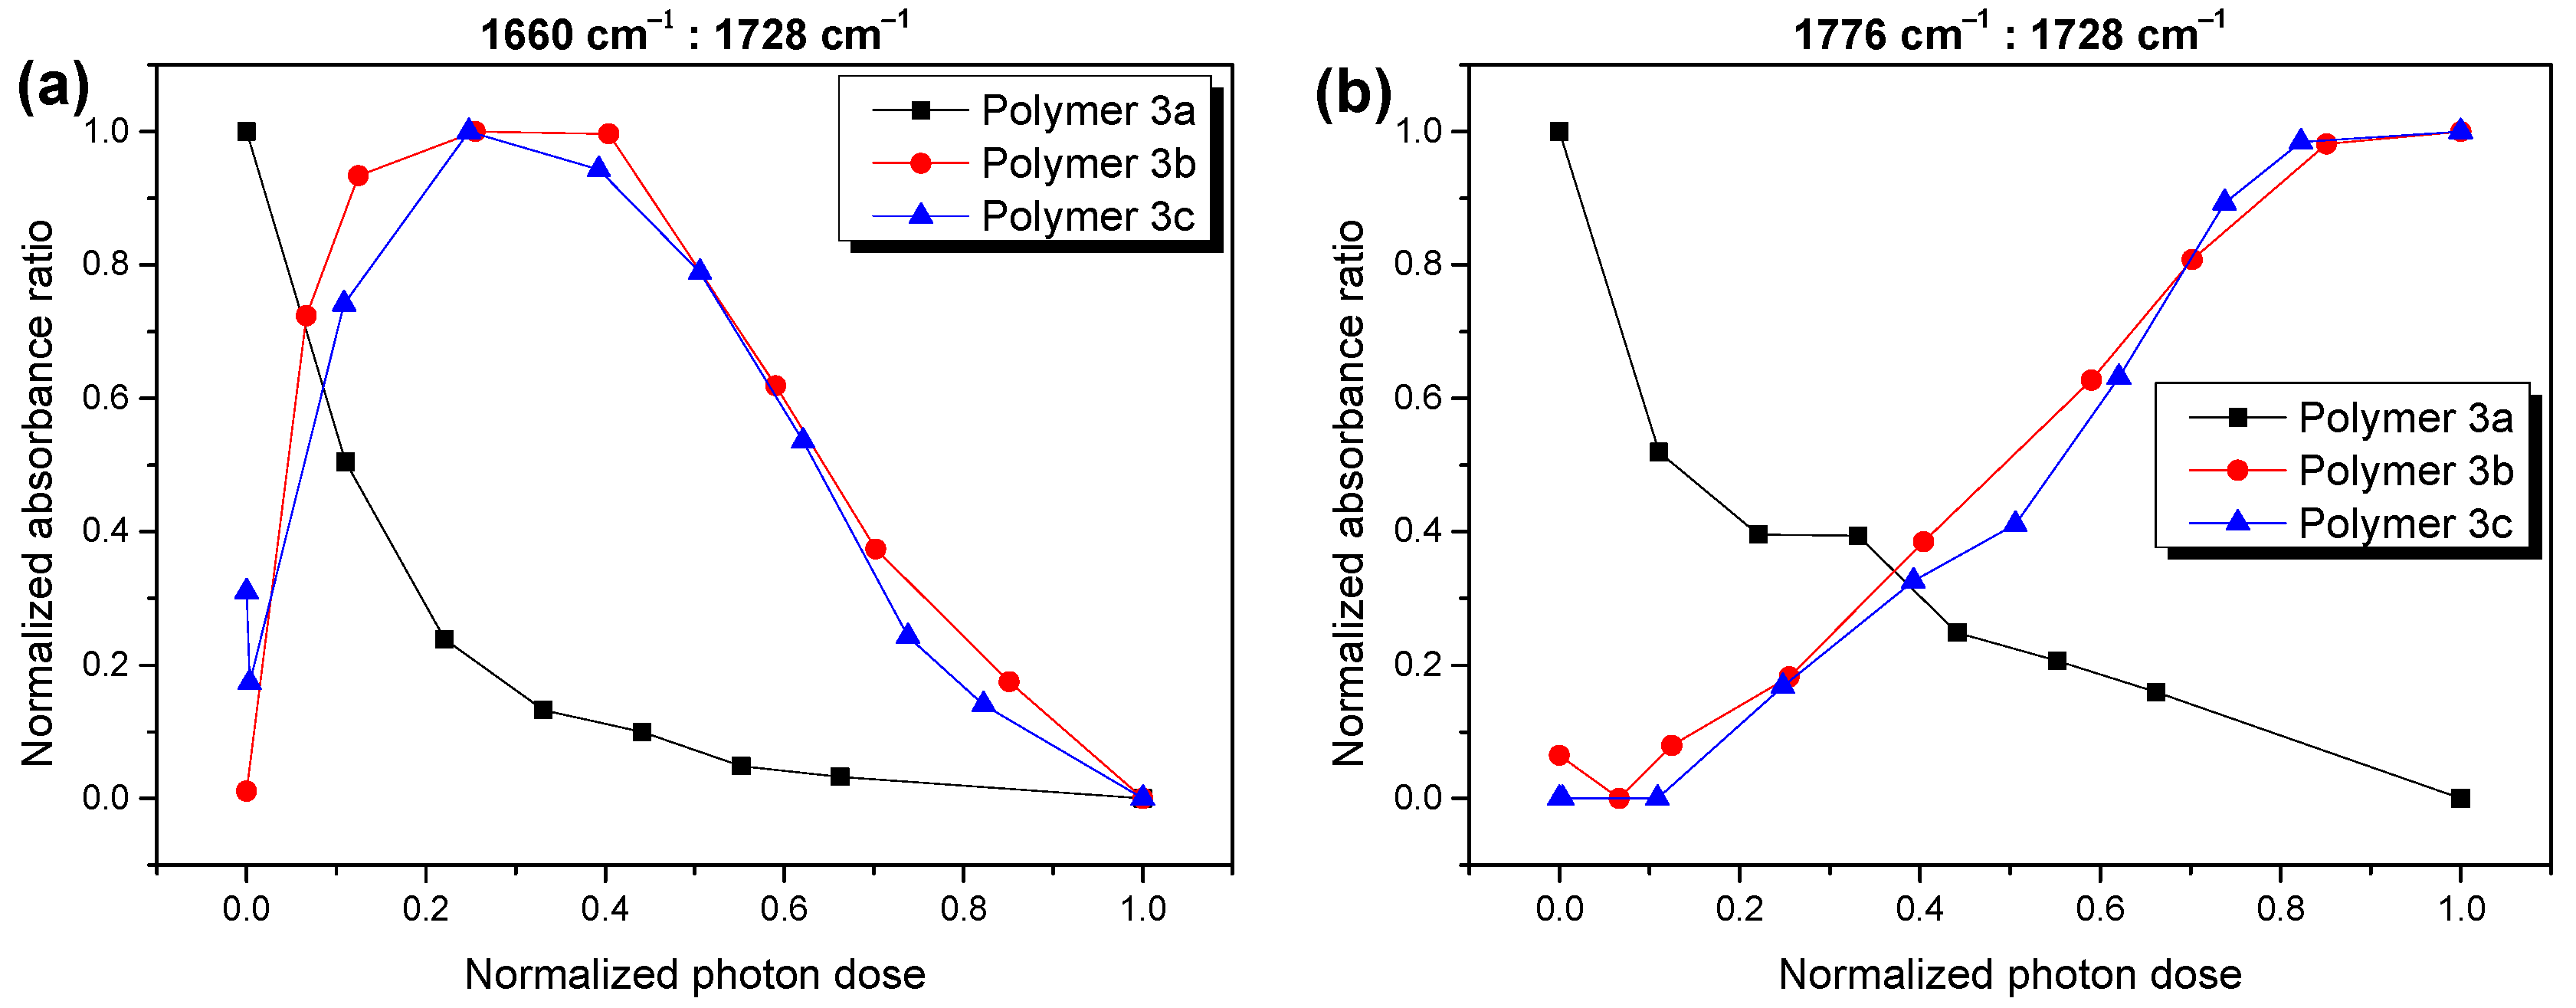
The different behavior of polymer 3a on the one hand and 3b,c on the other hand is even better for a visible analysis of the ratio of the different reaction products during the different stages of the photooxidation. In Figure 4, we compare the absorbance of the components at the lowest and highest wavenumbers (red and cyan curves in Figure 3), relative to the main component at 1726–1729 cm−1 (blue curves in Figure 3) for polymers 3a,b,c. Although a continuous decrease in the relative absorbance for both components with an increasing degradation time was observed for polymer 3a (black curves in Figure 4), the behavior was radically different for the cases of polymers 3b,c. In the latter case, these components formed an essential part in the composition of the reaction products at the advanced stages of the photooxidation. These observations confirm that the mechanism of photooxidation was significantly different for polymer 3a compared to 3b and 3c.
The different photooxidation behaviors of the alkyl chains and backbones of polymers 3a and 3b,c should also be reflected in the trends of the absorbance of the specific vibrations. In Figure 5, we have evaluated the vibrational bands representing the backbones (1486 cm−1, cf. Table S1, Supplementary Materials) and asymmetric CH2 vibrations (2925 cm-1). In addition, the integrated absorbance in the carbonyl region and the UV/vis absorbance at the maximum was added.
The trend of the backbone-related vibration absorbance followed well the trend of the UV/vis absorbance for all three polymers. This could be expected, since an attack on the backbone could cause the destruction of the π-conjugated system, upon which the orbitals involved in the UV/vis transitions were located. The most significant difference in the behavior of the three polymer was the apparent delay of the decrease in the absorbance of the CH2-related vibrations with respect to the backbone. This delay was strongest for polymers 3a and 3b and less pronounced for polymer 3c. Vice versa, the backbone of polymer 3c was more stable, although the chemical structure of the backbone was the same for all three polymers.
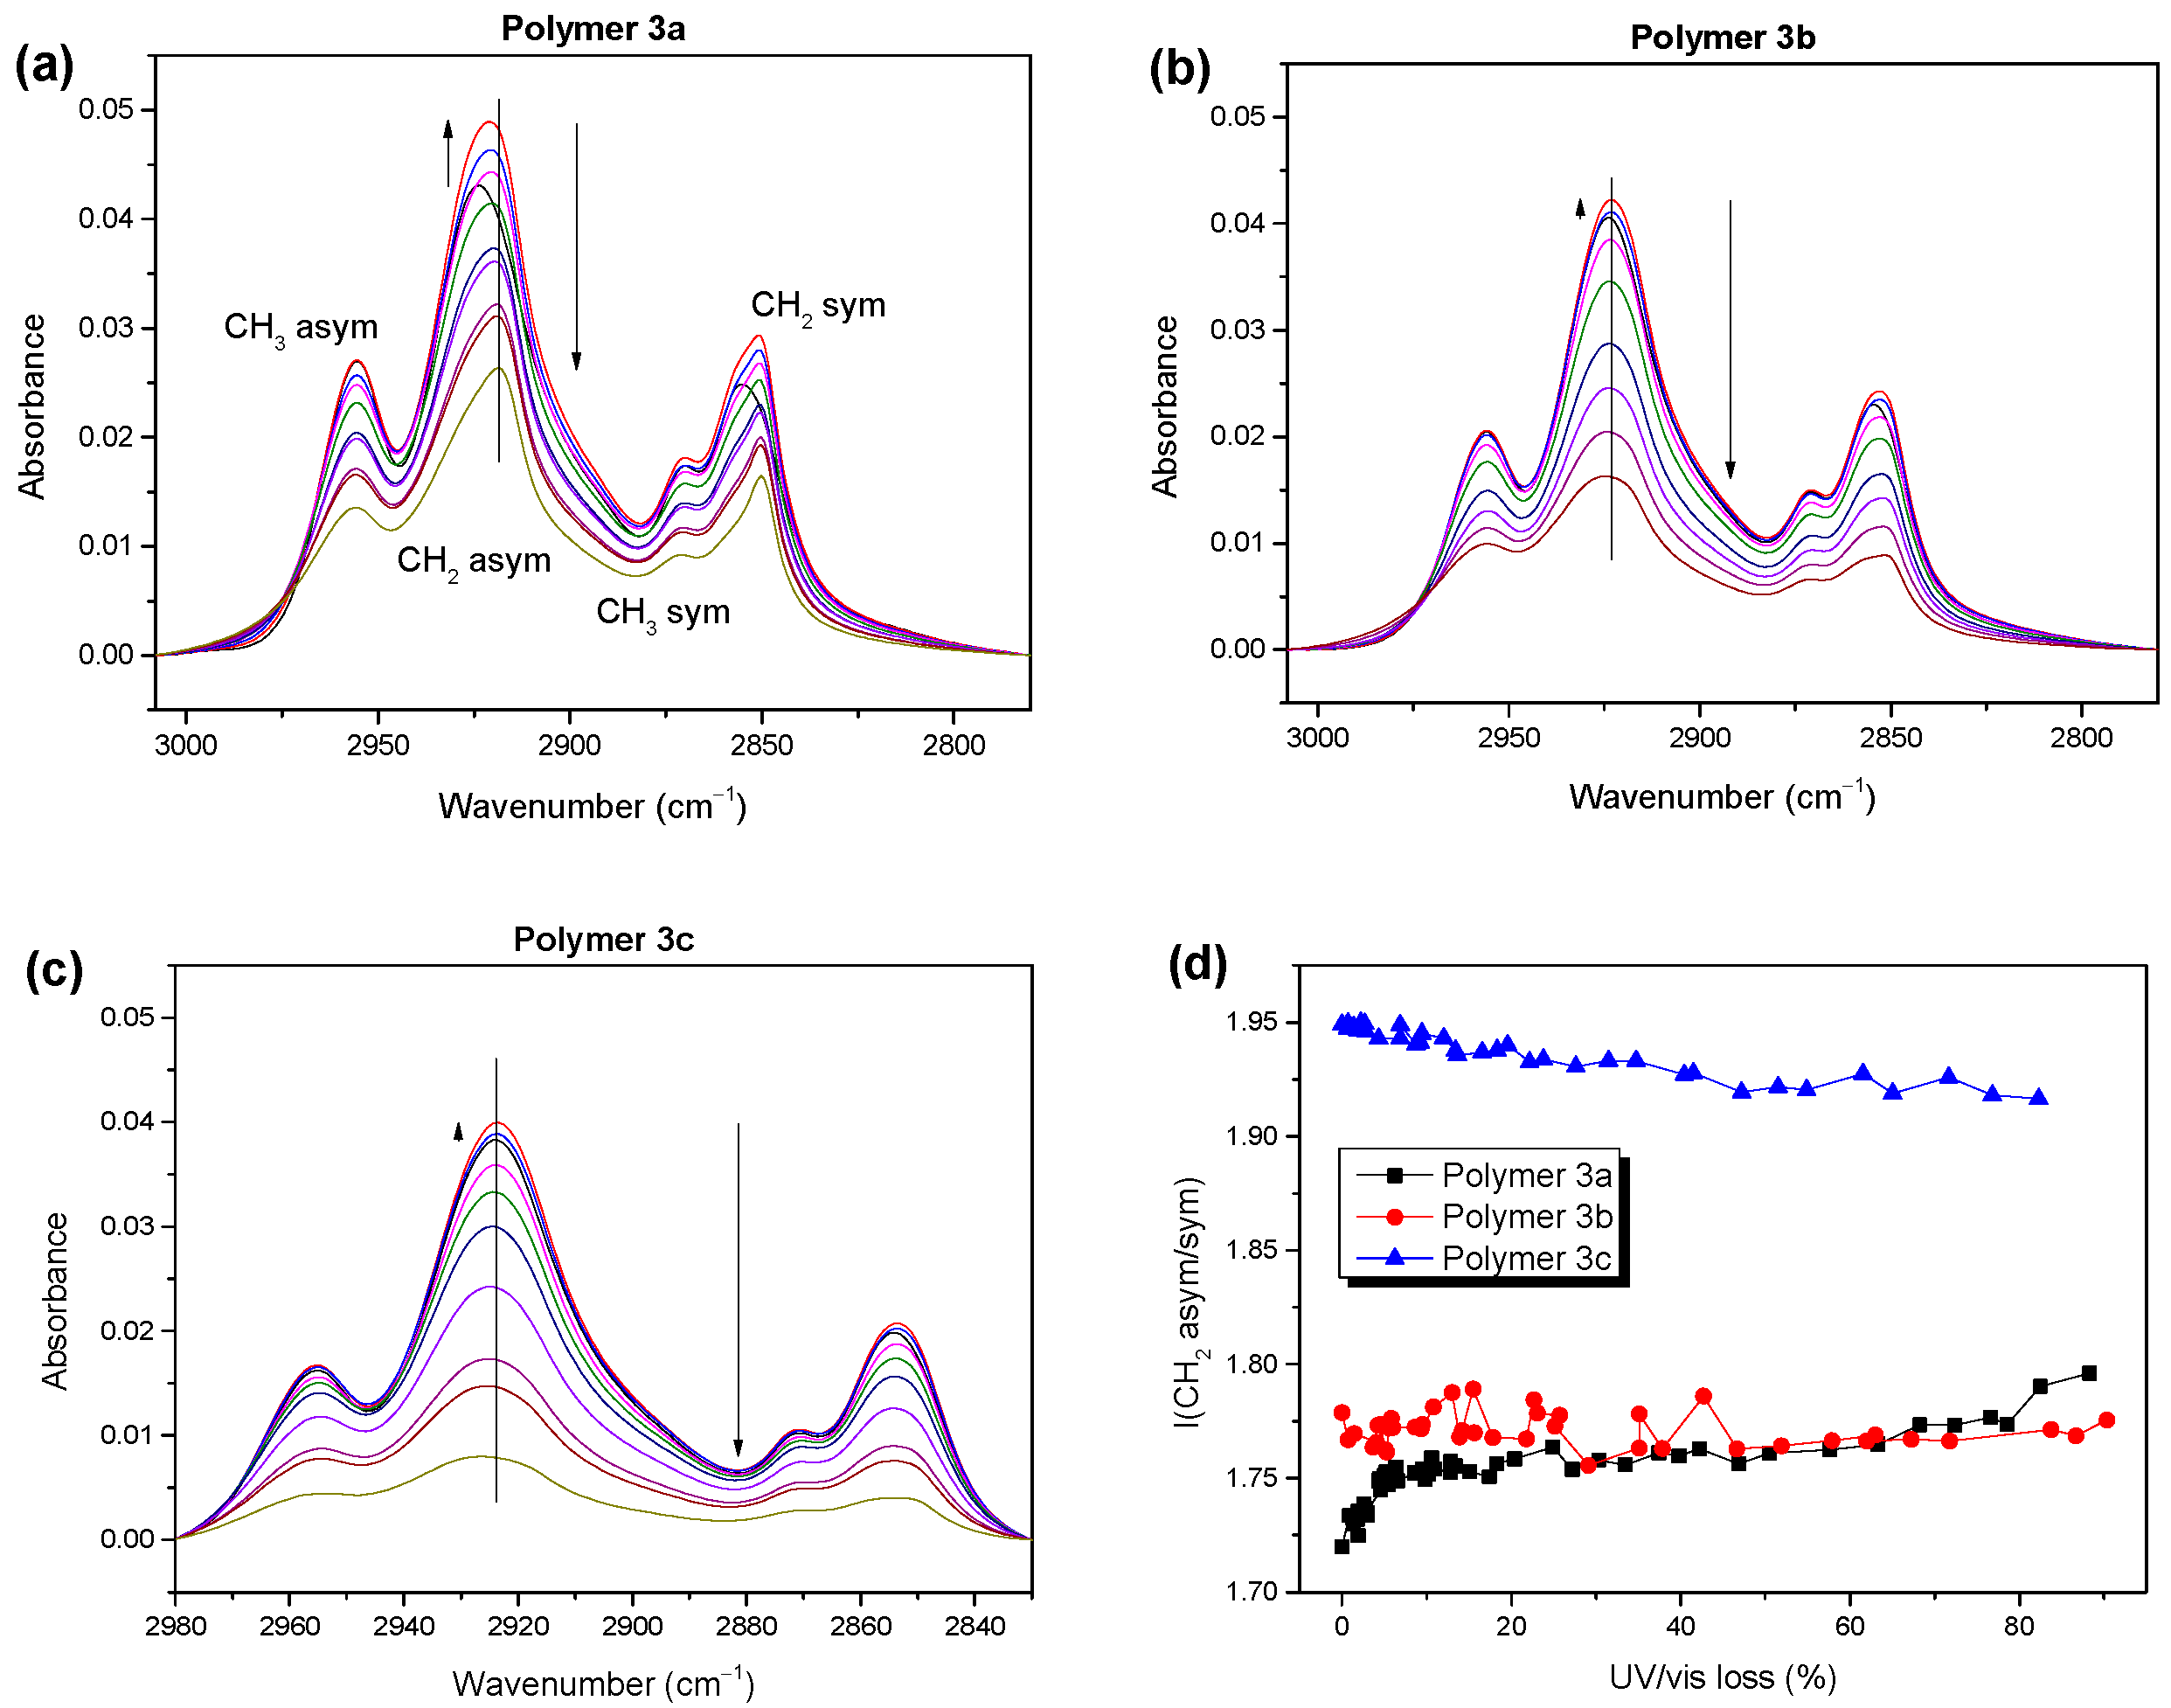
Surprisingly, an increase of 10–20% in the CH2 absorbance in the initial steps of the degradation is observed in Figure 5. A zoom into this region and the corresponding IR spectra are shown in Figure S8 (Supplementary Materials) and Figure 6a–c. Such an increase may have arisen if: (i) new compounds were formed containing C-H bonds (preferably with a high oscillator strength), or (ii) the orientation of the C-H bonds with respect to the electric field vector of the incoming IR light changed. Although significantly different intensities of the CH vibrations were observed (comparing, e.g., olefin-like species to aliphatic ones [43]), the oscillator strength of the aliphatic vibrations was rather high and the formation of additional C-H bonds seemed to be unlikely. Therefore, we are left with the scenario of a change in the orientation of the CH2 groups during the initial step of photooxidation. Distinct changes in the absorbance of the CH2 (but not CH3) vibrations due to conformation changes have also observed been in the literature [44]. Indeed, in our case too, the absorbance changes in the CH3-related vibrations were hardly visible during the initial steps of degradation (Figure 6).
The observed initial intensity increase, indicated by the small upward-pointing arrows in Figure 6, was strongest for polymer 3a (>20% increase in the absorbance) but still significant for polymers 3b and 3c. For polymer 3a, the increase in the absorbance of alkyl was accompanied by an energetic shift of about 6 cm−1 to lower wavenumbers (Figure 6 and Figure S9, Supplementary Materials), which may have been caused by chemical modifications. For example, a hydrogen abstraction on the alpha carbon would lead to the formation of double bonds and a shift in the C-H vibration to lower wavenumbers [42,43]. On the other hand, a change in the side chain conformation could also cause an energetic shift [44].
In addition, the detailed arrangement and coupling of the side chains could affect the intensity ratios of the asymmetric and symmetric CH2 vibrational bands (asym/sym) [45]. Thus, these ratios can be regarded as sensitive indicators for changes in the conformation and aggregation of a system [46,47]. The development of these ratios is summarized in Figure 6d for polymers 3a, 3b, and 3c. For polymer 3a, a clear increase during the initial steps of photooxidation was observed, pointing not only to a change in the orientation, but also to a decrease in the degree of the ordering of the side chains. Most importantly, the asym/sym ratios were generally lower for 3a and 3b (less than 1.8) compared to polymer 3c (1.95). This indicates that the ordering and conformation of the side chains of polymers 3a and 3b were distinctly different compared to 3c, which may explain the deviations in the molecular orientations obtained from PMIRRAS, as discussed above.
For thiophenes, a photooxidation mechanism is often proposed based on an energetically preferred attack on the side chain [12,24]. Therefore, the chemical structure of the side chain may determine the photostability of a polymer. The difference between polymer 3b and the more stable polymer 3c was the branched and linear side chains at their thiophene moieties, respectively. A radical might be stabilized at the tertiary carbon atom of a branched side chain, causing the lower stability of 3b [48,49]. The mechanism might be also different for polymers with branched or linear alkyl side chains [50]. However, in the case of polymers 3, the different orientations and aggregations, concluded from PMIRRAS and the intensity ratios of the CH2 bands, may significantly affect their photostability.

2.3. Wavelength Dependence of Degradation Mechanism of Polymer 3a

Further information about the photooxidation mechanism can be obtained by wavelength-dependent photooxidation studies. Since the photosensitization depends directly on the number of absorbed photons, we are able to distinguish between absorbance-dependent (possibly including the formation of singlet oxygen and/or peroxides) and energy-dependent (radical chain) mechanisms. For P3HT, it has been demonstrated that the rate of its radical mechanism strongly increases towards UV light [19]. Since we obtained some hints for the formation of peroxides during the photooxidation of polymer 3a (see above), we chose this polymer for our wavelength-dependent studies.
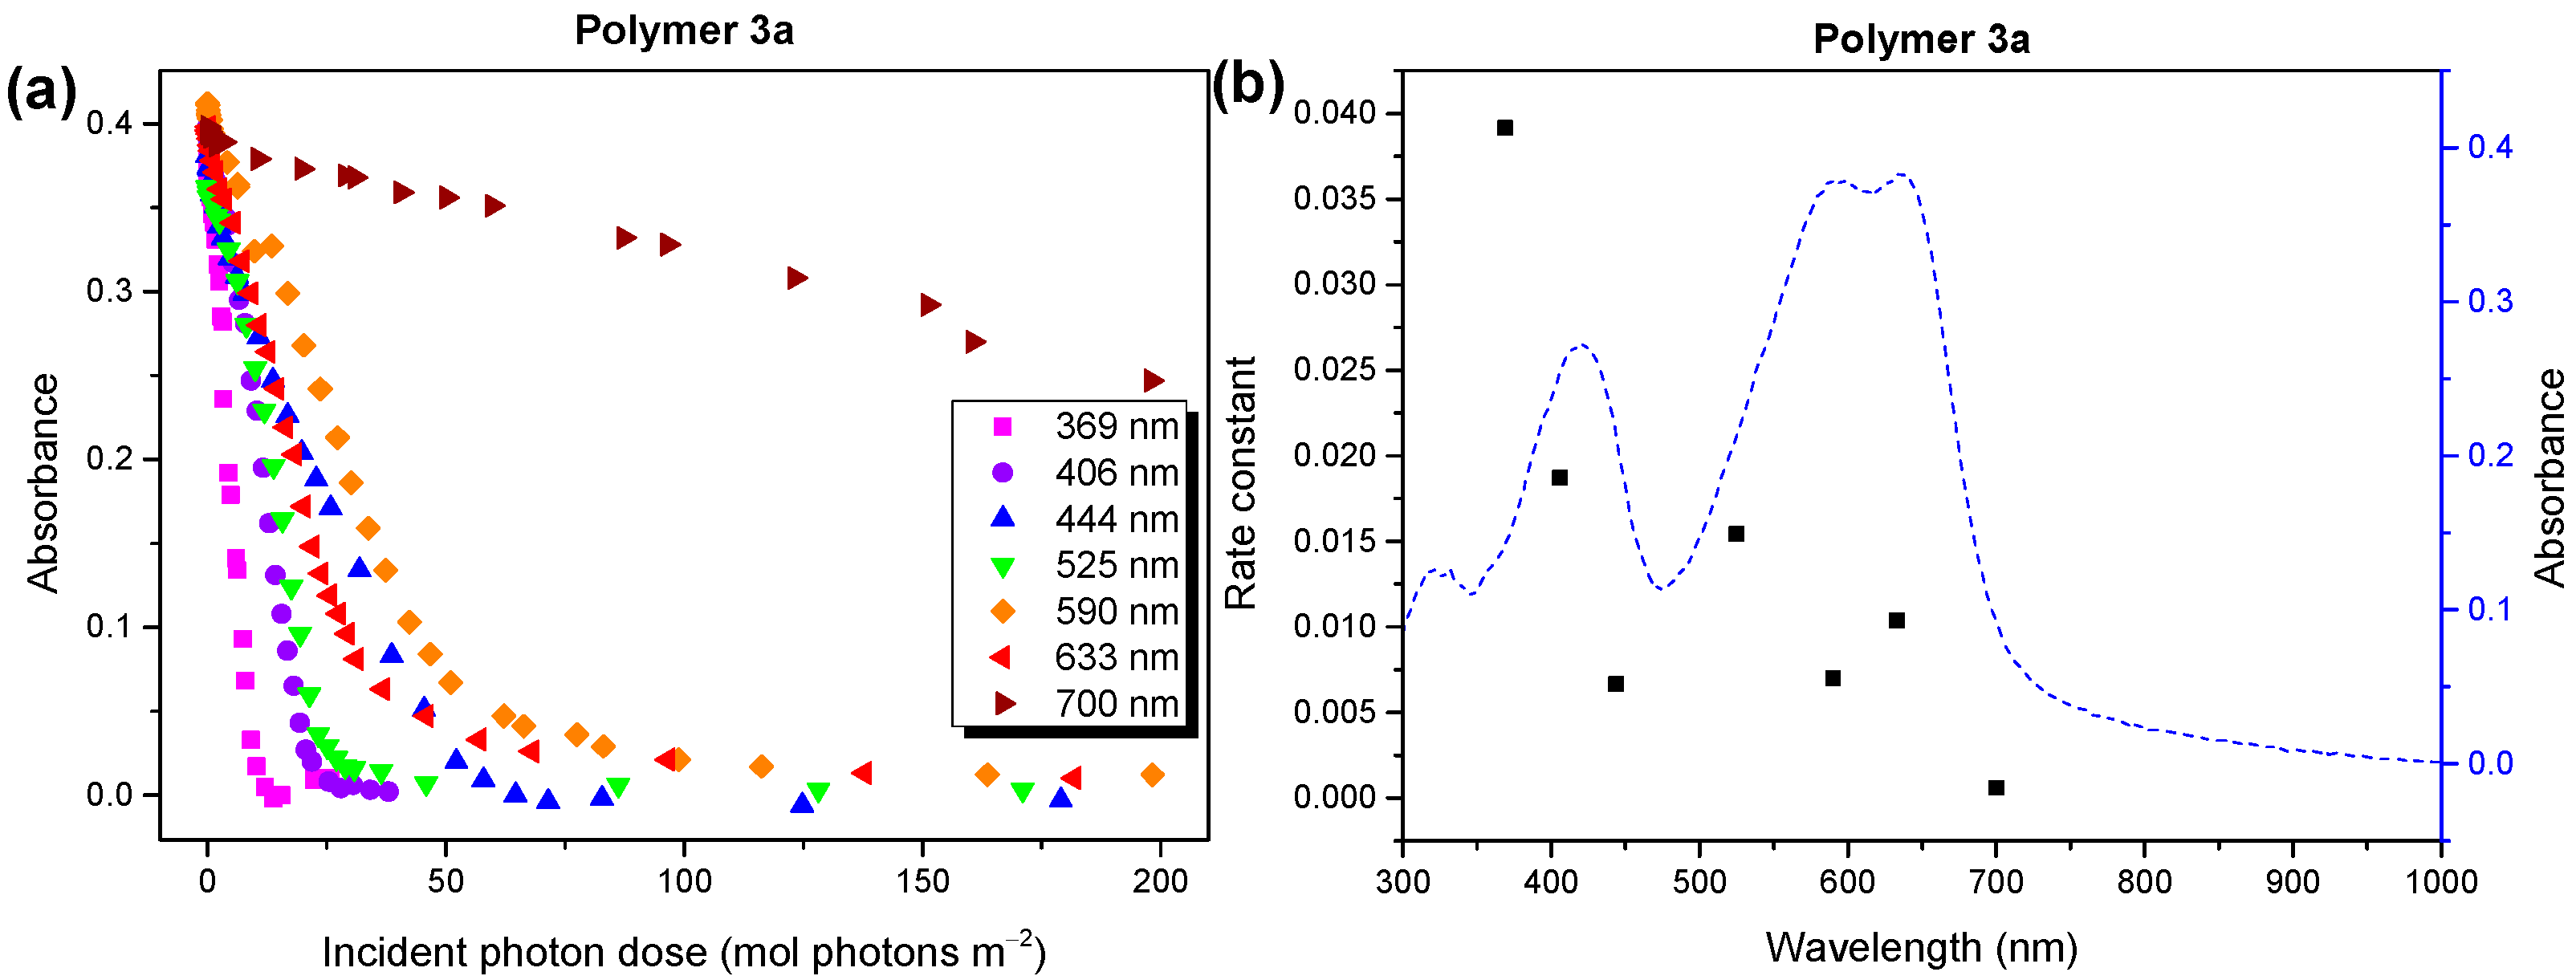
In Figure 7a, we show the development of the absorbance at the maxima of the UV/vis spectra, which is a function of the number of incident photons for seven different irradiation wavelengths between 369 and 700 nm. An almost linear behavior is observed; wavelength-dependent rate constants were obtained from the linear fits to the data. The rate constants are summarized in Figure 7b, together with the UV/vis absorption spectrum before degradation. We note that this data evaluation can be carried out based on the absorbed photons (Figure S10, Supplementary Materials), which leads to similar results in our case. The reaction rates in Figure 7b did not explicitly depend on the absorbance or energy of the incident photons. However, the fastest degradation rate was observed for the energy-rich UV light, indicating the domination of a radical mechanism under these conditions. Although a clear correlation of the reaction rates with the absorbance, which would indicate the occupation of long-living excited states, is hardly visible in Figure 7b, the contribution of such a photooxidation mechanism cannot be ruled out.
In the next step, we will compare the compositions of the reaction products in the carbonyl region for the photooxidation under UV (369 nm) and visible (525 and 633 nm) light. The corresponding spectra are shown in Figure 8 for the different stages of degradation.
The shape of the spectra in Figure 8 clearly depended on the wavelength of the irradiating light, and only minor changes in the degradation times were visible. For the irradiation with UV light (Figure 8a), the spectral shapes were very similar to the degradation under AM 1.5 conditions (cf. Figure 3a). This suggests that a radical mechanism dominated the degradation under white light. The species at around 1660 cm−1 for polymer 3a, which could possibly be attributed to a peroxide, was negligible in the UV region.
In contrast, the photooxidation under visible light (Figure 8b,c) resulted in spectral shapes that were comparable with the spectra for polymers 3b and 3c (Figure 3b,c) under AM 1.5 conditions. The shoulder at the lowest wavenumbers was increased (red peak in Figure 3b,c), whereas the shoulder at the highest wavenumbers was decreased (cyan peak in Figure 3b,c). This indicates that, in the visible light region, the degradation mechanism of polymer 3a was very similar to that for polymers 3b and 3c in white light. In other words, the mechanisms were not completely different for polymers 3a and 3b,c, but the dominating mechanism under white light conditions depended on the details of the chemical structure.
A possible radical mechanism in the UV range might particularly attack the side chains of the polymers. In Figure 9, we compare the development of the IR spectra in the alkyl region after photooxidation at different irradiation wavelengths. Clearly visible, the absorbance of the CH3 and CH2 vibrations decreased significantly faster in the UV region compared to visible light. This indicates that the radical chain mechanism for polymer 3a (possibly related to a H abstraction on alpha C) was strongly dependent on the wavelength and could be suppressed by a UV filter. Additionally, the shift in the wave numbers and increase in the intensity at the initial degradation steps, attributed to conformational changes, only occurred with ultraviolet light. Comparably high energy would possibly be needed to enable such effects.

3. Materials and Methods

3.1. Materials and Sample Preparation

The polymer synthesis was adopted from previously established protocols [31,51,52] and is described in detail for polymers 3b and 3c in the Supplementary Materials (see also Refs. [31,51,52,53,54,55,56,57]). The molecular weight distributions of the investigated polymers are summarized in Table 3.
For the photodegradation experiments with a solar simulator, the polymer thin films were doctor-blade casted in a nitrogen atmosphere with 0.5% (w/w) solutions in chloroform for polymers 1 and 2 and with 2.0% (w/w) solutions for polymers 3. A 1.0% (w/w) solution was used for the thin films irradiated with individual wavelengths. For the films investigated with IR, CaF2 substrates (Korth Kristalle, Altenholz, Germany) were used. The films for the wavelength-dependent investigations at 406, 444, 590, and 700 nm were casted on a glass substrate (ThermoFisher Scientific, Waltham, MA, United States). All the substrates were cleaned using chloroform and iso-propanol and underwent a subsequent UV/ozone treatment (SEN LIGHTS Corp., Osaka, Japan, Photo Surface Processor PL16-110B-1) for 15 min before the film deposition.
The gold substrates for the UPS measurements were treated with UV/ozone for 1 h. ITO (Hoya Corporation, Tokyo, Japan, sheet resistance R = 10 Ω/□) was treated like CaF2, with a subsequent doctor-blade casting of polyethylenimine (PEI) with a 0.1% (w/w) solution in isobutanol at 80 °C and annealing to 110 °C for 10 min. The LBG polymer films were subsequently doctor-blade casted with a 0.2% (w/w) chloroform solution in a nitrogen atmosphere. For the orientation measurements via PMIRRAS, 0.5% (w/w) chloroform solutions and 15 min UV/ozone-treated gold substrates were used. The annealing of the films to 130 °C for 30 min was followed by a cool-down ramp of 10 °C/15 min.

3.2. Methods

The UPS measurements were performed in a multichamber ultra-high vacuum system (5 × 10⁻¹⁰ mbar base pressure), equipped with an Omicron hemispherical analyzer (EA 125) and a helium discharge lamp (Leybold-Heraeus, Köln, Germany, UVS10/35) using He I radiation (21.22 eV).
For the UV/vis and IR measurements, the sample was removed from the solar simulator and placed into the UV/vis spectrometer, keeping it in a dry synthetic air atmosphere. The IR measurements were performed in an evacuated chamber.
For the IR transmission and PMIRRAS measurements, a Vertex 70v spectrometer (Bruker, Billerica, MA, United States) with a PMA50 module was used. The DFT calculations for the trimers and shortened (propyl) side chains were carried out to assign experimental IR bands to the vibrational modes, using Gaussian 16 [58] at the B3LYP/6-31G* level of theory and a scaling factor of 0.97.
The UV/vis transmission measurements were performed using a Maya2000 Pro detector (Ocean Optics, Ostfildern, Germany) and a DH-2000-BAL (Mikropack, Ostfildern, Germany) light source. A DH-2000-CAL (Mikropack) light source with a cosine corrector was used for the absolute light intensity calibration in the range from 200 nm to 1050 nm.
The photooxidation experiments were carried out in custom-made degradation chambers under a continuous gas flow of dry synthetic air (Westfalen, hydrocarbon free), using a LOT LS0106 solar simulator (AM 1.5; 1000 Wm−2) equipped with a Xenon short-arc lamp (Osram, München, Germany, XBO).
For the calibration, a reference solar cell (ReRa Systems) was used. The wavelength-dependent degradation was performed using an array of high-power LEDs (Philips, Amsterdam, Netherlands, Luxeon Rebel).

4. Conclusions

We studied the influence of side chains on the photooxidation of selected low band gap polymers. As expected, the presence of alkoxy side chains instead of an alkyl side chain at a thiophene moiety increases the stability significantly. The situation is more complex for side chains at the benzodithiophene (BDT) moiety (polymers 3a, 3b, 3c). Comparing polymer 3a to polymer 3b, the rate constants of their photooxidations are comparable, despite the different alkyl or alkoxy side chains. From the composition of the reaction products, a different dominating mechanism for the photooxidation under AM 1.5 conditions for polymer 3a compared to 3b and 3c was concluded. On the other hand, the photooxidations under different wavelengths reveal that several mechanisms contribute to the degradation of the three polymers 3a, 3b, 3c. However, the highest stability of polymer 3c (alkyl group at the thiophene moiety) is most likely caused by a different aggregation in the thin films. The interplay between the molecular weights and solid-state properties (especially the photostability) of the studied copolymers is beyond the scope of this study and might be the focus of further investigations. The resulting molecular weights of the copolymers under investigation are, of course, influenced by the substitution pattern of the monomers. All the copolymers have been purified by a Soxhlet extraction before use and showed a number of average molecular weight values Mn of >10 k g m o l .

Supplementary Materials

The following supporting information can be downloaded at: https://www.mdpi.com/article/10.3390/molecules28093858/s1, Figure S1–S15: UPS HeI spectra, UV/vis absorption spectra without degradation, PMIRRAS spectra, vibrational frequencies and assigned vibrations, PMIRRAS calculations, UV/vis spectra at different steps of degradation, linear fits of UV/vis absorbance, absorbance of carbonyl components, IR spectra of the carbonyl region, zoom into Figure 5, alkyl wavenumber shift vs. degradation, absorbed photon dose, reagents and methods [31,48,52,53,54,55,56,57].

Author Contributions

The manuscript was written through contributions of all authors. Conceptualization H.P; data curation, investigation, S.B., T.K., F.T.; formal analysis, validation and visualization, S.B.; project administration, H.P., T.C., M.F. and U.S.; supervision, H.P., T.C. and U.S.; writing—original draft, S.B. and H.P.; writing—review and editing, S.B., M.F., T.K., F.T., U.S., T.C. and H.P; funding acquisition, H.P., T.C. and U.S. All authors have read and agreed to the published version of the manuscript.

Funding

The work was supported by the German Research Council (PE 546/10-3, CH 132/24-3 and SCHE 410/24-3). The authors acknowledge support by the state of Baden-Württemberg through bwHPC and the German Research Foundation (DFG) through grant no INST 40/467-1 FUGG (JUSTUS cluster).

Institutional Review Board Statement

Not applicable.

Informed Consent Statement

Not applicable.

Data Availability Statement

Additional data are available on request.

Acknowledgments

We are grateful to Elisa Krug, Vincent Fischer, geb. Lamparter, Sarah Klysch, Wafa Alnasser, Thomas Fischer and Carolin Schüle (all University of Tübingen) for the support of the experiments and valuable discussions.

Conflicts of Interest

The authors declare no conflict of interest.

References

  1. Liu, C.H.; Xiao, C.Y.; Xie, C.C.; Li, W.W. Flexible organic solar cells: Materials, large-area fabrication techniques and potential applications. Nano Energy 2021, 89, 26. [Google Scholar] [CrossRef]
  2. Bonnassieux, Y.; Brabec, C.J.; Cao, Y.; Carmichael, T.B.; Chabinyc, M.L.; Cheng, K.T.; Cho, G.; Chung, A.; Cobb, C.L.; Distler, A.; et al. The 2021 flexible and printed electronics roadmap. Flex. Print. Electron. 2022, 6, 023001. [Google Scholar] [CrossRef]
  3. Armin, A.; Li, W.; Sandberg, O.J.; Xiao, Z.; Ding, L.M.; Nelson, J.; Neher, D.; Vandewal, K.; Shoaee, S.; Wang, T.; et al. A History and Perspective of Non-Fullerene Electron Acceptors for Organic Solar Cells. Adv. Energy Mater. 2021, 11, 42. [Google Scholar] [CrossRef]
  4. Held, M.; Zakharko, Y.; Wang, M.; Jakubka, F.; Gannott, F.; Rumer, J.W.; Ashraf, R.S.; McCulloch, I.; Zaumseil, J. Photo- and electroluminescence of ambipolar, high-mobility, donor-acceptor polymers. Org. Electron. 2016, 32, 220–227. [Google Scholar] [CrossRef]
  5. Bürgi, L.; Turbiez, M.; Pfeiffer, R.; Bienewald, F.; Kirner, H.-J.; Winnewisser, C. High-Mobility Ambipolar Near-Infrared Light-Emitting Polymer Field-Effect Transistors. Adv. Mater. 2008, 20, 2217–2224. [Google Scholar] [CrossRef]
  6. Cheng, P.; Zhan, X.W. Stability of organic solar cells: Challenges and strategies. Chem. Soc. Rev. 2016, 45, 2544–2582. [Google Scholar] [CrossRef]
  7. Aygül, U.; Egelhaaf, H.J.; Nagel, P.; Merz, M.; Schuppler, S.; Eichele, K.; Peisert, H.; Chassé, T. Photodegradation of C-PCPDTBT and Si-PCPDTBT: Influence of the Bridging Atom on the Stability of a Low-Band-Gap Polymer for Solar Cell Application. ChemPhysChem 2015, 16, 428–435. [Google Scholar] [CrossRef]
  8. Tournebize, A.; Bussiere, P.O.; Rivaton, A.; Gardette, J.L.; Medlej, H.; Hiorns, R.C.; Dagron-Lartigau, C.; Krebs, F.C.; Norrman, K. New Insights into the Mechanisms of Photodegradation/Stabilization of P3HT:PCBM Active Layers Using Poly(3-hexyl-d(13)-Thiophene). Chem. Mater. 2013, 25, 4522–4528. [Google Scholar] [CrossRef]
  9. Manceau, M.; Bundgaard, E.; Carlé, J.E.; Hagemann, O.; Helgesen, M.; Søndergaard, R.; Jørgensen, M.; Krebs, F.C. Photochemical stability of π-conjugated polymers for polymer solar cells: A rule of thumb. J. Mater. Chem. 2011, 21, 4132–4141. [Google Scholar] [CrossRef]
  10. Hintz, H.; Egelhaaf, H.J.; Peisert, H.; Chassé, T. Photo-oxidation and ozonization of poly(3-hexylthiophene) thin films as studied by UV/VIS and photoelectron spectroscopy. Polym. Degrad. Stabil. 2010, 95, 818–825. [Google Scholar] [CrossRef]
  11. Rivaton, A.; Chambon, S.; Manceau, M.; Gardette, J.-L.; Lamaitre, N.; Guillerez, S. Light-induced degradation of the active layer of polymer-based solar cells. Polym. Degrad. Stabil. 2010, 95, 278–284. [Google Scholar] [CrossRef]
  12. Manceau, M.; Rivaton, A.; Gardette, J.-L.; Guillerez, S.; Lemaitre, N. The mechanism of photo- and thermooxidation of poly(3-hexylthiophene) (P3HT) reconsidered. Polym. Degrad. Stabil. 2009, 94, 898–907. [Google Scholar] [CrossRef]
  13. Martynov, I.V.; Inasaridze, L.N.; Troshin, P.A. Resist or Oxidize: Identifying Molecular Structure-Photostability Relationships for Conjugated Polymers Used in Organic Solar Cells. Chemsuschem 2022, 15, e202101336. [Google Scholar] [CrossRef] [PubMed]
  14. Brabec, C.J. Organic photovoltaics: Technology and market. Sol. Energy Mater. Sol. Cells 2004, 83, 273–292. [Google Scholar] [CrossRef]
  15. Yang, W.; Wang, W.; Wang, Y.; Sun, R.; Guo, J.; Li, H.; Shi, M.; Guo, J.; Wu, Y.; Wang, T.; et al. Balancing the efficiency, stability, and cost potential for organic solar cells via a new figure of merit. Joule 2021, 5, 1209–1230. [Google Scholar] [CrossRef]
  16. Hintz, H.; Egelhaaf, H.J.; Luer, L.; Hauch, J.; Peisert, H.; Chassé, T. Photodegradation of P3HT-A Systematic Study of Environmental Factors. Chem. Mater. 2011, 23, 145–154. [Google Scholar] [CrossRef]
  17. Manceau, M.; Rivaton, A.; Gardette, J.-L. Involvement of Singlet Oxygen in the Solid-State Photochemistry of P3HT. Macromol. Rapid Commun. 2008, 29, 1823–1827. [Google Scholar] [CrossRef]
  18. Jørgensen, M.; Norrman, K.; Gevorgyan, S.A.; Tromholt, T.; Andreasen, B.; Krebs, F.C. Stability of Polymer Solar Cells. Adv. Mater. 2012, 24, 580–612. [Google Scholar] [CrossRef]
  19. Rabek, J.F. Polymer Photodegradation; Springer: Dordrecht, The Netherlands, 1995. [Google Scholar]
  20. Abdou, M.S.A.; Holdcroft, S. Mechanisms of photodegradation of poly(3-alkylthiophenes) in solution. Macromolecules 1993, 26, 2954–2962. [Google Scholar] [CrossRef]
  21. Liu, X.; Zhao, Y.; Zhang, X.; Zhou, G.; Zhang, S. Microstructures and interaction analyses of phosphonium-based ionic liquids: A simulation study. J. Phys. Chem. B 2012, 116, 4934–4942. [Google Scholar] [CrossRef]
  22. Chen, L.; Mizukado, J.; Suzuki, Y.; Kutsuna, S.; Aoyama, Y.; Yoshida, Y.; Suda, H. An ESR study on superoxide radical anion generation and its involvement in the photooxidative degradation of poly-3-hexylthiophene in chlorobenzene solution. Chem. Phys. Lett. 2014, 605–606, 98–102. [Google Scholar] [CrossRef]
  23. Morse, G.E.; Tournebize, A.; Rivaton, A.; Chassé, T.; Taviot-Gueho, C.; Blouin, N.; Lozman, O.R.; Tierney, S. The effect of polymer solubilizing side-chains on solar cell stability. Phys. Chem. Chem. Phys. 2015, 17, 11884–11897. [Google Scholar] [CrossRef] [PubMed]
  24. Sai, N.; Leung, K.; Zadord, J.; Henkelman, G. First principles study of photo-oxidation degradation mechanisms in P3HT for organic solar cells. Phys. Chem. Chem. Phys. 2014, 16, 8092–8099. [Google Scholar] [CrossRef]
  25. Manceau, M.; Rivaton, A.; Gardette, J.-L.; Guillerez, S.; Lemaitre, N. Light-induced degradation of the P3HT-based solar cells active layer. Sol. Energy Mater. Sol. Cells 2011, 95, 1315–1325. [Google Scholar] [CrossRef]
  26. Silva, H.S.; Tournebize, A.; Begue, D.; Peisert, H.; Chasse, T.; Gardette, J.L.; Therias, S.; Rivaton, A.; Hiorns, R.C. A universal route to improving conjugated macromolecule photostability. RSC Adv. 2014, 4, 54919–54923. [Google Scholar] [CrossRef]
  27. Tournebize, A.; Dominguez, I.F.; Morse, G.E.; Taviot-Gueho, C.; Rivaton, A.; Peisert, H.; Chasse, T. Side chain structure and dispersity impact the photostability of low band gap polymers. Polym. Degrad. Stabil. 2017, 146, 155–160. [Google Scholar] [CrossRef]
  28. Shen, D.E.; Lang, A.W.; Collier, G.S.; Osterholm, A.M.; Smith, E.M.; Tomlinson, A.L.; Reynolds, J.R. Enhancement of Photostability through Side Chain Tuning in Dioxythiophene-Based Conjugated Polymers. Chem. Mater. 2022, 34, 1041–1051. [Google Scholar] [CrossRef]
  29. Mateker, W.R.; Heumueller, T.; Cheacharoen, R.; Sachs-Quintana, I.T.; McGehee, M.D.; Warnan, J.; Beaujuge, P.M.; Liu, X.; Bazan, G.C. Molecular Packing and Arrangement Govern the Photo-Oxidative Stability of Organic Photovoltaic Materials. Chem. Mater. 2015, 27, 6345–6353. [Google Scholar] [CrossRef]
  30. Dupuis, A.; Wong-Wah-Chung, P.; Rivaton, A.; Gardette, J.L. Influence of the microstructure on the photooxidative degradation of poly(3-hexylthiophene). Polym. Degrad. Stabil. 2012, 97, 366–374. [Google Scholar] [CrossRef]
  31. Bölke, S.; Batchelor, D.; Früh, A.; Lassalle-Kaiser, B.; Keller, T.; Trilling, F.; Forster, M.; Scherf, U.; Chassé, T.; Peisert, H. Influence of the Side Chain Structure on the Electronic Structure and Self-Organization Properties of Low Band Gap Polymers. ACS Appl. Energy Mater. 2022, 5, 15290–15301. [Google Scholar] [CrossRef]
  32. Braun, S.; Salaneck, W.R.; Fahlman, M. Energy-Level Alignment at Organic/Metal and Organic/Organic Interfaces. Adv. Mater. 2009, 21, 1450–1472. [Google Scholar] [CrossRef]
  33. Debe, M.K. Extracting physical structure information from thin organic films with reflection absorption infrared spectroscopy. J. Appl. Phys. 1984, 55, 3354–3366. [Google Scholar] [CrossRef]
  34. Pearce, H.A.; Sheppard, N. Possible importance of a metal-surface selection rule in interpretation of infrared-spectra of molecules adsorbed on particulate metals—Infrared-spectra from ethylene chemisorbed on silica-supported metal-catalysts. Surf. Sci. 1976, 59, 205–217. [Google Scholar] [CrossRef]
  35. Greenler, R.G. Infrared Study of Adsorbed Molecules on Metal Surfaces by Reflection Techniques. J. Chem. Phys. 1966, 44, 310–315. [Google Scholar] [CrossRef]
  36. Umemura, J. Reflection–Absorption Spectroscopy of Thin Films on Metallic Substrates. In Handbook of Vibrational Spectroscopy; Wiley: Hoboken, NJ, USA, 2001. [Google Scholar]
  37. Früh, A.; Rutkowski, S.; Akimchenko, I.O.; Tverdokhlebov, S.I.; Frueh, J. Orientation analysis of polymer thin films on metal surfaces via IR absorbance of the relative transition dipole moments. Appl. Surf. Sci. 2022, 594, 153476. [Google Scholar] [CrossRef]
  38. Scharber, M.C.; Koppe, M.; Gao, J.; Cordella, F.; Loi, M.A.; Denk, P.; Morana, M.; Egelhaaf, H.-J.; Forberich, K.; Dennler, G.; et al. Influence of the Bridging Atom on the Performance of a Low-Bandgap Bulk Heterojunction Solar Cell. Adv. Mater. 2010, 22, 367. [Google Scholar] [CrossRef]
  39. Adams, J.H. Analysis of the nonvolatile oxidation products of polypropylene I. Thermal oxidation. J. Polym. Sci. Part A-1 Polym. Chem. 1970, 8, 1077–1090. [Google Scholar] [CrossRef]
  40. Ljungqvist, N.; Hjertberg, T. Oxidative degradation of poly (3-octylthiophene). Macromolecules 1995, 28, 5993–5999. [Google Scholar] [CrossRef]
  41. Alem, S.; Wakim, S.; Lu, J.; Robertson, G.; Ding, J.; Tao, Y. Degradation Mechanism of Benzodithiophene-Based Conjugated Polymers when Exposed to Light in Air. ACS Appl. Mater. Interfaces 2012, 4, 2993–2998. [Google Scholar] [CrossRef]
  42. Holdcroft, S. Photochain scission of the soluble electronically conducting polymer: Poly (3-hexylthiophene). Macromolecules 1991, 24, 2119–2121. [Google Scholar] [CrossRef]
  43. Wexler, A.S. Infrared determination of structural units in organic compounds by integrated intensity measurements: Alkanes, alkenes and monosubstituted alkyl benzenes. Spectrochim. Acta 1965, 21, 1725–1742. [Google Scholar] [CrossRef]
  44. Dettinger, U.; Egelhaaf, H.-J.; Brabec, C.J.; Latteyer, F.; Peisert, H.; Chasse, T. FTIR Study of the Impact of PC[60]BM on the Photodegradation of the Low Band Gap Polymer PCPDTBT under O2 Environment. Chem. Mater. 2015, 27, 2299–2308. [Google Scholar] [CrossRef]
  45. Gaber, B.P.; Peticolas, W.L. On the quantitative interpretation of biomembrane structure by Raman spectroscopy. Biochim. Et Biophys. Acta (BBA)-Biomembr. 1977, 465, 260–274. [Google Scholar] [CrossRef]
  46. Snyder, R.G. Group Moment Interpretation of the Infrared Intensities of Crystalline n-Paraffins. J. Chem. Phys. 1965, 42, 1744–1763. [Google Scholar] [CrossRef]
  47. Snyder, R.G.; Hsu, S.L.; Krimm, S. Vibrational spectra in the C-H stretching region and the structure of the polymethylene chain. Spectrochim. Acta Part A Mol. Spectrosc. 1978, 34, 395–406. [Google Scholar] [CrossRef]
  48. Zhou, W.; Zhu, S. ESR Study on Peroxide Modification of Polypropylene. Ind. Eng. Chem. Res. 1997, 36, 1130–1135. [Google Scholar] [CrossRef]
  49. Cnudde, P.; De Wispelaere, K.; Vanduyfhuys, L.; Demuynck, R.; Van der Mynsbrugge, J.; Waroquier, M.; Van Speybroeck, V. How Chain Length and Branching Influence the Alkene Cracking Reactivity on H-ZSM-5. ACS Catal. 2018, 8, 9579–9595. [Google Scholar] [CrossRef]
  50. Ratkiewicz, A.; Truong, T.N. Kinetics of the C–C bond beta scission reactions in alkyl radical reaction class. J. Phys. Chem. A 2012, 116, 6643–6654. [Google Scholar] [CrossRef]
  51. Zhou, H.; Yang, L.; Stuart, A.C.; Price, S.C.; Liu, S.; You, W. Development of Fluorinated Benzothiadiazole as a Structural Unit for a Polymer Solar Cell of 7% Efficiency. Angew. Chem. Int. Ed. 2011, 50, 2995–2998. [Google Scholar] [CrossRef]
  52. Carlé, J.E.; Helgesen, M.; Zawacka, N.K.; Madsen, M.V.; Bundgaard, E.; Krebs, F.C. A comparative study of fluorine substituents for enhanced stability of flexible and ITO-free high-performance polymer solar cells. J. Polym. Sci. Part B Polym. Phys. 2014, 52, 893–899. [Google Scholar] [CrossRef]
  53. Bura, T.; Beaupre, S.; Legare, M.A.; Quinn, J.; Rochette, E.; Blaskovits, J.T.; Fontaine, F.G.; Pron, A.; Li, Y.N.; Leclerc, M. Direct heteroarylation polymerization: Guidelines for defect-free conjugated polymers. Chem. Sci. 2017, 8, 3913–3925. [Google Scholar] [CrossRef]
  54. Kim, J.; Yun, M.H.; Kim, G.H.; Lee, J.; Lee, S.M.; Ko, S.J.; Kim, Y.; Dutta, G.K.; Moon, M.; Park, S.Y.; et al. Synthesis of PCDTBT-Based Fluorinated Polymers for High Open-Circuit Voltage in Organic Photovoltaics: Towards an Understanding of Relationships between Polymer Energy Levels Engineering and Ideal Morphology Control. ACS Appl. Mater. Interfaces 2014, 6, 7523–7534. [Google Scholar] [CrossRef] [PubMed]
  55. Wang, Q.F.; Takita, R.; Kikuzaki, Y.; Ozawa, F. Palladium-Catalyzed Dehydrohalogenative Polycondensation of 2-Bromo-3-hexylthiophene: An Efficient Approach to Head-to-Tail Poly(3-hexylthiophene). J. Am. Chem. Soc. 2010, 132, 11420–11421. [Google Scholar] [CrossRef] [PubMed]
  56. Campeau, L.C.; Parisien, M.; Leblanc, M.; Fagnou, K. Biaryl synthesis via direct arylation: Establishment of an efficient catalyst for intramolecular processes. J. Am. Chem. Soc. 2004, 126, 9186–9187. [Google Scholar] [CrossRef]
  57. Keller, T.; Gahlmann, T.; Riedl, T.; Scherf, U. Direct Arylation Polycondensation (DAP) Synthesis of Alternating Quaterthiophene-Benzothiadiazole Copolymers for Organic Solar Cell Applications. Chempluschem 2019, 84, 1249–1252. [Google Scholar] [CrossRef] [PubMed]
  58. Frisch, M.J.; Trucks, G.W.; Schlegel, H.B.; Scuseria, G.E.; Robb, M.A.; Cheeseman, J.R.; Scalmani, G.; Barone, V.; Petersson, G.A.; Nakatsuji, H.; et al. Gaussian 16 Rev. C.01; Gaussian, Inc.: Wallingford, CT, USA, 2016. [Google Scholar]
Figure 1. Chemical structure of the investigated LBG polymers with different side chains and positions.
Molecules 28 03858 g001
Figure 2. UV/vis absorbance at wavelength given in brackets as a function of the photon dose (solar simulator AM1.5). (a) For polymers 1 and 2, oxygen introduction in the side chain structure has a huge impact on the photostability of the LBG polymers. (b) Polymers 3 do not show such an effect. For those structures, linear instead of branched side chains on the thiophene units increase their photostability.
Molecules 28 03858 g002
Figure 3. IR spectra in the carbonyl region (1900–1600 cm−1) described by four components, which can be ascribed to different chemical species. The ones around 1660 cm−1 and 1776 cm−1, related to main degradation product at 1728 cm−1, show completely different behavior for polymer 3a (a) compared to 3b (b) and 3c (c), which indicates different degradation mechanisms due to different side chains.
Molecules 28 03858 g003
Figure 4. Absorbance of selected carbonyl species at 1660 cm−1 (a) and 1776 cm−1 (b) relative to the main component at 1726–1729 cm−1 (for better comparison values were normalized to 0 and 1). The composition of carbonyl species is significantly different for polymer 3a compared to polymers 3b and 3c.
Molecules 28 03858 g004
Figure 5. Normalized IR and UV/vis absorbance of educts and reaction products of polymers 3a (a), 3b (b) and 3c (c) as a function of the photon dose (irradiated in dry synthetic air with a solar simulator under AM1.5 conditions). UV/vis and IR bands attributed to the polymer backbone show very similar trends.
Molecules 28 03858 g005
Figure 6. (ac) IR spectra of polymers 3 of the alkyl region at different stages of degradation. (d) Ratios of IR intensities of asymmetric to symmetric CH2 vibrations for polymers 3 as an indicator for conformational changes in the alkyl side chains.
Molecules 28 03858 g006
Figure 7. (a) Wavelength-dependent absorbance, and (b) average rate constants for the photooxidation of polymer 3a compared to the UV/vis absorbance. Photons in the UV region lead to the fastest polymer degradation.
Molecules 28 03858 g007
Figure 8. IR spectra of polymer 3a in the carbonyl region for photooxidation at different irradiation wavelengths. (a) UV (369 nm) leads to a different shape, worth mentioning the very little structure around 1650 cm−1 compared to 525 nm (b) and 633 nm (c).
Molecules 28 03858 g008
Figure 9. IR spectra of polymer 3a in the alkyl region for photooxidation at different irradiation wavelengths of 369 nm (a), 525 nm (b) and 636 nm (c). Increase and decrease, as well as wavenumber shift, strongly depend on the wavelength.
Molecules 28 03858 g009
Table 1. Summary of electronic parameters of polymers 3a, 3b, and 3c prepared on PEI and gold as obtained from UPS and UV/vis. All values are given in eV.
IP Φorg
PolymerPEIAu E g o p t PEIAu
3a5.25.22.013.7/+0.44.5/−0.7
3b5.15.12.013.7/+0.44.4/−0.8
3c4.94.91.903.7/+0.44.3/−0.9
Table 2. Average angles between the polymer backbone and the (gold) substrate surface. In all cases a preferred parallel orientation is observed.
Polymer3a3b3c
room temperature15°14°22°
annealed (130 °C)15°16°24°
Table 3. Molecular weight distributions of the synthesized low band gap (LBG) polymers.
PolymerMn
[kg/mol]
Mw
[kg/mol]
Mw/MnDP
1a *12.614.41.1414
1b *9.715.41.5911
2a *7.210.21.4210
2b *8.010.01.2512
3a #10.313.41.309
3b #17.123.91.4014
3c #16.758.53.5014
* measured in THF; # measured in chloroform; (polymer concentration: 1.0 g/L).
Disclaimer/Publisher’s Note: The statements, opinions and data contained in all publications are solely those of the individual author(s) and contributor(s) and not of MDPI and/or the editor(s). MDPI and/or the editor(s) disclaim responsibility for any injury to people or property resulting from any ideas, methods, instructions or products referred to in the content.