Article

Crystal Structure, Chemical Bond, and Microwave Dielectric Properties of Ba1−xSrx(Zn1/3Nb2/3)O3 Solid Solution Ceramics

1
Provincial Key Laboratory of Informational Service for Rural Area of Southwestern Hunan, Shaoyang University, Shaoyang 422000, China
2
School of Physics and Electronics, Central South University, Changsha 410083, China
*
Author to whom correspondence should be addressed.
Molecules 2023, 28(8), 3451; https://doi.org/10.3390/molecules28083451
Submission received: 16 February 2023 / Revised: 29 March 2023 / Accepted: 12 April 2023 / Published: 13 April 2023
(This article belongs to the Special Issue Advances in the Theoretical and Computational Chemistry)

Abstract

:
Ba1−xSrx(Zn1/3Nb2/3)O3 (BSZN) perovskite ceramics are prepared using the traditional solid-state reaction method. X-ray diffraction (XRD), Scanning electron microscopy (SEM), Raman spectroscopy, and X-ray photoelectron spectroscopy (XPS) were used to analyze the phase composition, crystal structure, and chemical states of BSZN ceramics, respectively. In addition, the dielectric polarizability, octahedral distortion, complex chemical bond theory, and PVL theory were investigated in detail. Systematic research showed that Sr2+ addition could considerably optimize the microwave dielectric properties of BSZN ceramics. The change in τf value in the negative direction was attributed to oxygen octahedral distortion and bond energy (Eb), and the optimal value of 1.26 ppm/°C was obtained at x = 0.2. The ionic polarizability and density played a decisive role in the dielectric constant, achieving a maximum of 45.25 for the sample with x = 0.2. The full width at half-maximum (FWHM) and lattice energy (Ub) jointly contributed to improving the Q × f value, and a higher Q × f value corresponded to a smaller FWHM value and a larger Ub value. Finally, excellent microwave dielectric properties (εr = 45.25, Q × f = 72,704 GHz, and τf = 1.26 ppm/°C) were obtained for Ba0.8Sr0.2(Zn1/3Nb2/3)O3 ceramics sintered at 1500 °C for 4 h.

1. Introduction

In recent years, communication technologies such as satellite communication, mobile communication, and wireless local area networks have developed rapidly [1,2,3]. Media resonator-type filters have dominated the development of mobile communication systems. Microwave communication technology has been swiftly developed in dielectric resonator filters and numerous communication fields due to their characteristics [4,5,6,7]. Accordingly, the study of high-performance and stable microwave dielectric materials has become a current task. Microwave dielectric ceramics are widely used as indispensable electronic components because of their high dielectric constant (εr), high-quality factor (Q × f), and low-temperature coefficient of resonant frequency (τf) [8,9,10,11].
Microwave dielectric ceramics with the general formula of A(B′1/3B″2/3)O3 (A = Ba, Sr, Ca; B′ = Zn, Mg, Mn, Fe, Co, Ni, Cu; B″ = Nb or Ta) have been widely studied for their excellent microwave properties [9,12,13]. In recent years, in order to further promote the microwave dielectric properties and reduce the densification sintering temperature of ceramics, ion substitution and various additives were investigated in large-scale applications [14,15,16,17,18,19,20]. Especially in practical applications, it is important that the τf value should be adjusted to near zero. According to previous studies, ceramics with perovskite structures often show good microwave dielectric properties [21,22,23,24]. Among these materials, Ba(Zn1/3Nb2/3)O3 (BZN) ceramics have perovskite structure and good microwave dielectric properties of εr = 41, Q × f = 54,000 GHz and τf = 30 ppm/°C) [1]. BZN ceramics have been widely studied because of their lower dielectric loss and higher quality factor [13,15]. However, it cannot be put into practical application production because of the unacceptably high τf value. Adding different dopants to obtain BZN ceramics with a near-zero τf value is the focus of current research. Some studies on doping modification, such as A-site or B-site substitution for BZN ceramics, as shown below. The 0.95Ba (Zn1/3Nb2/3)O3 + 0.05BaZrO3 ceramics were studied and obtained good dielectric properties of εr = 42, Q × f = 96,000 GHz, and τf = 27 ppm/°C [25]. As reported by Yue [26], Ba[(Zn1−xCox)1/3Nb2/3]O3 (x = 0.8) ceramics could be well sintered at 1450 °C, and microwave dielectric properties of εr = 33, Q × f = 20,248 GHz and τf = −0.11 ppm/°C were achieved. Although the replacement of Co2+ to Zn2+ lowered the τf value to near zero, the Q × f value was seriously damaged. It was reported that Mg2+ substitution was used to improve the dielectric properties of BZN ceramics, yielding optimal dielectric properties of εr = 36, Q × f = 94,400 GHz, and τf = 28.6 ppm/°C for Ba(Zn1−xMgx)1/3Nb2/3)O3 ceramics at x = 0.4 [27]. Different proportions of La3+ and Ba2+ at the A-site in BZN were used to form solid solutions and obtained excellent dielectric properties of εr = 34, Q × f = 63,159 GHz and τf = 5.21 ppm/°C [13].
The above results indicated that B-site ion substitution could not simultaneously achieve near-zero τf value and high Q × f value for the BZN ceramics system; however, the A-site ion substitution could not only optimize the Q × f value but also tune the τf value to near zero. Therefore, this work focuses on improving dielectric properties of BZN ceramics by replacing Ba2+ with Sr2+ at A-site. Unlike BZN with cubic structure, Sr(Zn1/3Nb2/3)O3 (SZN) is generally regarded as a perovskite hexagonal ordered structure, whose microwave dielectric performance is generally manifested as εr = 36.8, Q × f = 36,800 GHz, τf = −25.2 ppm/°C [6]. After extensive investigation, Sr2+ doping will be used in this work to improve the microwave dielectric properties of BZN ceramics.
In this work, we hope that replacing Ba2+ with Sr2+ in different proportions can not only improve the dielectric properties of the ceramic system but also adjust the τf value to near zero. By controlling the sintering temperature, the Ba1−xSrx(Zn1/3Nb2/3)O3 ceramics were synthesized using the high-temperature solid phase method. The effects of Sr2+ concentrations on the microwave dielectric properties and crystal structure of BZN ceramics were investigated in detail. The relationship between the crystal structure and dielectric properties was obtained by employing Rietveld refinement.

2. Results and Discussion

Microwave dielectric properties of sintered ceramics are greatly affected by the relative density, which is related to the sintering temperature [6,9]. The relative densities of BSZN ceramics with different Sr2+ concentrations were obtained by sintering at 1425–1525 °C for 4 h, as shown in Figure 1. The relative density of the samples showed an overall increasing trend with the increasing sintering temperature. Nevertheless, the samples sintered at 1525 °C did not follow this trend, which was due to the decreased density caused by the evaporation of Zn2+ at higher temperatures [17]. For all samples sintered at 1425–1500 °C, it could be observed that the relative density firstly increased to the peak value at x = 0.2 and then decreased sharply with the increase in Sr2+ concentration. The optimum relative density of 99.7% was achieved at 1500 °C. Therefore, the samples sintered at 1500 °C are selected as the research object in this work.
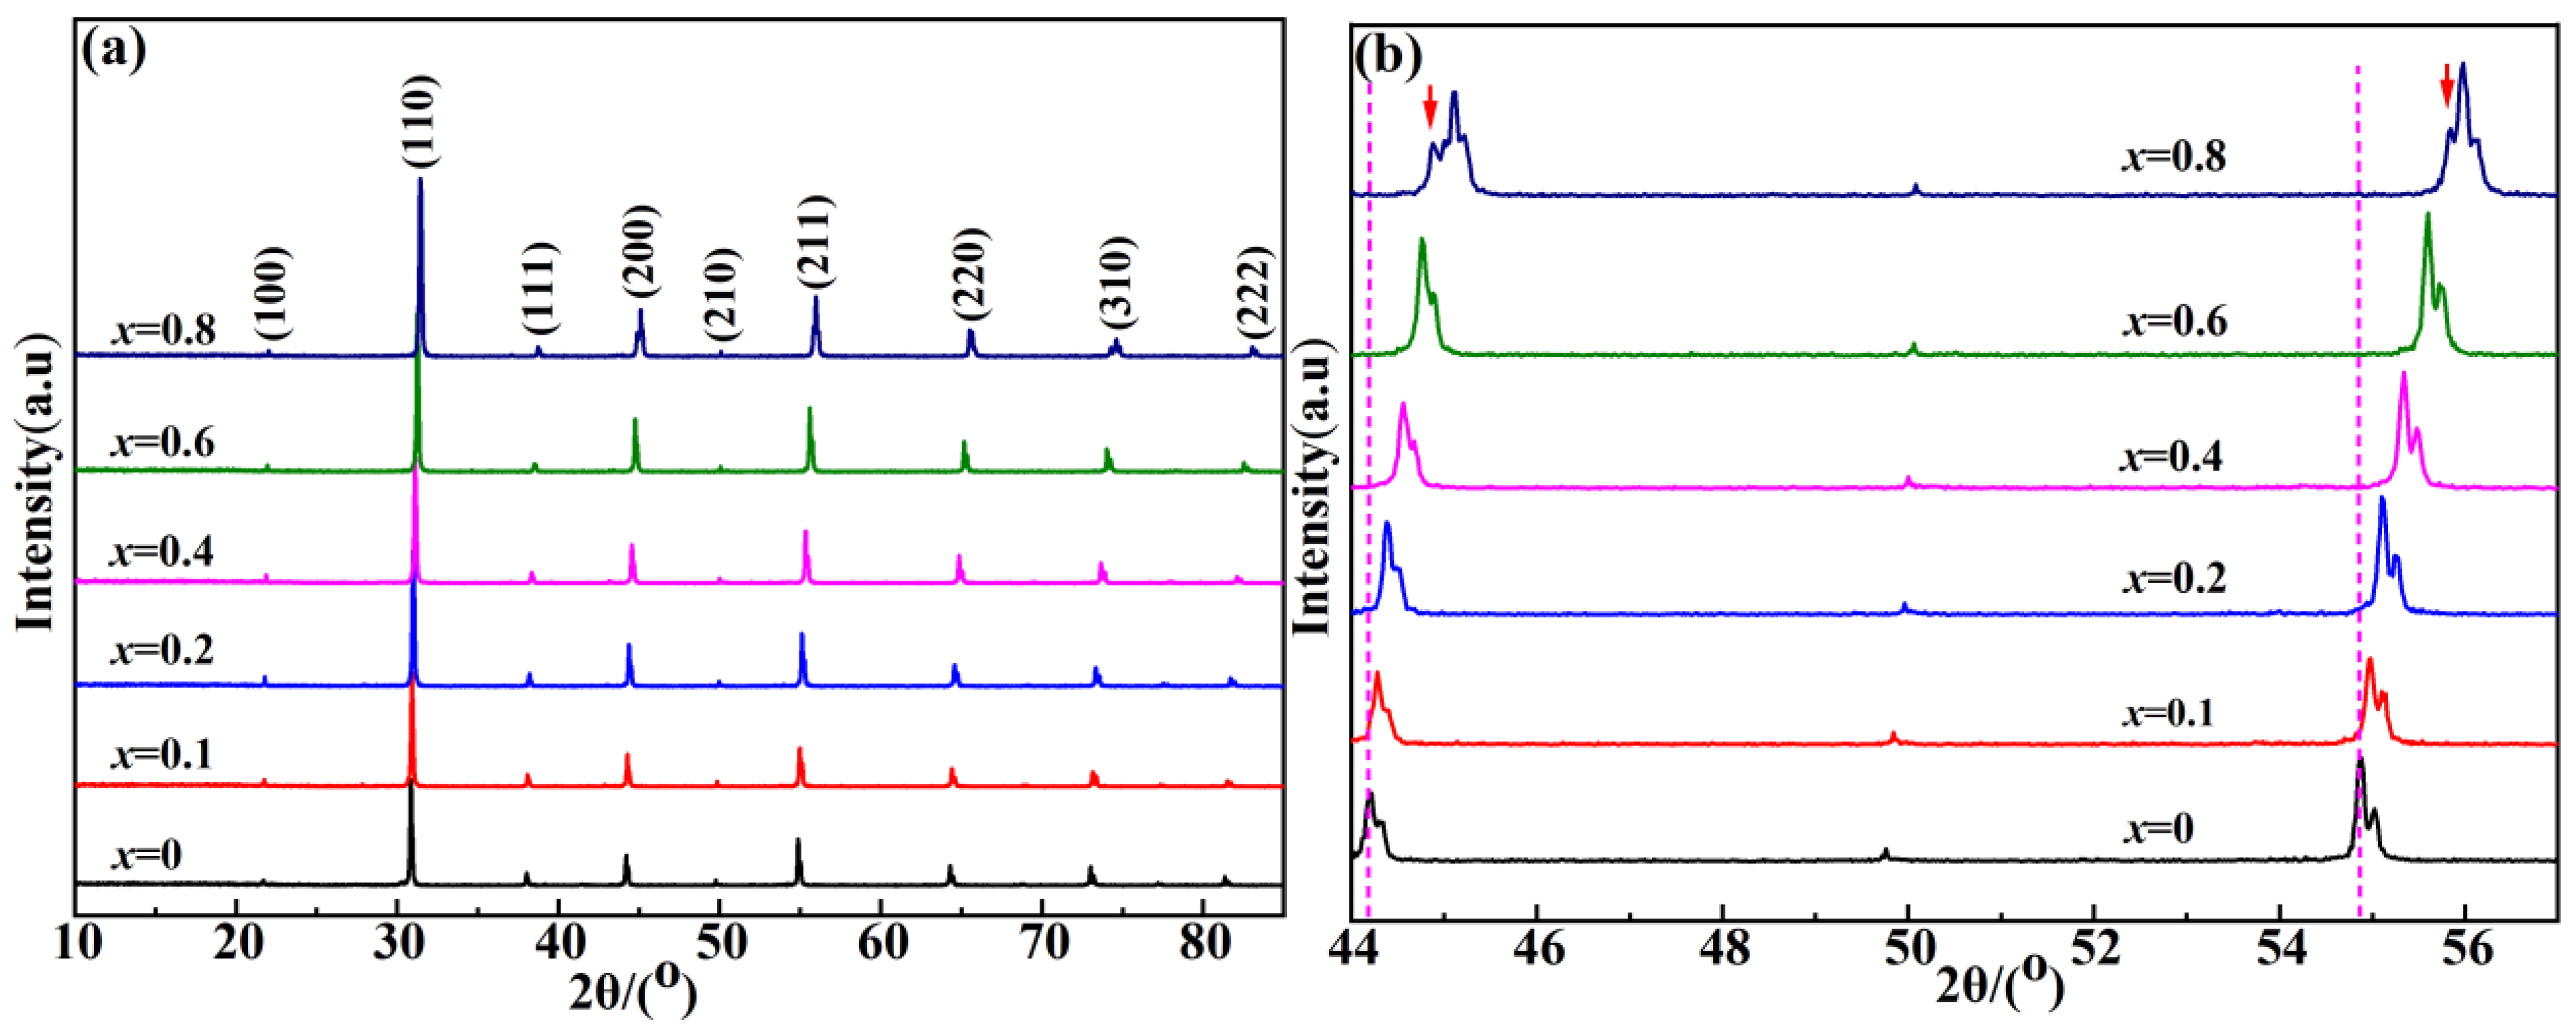
Figure 2a displays the XRD patterns of the samples prepared in this work sintered at 1500 °C for 4 h. The obtained patterns were compared with the standard JCPDS card No. 39-1474. It was found that all phases could be matched, indicating that the sample obtained in this work was a pure phase, and there were no redundant secondary phases or impurities. Additionally, no reflection peak was observed in the low-angle reflection region of 10–20°. For all samples, the peaks of (200) and (211) had some deviations, as shown in Figure 2b. According to the Bragg equation, this phenomenon was due to the successful formation of a solid solution, and the diffraction peak shifted to a higher angle as the ionic radius of Sr2+ was smaller than that of Ba2+. The reflection peaks (44–57°/2θ) are amplified and analyzed in Figure 2b. It was found that the broadening and splitting of reflection peaks (200) and (211) were clearly observed between x = 0.6 and x = 0.8, as shown by the downward arrows in Figure 2b. The broadening and splitting of reflection peaks were due to the presence of 1:2 ordering with the increasing Sr2+ concentration. This phenomenon indicated the transformation of crystal structure from the disordered phase at the beginning to the pseudocubic phase, where disordered phases and ordered phases coexisted [6]. The underlying reason for the occurrence of the phase transition was the tilting of the oxygen octahedron [5]. Tilting of the oxygen octahedron enables the phase transition from the disordered phase to the ordered phase, that was, symmetry reduction.
In order to better analyze the cubic structure of perovskite Ba1−xSrx(Zn1/3Nb2/3)O3 ceramics, the atomic position corresponding to the Ba(Zn1/3Nb2/3)O3 with cubic structure and Pm 3 - m space group was taken as the initial model. As shown in Figure 3a, the refinement data of Ba1−xSrx(Zn1/3Nb2/3)O3 (x = 0.2) were obtained by the Rietveld refinement method using FullProf software [19], including observed and calculated data, peak locations, and differences. Additionally, the optimum R factor and fitting results (Rwp = 9.61%, Rp = 6.1%, Rexp = 5.66%, and χ2 = 2.88) were achieved, which indicated that the data obtained in this work were reliable.
Figure 3b presents the crystal structure of BSZN ceramics. The crystal diagram of BSZN ceramics with perovskite cubic structure was obtained by editing the CIF (Crystal Information File) using VESTA software [28]. The results showed that the metal ions were located in the center of the oxygen octahedron, each connected by shared vertices. With the increase in Sr2+ content, Ba2+ was replaced by Sr2+, and the crystal structure parameters were changed gradually.
The lattice parameters, unit cell volume, and bond angle were obtained by the Rietveld refinement. Table 1 displays the crystallographic data achieved from the Rietveld refinement of Ba1−xSrx(Zn1/3Nb2/3)O3 ceramics. Careful examination of Table 1 showed that the lattice parameters (a, b, and c) and unit cell volume decreased monotonically with the increase in Sr2+ content, which was due to the difference in ionic radii between Sr2+ (1.44 Å) and Ba2+ (1.61 Å) [6]. The ionic radius of Sr2+ was smaller than that of Ba2+, resulting in the deterioration of lattice parameters and unit cell volume. In addition, combined with changes in the peaks (200) and (211) shown in the XRD pattern, the variations of the lattice parameters shown in Table 1 could be proven reasonable.
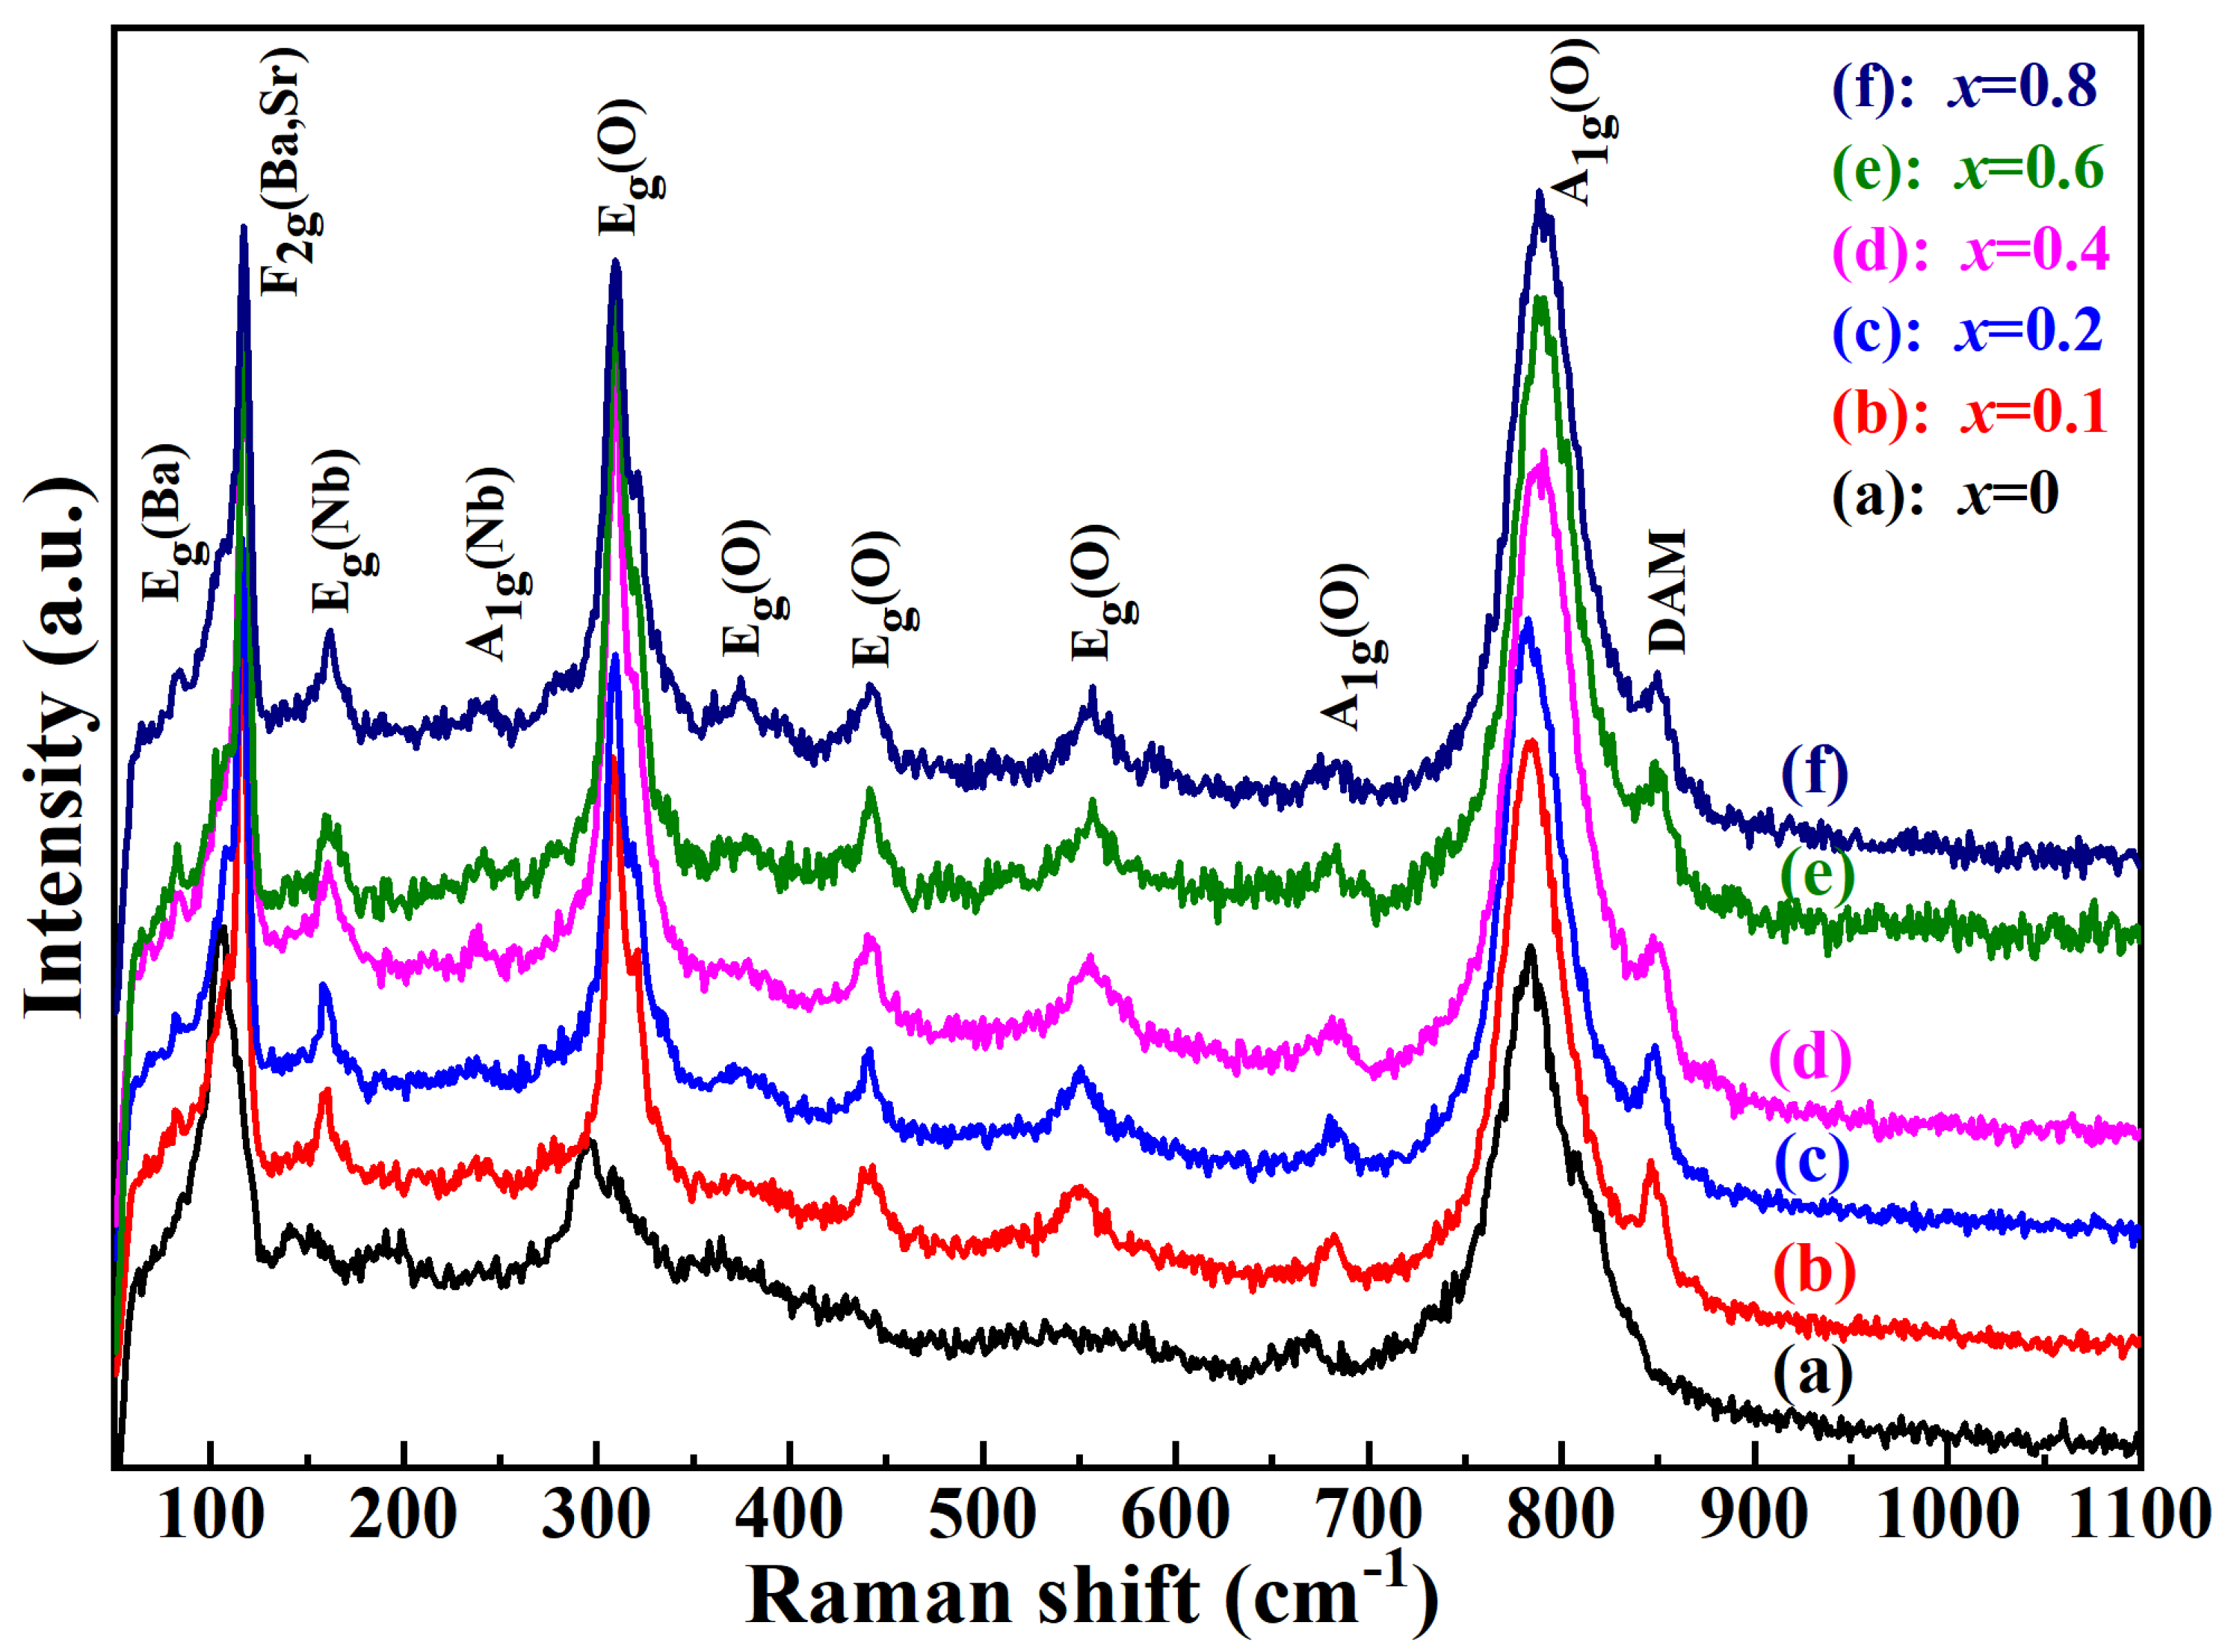
Figure 4 exhibits the Raman spectra of Ba1−xSrx(Zn1/3Nb2/3)O3 (x = 0–0.8) ceramics sintering at 1500 °C for 4 h. Raman spectroscopy was sensitive to the subtle changes in crystal structure and cation substitution [2], thus it was used as a characterization technique to study the crystal structure of the samples. As shown in Figure 4, 4 active modes were observed, which were related to the spectra of the 1:1 ordered perovskites with Fm 3 - m symmetry, and the position of the peaks shown in the Raman spectra were recorded separately in the (1) F2g(Ba, Sr) phonon modes around 105 cm−1, (2) the Eg(O) phonon modes close to 380 cm−1, (3) the Eg(O) phonon modes in the range of 430–450 cm−1, and (4) the A1g(O) phonon modes near 800 cm−1, corresponding to the stretch vibration of oxygen octahedron [22]. As shown in Figure 4, the F2g(Ba, Sr) modes (A1g + Eg), loaded at ~105 cm−1, correlated with a 1:1 ordered structure, which was attributed to the vibration of Ba and Sr atoms against the oxygen octahedron [2]. As shown in Figure 4, the peaks located at 150–350 cm−1 were associated with the 1:2 ordered phase [22]. The Eg(Nb) modes near 171 cm−1 and 263 cm−1 originated from the vibration of Nb atoms, and the Eg(O) modes near 300 cm−1, 376 cm−1, and 548 cm−1 arose from the twisting vibration of oxygen octahedrons along different directions. Additionally, the A1g(O) mode near 788 cm−1 was assigned as the stretching breath vibration of oxygen octahedrons along the c-axis, which could be used as an important identification method for different types of B-site ordering [2]. It was reported that the peak near 680 cm−1 was also regarded as A1g(O) mode, which was closely related to the localized 1:1 ordering [16,19,21]. Ultimately, the peak located at nearly 846 cm−1 was considered a defect-activated mode (DAM). It was reported that this mode was an active mode around the A1g(O) mode, which might be correlated with micro-defects such as complex boundaries [2]. Raman phonon mode was not only related to the crystal structure but also sensitive to the dielectric properties of sintered ceramics. The relationship between the FWHM of A1g(O) and Q × f value with Sr2+ concentration is shown in Figure 10.
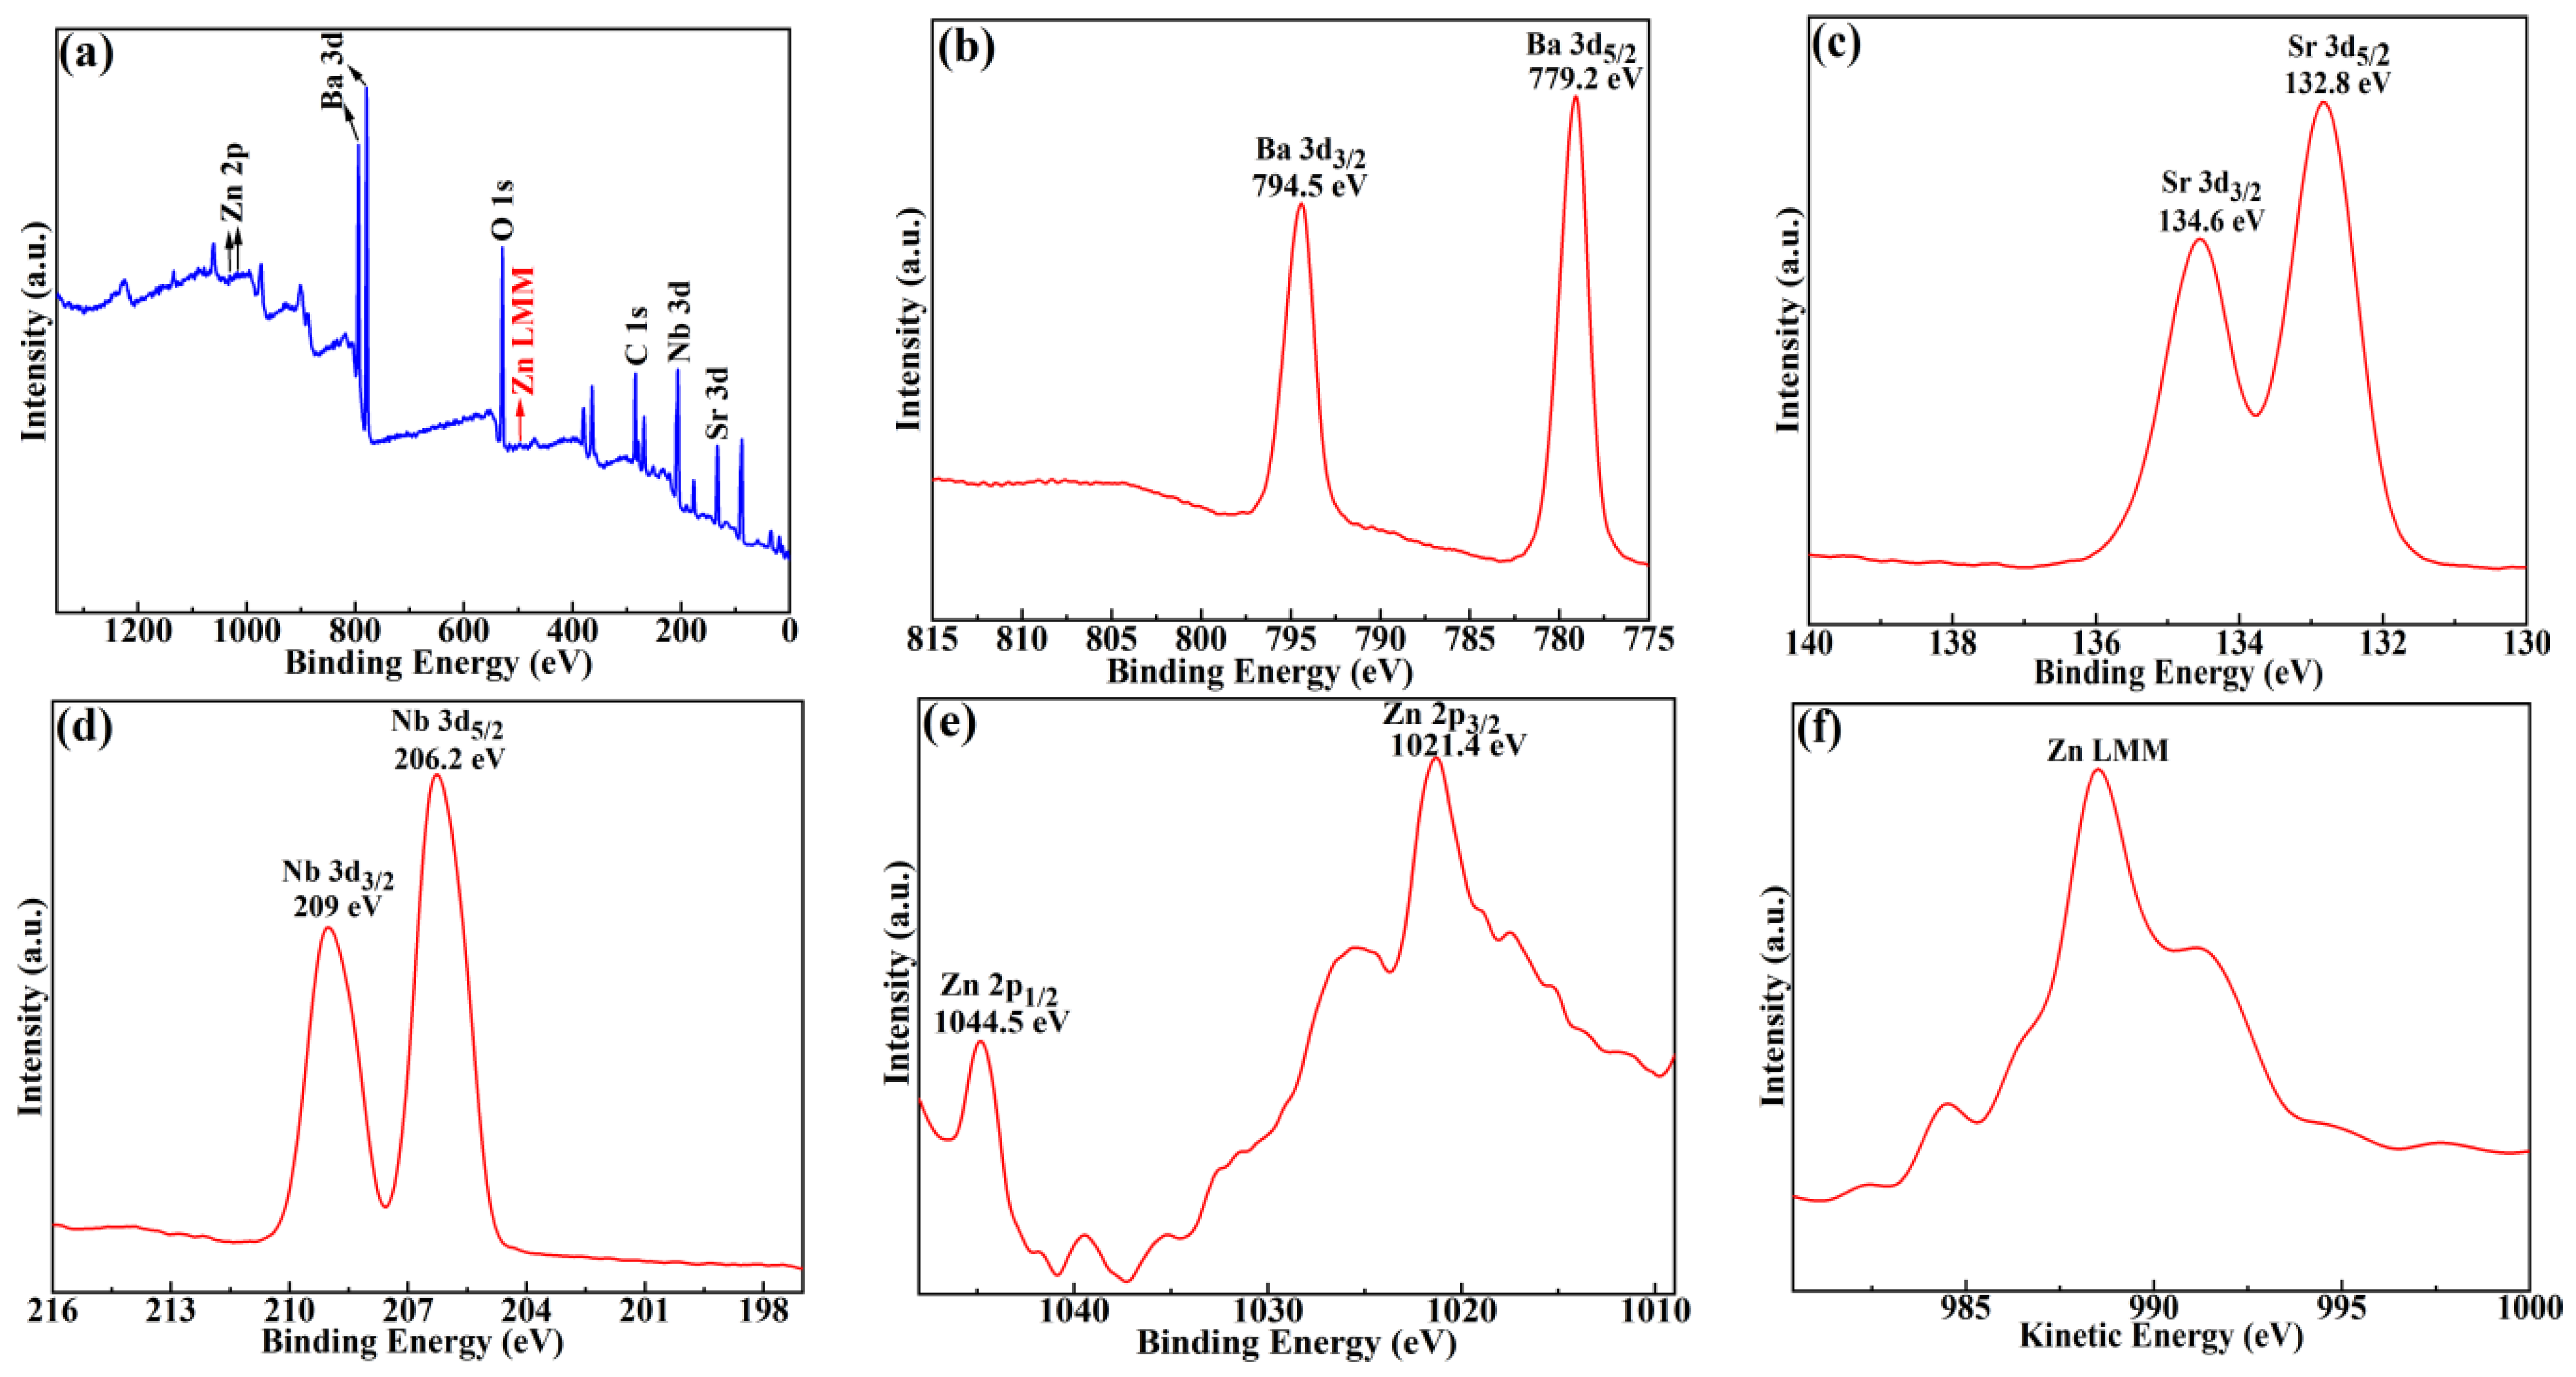
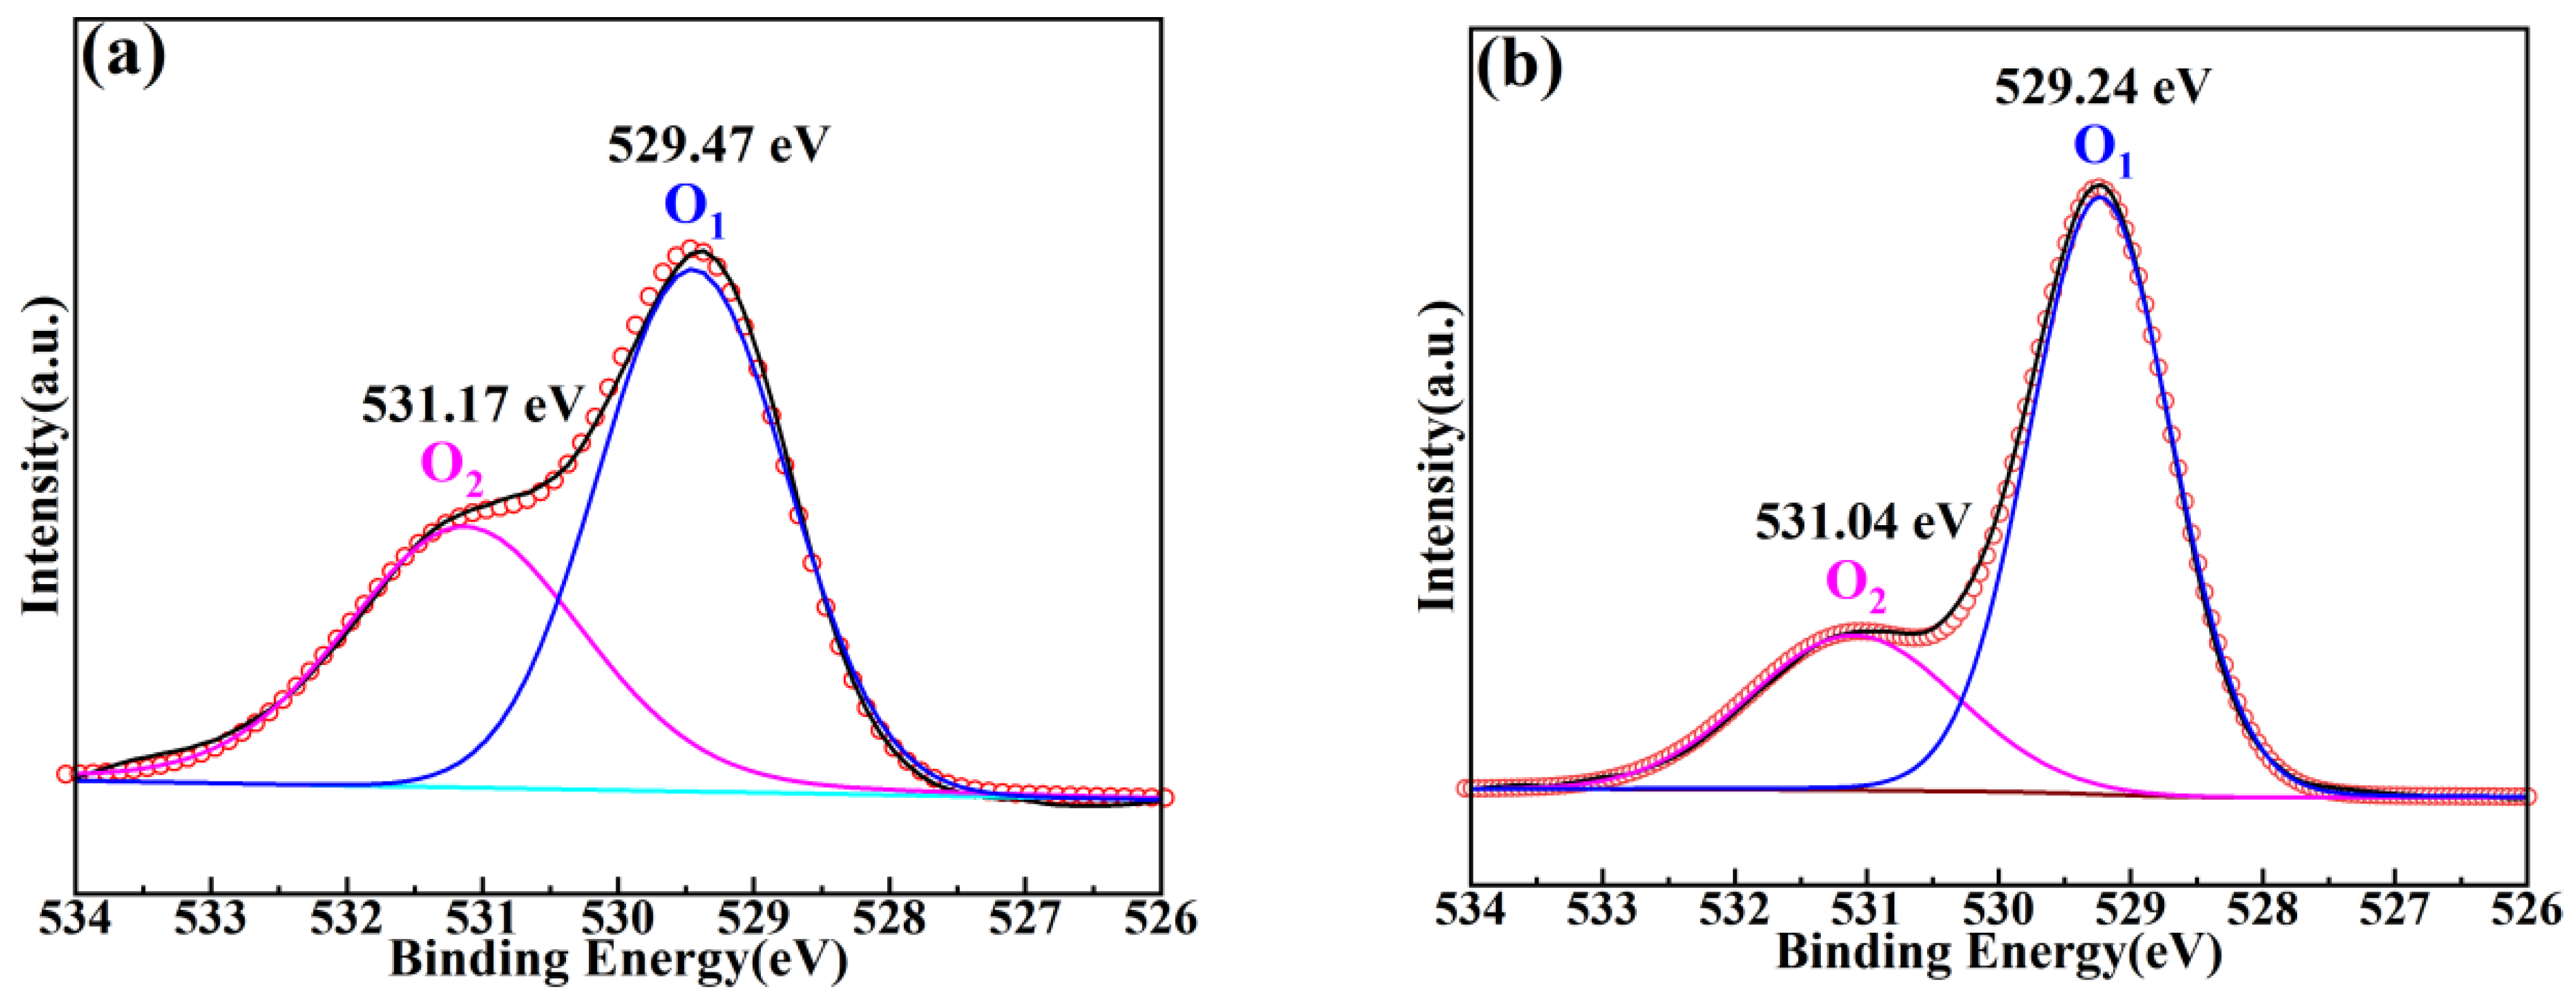
Figure 5 represents the XPS spectra of BSZN ceramics sintered at 1500 °C for 4 h. The presence of Ba 3d, Sr 3d, Zn 2p, Zn LMM, Nb 3d, O 1s, and C 1s in BSZN ceramics was determined by XPS analysis. The XPS data obtained in this work were all corrected for charge with reference to the C 1s peak of 284.8 eV. The narrow scan XPS spectrum of Ba 3d for BSZN ceramics was shown in Figure 5b, which consisted of spin-orbit doublet peaks Ba 3d5/2 and Ba 3d3/2 observed at 779.2 and 794.5 eV, respectively. Additionally, the difference between the 2 peaks after spin splitting was 15.3 eV, which was in good agreement with the characteristic spectrum of Ba2+ in XPS [24]. This phenomenon demonstrated the existence of Ba2+ in samples. The Sr 3d spectrum shown in Figure 5c displayed greatly separated spin-orbit 3d5/2 and 3d3/2 components (Δ = 1.4 eV) at 132.8 and 134.2 eV, corresponding to the characteristic spectrum of Sr with a valence of +2 [29]. The peaks of 3d5/2 and 3d3/2 of Nb for BSZN ceramics shown in Figure 5d were at 206.2 and 209 eV, respectively, with a difference of 2.8 eV, which was indexed to Nb5+ [30]. Unfortunately, the peak positions between Zn0 and Zn2+ tended to overlap, as shown in Figure 5e. So, Zn2+ was not possible to directly confirm from only the Zn 2p spectra. Therefore, it could be verified only by investigating the Zn LMM Auger spectrum, as shown in Figure 5f. The comparison of the Zn LMM Auger spectrum revealed the bigger chemical shifts of Zn2+ compared to Zn0, so the chemical state of Zn in BSZN ceramics could be assigned as Zn2+ [31]. The spectra of O 1s for an undoped sample and the sample with x = 0.2 were identified by peak fitting technique, and each of the O 1s could be divided into two peaks, as shown in Figure 6. The dominant peak (O1) for an undoped sample and the sample with x = 0.2 was loaded at 529.47 eV and 529.24 eV, respectively, assigned as O2− [28]. Additionally, 2 shoulder peaks (O2) were all loaded at 531–533 eV, which was caused by the hydrocarbonates formation at the sample surface [32]. Moreover, with the incorporation of Sr2+, the peak positions of O1 and O2 all shifted to low binding energy, and the intensity ratios between O2 and O1 gradually decreased, with values of 13:20 and 9:20, respectively, which were caused by the replacement of Ba2+ with Sr2+ in Ba(Zn1/3Nb2/3)O3 ceramics. The above analysis demonstrated that the chemical states of Ba, Sr, Zn, Nb, and O were +2, +2, +2, +5, and −2, respectively.
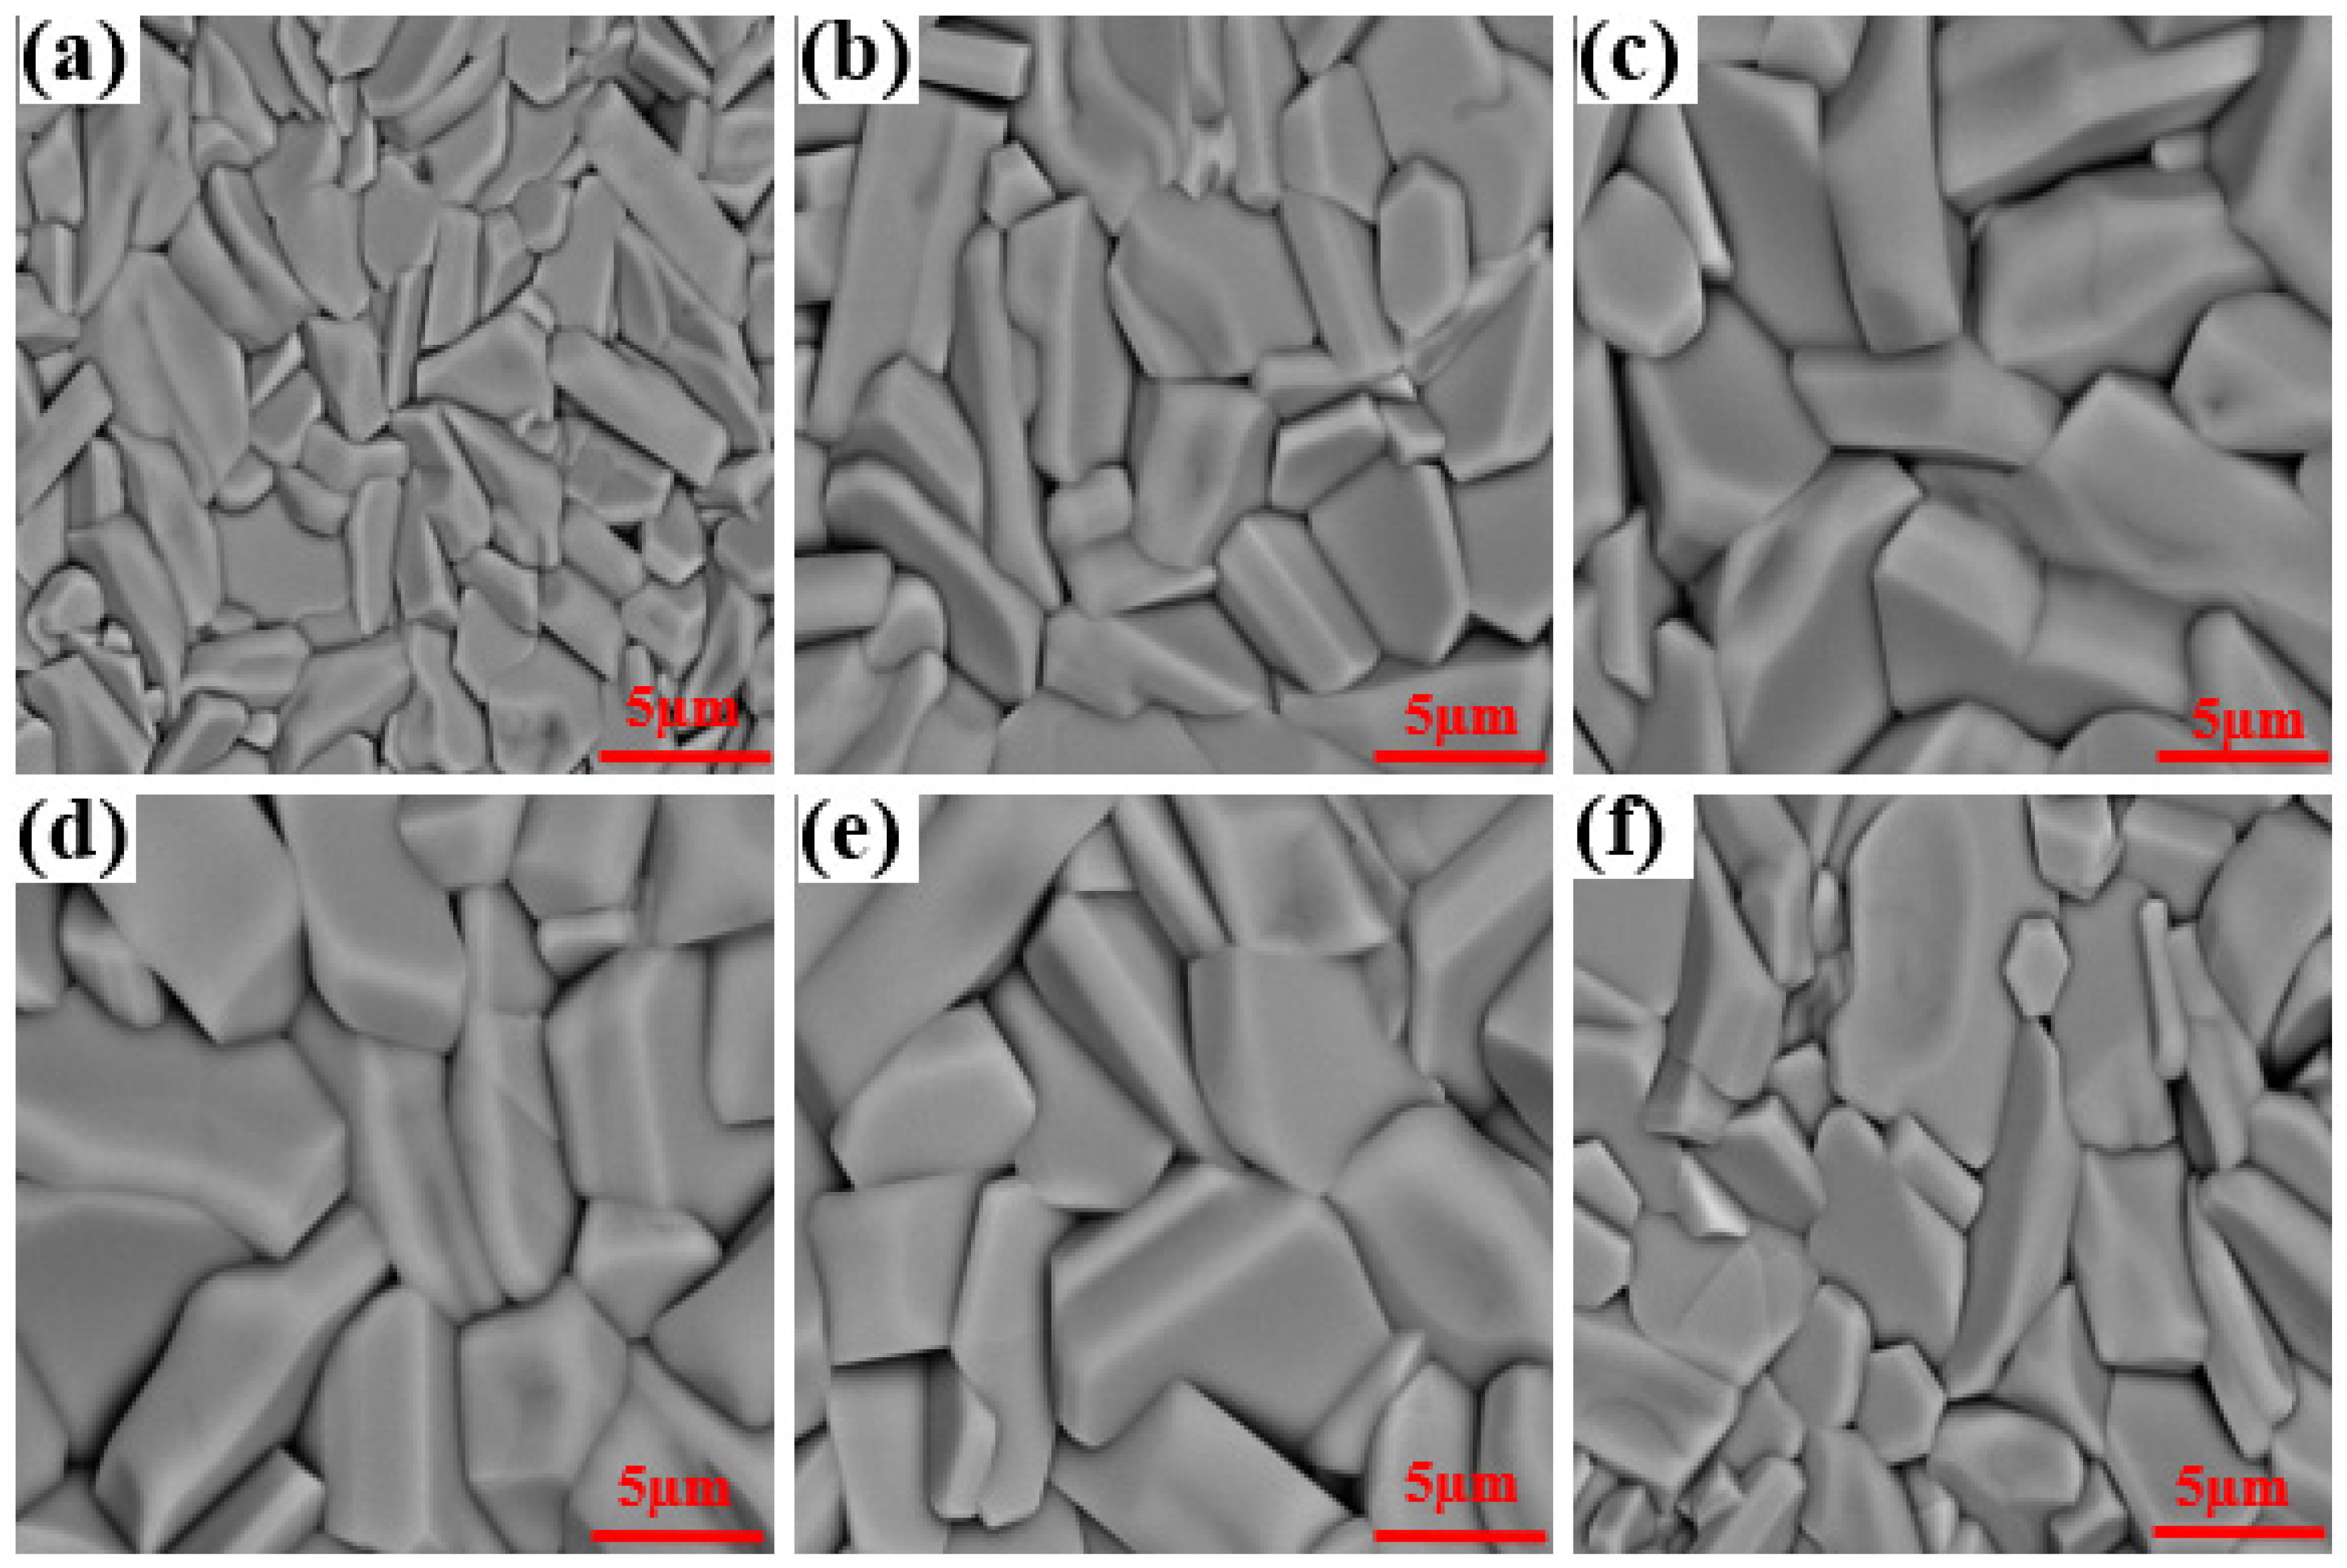
Figure 7 displays the Backscatter SEM photographs of polished and annealed treatment fracture surfaces of Ba1−xSrx(Zn1/3Nb2/3)O3 ceramics sintered at 1500 °C for 4 h. The porosity and grain size were greatly affected by Sr2+ concentration. As x ≤ 0.2, with the increasing of Sr2+ concentration, the porosity gradually decreased, whereas the average grain size started to increase correspondingly, as presented in Figure 8, acquiring a maximum relative density of 99.7%. Notably, abnormal grains emerged at x ≥ 0.4, as displayed in Figure 7d–f. Abnormal grains could damage the microstructure of the samples, subsequently influencing the dielectric properties of the ceramic system [33].
Table 2 demonstrates the EDS analysis of the overall fracture surface for the BSZN ceramics with different Sr2+ concentrations. The EDS mapping and corresponding spectra for all samples are shown in Figures S1–S6. The results presented that the Sr atom ratio increased with Sr2+ concentration. The proportion of Zn deviated from the stoichiometric ratio in the chemical formula, as observed in Table 2, which was attributed to the volatilization of ZnO during the high-temperature sintering process [18]. As shown in Table 2, it could be seen that the sample with x = 0 presented a Ba/Nb elemental molar ratio of 26.71:17.59, close to that in Ba(Zn1/3Nb2/3)O3. For all samples except x = 0, the ratio of (Ba + Sr)/Nb was basically maintained at 1.5:1, corresponding to a combination of BZN and SZN, which also proved the formation of a solid solution.
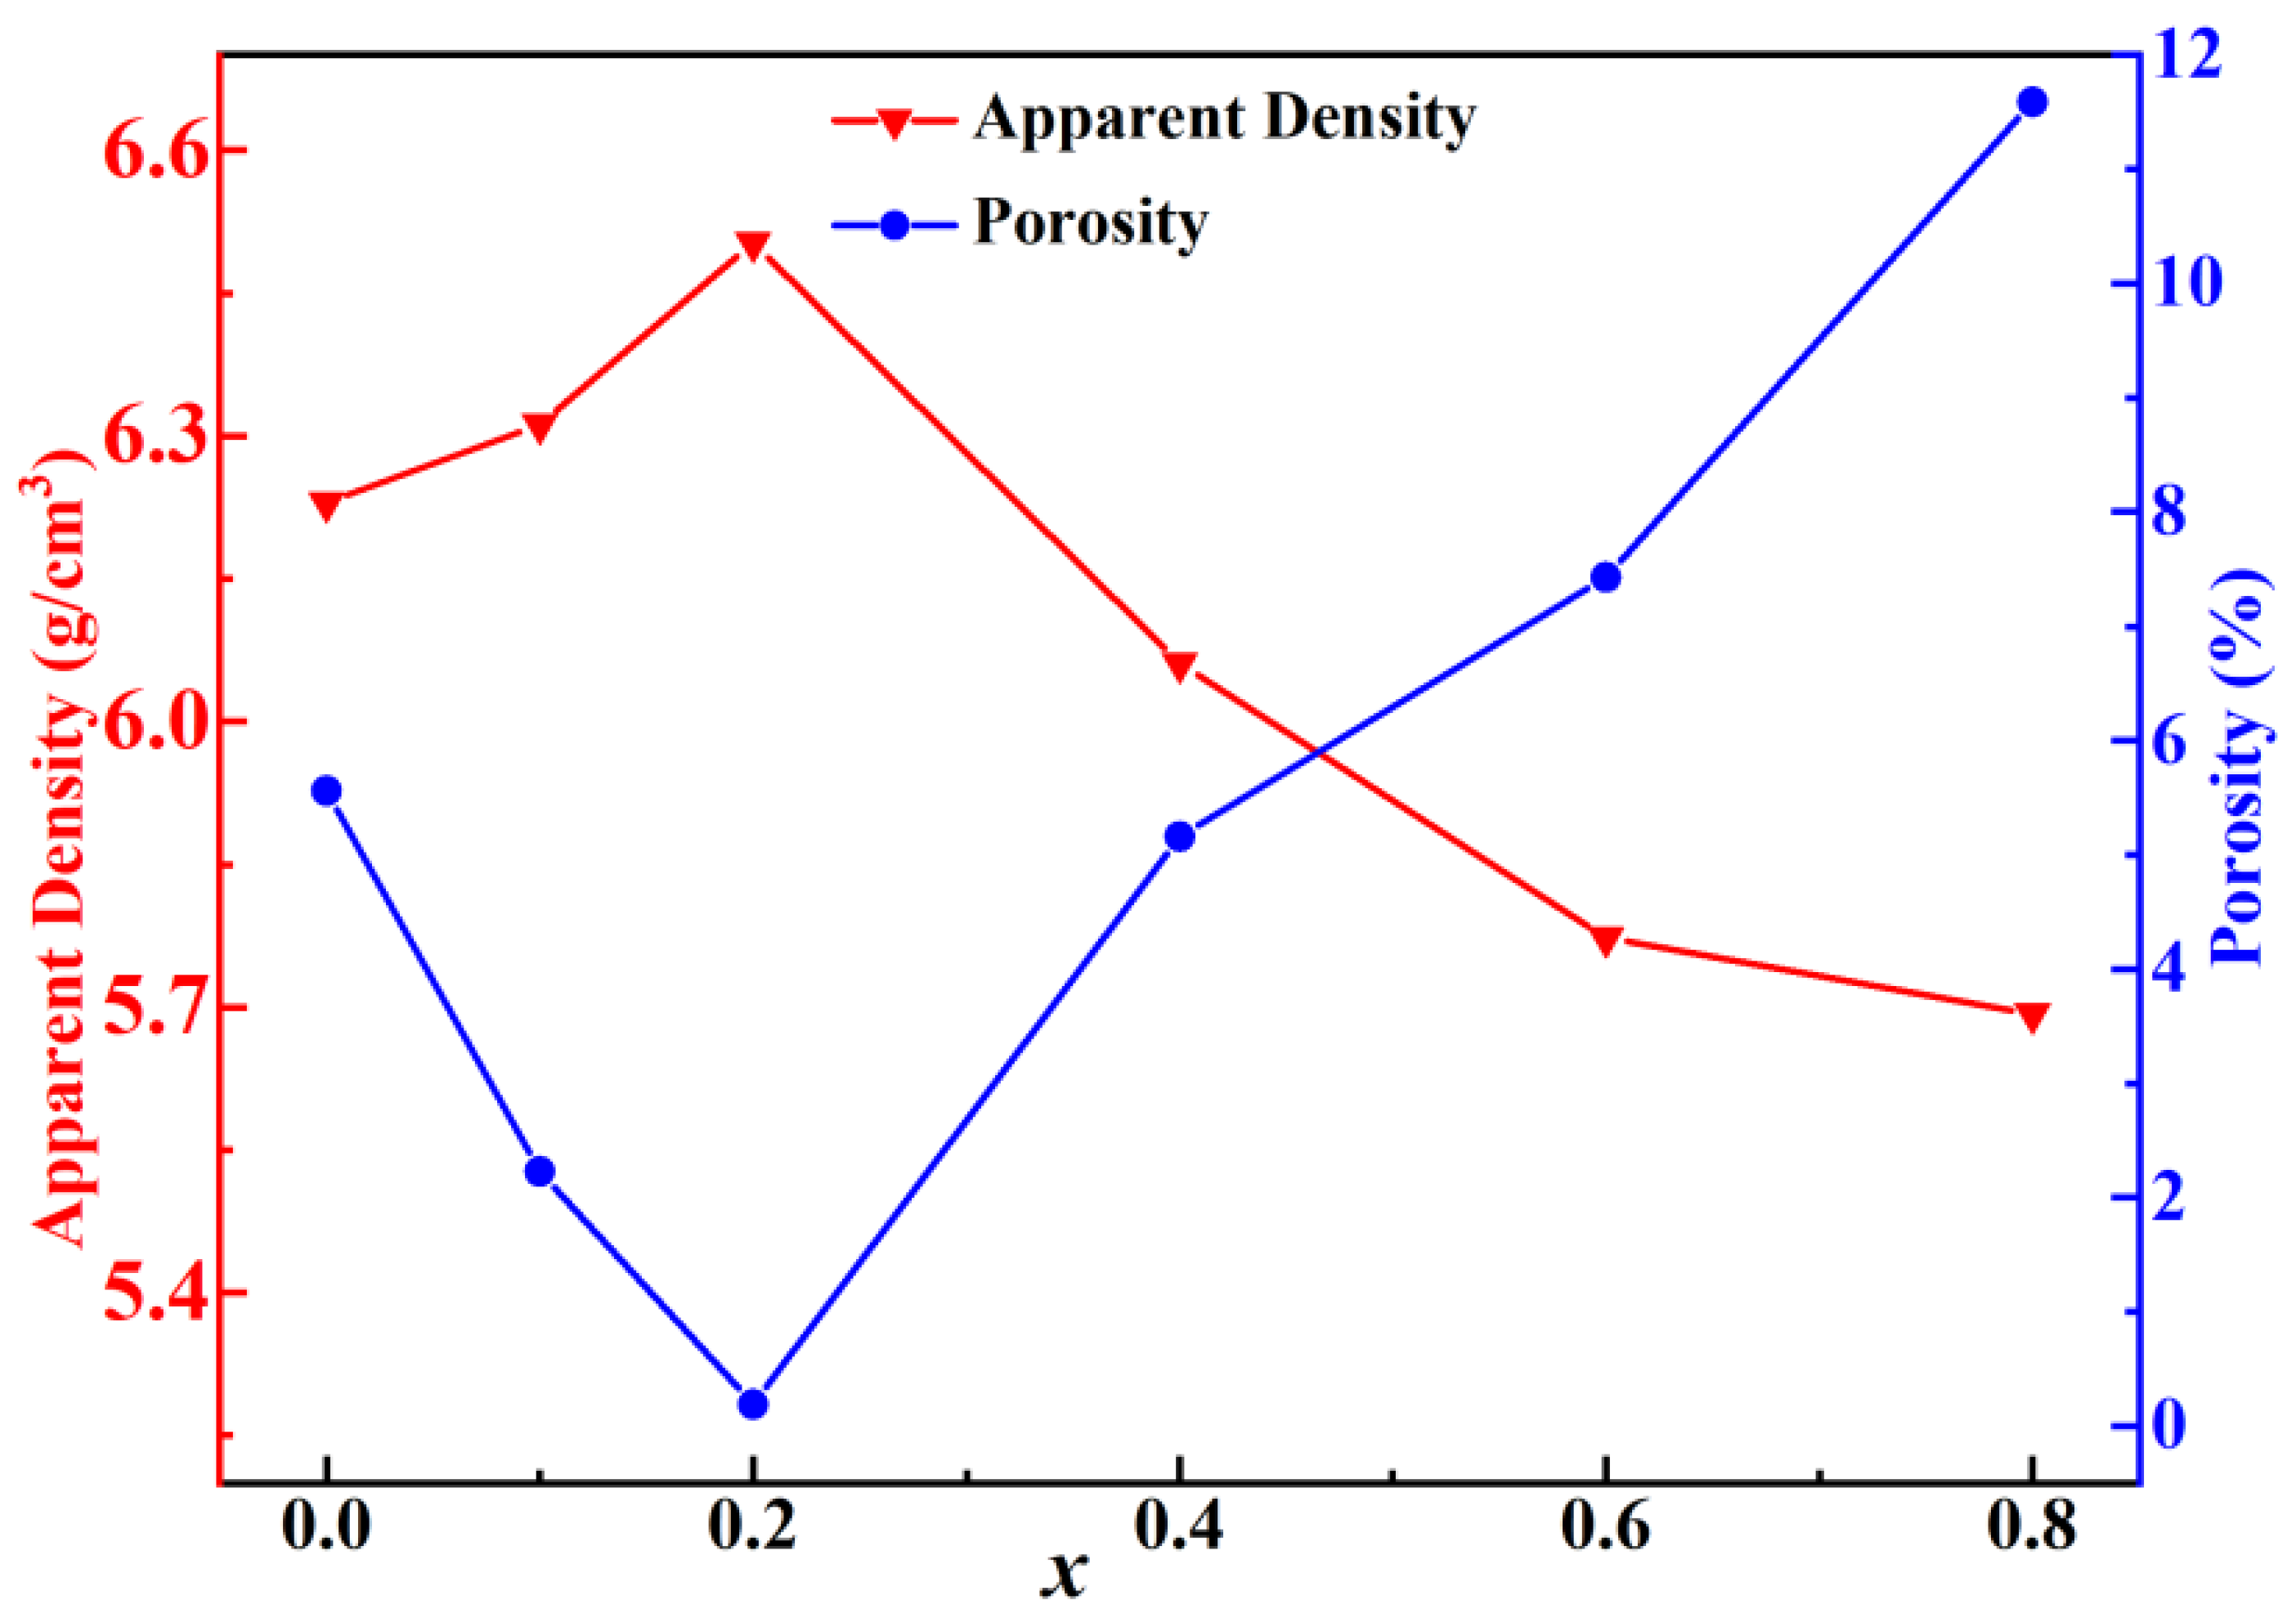
Figure 9 reveals the relationship between the apparent density and porosity of the samples sintered at 1500 °C for 4 h. The overall apparent density showed a trend of first increasing and then decreasing with the increase in Sr2+ concentration. With the increasing of Sr2+ concentration, the apparent density firstly increased to the maximum value of 6.503 g/cm3 at x = 0.2, which was attributed to the successful formation of the solid solution by the substitution of Sr2+ for Ba2+ and the uniform grain growth shown in Figure 7c. At x > 0.2, the apparent density displayed a downward tendency accompanied by increasing porosity with Sr2+ concentration. Combined with Figure 7, this phenomenon was attributed to the increased pores caused by abnormal grain growth. The reaction-sintering manner was once more proved to obtain extraordinarily dense ceramic pellets.
The PVL theory of chemical bonding, developed by Phillips, Van Vechten, and Levine, is a dielectric description of chemical bonds in crystal structures. In this work, the PVL theory was used to split the crystal structure of Ba1−xSrx(Zn1/3Nb2/3)O3 (x = 0–0.8) ceramics into the following bonding formulas, such as the AmBn form:
Ba 3 3 x Sr 3 x ZnNb 2 O 9 =   ( Ba 3 3 x Sr 3 x ) ( 1 ) 1 / 2 O ( 1 ) 1 + ( Ba 3 3 x Sr 3 x ) ( 1 ) 1 / 2 O ( 2 ) + ( Zn 1 Nb 2 ) 1 O ( 2 ) 1 + ( Nb 1 Zn 2 ) 1 O ( 1 ) 1 + ( Nb 1 Zn 2 ) 1 O ( 2 ) 1 + ( Ba 3 3 x Sr 3 x ) ( 2 ) 1 / 2 O ( 1 ) 1 + ( Ba 3 3 x Sr 3 x ) ( 2 ) 3 / 2 O ( 2 ) 3 ,
Generally speaking, the bond ionicity (fi) was closely related to the dielectric constant, and the specific relationship was as follows:
ε r = n 2 1 1 f i + 1 ,
where n was a refractive index that could be considered a constant. fi and εr were determined to be a positive relationship where εr increased with the increase in fi.
The calculation of PVL for the ionic and covalent properties of BSZN ceramics involved the following Equations (3)–(7) [34]:
f i μ = C μ 2 E g μ 2 ,
f c μ = E h μ 2 E g μ 2 ,
E g μ 2 = E h μ 2 + C μ 2 ,
E h μ = 39.74 / d μ 2.48 ,
C μ = 14.4 b μ exp ( κ s μ r 0 μ ) × [ m n Z A μ * Z B μ * ] / r 0 μ ,
f i μ and f c μ were defined as the ionic and covalent values of the μ bond, respectively. E g μ was interpreted as the average energy band, part of which was composed of isotropic polarization E h μ determined by the covalence of chemical bonds, where d μ was defined as the length of the μ bond. The m and n were determined as the number of anions and cations in AmBn, respectively. r 0 μ was defined as the ionic radius of the μ bond. The heteropole part C μ shown in Equation (7) was determined by the correction factor ( b μ ), the effective valence electron number Z A μ * , Z B μ * , and the Thomas–Fermi shielding factor exp ( κ s μ r 0 μ ) was determined according to the following Equations (8)–(10) [35]:
κ s μ = 4 k F μ π α B 1 2 ,
( k F μ ) 3 = 3 π 2 ( N e μ ) * ,
( N e μ ) * = n μ * v b μ ,
where α B was the Bohr radius whose value was regarded as a constant of 0.5292 Å. k F μ was calculated from the μ bond n μ * and the bond volume ( v b μ ), corresponding to Equations (11) and (12).
( n μ ) * = Z A * N c A μ + ( Z B ) * N c B μ ,
v b μ = ( d μ ) 3 v ( d μ ) 3 N b v ,
where N c A μ , N c B μ were the coordination numbers of A and B atoms attached to μ bonds in a cell, respectively. N b v was defined as the bond density of μ-bonds (number of μ bonds in 1 cm3), which could be obtained from the refined crystal structure. The bond energy (Eb) was closely related to the τf value of ceramic materials [36], whose definition was shown in Equations (13)–(18):
E =   E b μ ,
Eb = tcEc + tiEi,
1 = ti + tc,
t i = | ( S A S B ) / S B 2 | ,
E i = 33,200 d μ ,
E c = ( r c A + r c B ) d μ ( E A A E B B ) 1 / 2 ,
where EA−A and EB−B were defined as homonuclear bond energies, tc and ti were covalent and ionic co-mixing factors, SA and SB represented the electronegativity of A and B ions, and ΔSB represented the change in electronegativity with a value of 3.01. Ei and Ec were determined as the energies contributed by the ionic and covalent bonds, respectively.
It is well known that the lattice energy (Ub) was an intrinsic influence on the variation of the Q × f value, and it was defined as a concept representing the binding capacity between ions. The Ub value could be calculated by the following Equations (19)–(21):
U b μ = U b c μ + U b i μ ,
U b c μ = 2100 m ( Z + μ ) 1.64 ( d μ ) 0.75 f c μ ,
U b i μ = 1270 ( m + n ) Z + μ Z μ d μ 1 0.4 d μ f i μ ,
where U b i μ and U b c μ represented the lattice energy of the ionic part and the covalent part of the constituent Ub, respectively. m and n were the parameters of the AmBn binary system. Z + μ and Z μ represented the parameters of the cationic and anionic valence states, respectively.
Table 3 shows the ionic and covalent properties of the different bonds in the BZN ceramics sintered at 1500 °C for 4 h, which were obtained by the PVL theory. As shown in Table 3, the ionicity magnitudes in BZN ceramics revealed that fi(Ba-O) > fi(Nb-O) > fi(Zn-O), where the ionicity of Ba-O bond reached a maximum of 85.80%. Therefore, the substitution of Ba sites could effectively improve the microwave dielectric properties of Ba(Zn1/3Nb2/3)O3 ceramics, and the experimental results were shown in the following analysis.
It was reported that εr was largely influenced by the polarizability of the materials, density, and porosity [21,22]. In order to study the changing trend of εr, the theoretical dielectric polarizability (αtheo) reported by Shannon et al. was invoked as formulated in Equation (22) [37].
αtheo = α(Ba1–xSrx(Zn1/3Nb2/3)O3) = xα(Sr2+) + (1 – x)α(Ba2+) + 1/3α(Zn2+) + 2/3α(Nb5+) + 3α(O2−),
where α(Sr2+) = 4.24 Å3, α(Ba2+) = 6.40 Å3, α(Zn2+) = 2.04 Å3, α(Nb5+) = 3.97 Å3, α(O2−) = 2.01 Å3. On the basis of the Clausius–Mossotti equation [37], the relationship between εr and observed dielectric polarizability (αobs) was defined as follows:
α obs = V m ( ε r 1 ) b ( ε r + 2 ) ,
where εr, Vm and b′ were the measured dielectric constant, molar volume (Vcell/Z) and a constant (4π/3), respectively. Furthermore, the deviation (Δ) between αtheo and αobs of Ba1–xSrx(Zn1/3Nb2/3)O3 obeyed
Δ = | α o b s α t h e o α o b s × 100 % | .
The relationships of αtheo, αobs, and εr are listed in Table 4. It could be directly observed from Table 4 that αtheo and αobs showed the same decreasing trend. This phenomenon was caused by the difference between α(Sr2+) and α(Ba2+). However, εr firstly increased to the maximum value of 45.25 at x = 0.2 and then decreased. When x ≤ 0.2, the upward trend of εr was attributed to the fact that the higher density occupation of the sample determined the dominance of εr. As the Sr2+ concentration further increased for x > 0.2, εr started to decrease with the decreasing of αtheo and αobs, which was primarily determined by ionic polarizability [1]. Careful examination of Table 4 showed that the variation of αtheo was in good agreement with that of αobs, which indicated that the deterioration of εr was mainly attributed to the lower ionic polarizability of Sr2+ compared with that of Ba2+. The formation of deviation (Δ) was mainly because αtheo and αobs were derived from many semi-empirical equations of oxides and fluorides. Moreover, as shown in Table 4, the obtained deviations were so small that the results were reliable.
With the addition of Sr2+, the atomic interactions in Ba1−xSrx(Zn1/3Nb2/3)O3 solid solutions were elongated or compressed inevitably, resulting in structural variations. The bond length of the oxygen octahedron was correlated with the lattice energy and bond iconicity. Moreover, the variation of oxygen octahedrons had a strong effect on the dielectric properties. Thus, the octahedral distortion of BSZN ceramics sintered at 1500 °C for 4 h was calculated using the octahedral distortion formula [4].
Octahedral   distortion   ( Δ octahedral ) = 1 6 ( R i R R ) 2 ,
where Ri and R were the individual bond length and average bond length of oxygen octahedrons, respectively.
Vij was defined as the sum of all of the valences from a given atom i, and this was calculated in Equations (26) and (27) [38]:
V ij = v i j ,
v ij = exp R i j d i j b ,
where Rij represented the bond valence parameter, dij indicated the length of a bond between atoms i and j, and b’ was a universal constant with a value of 0.37 Å.
Table 5 records the variations of bond length, octahedral distortion, bond energy, and τf value for Ba1−xSrx(Zn1/3Nb2/3)O3 (x = 0–0.8) ceramics with the increasing Sr2+ concentration. As shown in Table 5, the variation range of the τf value for all samples was 27.72~−15.72 ppm/°C, and the τf value displayed a downward tendency with the increasing of Sr2+ concentration. Generally speaking, the τf value depended very strongly heavily on the bond energy, the distortion of the oxygen octahedron and the bond valence changes in the constituent ions [39]. For one thing, Eb was defined as the binding capacity of the bond between the cation and the anion, which was inversely related to the absolute value of τf. This phenomenon was attributed to the fact that the crystal structure was highly dependent on the value of Eb. With the increasing Eb value, the crystal structure of the sample became more and more stable, and then the absolute value of τf decreased. Similar changes in the two parameters shown in Table 5 also proved that the larger the Eb value, the more stable the crystal structure. Simultaneously, the corresponding τf was close to zero. For another, with the increase in B-site bond valence, the degree of tilting on oxygen octahedrons and the bond strength between B-site cation and oxygen increased. Consequently, the restoring force to the tilting recovers increased, thereby resulting in a decrease of τf value. Therefore, the main reason for the change of τf value from positive to negative was ascribed to the three factors: bond energy, distortion of the oxygen octahedron, and B-site bond valence. At last, a near-zero τf value of 1.26 ppm/°C could be acquired for the sample with x = 0.2.
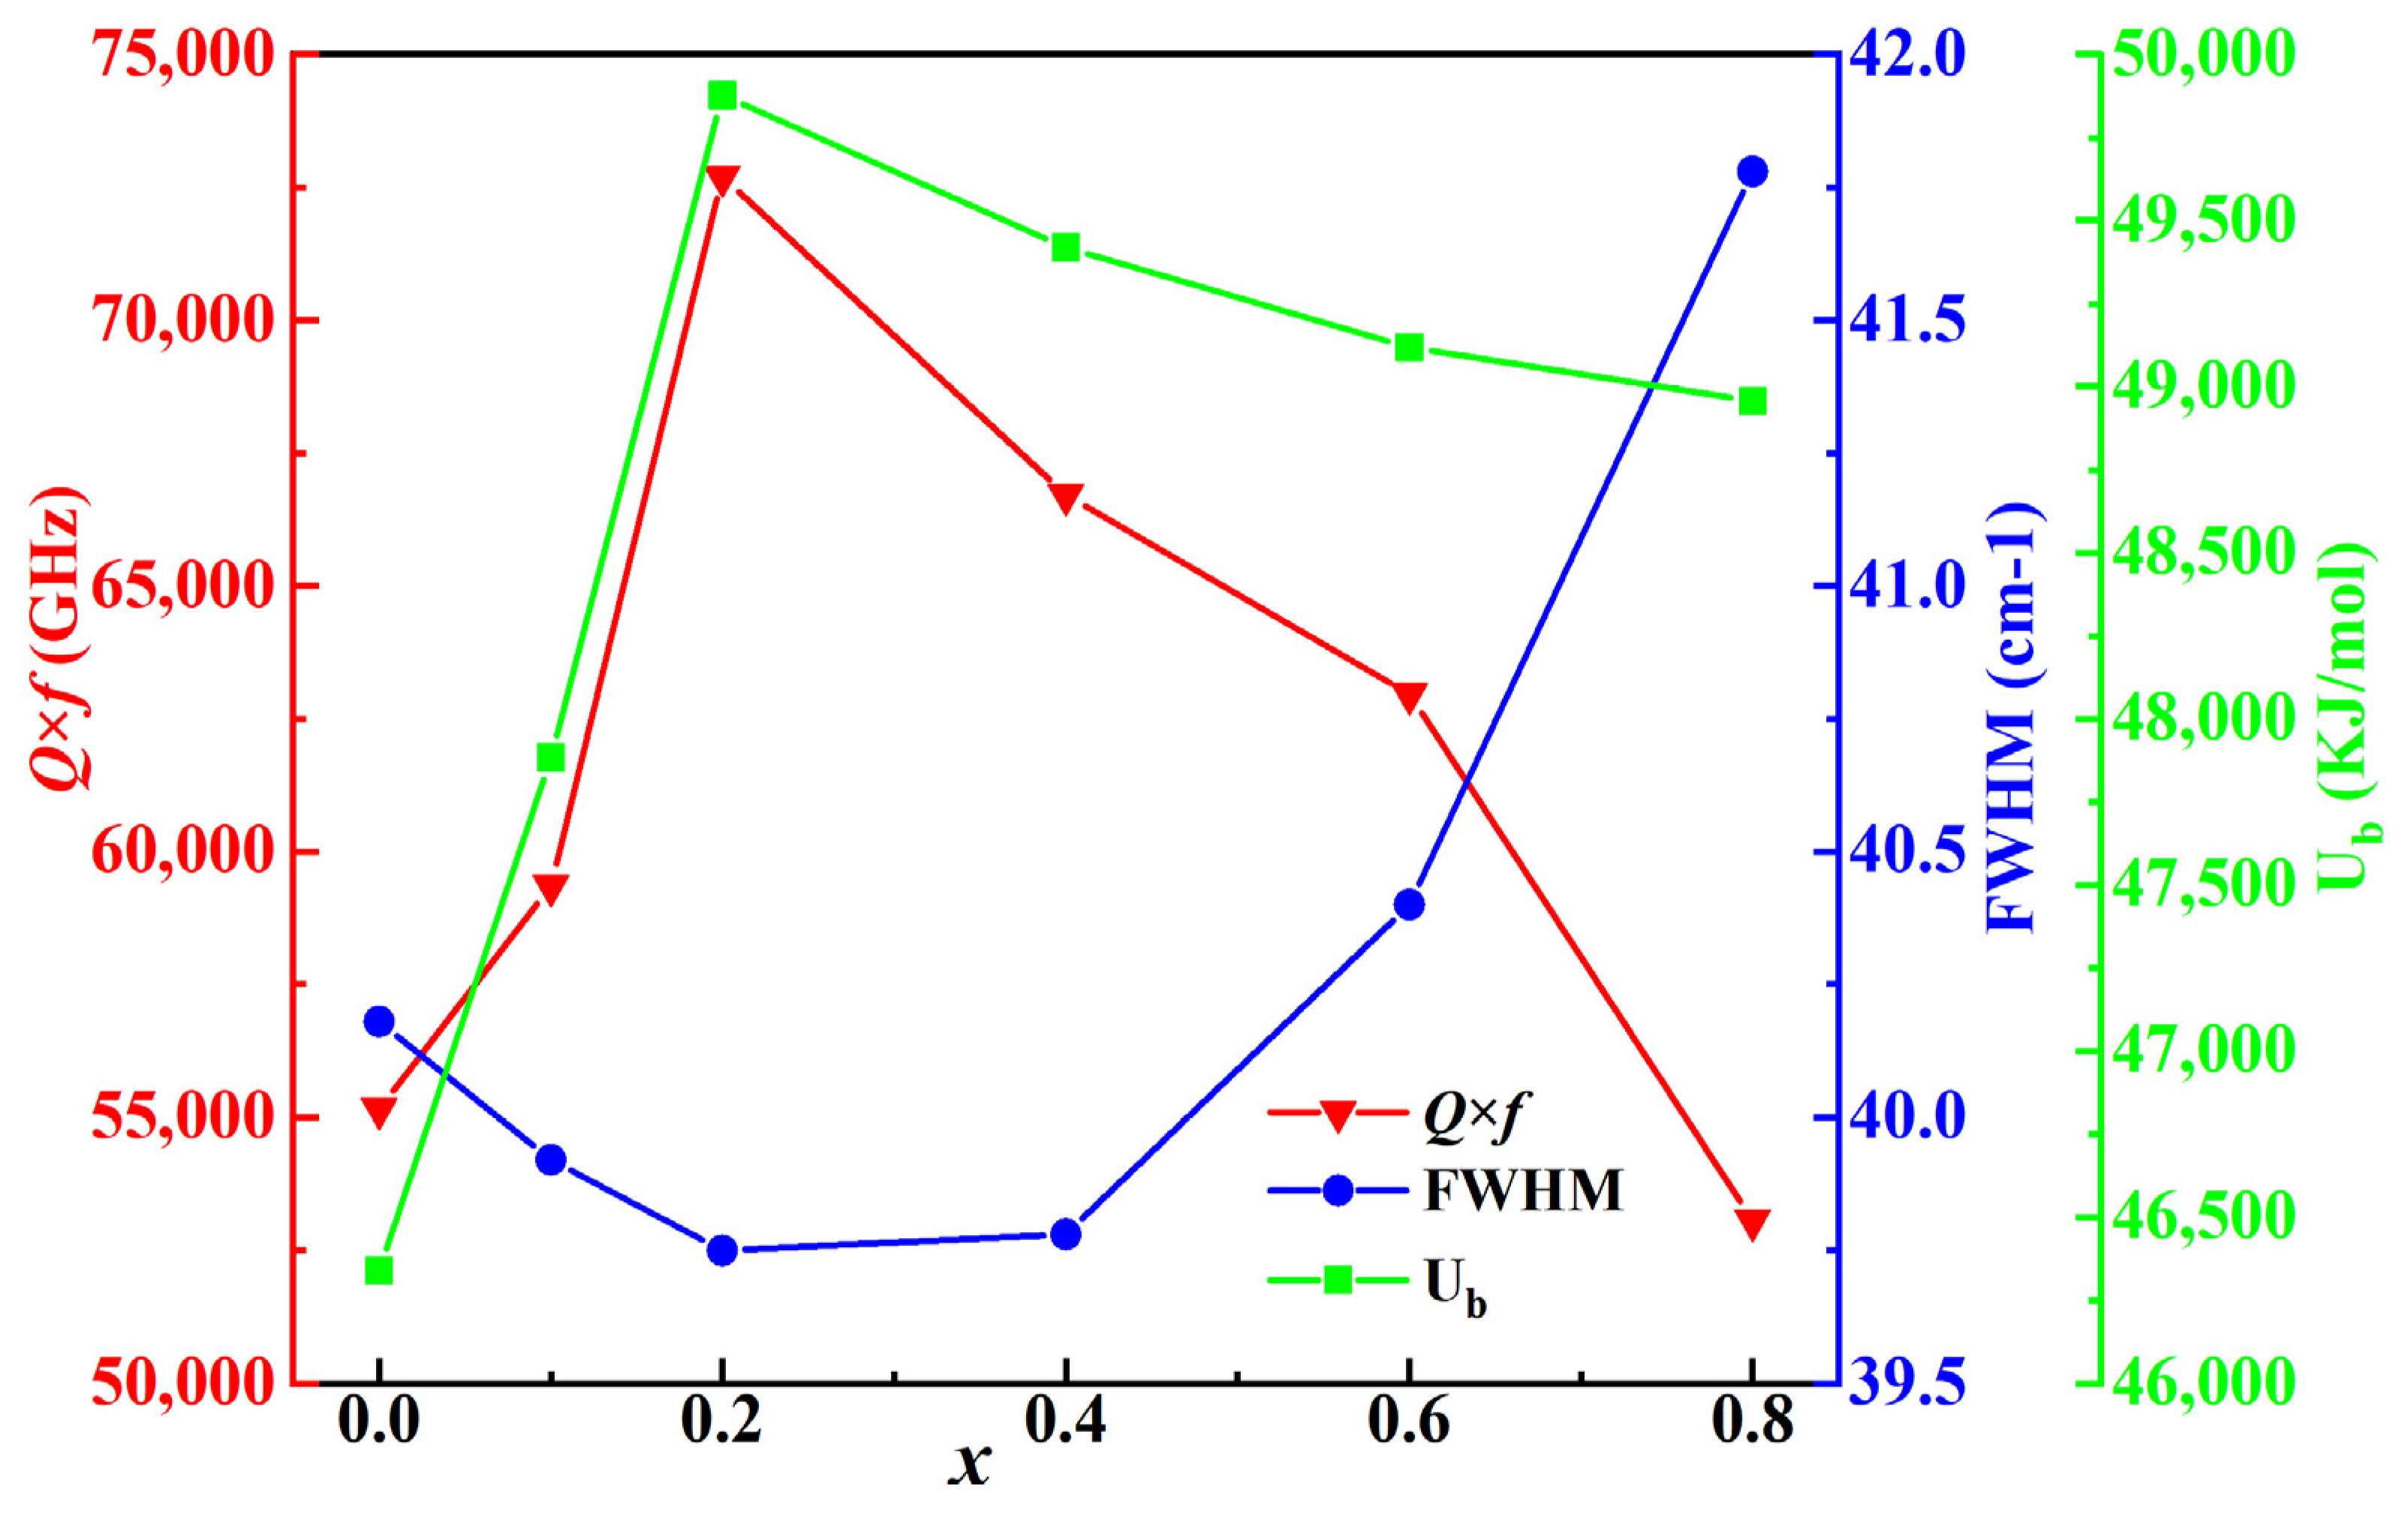
Figure 10 represents the interrelationships between the Q × f values, FWHM of A1g(O) and Ub for BSZN ceramics sintered at 1500 °C for 4 h. FWHM was considered a characterization technology to determine the ordering feature rather than the peak position or peak value. A smaller FWHM presented less interference between phonons and a longer lifetime, corresponding to the higher ordering of the samples [19,20]. According to the ref [2], the microwave dielectric properties of ceramics were closely related to FWHM, which was one of the factors affecting microwave dielectric properties. It was worth noting that the sample with x = 0.2 had the smallest FWHM of A1g(O) mode and the highest Q × f value, which was similar to the result of ref [40]. As shown in Figure 10, the measured Q × f values first increased from 55,158 GHz to 72,704 GHz and then gradually decreased, similar to the variation trend of Ub. Therefore, Ub, obtained by PVL theory calculation, was considered a key factor to determine the Q × f value, and Q × f showed the same changing trend as that of Ub. It was noteworthy that with the increasing Sr2+ content, the A-site ions in the BSZN samples proved to be strongly affected by internal losses. It could be clearly observed that the total lattice energy of the BSZN sample increased from 46,344 KJ/mol to 49,877 KJ/mol when x increased from 0 to 0.2, which played a non-negligible effect on the enhancement of Q × f. According to XRD analysis, all ceramics were pure phase. Therefore, the Q × f value was mainly determined by the FWHM value and Ub. A higher Q × f value corresponded to a smaller FWHM value and a larger Ub value.
Table 6 presents the dielectric properties at their respective optimal sintering temperatures after substitution by different additives. As we all know, BZN ceramics have been widely studied for their excellent dielectric properties. Therefore, the improvement of dielectric properties by different additives has been widely studied. With the advancement of time and technology, the Q × f value and τf value of BZN ceramics were optimized to some extent. Especially, the Ba0.8Sr0.2(Zn1/3Nb2/3)O3 ceramic with superior dielectric properties (εr = 45.25, Q × f = 72,704 GHz, and τf = 1.26 ppm/°C) was obtained in this work. It was evident from Table 6 that ionic substitution on the B-site of BZN ceramics was not as effective as that on the A-site. The above analysis indicated that Sr2+ addition could well optimize the microwave dielectric properties of BZN ceramics.

3. Materials and Methods

In this work, Sr2+ doped BZN ceramics were prepared by a traditional high-temperature solid-state reaction. BaCO3 (99%), ZnO (99%), Nb2O5 (99.9%), and SrCO3 (99.7%) with high purity were weighed according to the stoichiometry of Ba1−xSrx(Zn1/3Nb2/3)O3 (x = 0, 0.1, 0.2, 0.4, 0.6, and 0.8). Zirconia balls and deionized water were used as media, and the starting materials were placed together in a nylon tank. The nylon tank with the sample was next placed in a planetary and ball milling for 10 h. Then, the mixed solution was put into a drying oven at 85 °C to dry for 20 h. The obtained powders were put into a lithium muffle furnace to calcine from room temperature to 1200 °C at the speed of 3 °C/min, and the holding time was 4 h. The ball milling and drying process described above was repeated once. The obtained powders were then pelleted by adding 5% polyvinyl alcohol as a binder. The powders were pressed into cylindrical pieces 15 mm in diameter and 7 mm in thickness by a tableting machine. Finally, the obtained samples were sintered in the temperature range of 1425–1525 °C for 4 h at a heating rate of 3 °C/min.
The sintered ceramic samples were placed In a density balance, and their bulk density was measured by Archimedes’ water immersion principle. The theoretical density of each sample was obtained by the Rietveld refinement method using Jade. The phase constituents of BSZN ceramics powders were obtained by X-ray diffraction (XRD, miniflex600, Japan) under Cu target conditions of 50 kV and 40 mA. The test parameters were set as follows: the scanning angle range (2θ) was 10–85°, the step angle was 0.02, and the sampling time was 0.3 s per step. The XRD data of BSZN ceramics were structurally analyzed using Jade software. The relationship between the crystal structure and dielectric properties was obtained by employing Rietveld refinement. The crystal structure of BSZN ceramics was studied by Raman spectroscopy (Renishaw, Wotton-under-Edge, UK, 532 nm). The chemical composition and element valence of BSZN ceramics were investigated by X-ray photoelectron spectroscopy (VG Scientific, ESCALAB 250). The fracture surface morphology of the BSZN ceramics was presented by scanning electron microscopy (SEM, su1510, Hitachi, Japan). The porosity and average grain size (A.G.) were estimated using ImageJ software. The microwave dielectric properties of the samples were measured by the cylindrical medium resonance method. The τf value was usually measured in a high-temperature test box at 25–85 °C. The τf value of ceramic was generally calculated from the following equation:
τ f = f 85 f 25 f 25 ( 85 25 ) × 10 6 ( ppm / ° C ) ,
where f85 and f25 were the resonant frequency at 85 °C and 25 °C, respectively.

4. Conclusions

In this work, BSZN ceramics were sintered at 1500 °C for 4 h by the traditional high-temperature solid phase method. The XRD analysis results indicated that the samples obtained in this work were all pure phases without any impurity phases. The SEM results indicated that the grain size of the sample was relatively uniform at x = 0.2; however, abnormal growth grains appeared with the further increase in Sr2+ concentration. εr first increased from 40.91 to 45.25 and then decreased to 40.55, which was correlated with the density and the ionic polarizability. Distortion of the oxygen octahedron and bond energy caused a continuous decrease in τf value from 27.72 ppm/°C to −15.72 ppm/°C in the negative direction, obtaining a near zero τf value of 1.26 ppm/°C at x = 0.2. The FWHM of A1g(O) mode first decreased and then increased with the increase in Sr2+ concentration. Consistent with the changing trend of Q × f value, the results illustrated that FWHM had a great influence on the Q × f value. As increasing x from 0 to 0.8, the Q × f value initially increased from 55,158 GHz to 72,704 GHz and then decreased to 53,060 GHz. The change in the Q × f value was attributed to the combined action of Ub and the FWHM of A1g(O) mode near 788 cm−1. Generally, Ba0.8Sr0.2(Zn1/3Nb2/3)O3 ceramics sintered at 1500 °C for 4 h exhibited excellent microwave dielectric properties of εr = 45.25, Q × f = 72,704 GHz, and τf = 1.26 ppm/°C.

Supplementary Materials

The following supporting information can be downloaded at: https://www.mdpi.com/article/10.3390/molecules28083451/s1, Table S1: A detailed list of the abbreviations; Figure S1: The EDS mapping and corresponding spectrum for the sample with x = 0; Figure S2: The EDS mapping and corresponding spectrum for the sample with x = 0.1; Figure S3: The EDS mapping and corresponding spectrum for the sample with x = 0.2; Figure S4: The EDS mapping and corresponding spectrum for the sample with x = 0.4; Figure S5: The EDS mapping and corresponding spectrum for the sample with x = 0.6; Figure S6: The EDS mapping and corresponding spectrum for the sample with x = 0.8.

Author Contributions

Conceptualization, L.X., W.Z. and Y.Z.; methodology, L.X. and P.W.; investigation, P.W. and L.D.; Data curation, W.Z. and P.W.; writing—original draft preparation, L.X. and L.D.; writing—review and editing, S.P.; funding acquisition, L.X. and S.P. All authors have read and agreed to the published version of the manuscript.

Funding

This work was supported by the Natural Science Foundation of Hunan Province (Grant No. 2022JJ50197), the Scientific Research Fund of Hunan Provincial Education Department (Grant No. 21B0681), and the graduate scientific research innovation project of Shaoyang University (Grant No. CX2022SY050).

Institutional Review Board Statement

Not applicable.

Informed Consent Statement

Not applicable.

Data Availability Statement

Not applicable.

Acknowledgments

The first author expresses their deep gratefulness to Zhenjun Qing for his supervision of the design of the initial experimental process.

Conflicts of Interest

The authors declare no conflict of interest.

References

  1. Onoda, M.; Kuwata, J.; Kaneta, K.; Toyama, K.; Nomura, S. Ba(Zn1/3Nb2/3)O3–Sr(Zn1/3Nb2/3)O3 solid solution ceramics with temperature-stable high dielectric constant and low microwave loss. Jpn. J. Appl. Phys. 1982, 21, 1707–1710. [Google Scholar] [CrossRef]
  2. Ma, P.P.; Chen, X.M. Further ordering structural investigation of Ba((Co, Zn, Mg)1/3Nb2/3)O3 perovskites by Raman spectroscopy. Mater. Charact. 2019, 158, 109938–109945. [Google Scholar] [CrossRef]
  3. Faruque, M.R.I.; Ahamed, E.; Rahman, M.A.; Islam, M.T. Flexible nickel aluminate (NiAl2O4) based dual-band double negative metamaterial for microwave applications. Results Phys. 2019, 14, 10252. [Google Scholar] [CrossRef]
  4. Zhang, Y.; Zhang, Y.; Xiang, M. Crystal structure and microwave dielectric characteristics of Zr-substituted CoTiNb2O8 ceramics. J. Am. Ceram. Soc. 2016, 36, 1945–1951. [Google Scholar] [CrossRef]
  5. Liu, D.; Chen, X.M.; Hu, X. Microwave dielectric ceramics in (Ca1−xBax)(Zn1/3Nb2/3)O3 system. Mater. Lett. 2007, 61, 1166–1169. [Google Scholar] [CrossRef]
  6. Liu, Y.C.; Chen, J.H.; Wang, H.W.; Liu, C.Y. Synthesis of (BaxSr1−x)(Zn1/3Nb2/3)O3 ceramics by reaction-sintering process and microstructure. Mater. Res. Bull. 2006, 41, 455–460. [Google Scholar] [CrossRef]
  7. Bai, J.H.; Liu, Q.L.; Li, X.; Wei, X.; Li, L.P. Optimization of Sintering Conditions to Enhance the Dielectric Performance of Gd3+ and Ho3+ Co-doped BaTiO3 Ceramics. Molecules 2022, 27, 7464. [Google Scholar] [CrossRef]
  8. Molodetsky, I.; Davies, P.K. Effect of Ba(Y1/2Nb1/2)O3 and BaZrO3 on the cation order and properties of Ba(Co1/3Nb2/3)O3 microwave ceramics. J. Eur. Ceram. Soc. 2001, 21, 2587–2591. [Google Scholar] [CrossRef]
  9. Koga, E.; Yamagishi, Y.; Moriwake, H.; Kakimoto, K.; Ohsato, H. Order-Disorder transition and its effect on microwave quality factor Q in Ba(Zn1/3Nb2/3)O3 System. J. Electroceram. 2006, 17, 375–379. [Google Scholar] [CrossRef]
  10. Chen, Y.C.; Syu, R.Y.; Ding, X.F. Enhancement quality factor by Zr4+ Substitution at B-site of ZnNiTiO4 microwave ceramics. Ceram. Int. 2017, 43, S301–S305. [Google Scholar] [CrossRef]
  11. Pan, C.-L.; Shen, C.-H.; Lin, S.-H.; Lin, Q.-Z. Tunable Microwave Dielectric Properties of Ca0.6La0.8/3TiO3 and Ca0.8Sm0.4/3TiO3-Modified (Mg0.6Zn0.4)0.95Ni0.05TiO3 Ceramics with a Near-Zero Temperature Coefficient. Molecules 2021, 26, 4715. [Google Scholar] [CrossRef] [PubMed]
  12. Li, L.X.; Jin, Y.X.; Dong, H.L.; Yu, S.H.; Xu, D. Effect of Sn4+ substitution on the dielectric properties of Bi2O3–ZnO–Nb2O5 pyrochlores. Ceram. Int. 2014, 40, 16133–16139. [Google Scholar] [CrossRef]
  13. Bian, J.J.; Dong, Y.F.; Song, G.X. Microwave Dielectric Properties of A-Site Modified Ba(Co0.7Zn0.3)1/3Nb2/3O3 by La3+. J. Eur. Ceram. Soc. 2008, 91, 1182–1187. [Google Scholar] [CrossRef]
  14. Surendran, K.P.; Mohanan, P.; Sebastion, M.T. The effect of glass additives on the microwave dielectric properties of Ba(Mg1/3Ta2/3)O3 ceramics. J. Solid State Chem. 2004, 177, 4031–4046. [Google Scholar] [CrossRef]
  15. Varma, M.R.; Sebastian, M.T. Effect of dopants on microwave dielectric properties of Ba(Zn1/3Nb2/3)O3 ceramics. J. Eur. Ceram. Soc. 2007, 27, 2827–2833. [Google Scholar] [CrossRef]
  16. Chia, C.T.; Chang, P.J.; Chen, M.Y.; Lin, I.N.; Ikawa, H.; Lin, L.J. Oxygen-octahedral phonon properties of xBaTiO3+(1-x)Ba(Mg1/3Ta2/3)O3 and xCa(Sc1/2Nb1/2)O3+(1−x)Ba(Sc1/2Nb1/2)O3 microwave ceramics. J. Appl. Phys. 2007, 101, 084115. [Google Scholar] [CrossRef]
  17. Qasrawi, A.F.; Sahin, E.I.; Abed, T.Y.; Emek, M. Structural and Dielectric Properties of Ba1−xLax(Zn1/3Nb2/3)O3 Solid Solutions. Phys. Status. Solidi B. 2020, 258, 2000419–2000425. [Google Scholar] [CrossRef]
  18. Varma, M.R.; Raghunandan, R.; Sebastian, M.T. Effect of dopants on microwave dielectric properties of Ba(Zn1/3Ta2/3)O3 Ceramics. Jpn. J. Appl. Phys. 2005, 44, 298–303. [Google Scholar] [CrossRef]
  19. Liu, X. Sr(Ga0.5Nb0.5)1−xTixO3 Low-Loss Microwave Dielectric Ceramics with Medium Dielectric Constant. J. Am. Ceram. Soc. 2015, 98, 2534–2540. [Google Scholar] [CrossRef]
  20. Diao, C.L.; Wang, C.H.; Luo, N.N.; Qi, Z.M.; Shao, T.; Wang, Y.Y.; Lu, J.; Wang, Q.C.; Kuang, X.J.; Fang, L.; et al. First-principle calculation and assignment for vibrational spectra of Ba(Mg1/3Nb2/3)O3 microwave dielectric ceramic. J. Appl. Phys. 2014, 115, 787–791. [Google Scholar] [CrossRef]
  21. Siny, I.G.; Tao, R.; Katiyar, R.S.; Guo, R.; Bhalla, A.S. Raman spectroscopy of Mg-Ta order-disorder in Ba(Mg1/3Ta2/3)O3. Phys. Chem. Solids. 1998, 59, 181–195. [Google Scholar] [CrossRef]
  22. Ratheesh, R.; Sreemoolanadhan, H.; Sebastian, M.T. Vibrational analysis of Ba5−xSrxNb4O15 microwave dielectric ceramic resonators. J. Solid State Chem. 1997, 131, 2–8. [Google Scholar] [CrossRef]
  23. Ratheesh, R.; Wohlecke, M.; Berge, B.; Wahlbrink, T.; Haeuseler, H.; Ruhl, E.; Blachnik, R.; Balan, P.; Santha, N.; Sbastian, M.T. Raman study of the ordering in Sr(B0.5′Nb0.5)O3 compounds. J. Appl. Phys. 2000, 88, 2813–2818. [Google Scholar] [CrossRef]
  24. Kim, E.S.; Chun, B.S.; Freer, R.; Cernik, R.J. Effects of packing fraction and bond valence on microwave dielectric properties of A2+B6+O4 (A2+: Ca, Pb, Ba; B6+: Mo, W) Ceramics. J. Eur. Ceram. Soc. 2010, 30, 1731–1736. [Google Scholar] [CrossRef]
  25. Huang, C.L.; Hsu, C.S.; Liu, S.J. Dielectric properties of 0.95Ba(Zn1/3Nb2/3)O3–0.05BaZrO3 ceramics at microwave frequency. Mater. Lett. 2003, 57, 3602–3605. [Google Scholar] [CrossRef]
  26. Yue, Z.; Zhao, F.; Zhang, Y.; Gui, Z.; Li, L. Microwave dielectric properties of Ba[(Zn1−xCox)1/3Nb2/3]O3 ceramics. Mater. Lett. 2004, 58, 1830–1834. [Google Scholar] [CrossRef]
  27. Fu, M.; Liu, X.; Chen, X. Effects of Mg Substitution on Microstructures and Microwave Dielectric Properties of Ba(Zn1/3Nb2/3)O3 Perovskite Ceramics. J. Am. Ceram. Soc. 2010, 93, 787–795. [Google Scholar] [CrossRef]
  28. Alkathy, M.S.; Rahman, A.; Zabotto, F.L.; Milton, F.P.; Raju, K.C.J.; Eiras, J.A. Room-temperature multiferroic behaviour in Co/Fe co-substituted layer-structured Aurivillius phase ceramics. Ceram. Int. 2022, 48, 30041–30051. [Google Scholar] [CrossRef]
  29. Jaiswal, S.K.; Hong, J.; Yoon, K.J.; Son, J.W.; Lee, J.H. Synthesis and conductivity behaviour of proton conducting (1-x)Ba0.6Sr0.4Ce0.75Zr0.10Y0.15O3δ-xGDC (x = 0, 0.2, 0.5) composite electrolytes. J. Am. Ceram. Soc. 2017, 100, 4710–4718. [Google Scholar] [CrossRef]
  30. Komai, S.; Hirano, M.; Ohtsu, N. Spectral analysis of Sr 3d XPS spectrum in Sr—containing hydroxyapatite. Surf. Interface Anal. 2020, 52, 823–828. [Google Scholar] [CrossRef]
  31. Chen, X.; Li, H.; Zhang, P.; Hu, H.; Chen, G.; Li, G. A low—permittivity microwave dielectric ceramic BaZnP2O7 and its performance modification. J. Am. Ceram. Soc. 2021, 104, 5214–5223. [Google Scholar] [CrossRef]
  32. Atuchin, V.V.; Kalabin, I.E.; Kesler, V.G.; Pervukhina, N.V. Nb 3d and O 1s core levels and chemical bonding in niobates. J. Elect. Spectr. Rel. Phenom. 2005, 142, 129–134. [Google Scholar] [CrossRef]
  33. Yu, S.Q.; Tang, B.; Zhang, X.; Zhang, S.R.; Zhou, X.H. Improved High-Q Microwave Dielectric Ceramics in CuO-Doped BaTi4O9-BaZn2Ti4O11 System. J. Am. Ceram. Soc. 2012, 95, 1939–1943. [Google Scholar] [CrossRef]
  34. Zhang, P.; Hao, M.M.; Xiao, M.; Zheng, Z.T. Crystal structure and microwave dielectric properties of novel BiMg2MO6 (M = P, V) ceramics with low sintering temperature. J. Mater. 2021, 7, 1344–1351. [Google Scholar] [CrossRef]
  35. Levine, B.F. Bond susceptibilities and ionicities in complex crystal structures. J. Chem. Phys. 1973, 59, 1463–1486. [Google Scholar] [CrossRef]
  36. Zhai, S.; Liu, P. Microwave dielectric properties of rock-salt structured Li7(Nb1−xTix)2O8-xF(0 ≤ x ≤ 0.10) system with low sintering temperature. Ceram. Int. 2022, 48, 28268–28273. [Google Scholar] [CrossRef]
  37. Shannon, R.D. Dielectric polarizabilities of ions in oxides and fluorides. J. Appl. Phys. 1993, 73, 348–366. [Google Scholar] [CrossRef]
  38. Kim, E.S.; Chun, B.S.; Yoon, K.H. Dielectric properties of [Ca1−x(Li1/2Nd1/2)x]1−yZnyTiO3 ceramics at microwave frequencies. Mater. Sci. Eng. B. 2003, 99, 93–97. [Google Scholar] [CrossRef]
  39. Shimada, Y.; Mutsukura, N.; Machi, Y. Dielectric and structural characteristics of Ba- and Sr-based complex perovskites as a function of tolerance factor. Jpn. J. App. Phys. 1992, 31, 1958–1963. [Google Scholar] [CrossRef]
  40. Liu, S.; Li, H.; Xiang, R.; Zhang, P.; Chen, X.; Wen, Q.; Hu, H. Effect of substituting Al3+ for Ti4+ on the microwave dielectric performance of Mg2Ti1−xAl4/3xO4 (0.01 ≤ x ≤ 0.09) ceramics. Ceram. Int. 2021, 47, 33064–33069. [Google Scholar] [CrossRef]
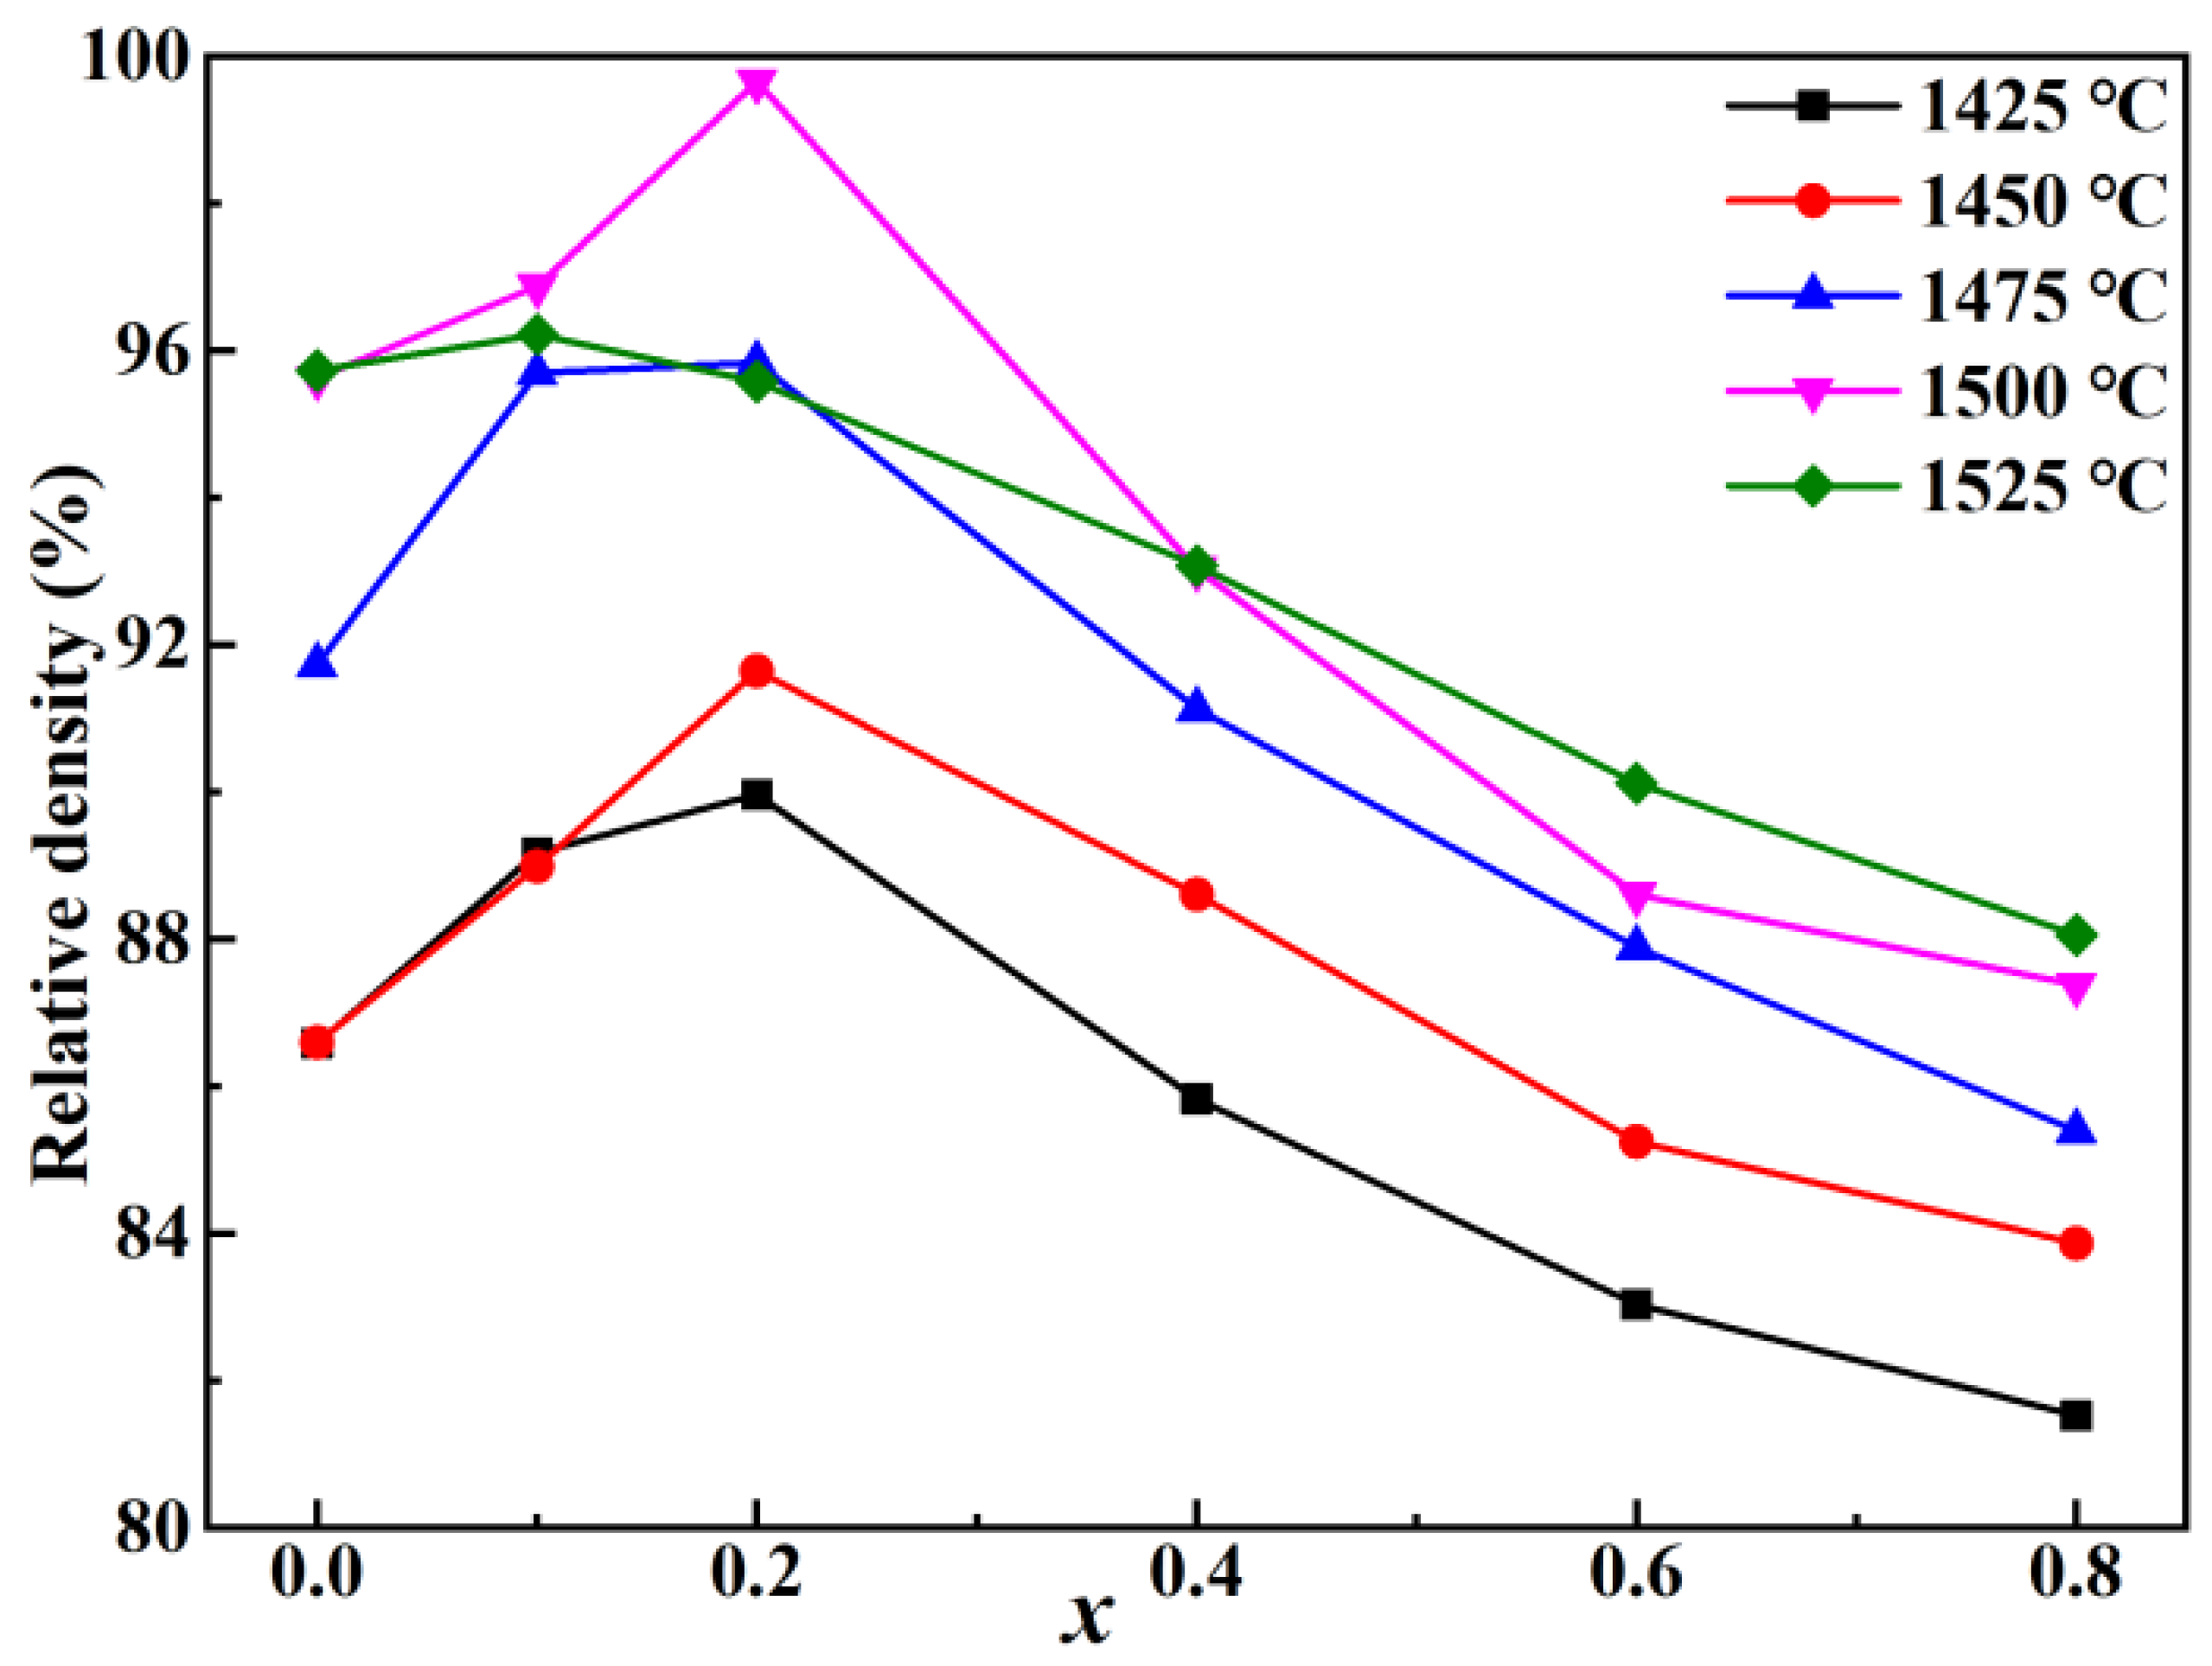
Figure 1. Relative density of BaxSr1−x(Zn1/3Nb2/3)O3 (x = 0–0.8) ceramics sintered at different temperatures.
Molecules 28 03451 g001
Figure 2. (a) XRD patterns of BSZN ceramics and (b) XRD patterns of BSZN ceramics in the 2θ range 44–57°.
Molecules 28 03451 g002
Figure 3. (a) The refinement plot of Ba1−xSrx(Zn1/3Nb2/3)O3 (x = 0.2) ceramics (Rwp = 9.61%, Rp = 6.1%, and χ2 = 2.88); (b) The crystal structure patterns of Ba1−xSrx(Zn1/3Nb2/3)O3 (x = 0.2) ceramics.
Molecules 28 03451 g003
Figure 4. Raman spectra of Ba1−xSrx(Zn1/3Nb2/3)O3 (x = 0–0.8) ceramics.
Molecules 28 03451 g004
Figure 5. XPS spectra of Ba1−xSrx(Zn1/3Nb2/3)O3 (x = 0.2) ceramics with (a) full spectra, (b) Ba 3d, (c) Sr 3d, (d) Nb 3d, (e) Zn 2p, and (f) Zn LMM.
Molecules 28 03451 g005
Figure 6. XPS spectra of O 1s for (a) undoped sample and (b) the sample with x = 0.2.
Molecules 28 03451 g006
Figure 7. Backscatter SEM photographs of polished and annealed treatment fracture surfaces of Ba1−xSrx(Zn1/3Nb2/3)O3 ceramics with (a) x = 0, (b) x = 0.1, (c) x = 0.2, (d) x = 0.4, (e) x = 0.6, and (f) x = 0.8.
Molecules 28 03451 g007
Figure 8. The average grain size of Ba1−xSrx(Zn1/3Nb2/3)O3 ceramics with (a) x = 0, (b) x = 0.1, (c) x = 0.2, (d) x = 0.4, (e) x = 0.6, and (f) x = 0.8.
Molecules 28 03451 g008
Figure 9. The variation of apparent density and porosity with x from 0 to 0.8.
Molecules 28 03451 g009
Figure 10. The Q × f value, FWHM and Ub of BSZN ceramics.
Molecules 28 03451 g010
Table 1. Lattice parameters and unit cell volumes of Ba1−xSrx(Zn1/3Nb2/3)O3 ceramics.
xa = b = c (Å)α = β = γ (°)Vcell3)
04.095489068.65
0.14.087589068.3
0.24.07969067.9
0.44.06259067.05
0.64.045869066.23
0.84.022549065.09
Table 2. EDS analysis of the BSZN samples with different Sr2+ concentrations.
xAtomic Percentage (%)
BaSrZnNbO
026.71/3.5617.5952.14
0.121.351.973.7515.9157.02
0.219.764.954.1316.7854.38
0.417.0411.212.8818.0550.82
0.610.7515.883.4717.9951.91
0.85.321.363.4216.3653.56
Table 3. The bond ionicity (fi) and bond covalency (fc) of Ba(Zn1/3Nb2/3)O3 ceramics.
Bond TypeBond Length (Å)fi (%)fc (%)
Ba-O2.9285.8014.20
Zn-O2.0156.0343.97
Nb-O2.0783.3416.66
Table 4. Comparisons between αtheo and αobs of Ba1–xSrx(Zn1/3Nb2/3)O3 ceramics.
xεrVcellZαtheoαobsΔ (%)
040.9168.65115.756715.2433.26
0.142.8868.30115.540715.2152.1
0.245.2567.90115.324715.18070.94
0.444.6067.05114.892714.9770.57
0.642.9366.23114.460714.75562.04
0.840.5565.09114.028714.44352.96
Table 5. Bond length, octahedral distortion, bond energy, and τf value of Ba1−xSrx(Zn1/3Nb2/3)O3 ceramics.
xdNbO (Å)RNbO v NbO VNbOΔoctahedralEb (KJ/mol)τf (ppm/°C)
02.07823 × 31.9110.6364 × 33.91950.91 × 10−4106027.72
2.0591 × 3 0.6701 × 3
0.12.05809 × 31.9110.636 × 33.92391.03 × 10−4106211.61
2.07844 × 3 0.672 × 3
0.22.06544 × 31.9110.7106 × 33.97731.7 × 10−410741.26
1.89159 × 3 0.6152 × 3
0.42.02418 × 31.9110.7347 × 35.30241.6 × 10−31034−5.16
1.8997 × 3 1.031 × 3
0.62.04764 × 31.9110.6912 × 35.76353 × 10−31016−8.69
1.83442 × 3 1.2299 × 3
0.82.04507 × 31.9110.696 × 36.37784.8 × 10−3995−15.72
1.77869 × 3 1.4299 × 3
Table 6. The microwave dielectric properties of some typical Ba(Zn1/3Nb2/3)O3-based ceramics.
YearCeramics CompositionSintering
Temperature (°C)
εrQ × f (GHz)τf (ppm/°C)Reference
1982Ba(Zn1/3Nb2/3)O315004154,000+30[1]
20030.95Ba(Zn1/3Nb2/3)O3 +
0.05 BaZrO3
14504296,000+27[25]
2004Ba[(Zn1−xCox)1/3Nb2/3]O3
(x = 0.8)
14503320,248−0.11[26]
2010Ba(Zn1−xMgx)1/3Nb2/3)O3
(x = 0.4)
14003694,400+28.6[27]
2008Ba1−xLa2x/3(Zn0.3Co0.7)1/3Nb2/3O3
(x = 0.015)
14253463,1595.21[13]
2023Ba1−xSrx(Zn1/3Nb2/3)O3
(x = 0.2)
150045.2572,7041.26This work
Disclaimer/Publisher’s Note: The statements, opinions and data contained in all publications are solely those of the individual author(s) and contributor(s) and not of MDPI and/or the editor(s). MDPI and/or the editor(s) disclaim responsibility for any injury to people or property resulting from any ideas, methods, instructions or products referred to in the content.