
A Novel Derivative of Curcumol, HCL-23, Inhibits the Malignant Phenotype of Triple-Negative Breast Cancer and Induces Apoptosis and HO-1-Dependent Ferroptosis

 and
and 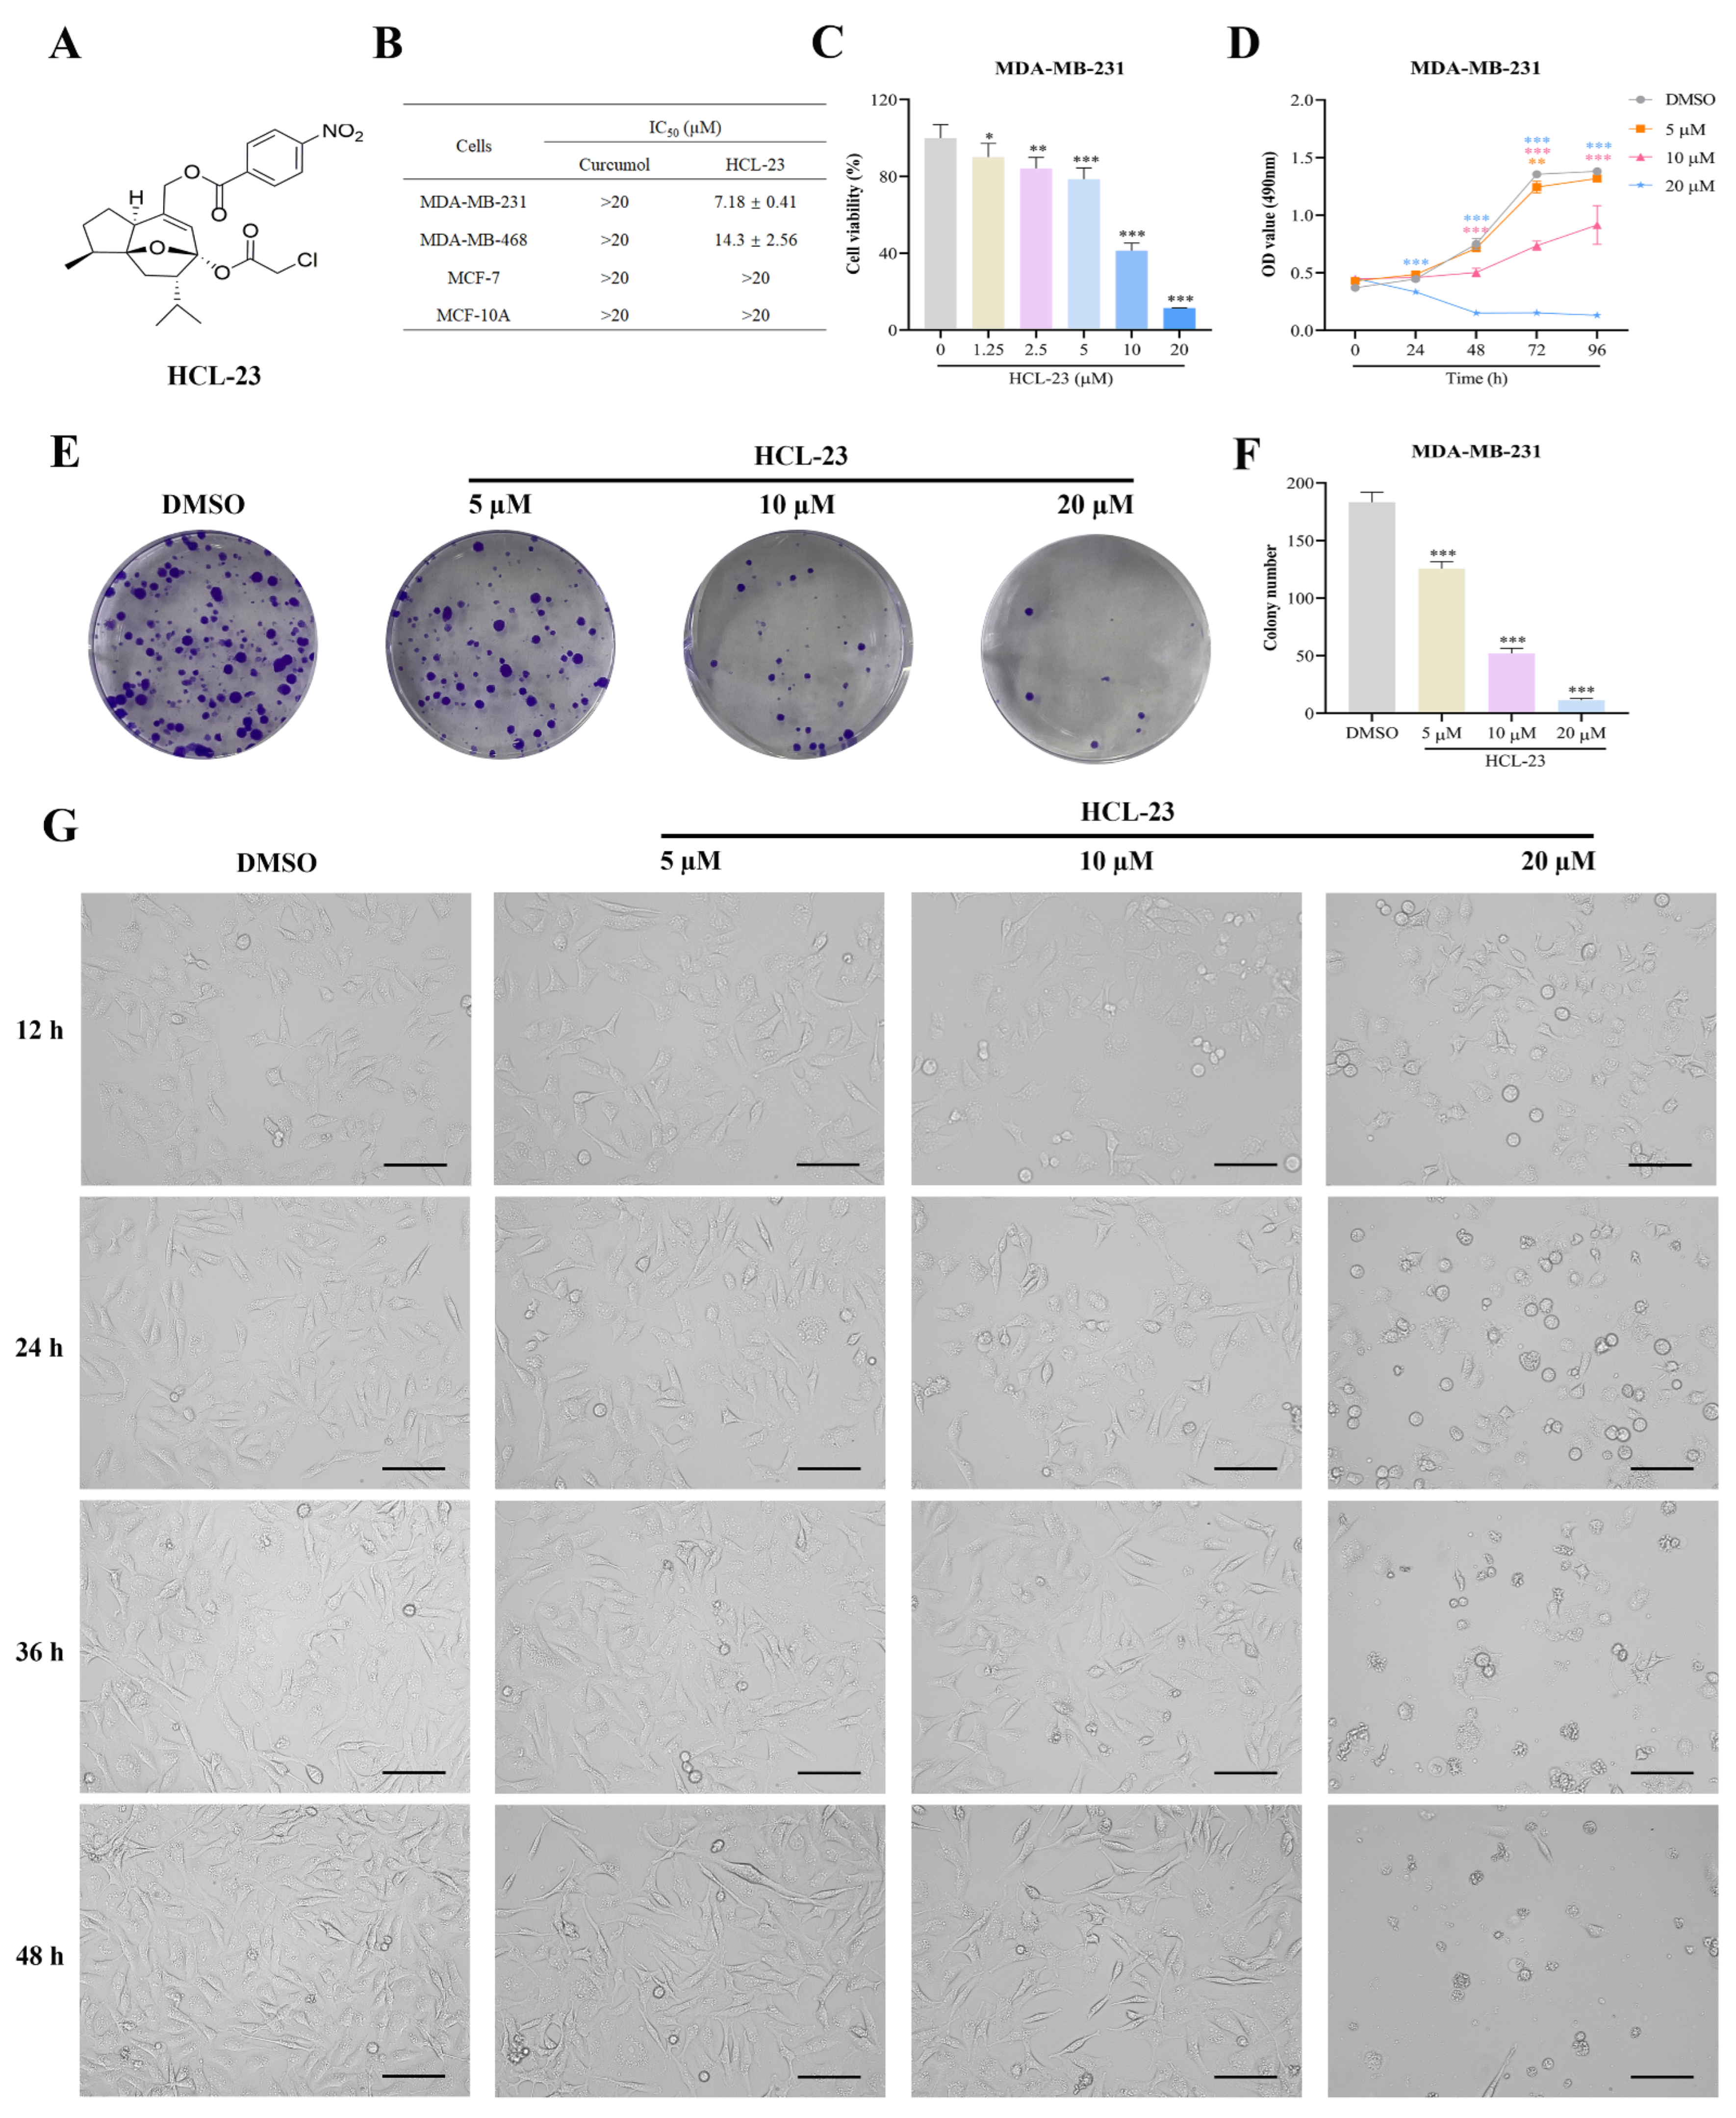
Abstract
1. Introduction
2. Results
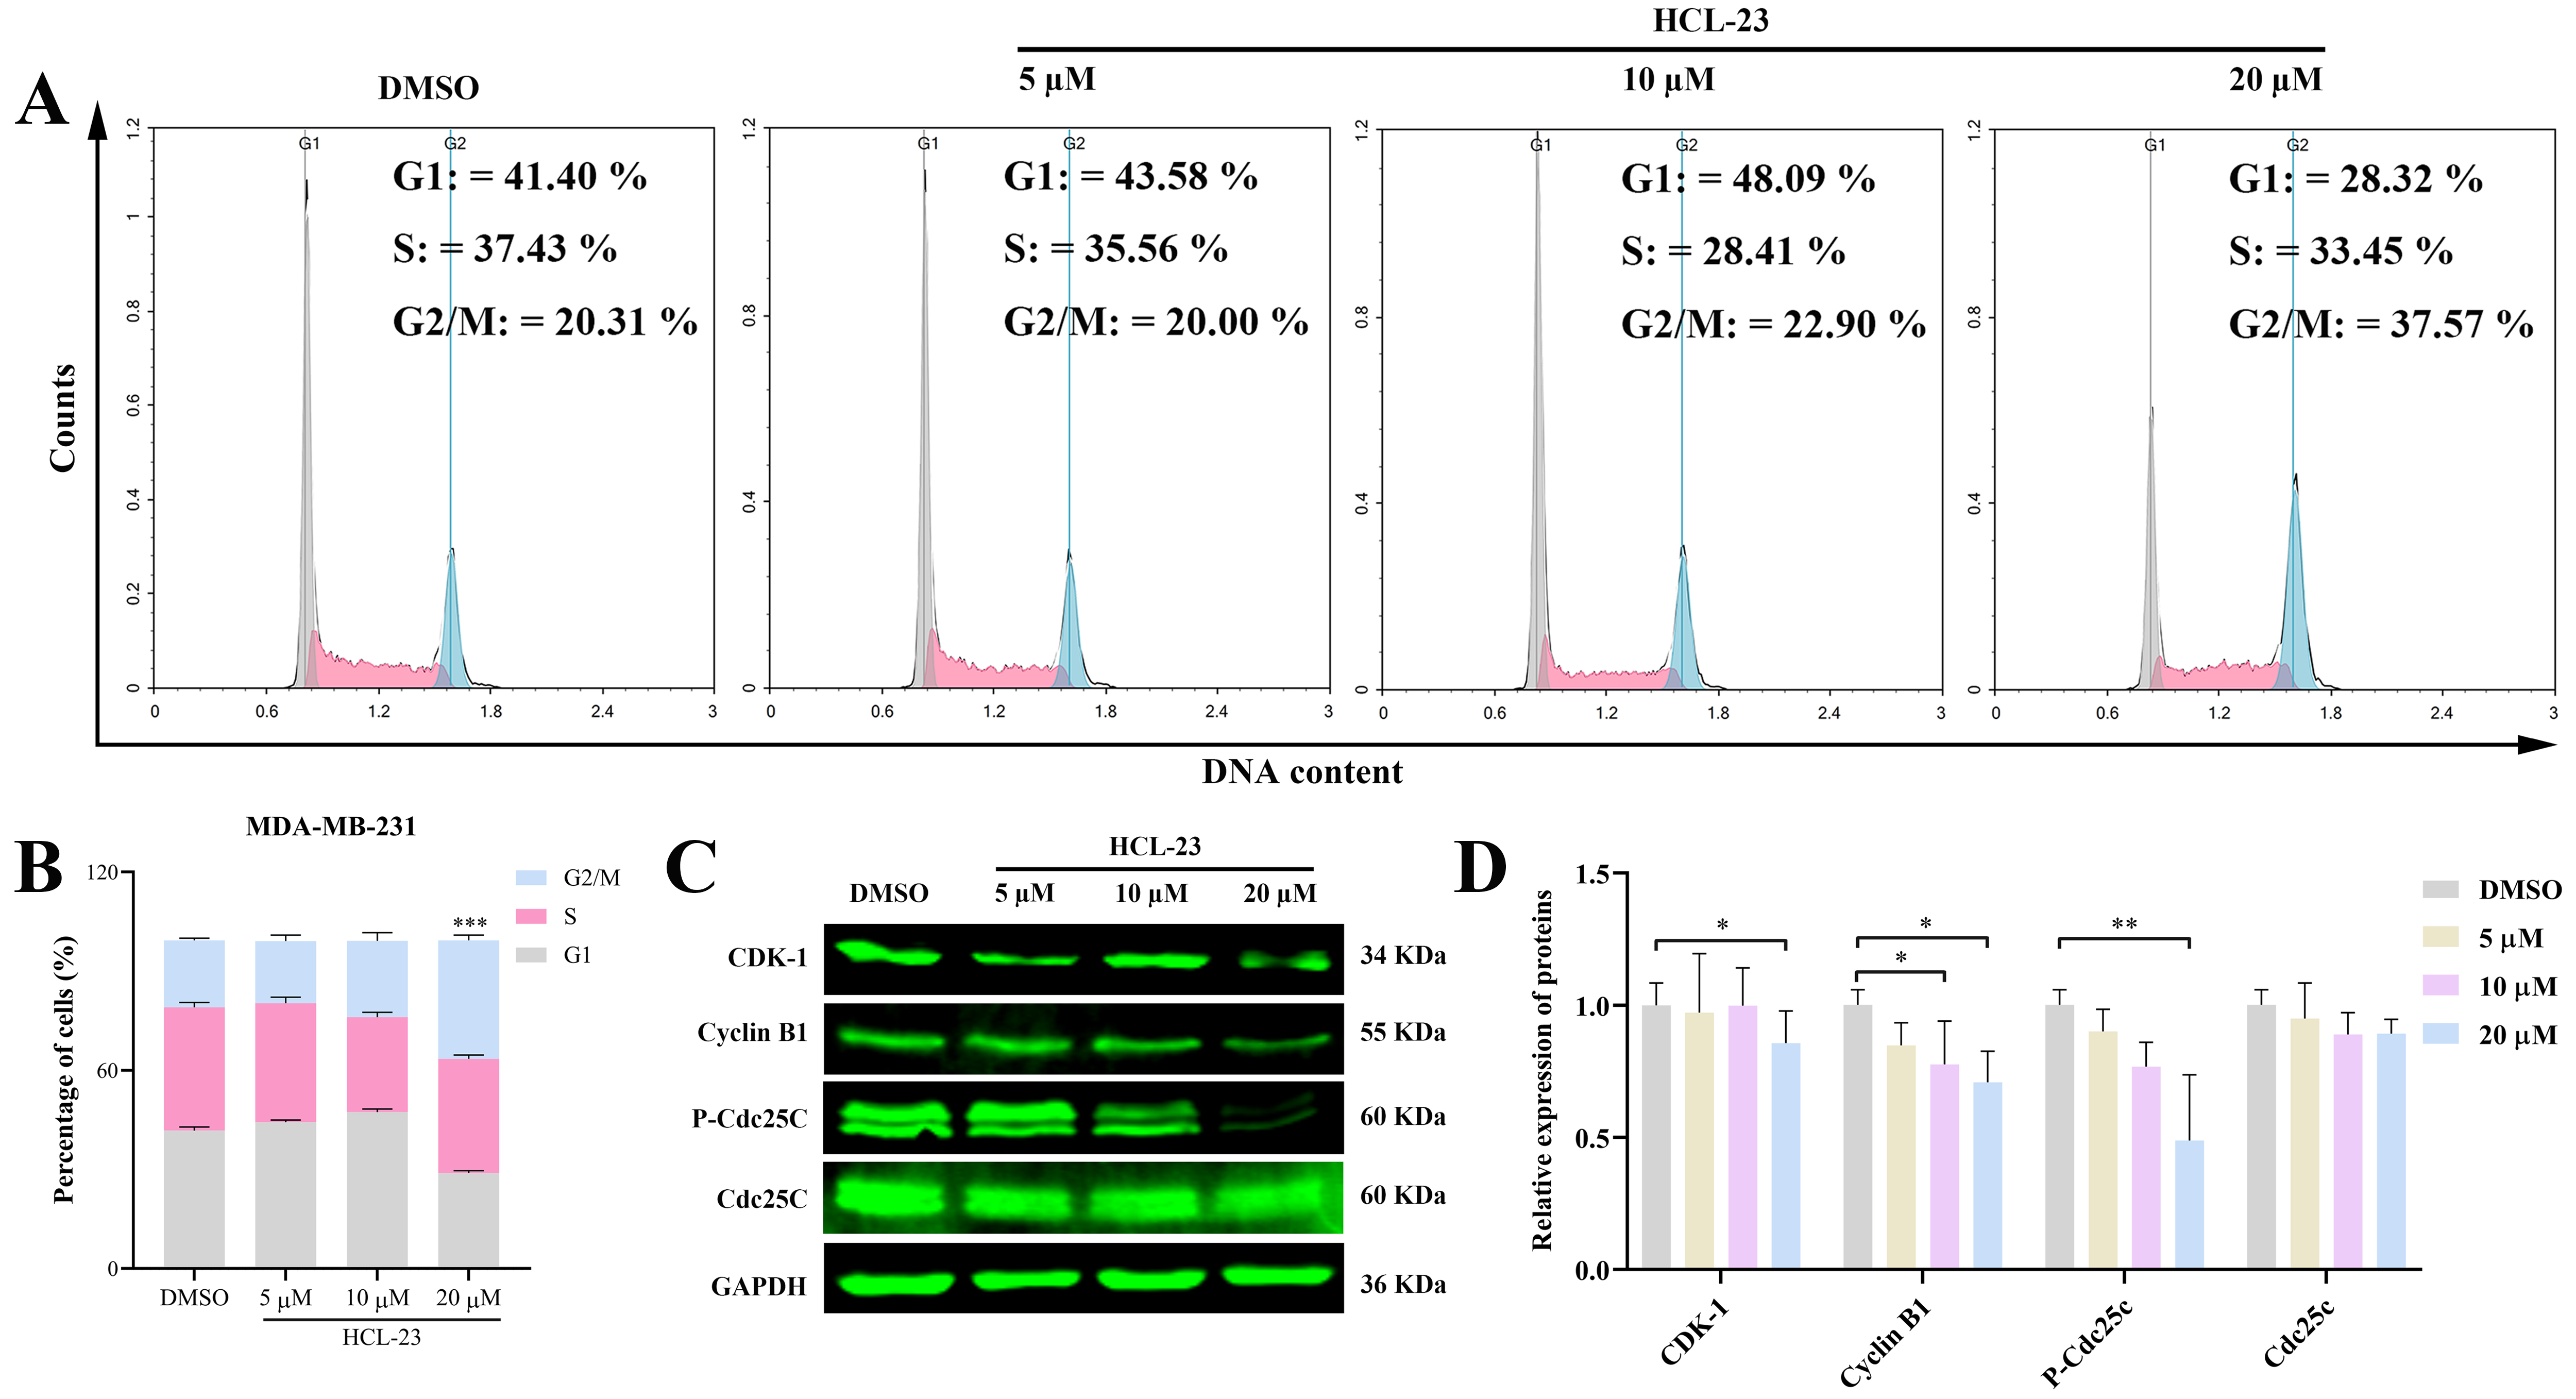
2.1. HCL-23 Inhibits Cell Proliferation and Induces G2/M Phase Cycle Arrest in MDA-MB-231 Cells
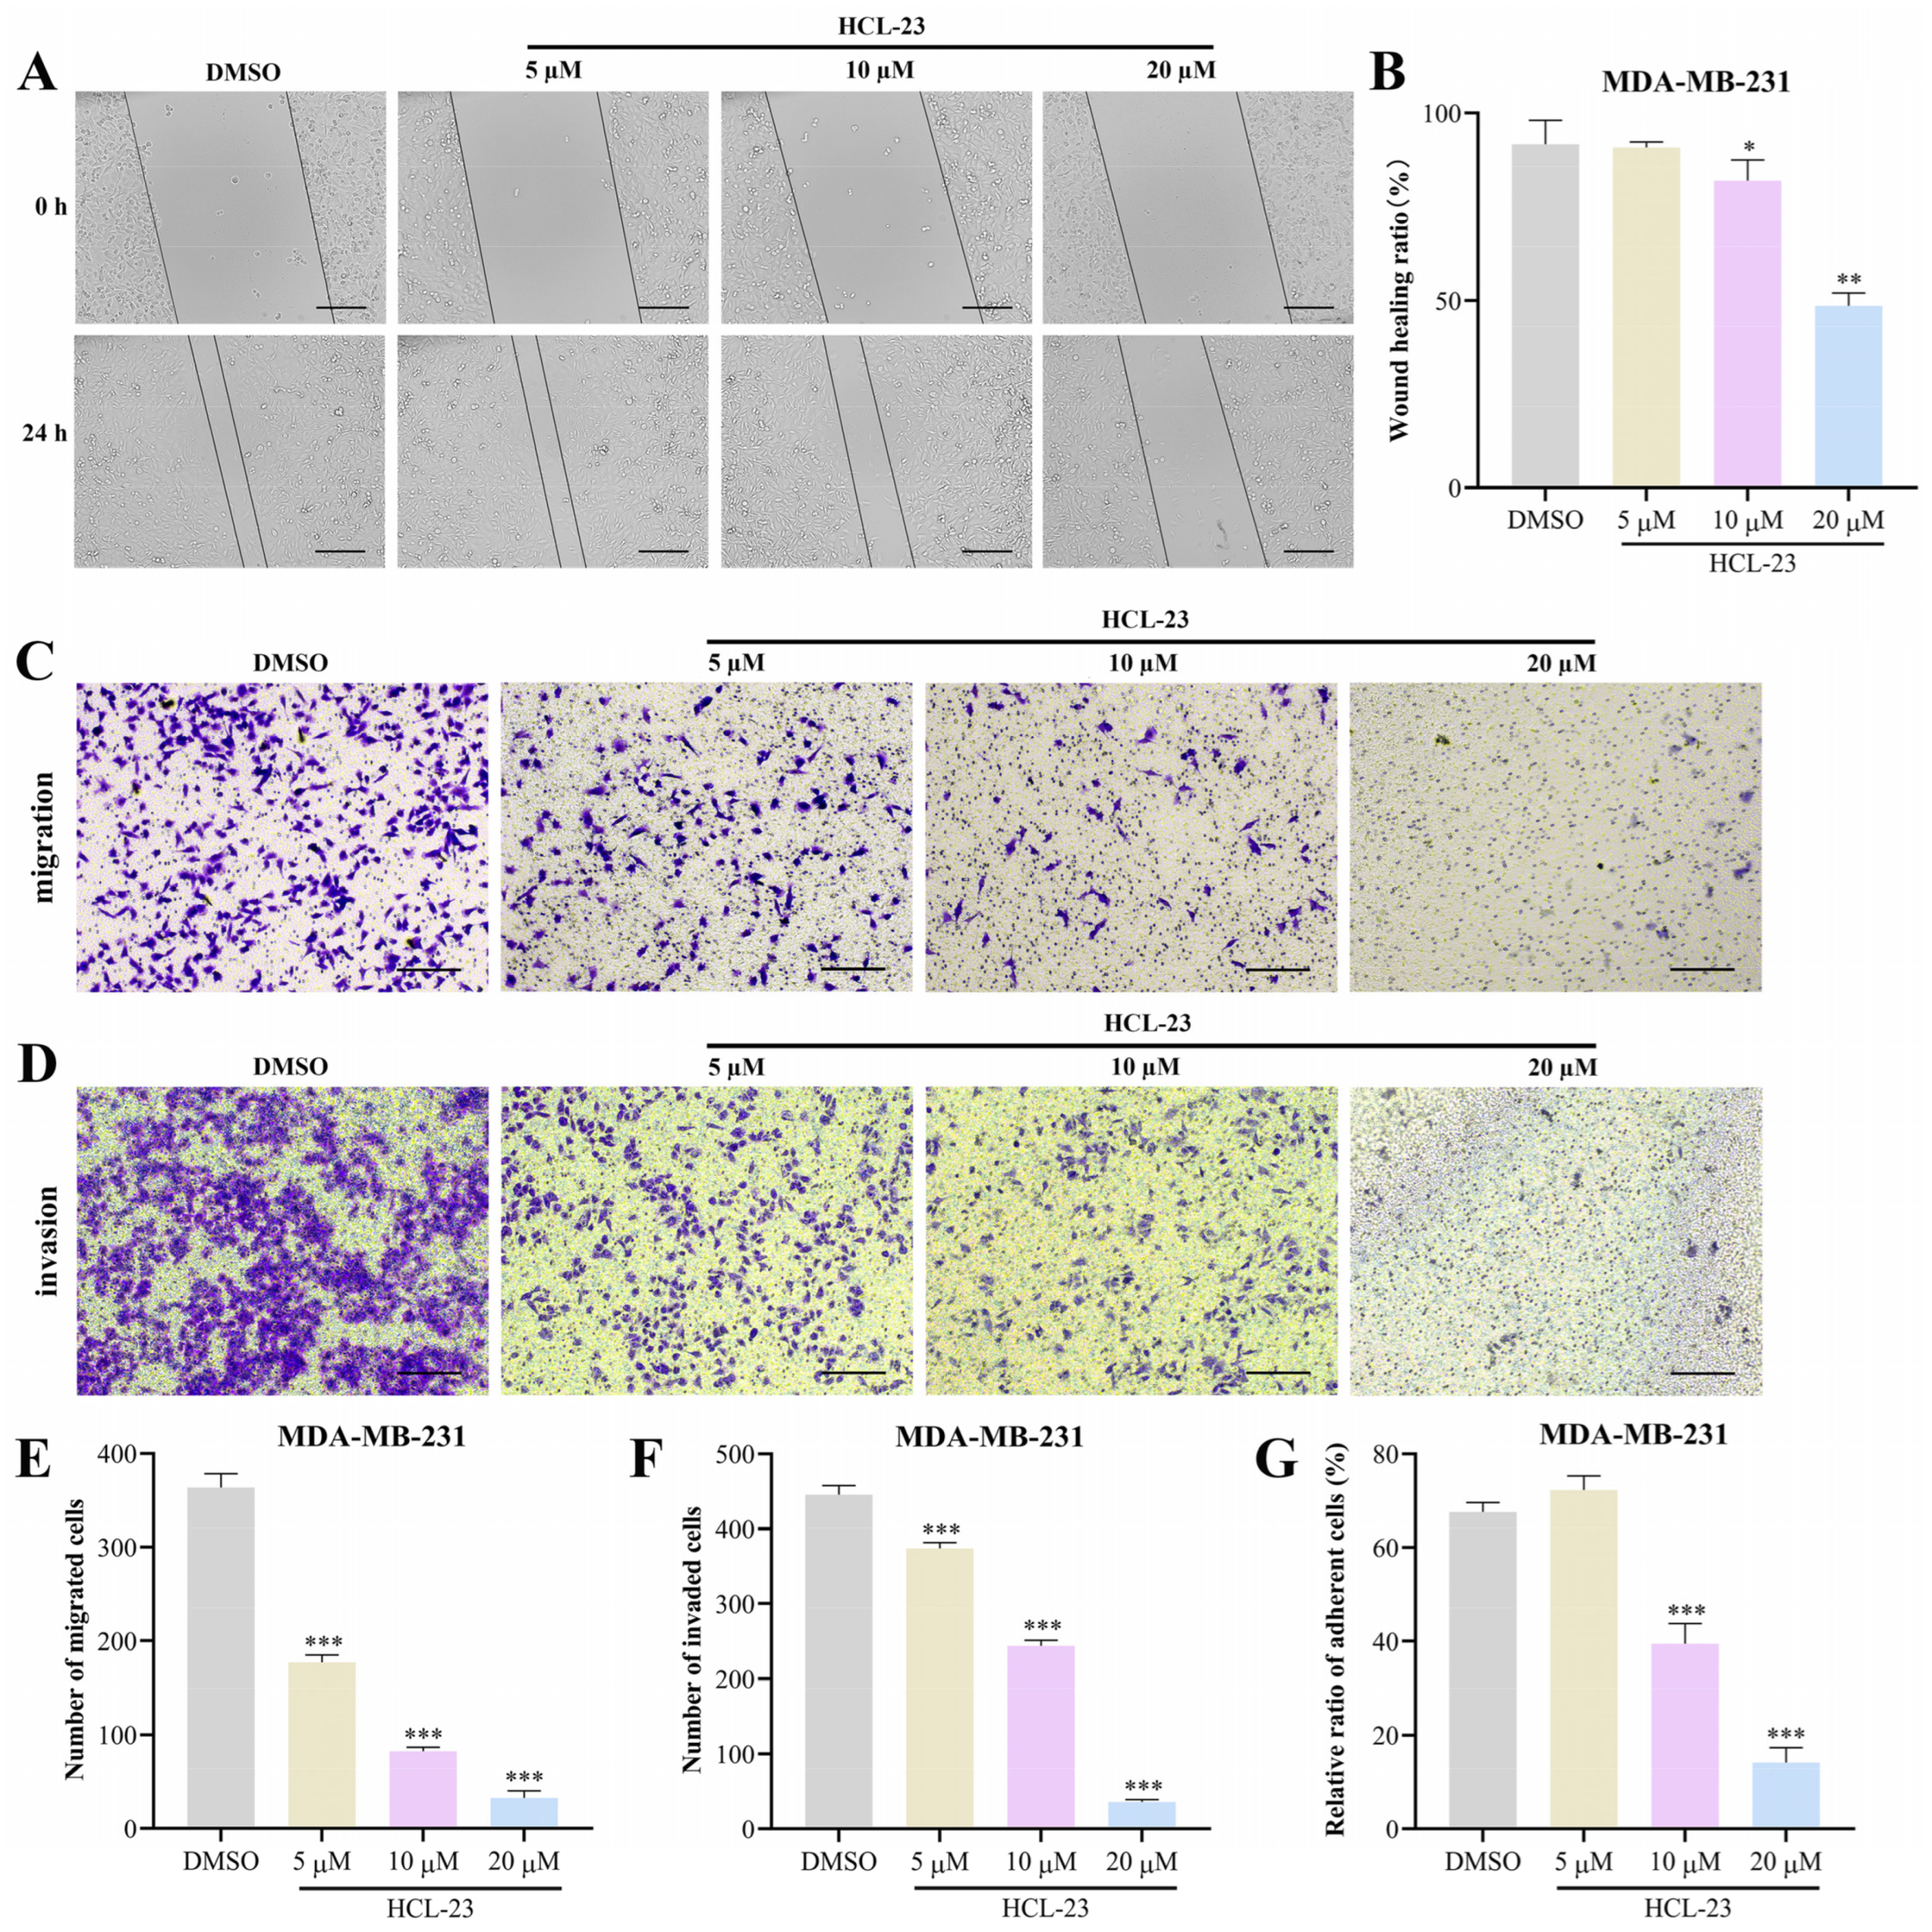
2.2. HCL-23 Suppresses the Migration, Invasion, and Adhesion of MDA-MB-231 Cells
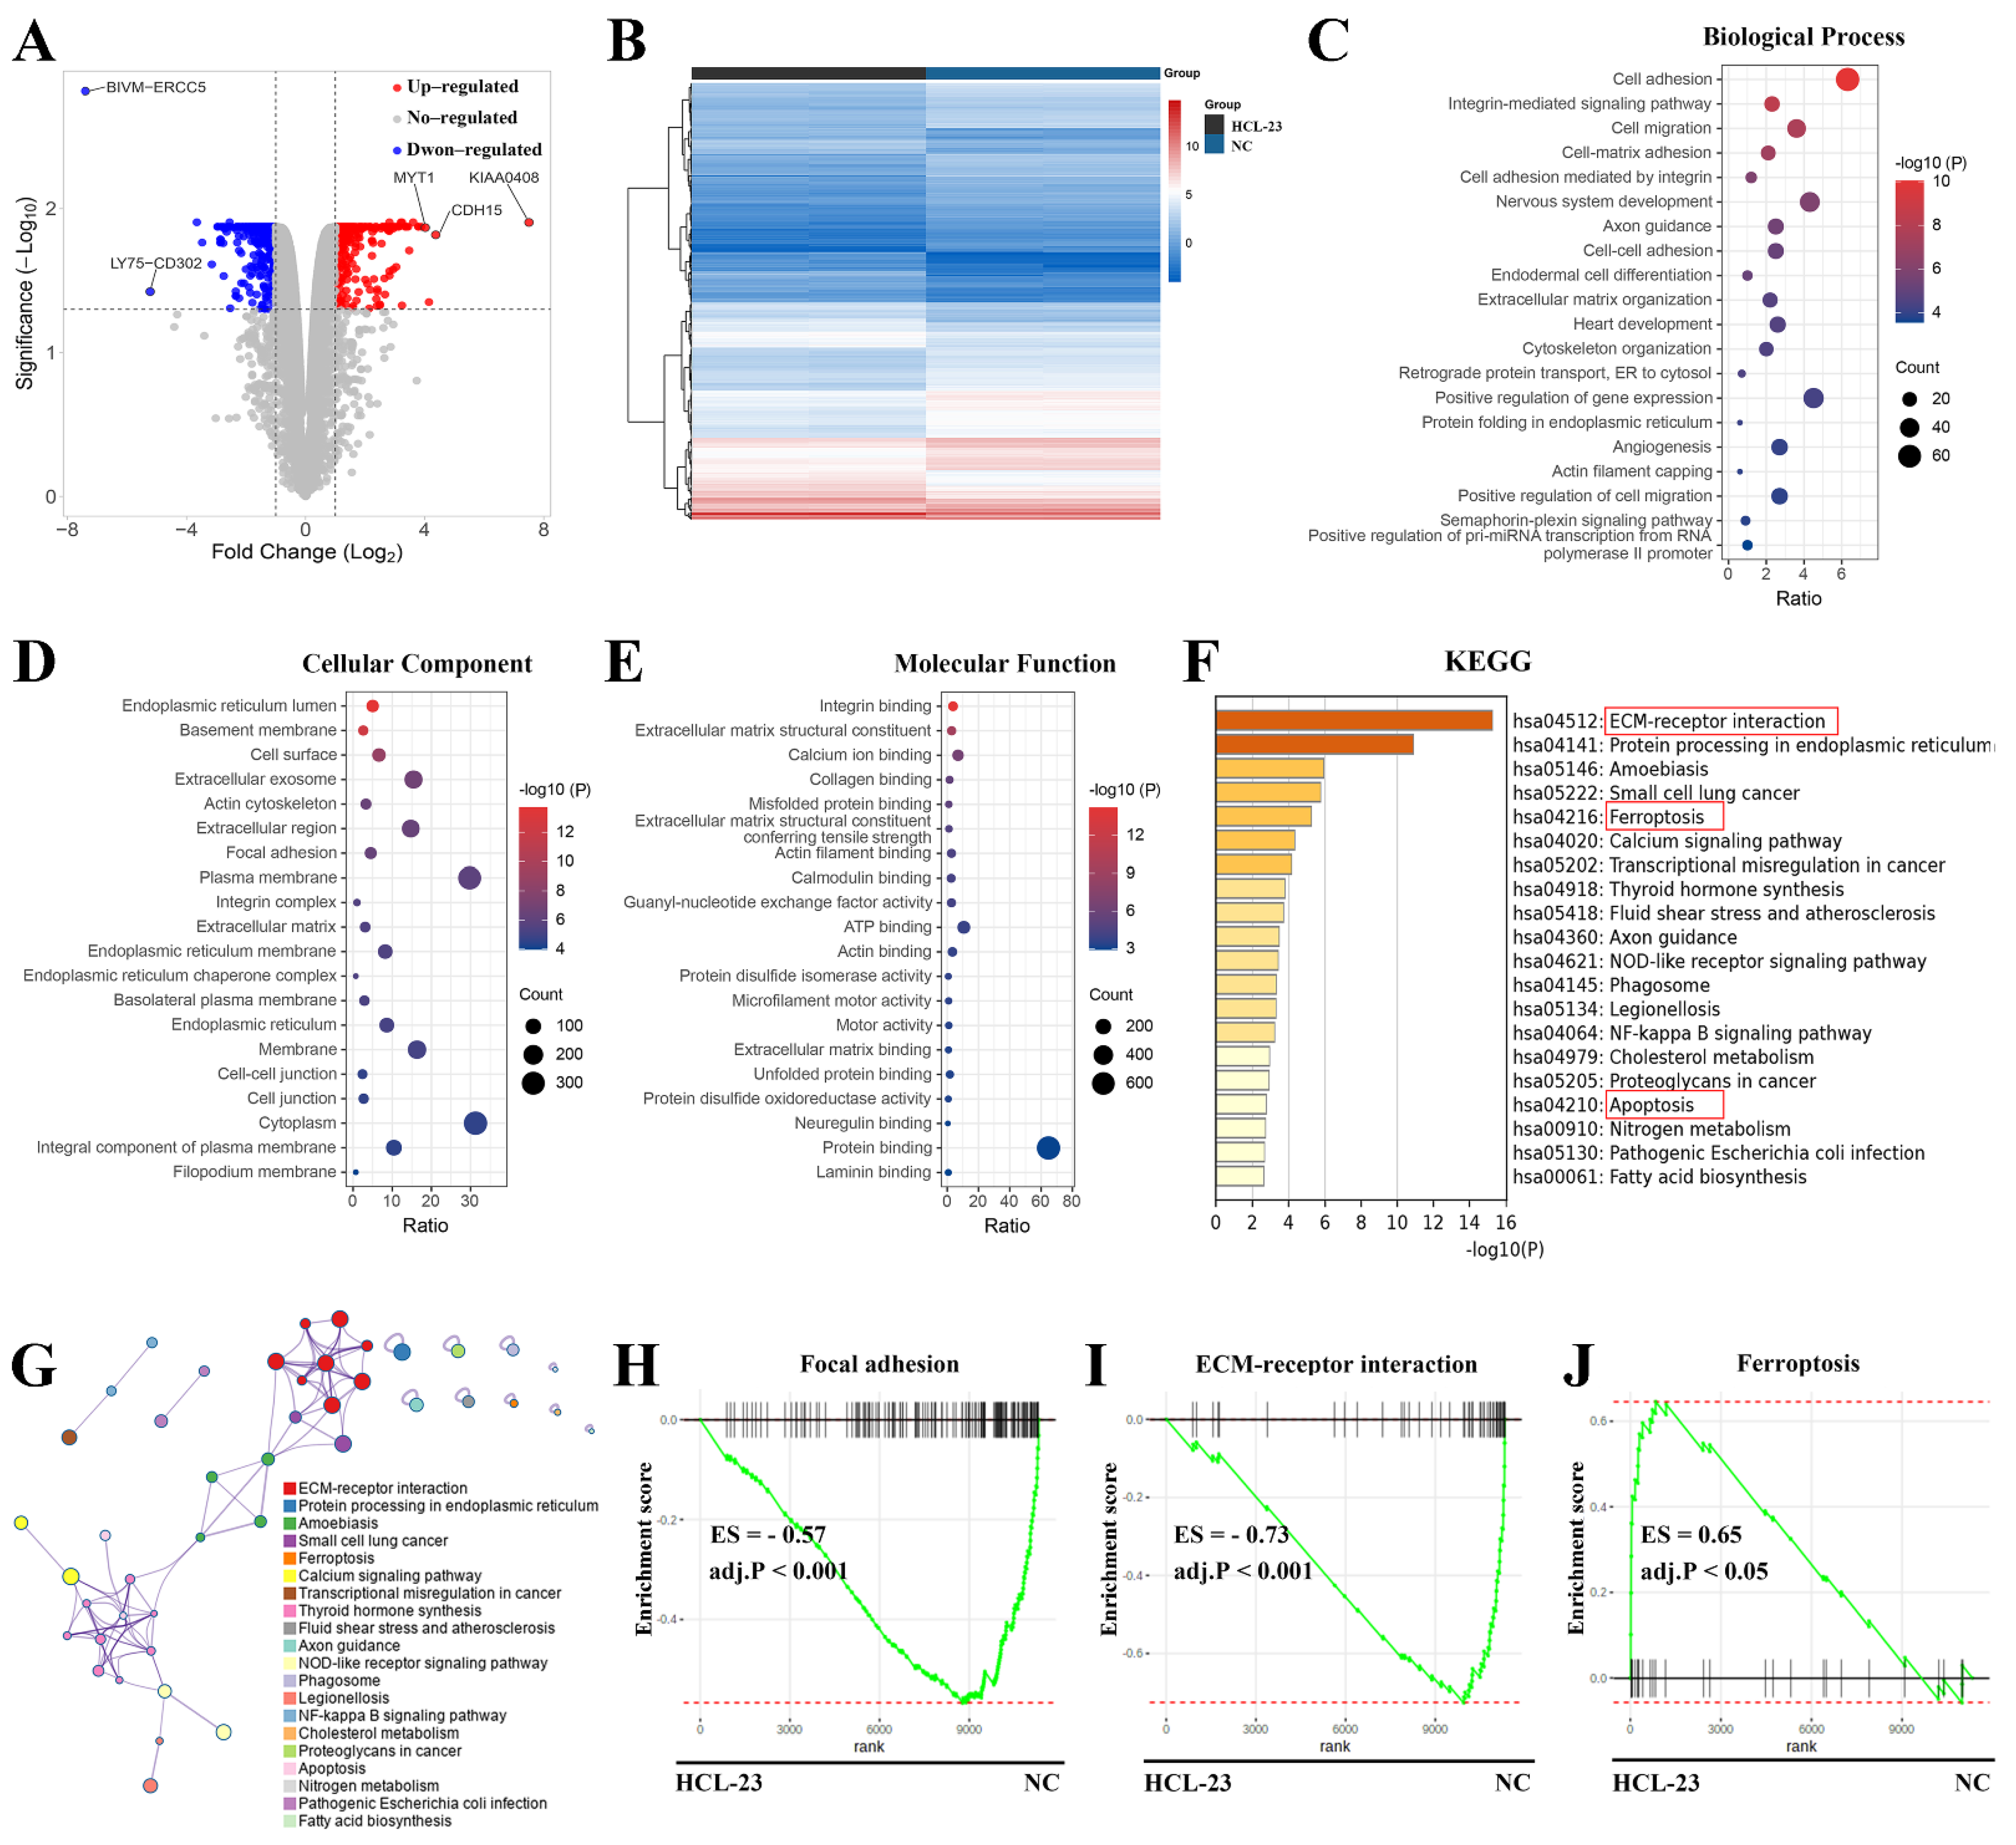
2.3. RNA-Seq Analysis of HCL-23-Related Biological Processes and Pathways
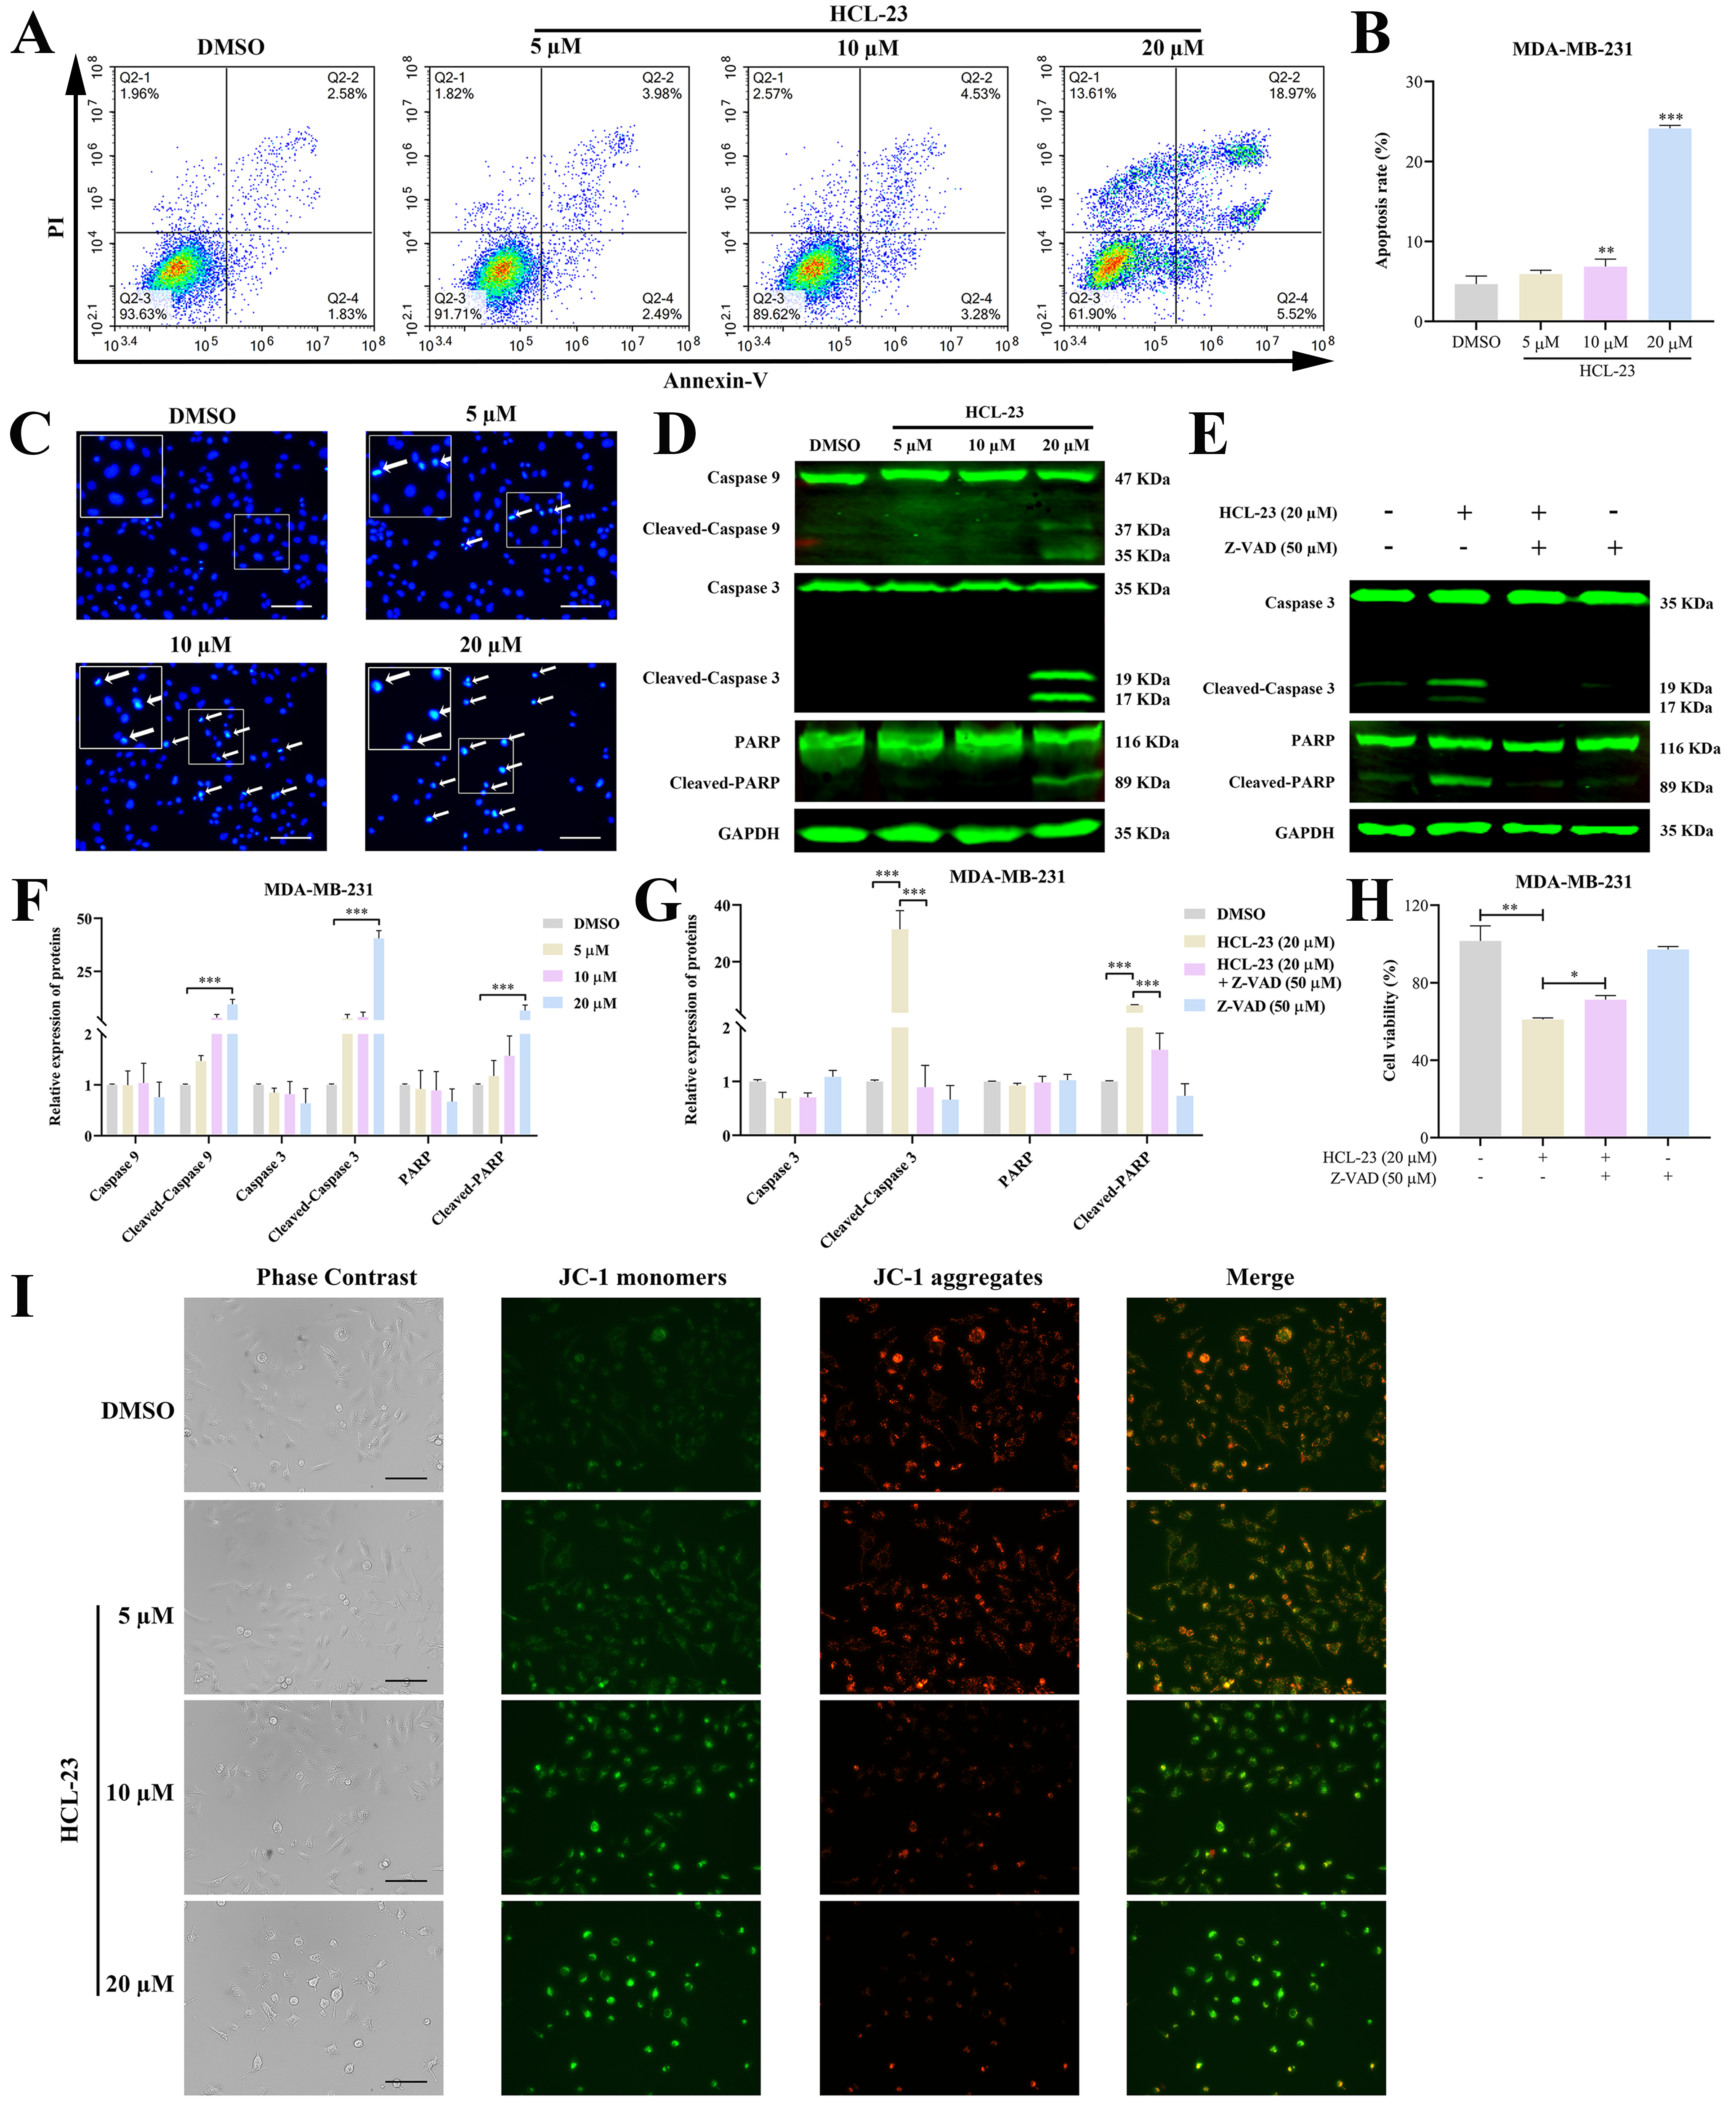
2.4. HCL-23 Induces Apoptosis in MDA-MB-231 Cells
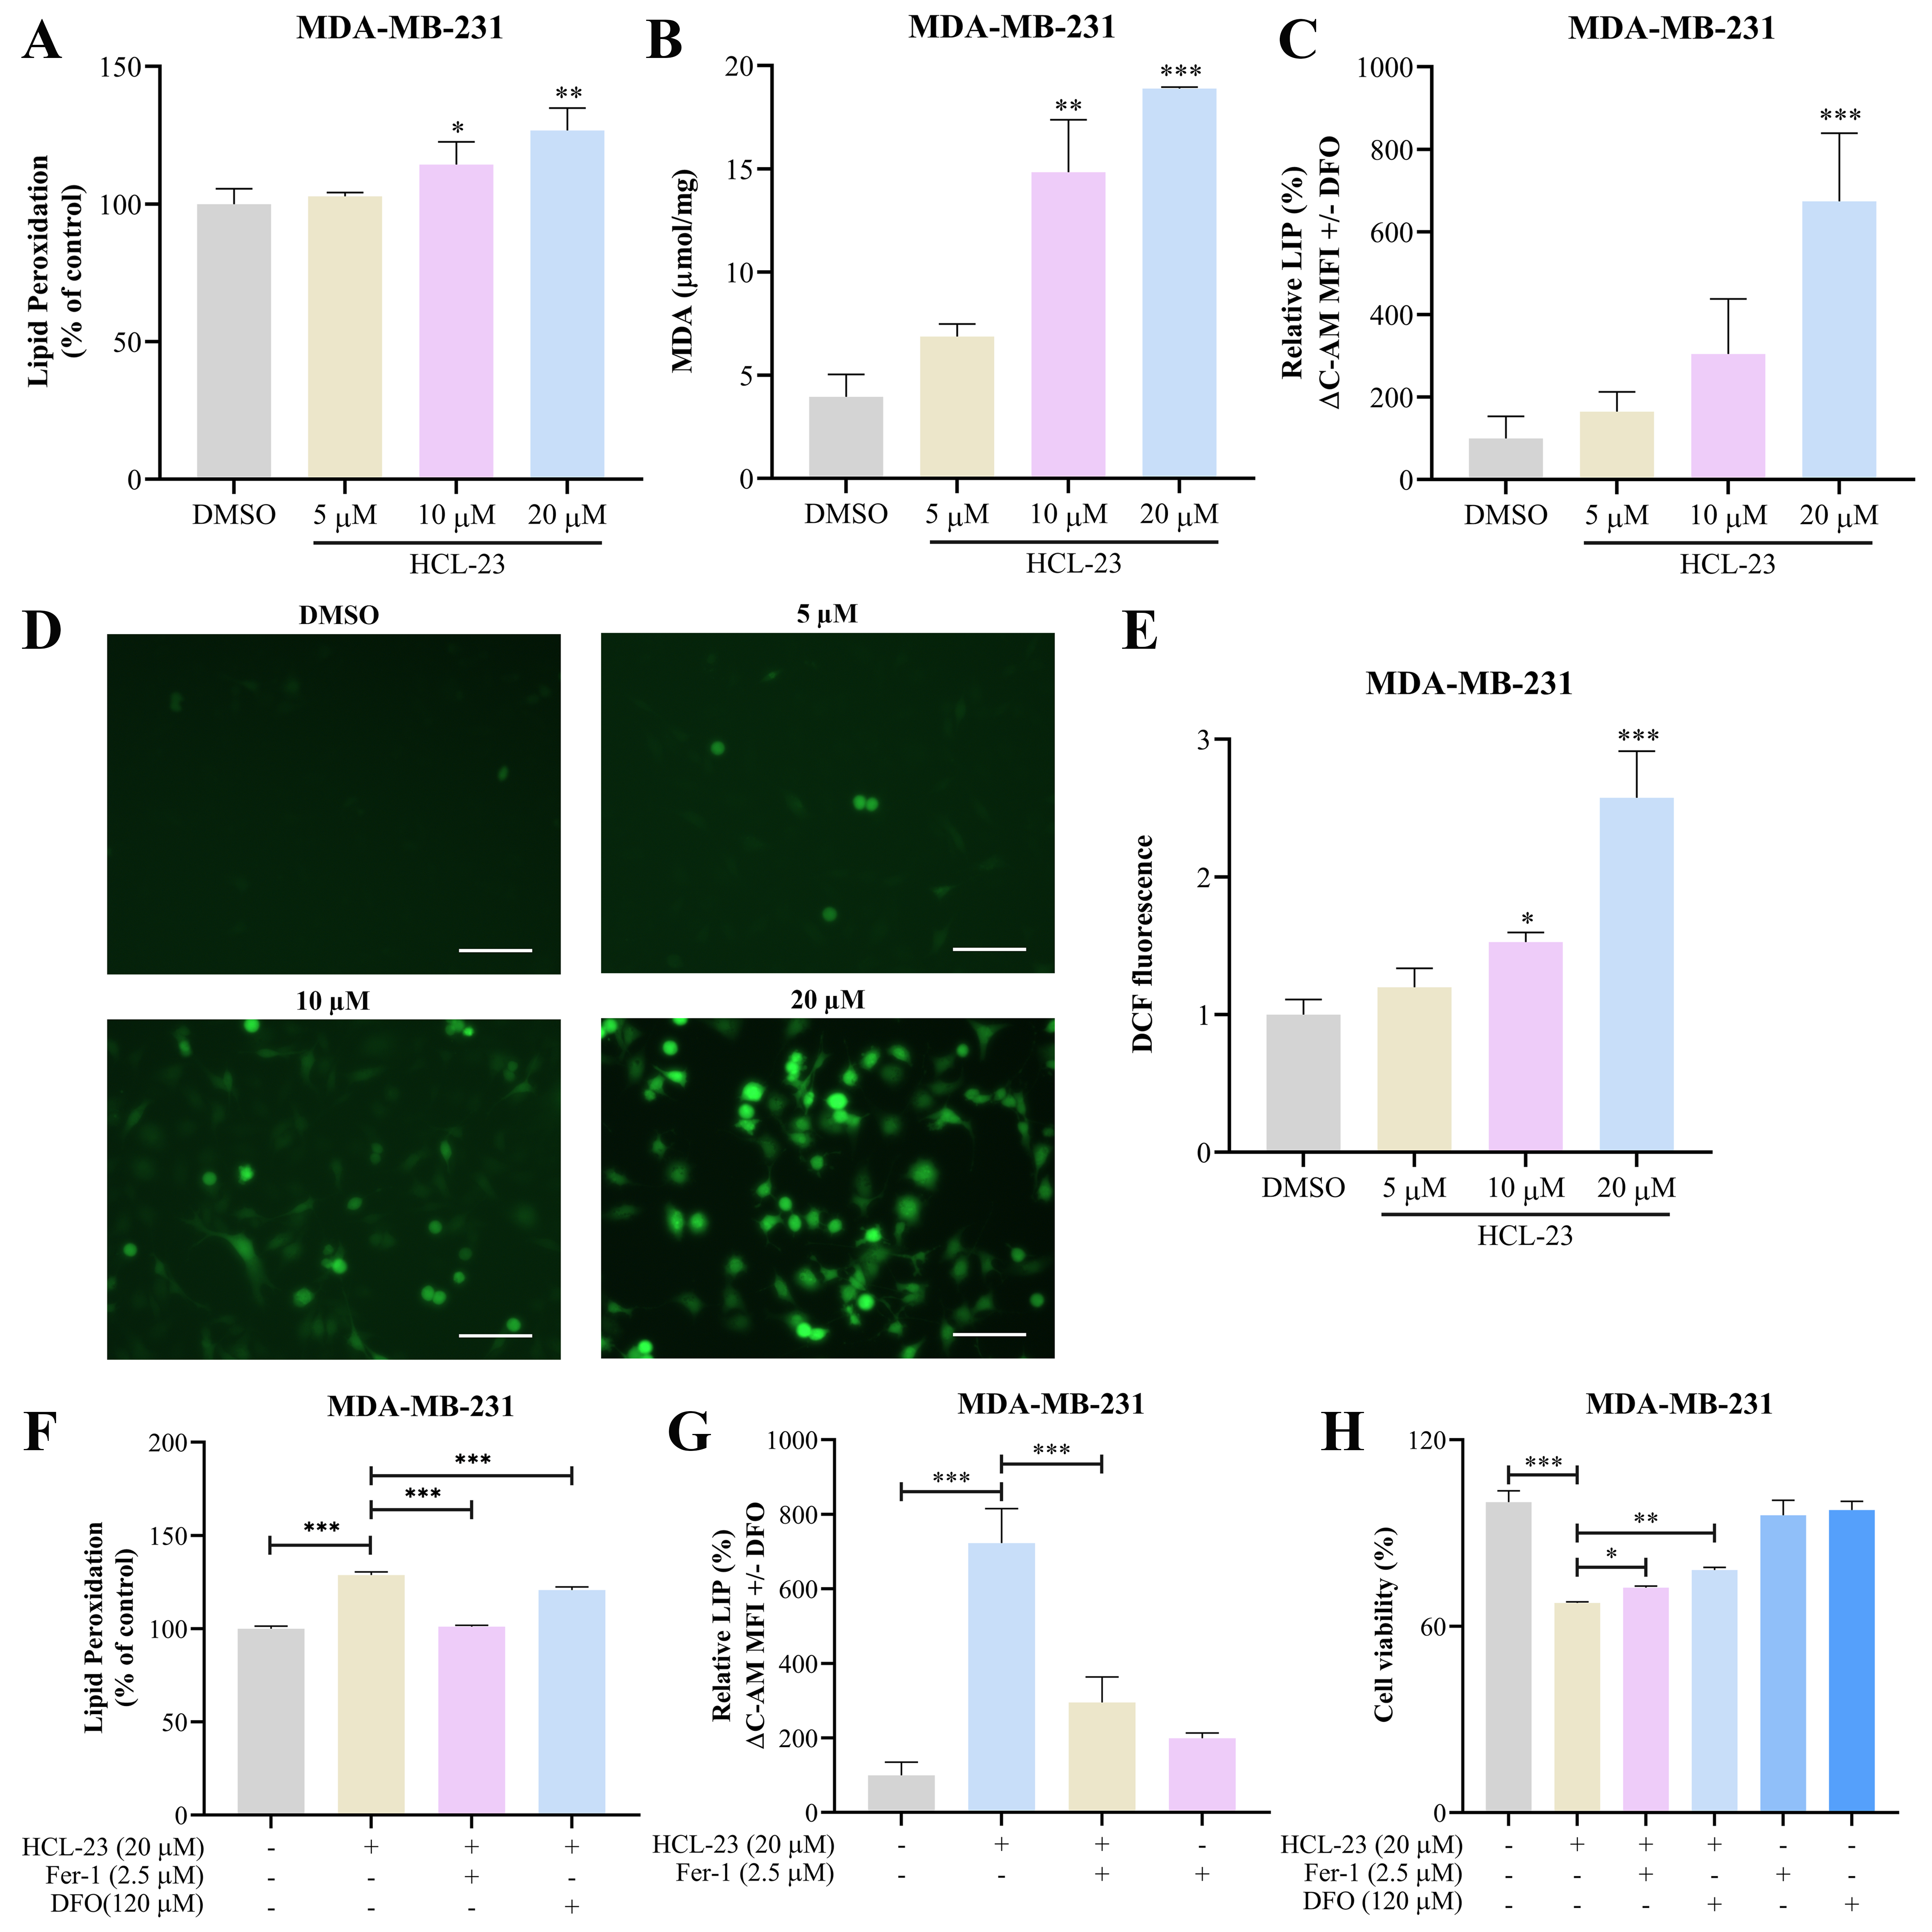
2.5. HCL-23 Triggers Ferroptosis in MDA-MB-231 Cells
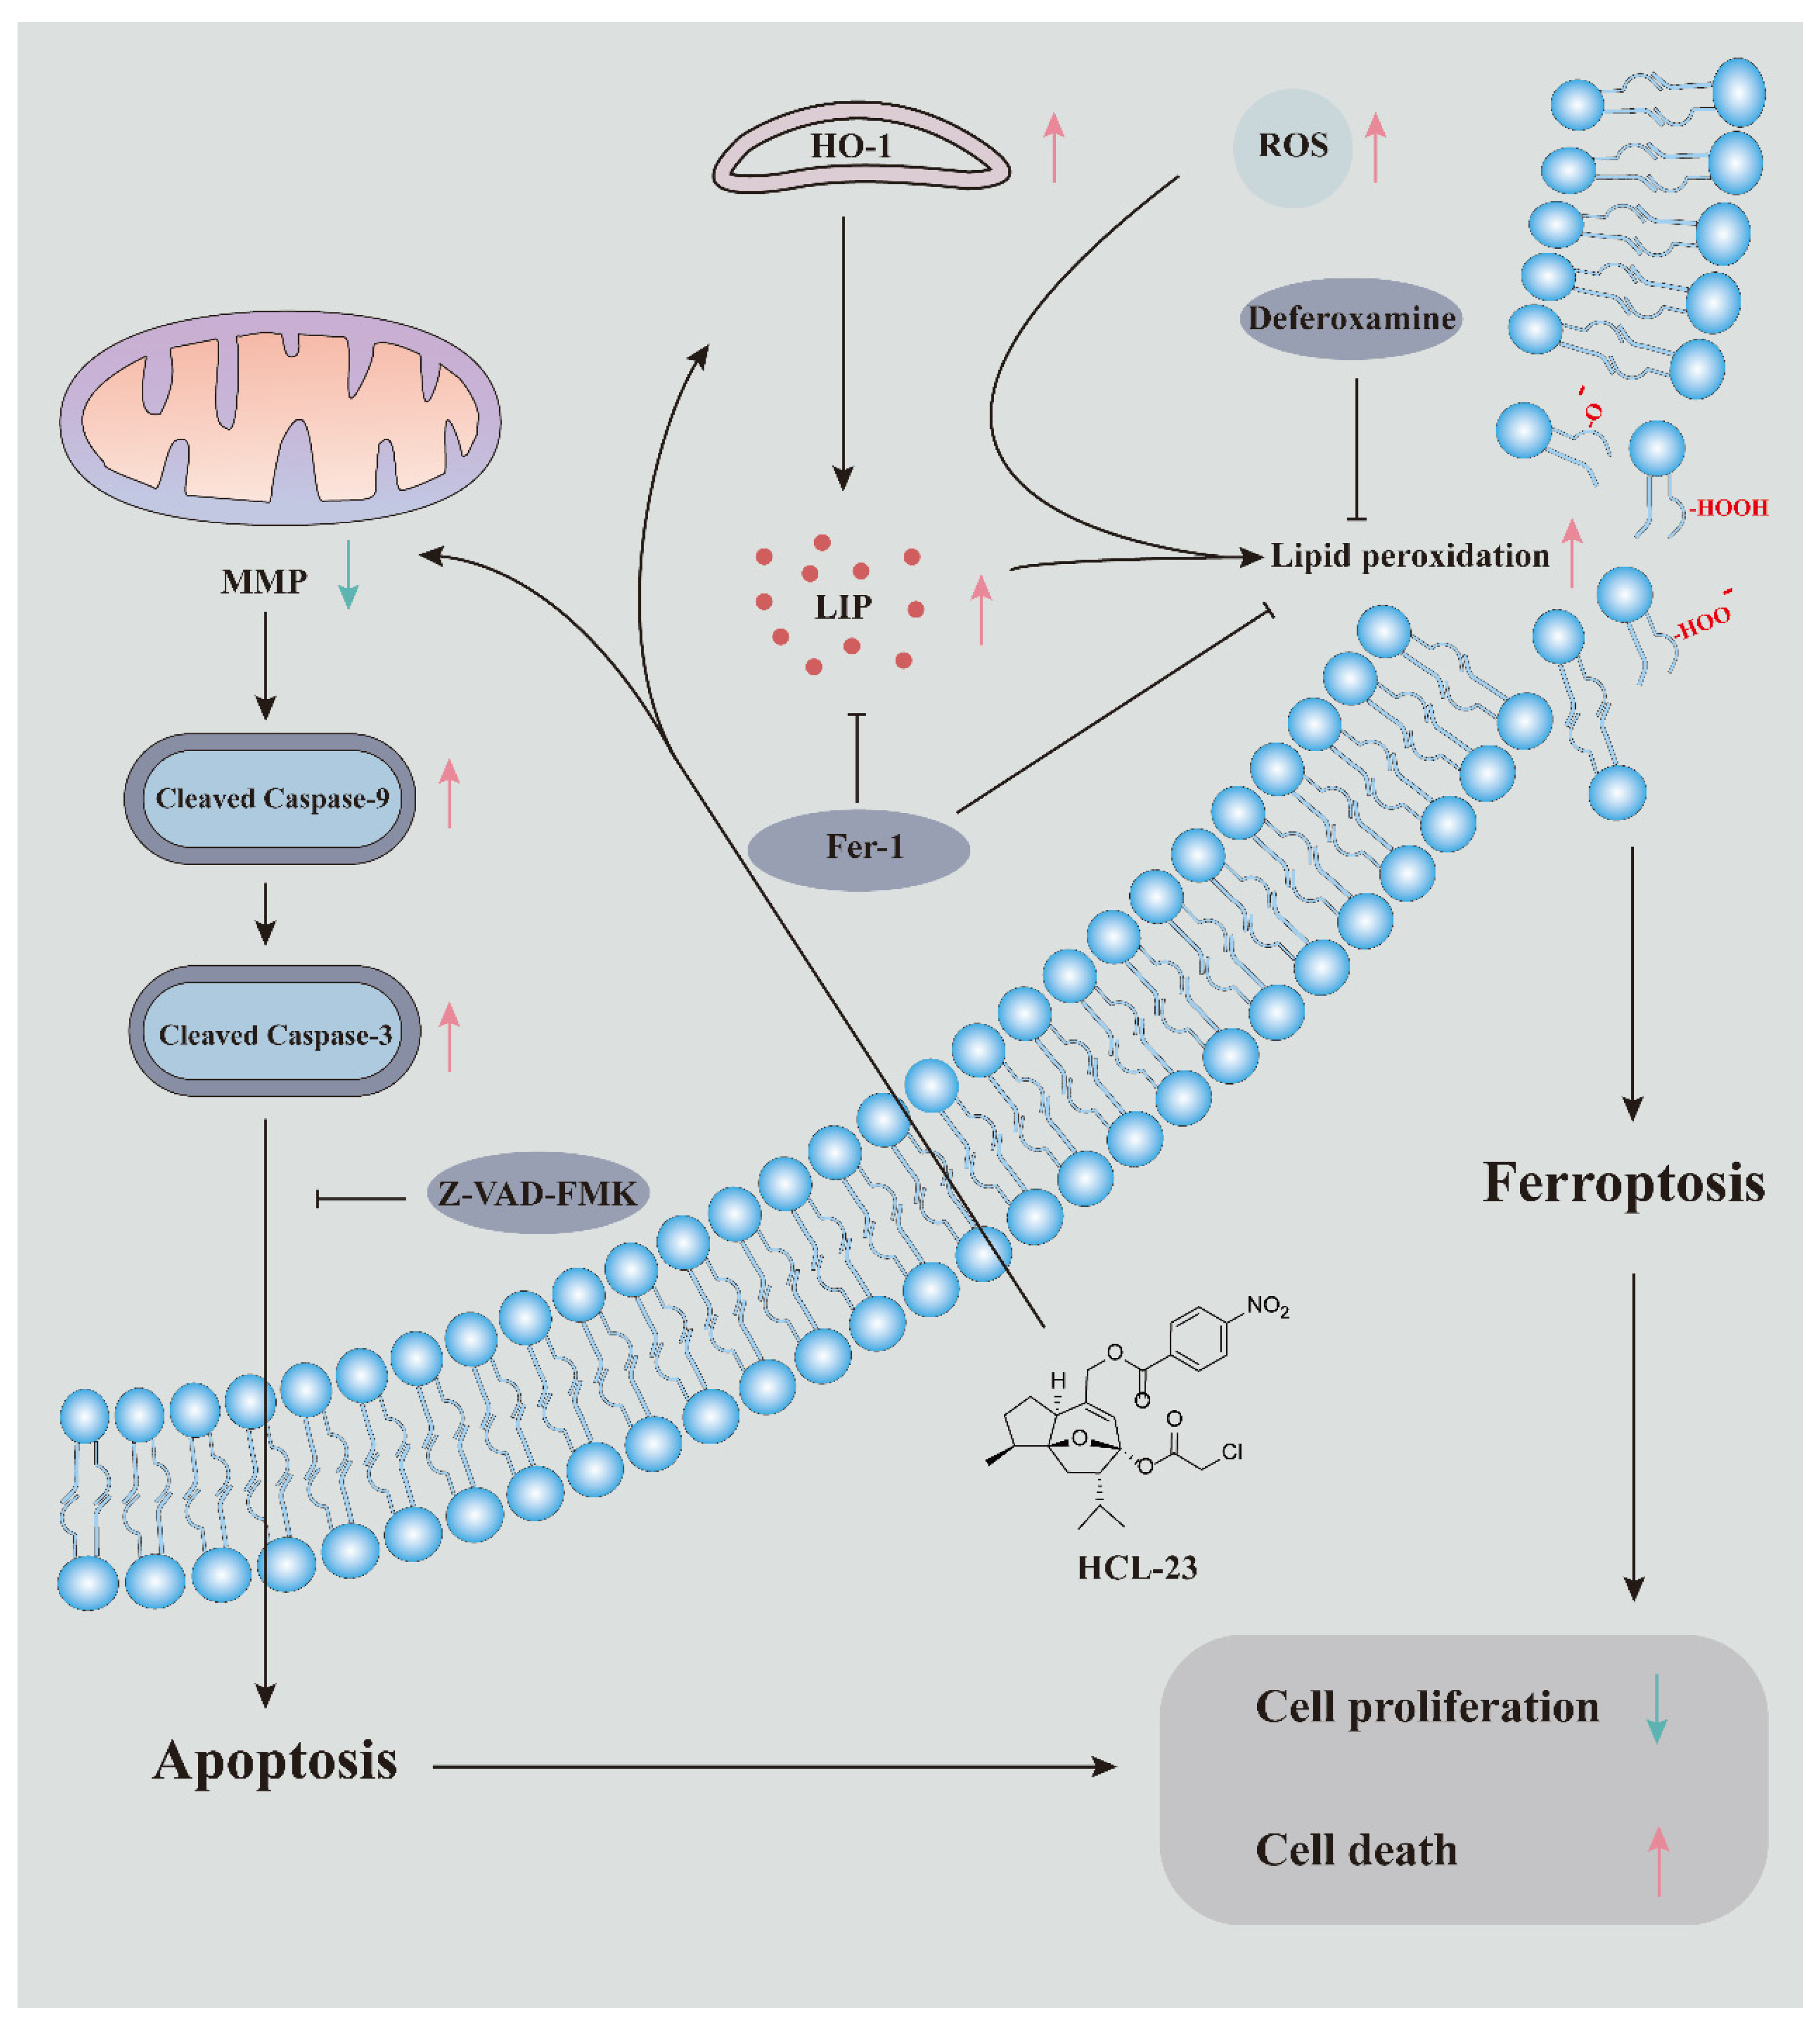
2.6. HCL-23 Induces Ferroptosis by Up-Regulating HO-1 Expression
2.7. HCL-23 Inhibits Breast Tumor Growth In Vivo
3. Discussion
4. Materials and Methods
4.1. Chemistry
4.2. Chemical Structure Information of HCL-13 and HCL-23
4.2.1. HCL-13
4.2.2. HCL-23
4.3. Cell Culture
4.4. Cell Viability Assay
4.5. Colony Formation Assay
4.6. Cell Cycle and Apoptosis Assay
4.7. Wound-Healing Assay
4.8. Transwell Invasion and Migration Assay
4.9. Cell Adhesion Assay
4.10. RNA-Seq and Functional Enrichment Analysis
4.11. Hoechst 33258 Staining
4.12. Mitochondrial Membrane Potential Assay
4.13. Measurement of Reactive Oxygen Species (ROS)
4.14. Measurement of Lipid Peroxidation
4.15. Measurement of Malondialdehyde (MDA)
4.16. Determination of Labile Iron Pool (LIP)
4.17. Western Blot Analysis
4.18. Quantitative Real-Time PCR (qPCR)
4.19. siRNA Transfection
4.20. In Vivo Experiment
4.21. Histology and Immunohistochemistry
4.22. Statistical Analysis
Supplementary Materials
Author Contributions
Funding
Institutional Review Board Statement
Informed Consent Statement
Data Availability Statement
Conflicts of Interest
References
- Sung, H.; Ferlay, J.; Siegel, R.L.; Laversanne, M.; Soerjomataram, I.; Jemal, A.; Bray, F. Global Cancer Statistics 2020: GLOBOCAN Estimates of Incidence and Mortality Worldwide for 36 Cancers in 185 Countries. CA Cancer J. Clin. 2021, 71, 209–249. [Google Scholar] [CrossRef] [PubMed]
- Loibl, S.; Poortmans, P.; Morrow, M.; Denkert, C.; Curigliano, G. Breast cancer. Lancet 2021, 397, 1750–1769. [Google Scholar] [CrossRef] [PubMed]
- Yin, L.; Duan, J.J.; Bian, X.W.; Yu, S.C. Triple-negative breast cancer molecular subtyping and treatment progress. Breast Cancer Res. 2020, 22, 61. [Google Scholar] [CrossRef] [PubMed]
- Waks, A.G.; Winer, E.P. Breast Cancer Treatment: A Review. JAMA 2019, 321, 288–300. [Google Scholar] [CrossRef] [PubMed]
- Bedoui, S.; Herold, M.J.; Strasser, A. Emerging connectivity of programmed cell death pathways and its physiological implications. Nat. Rev. Mol. Cell Biol. 2020, 21, 678–695. [Google Scholar] [CrossRef]
- Dixon, S.J.; Lemberg, K.M.; Lamprecht, M.R.; Skouta, R.; Zaitsev, E.M.; Gleason, C.E.; Patel, D.N.; Bauer, A.J.; Cantley, A.M.; Yang, W.S.; et al. Ferroptosis: An iron-dependent form of nonapoptotic cell death. Cell 2012, 149, 1060–1072. [Google Scholar] [CrossRef]
- Fu, D.; Wang, C.; Yu, L.; Yu, R. Induction of ferroptosis by ATF3 elevation alleviates cisplatin resistance in gastric cancer by restraining Nrf2/Keap1/xCT signaling. Cell Mol. Biol. Lett. 2021, 26, 26. [Google Scholar] [CrossRef]
- He, G.N.; Bao, N.R.; Wang, S.; Xi, M.; Zhang, T.H.; Chen, F.S. Ketamine Induces Ferroptosis of Liver Cancer Cells by Targeting lncRNA PVT1/miR-214-3p/GPX4. Drug Des. Devel. Ther. 2021, 15, 3965–3978. [Google Scholar] [CrossRef]
- Malfa, G.A.; Tomasello, B.; Acquaviva, R.; Genovese, C.; La Mantia, A.; Cammarata, F.P.; Ragusa, M.; Renis, M.; Di Giacomo, C. Betula etnensis Raf. (Betulaceae) Extract Induced HO-1 Expression and Ferroptosis Cell Death in Human Colon Cancer Cells. Int. J. Mol. Sci. 2019, 20, 2723. [Google Scholar] [CrossRef]
- Chen, C.; Xie, B.; Li, Z.; Chen, L.; Chen, Y.; Zhou, J.; Ju, S.; Zhou, Y.; Zhang, X.; Zhuo, W.; et al. Fascin enhances the vulnerability of breast cancer to erastin-induced ferroptosis. Cell Death Dis. 2022, 13, 150. [Google Scholar] [CrossRef]
- Yang, J.; Zhou, Y.; Xie, S.; Wang, J.; Li, Z.; Chen, L.; Mao, M.; Chen, C.; Huang, A.; Chen, Y.; et al. Metformin induces Ferroptosis by inhibiting UFMylation of SLC7A11 in breast cancer. J. Exp. Clin. Cancer Res. 2021, 40, 206. [Google Scholar] [CrossRef] [PubMed]
- Inayama, S.; Gao, J.; Harimaya, K.; Kawamata, T.; Iitaka, Y.; Guo, Y. The absolute stereostructure of curcumol isolated from Curocuma Wenyujin. Chem. Pharm. Bull. 1984, 32, 3783–3786. [Google Scholar] [CrossRef] [PubMed]
- Jia, S.; Guo, P.; Lu, J.; Huang, X.; Deng, L.; Jin, Y.; Zhao, L.; Fan, X. Curcumol Ameliorates Lung Inflammation and Airway Remodeling via Inhibiting the Abnormal Activation of the Wnt/beta-Catenin Pathway in Chronic Asthmatic Mice. Drug Des. Devel Ther. 2021, 15, 2641–2651. [Google Scholar] [CrossRef] [PubMed]
- Zheng, J.; Xu, Y.; Khan, A.; Sun, P.; Sun, Y.; Fan, K.; Yin, W.; Wang, S.; Li, H.; Sun, N. Curcumol inhibits encephalomyocarditis virus by promoting IFN-beta secretion. BMC Vet. Res. 2021, 17, 318. [Google Scholar] [CrossRef]
- Ning, L.; Ma, H.; Jiang, Z.; Chen, L.; Li, L.; Chen, Q.; Qi, H. Curcumol Suppresses Breast Cancer Cell Metastasis by Inhibiting MMP-9 Via JNK1/2 and Akt-Dependent NF-kappaB Signaling Pathways. Integr. Cancer Ther. 2016, 15, 216–225. [Google Scholar] [CrossRef] [PubMed]
- Zeng, C.; Fan, D.; Xu, Y.; Li, X.; Yuan, J.; Yang, Q.; Zhou, X.; Lu, J.; Zhang, C.; Han, J.; et al. Curcumol enhances the sensitivity of doxorubicin in triple-negative breast cancer via regulating the miR-181b-2-3p-ABCC3 axis. Biochem. Pharmacol. 2020, 174, 113795. [Google Scholar] [CrossRef]
- Huang, L.; Li, A.; Liao, G.; Yang, F.; Yang, J.; Chen, X.; Jiang, X. Curcumol triggers apoptosis of p53 mutant triple-negative human breast cancer MDA-MB 231 cells via activation of p73 and PUMA. Oncol. Lett. 2017, 14, 1080–1088. [Google Scholar] [CrossRef]
- Chen, L.; Lu, X.; Huang, L.; Jian, J.; Jin, J.; Gu, W.; Yuan, C.; Hao, X. Structural modification and inhibition of melanin activity of curcumol. Nat. Prod. Res. Dev. 2020, 32, 317–322. [Google Scholar] [CrossRef]
- Zilka, O.; Shah, R.; Li, B.; Friedmann Angeli, J.P.; Griesser, M.; Conrad, M.; Pratt, D.A. On the Mechanism of Cytoprotection by Ferrostatin-1 and Liproxstatin-1 and the Role of Lipid Peroxidation in Ferroptotic Cell Death. ACS Cent. Sci. 2017, 3, 232–243. [Google Scholar] [CrossRef]
- Lin, S.; Gao, W.; Zhu, C.; Lou, Q.; Ye, C.; Ren, Y.; Mehmood, R.; Huang, B.; Nan, K. Efficiently suppress of ferroptosis using deferoxamine nanoparticles as a new method for retinal ganglion cell protection after traumatic optic neuropathy. Biomater. Adv. 2022, 138, 212936. [Google Scholar] [CrossRef]
- Sui, M.; Jiang, X.; Chen, J.; Yang, H.; Zhu, Y. Magnesium isoglycyrrhizinate ameliorates liver fibrosis and hepatic stellate cell activation by regulating ferroptosis signaling pathway. Biomed. Pharmacother. 2018, 106, 125–133. [Google Scholar] [CrossRef] [PubMed]
- Wu, A.; Feng, B.; Yu, J.; Yan, L.; Che, L.; Zhuo, Y.; Luo, Y.; Yu, B.; Wu, D.; Chen, D. Fibroblast growth factor 21 attenuates iron overload-induced liver injury and fibrosis by inhibiting ferroptosis. Redox Biol. 2021, 46, 102131. [Google Scholar] [CrossRef] [PubMed]
- Newman, D.J.; Cragg, G.M. Natural Products as Sources of New Drugs over the Nearly Four Decades from 01/1981 to 09/2019. J. Nat. Prod. 2020, 83, 770–803. [Google Scholar] [CrossRef] [PubMed]
- Vagia, E.; Mahalingam, D.; Cristofanilli, M. The Landscape of Targeted Therapies in TNBC. Cancers 2020, 12, 916. [Google Scholar] [CrossRef] [PubMed]
- Valastyan, S.; Weinberg, R.A. Tumor metastasis: Molecular insights and evolving paradigms. Cell 2011, 147, 275–292. [Google Scholar] [CrossRef] [PubMed]
- Rigiracciolo, D.C.; Cirillo, F.; Talia, M.; Muglia, L.; Gutkind, J.S.; Maggiolini, M.; Lappano, R. Focal Adhesion Kinase Fine Tunes Multifaced Signals toward Breast Cancer Progression. Cancers 2021, 13, 645. [Google Scholar] [CrossRef]
- Luo, M.; Guan, J.L. Focal adhesion kinase: A prominent determinant in breast cancer initiation, progression and metastasis. Cancer Lett. 2010, 289, 127–139. [Google Scholar] [CrossRef]
- Wu, H.J.; Hao, M.; Yeo, S.K.; Guan, J.L. FAK signaling in cancer-associated fibroblasts promotes breast cancer cell migration and metastasis by exosomal miRNAs-mediated intercellular communication. Oncogene 2020, 39, 2539–2549. [Google Scholar] [CrossRef]
- Ding, J.; Lu, B.; Wang, J.; Wang, J.; Shi, Y.; Lian, Y.; Zhu, Y.; Wang, J.; Fan, Y.; Wang, Z.; et al. Long non-coding RNA Loc554202 induces apoptosis in colorectal cancer cells via the caspase cleavage cascades. J. Exp. Clin. Cancer Res. 2015, 34, 100. [Google Scholar] [CrossRef]
- Hasenjager, A.; Gillissen, B.; Muller, A.; Normand, G.; Hemmati, P.G.; Schuler, M.; Dorken, B.; Daniel, P.T. Smac induces cytochrome c release and apoptosis independently from Bax/Bcl-x(L) in a strictly caspase-3-dependent manner in human carcinoma cells. Oncogene 2004, 23, 4523–4535. [Google Scholar] [CrossRef]
- Zhang, S.; Zhao, X.; Hao, J.; Zhu, Y.; Wang, Y.; Wang, L.; Guo, S.; Yi, H.; Liu, Y.; Liu, J. The role of ATF6 in Cr(VI)-induced apoptosis in DF-1 cells. J. Hazard. Mater. 2021, 410, 124607. [Google Scholar] [CrossRef] [PubMed]
- Yu, J.; Ji, H.; Dong, X.; Feng, Y.; Liu, A. Apoptosis of human gastric carcinoma MGC-803 cells induced by a novel Astragalus membranaceus polysaccharide via intrinsic mitochondrial pathways. Int. J. Biol. Macromol. 2019, 126, 811–819. [Google Scholar] [CrossRef] [PubMed]
- van Loo, G.; Saelens, X.; van Gurp, M.; MacFarlane, M.; Martin, S.J.; Vandenabeele, P. The role of mitochondrial factors in apoptosis: A Russian roulette with more than one bullet. Cell Death Differ. 2002, 9, 1031–1042. [Google Scholar] [CrossRef] [PubMed]
- Park, W.H. Tempol Inhibits the Growth of Lung Cancer and Normal Cells through Apoptosis Accompanied by Increased O(2)(•-) Levels and Glutathione Depletion. Molecules 2022, 27, 7341. [Google Scholar] [CrossRef] [PubMed]
- Liu, T.; Lam, V.; Thieme, E.; Sun, D.; Wang, X.; Xu, F.; Wang, L.; Danilova, O.V.; Xia, Z.; Tyner, J.W.; et al. Pharmacologic Targeting of Mcl-1 Induces Mitochondrial Dysfunction and Apoptosis in B-Cell Lymphoma Cells in a TP53- and BAX-Dependent Manner. Clin. Cancer Res. 2021, 27, 4910–4922. [Google Scholar] [CrossRef] [PubMed]
- Sun, Y.; Qiao, Y.; Liu, Y.; Zhou, J.; Wang, X.; Zheng, H.; Xu, Z.; Zhang, J.; Zhou, Y.; Qian, L.; et al. ent-Kaurane diterpenoids induce apoptosis and ferroptosis through targeting redox resetting to overcome cisplatin resistance. Redox Biol. 2021, 43, 101977. [Google Scholar] [CrossRef]
- Li, K.; Lin, C.; Li, M.; Xu, K.; He, Y.; Mao, Y.; Lu, L.; Geng, W.; Li, X.; Luo, Z.; et al. Multienzyme-like Reactivity Cooperatively Impairs Glutathione Peroxidase 4 and Ferroptosis Suppressor Protein 1 Pathways in Triple-Negative Breast Cancer for Sensitized Ferroptosis Therapy. ACS Nano 2022, 16, 2381–2398. [Google Scholar] [CrossRef]
- Zou, Y.; Zheng, S.; Xie, X.; Ye, F.; Hu, X.; Tian, Z.; Yan, S.M.; Yang, L.; Kong, Y.; Tang, Y.; et al. N6-methyladenosine regulated FGFR4 attenuates ferroptotic cell death in recalcitrant HER2-positive breast cancer. Nat. Commun. 2022, 13, 2672. [Google Scholar] [CrossRef] [PubMed]
- Hassannia, B.; Vandenabeele, P.; Vanden Berghe, T. Targeting Ferroptosis to Iron Out Cancer. Cancer Cell 2019, 35, 830–849. [Google Scholar] [CrossRef]
- Han, S.; Lin, F.; Qi, Y.; Liu, C.; Zhou, L.; Xia, Y.; Chen, K.; Xing, J.; Liu, Z.; Yu, W.; et al. HO-1 Contributes to Luteolin-Triggered Ferroptosis in Clear Cell Renal Cell Carcinoma via Increasing the Labile Iron Pool and Promoting Lipid Peroxidation. Oxid Med. Cell Longev. 2022, 2022, 3846217. [Google Scholar] [CrossRef]
- Janero, D.R. Malondialdehyde and thiobarbituric acid-reactivity as diagnostic indices of lipid peroxidation and peroxidative tissue injury. Free Radic Biol. Med. 1990, 9, 515–540. [Google Scholar] [CrossRef]
- Jamal Uddin, M.; Joe, Y.; Kim, S.K.; Oh Jeong, S.; Ryter, S.W.; Pae, H.O.; Chung, H.T. IRG1 induced by heme oxygenase-1/carbon monoxide inhibits LPS-mediated sepsis and pro-inflammatory cytokine production. Cell Mol. Immunol. 2016, 13, 170–179. [Google Scholar] [CrossRef]
- Overhaus, M.; Moore, B.A.; Barbato, J.E.; Behrendt, F.F.; Doering, J.G.; Bauer, A.J. Biliverdin protects against polymicrobial sepsis by modulating inflammatory mediators. Am. J. Physiol. Gastrointest. Liver Physiol. 2006, 290, G695–G703. [Google Scholar] [CrossRef]
- Xu, J.; Zhu, K.; Wang, Y.; Chen, J. The dual role and mutual dependence of heme/HO-1/Bach1 axis in the carcinogenic and anti-carcinogenic intersection. J. Cancer Res. Clin. Oncol. 2023, 149, 483–501. [Google Scholar] [CrossRef]
- Pei, L.; Kong, Y.; Shao, C.; Yue, X.; Wang, Z.; Zhang, N. Heme oxygenase-1 induction mediates chemoresistance of breast cancer cells to pharmorubicin by promoting autophagy via PI3K/Akt pathway. J. Cell Mol. Med. 2018, 22, 5311–5321. [Google Scholar] [CrossRef] [PubMed]
- Nemeth, Z.; Li, M.; Csizmadia, E.; Döme, B.; Johansson, M.; Persson, J.L.; Seth, P.; Otterbein, L.; Wegiel, B. Heme oxygenase-1 in macrophages controls prostate cancer progression. Oncotarget 2015, 6, 33675–33688. [Google Scholar] [CrossRef] [PubMed]
- Du, J.; Wang, L.; Huang, X.; Zhang, N.; Long, Z.; Yang, Y.; Zhong, F.; Zheng, B.; Lan, W.; Lin, W.; et al. Shuganning injection, a traditional Chinese patent medicine, induces ferroptosis and suppresses tumor growth in triple-negative breast cancer cells. Phytomedicine 2021, 85, 153551. [Google Scholar] [CrossRef] [PubMed]
- Li, R.; Zhang, J.; Zhou, Y.; Gao, Q.; Wang, R.; Fu, Y.; Zheng, L.; Yu, H. Transcriptome Investigation and In Vitro Verification of Curcumin-Induced HO-1 as a Feature of Ferroptosis in Breast Cancer Cells. Oxid Med. Cell Longev. 2020, 2020, 3469840. [Google Scholar] [CrossRef] [PubMed]
- Yang, J.; Chen, L.; Yan, Y.; Qiu, J.; Chen, J.; Song, J.; Rao, Q.; Ben-David, Y.; Li, Y.; Hao, X. BW18, a C-21 steroidal glycoside, exerts an excellent anti-leukemia activity through inducing S phase cell cycle arrest and apoptosis via MAPK pathway in K562 cells. Biomed. Pharmacother. 2019, 112, 108603. [Google Scholar] [CrossRef]
- Zhou, G.; Soufan, O.; Ewald, J.; Hancock, R.E.W.; Basu, N.; Xia, J. NetworkAnalyst 3.0: A visual analytics platform for comprehensive gene expression profiling and meta-analysis. Nucleic Acids Res. 2019, 47, W234–W241. [Google Scholar] [CrossRef]
- Sherman, B.T.; Hao, M.; Qiu, J.; Jiao, X.; Baseler, M.W.; Lane, H.C.; Imamichi, T.; Chang, W. DAVID: A web server for functional enrichment analysis and functional annotation of gene lists (2021 update). Nucleic Acids Res. 2022, 50, W216–W221. [Google Scholar] [CrossRef] [PubMed]
- Zhou, Y.; Zhou, B.; Pache, L.; Chang, M.; Khodabakhshi, A.H.; Tanaseichuk, O.; Benner, C.; Chanda, S.K. Metascape provides a biologist-oriented resource for the analysis of systems-level datasets. Nat. Commun. 2019, 10, 1523. [Google Scholar] [CrossRef] [PubMed]


Disclaimer/Publisher’s Note: The statements, opinions and data contained in all publications are solely those of the individual author(s) and contributor(s) and not of MDPI and/or the editor(s). MDPI and/or the editor(s) disclaim responsibility for any injury to people or property resulting from any ideas, methods, instructions or products referred to in the content. |
© 2023 by the authors. Licensee MDPI, Basel, Switzerland. This article is an open access article distributed under the terms and conditions of the Creative Commons Attribution (CC BY) license (https://creativecommons.org/licenses/by/4.0/).
Share and Cite
Zhao, P.; Song, H.; Gao, F.; Chen, L.; Qiu, J.; Jin, J.; Pan, C.; Tang, Y.; Chen, M.; Pan, Y.; et al. A Novel Derivative of Curcumol, HCL-23, Inhibits the Malignant Phenotype of Triple-Negative Breast Cancer and Induces Apoptosis and HO-1-Dependent Ferroptosis. Molecules 2023, 28, 3389. https://doi.org/10.3390/molecules28083389
Zhao P, Song H, Gao F, Chen L, Qiu J, Jin J, Pan C, Tang Y, Chen M, Pan Y, et al. A Novel Derivative of Curcumol, HCL-23, Inhibits the Malignant Phenotype of Triple-Negative Breast Cancer and Induces Apoptosis and HO-1-Dependent Ferroptosis. Molecules. 2023; 28(8):3389. https://doi.org/10.3390/molecules28083389
Chicago/Turabian StyleZhao, Peng, Hui Song, Futian Gao, Liang Chen, Jianfei Qiu, Jun Jin, Chaolan Pan, Yunyan Tang, Meijun Chen, Yang Pan, and et al. 2023. "A Novel Derivative of Curcumol, HCL-23, Inhibits the Malignant Phenotype of Triple-Negative Breast Cancer and Induces Apoptosis and HO-1-Dependent Ferroptosis" Molecules 28, no. 8: 3389. https://doi.org/10.3390/molecules28083389
APA StyleZhao, P., Song, H., Gao, F., Chen, L., Qiu, J., Jin, J., Pan, C., Tang, Y., Chen, M., Pan, Y., Li, Y., Huang, L., Yang, J., & Hao, X. (2023). A Novel Derivative of Curcumol, HCL-23, Inhibits the Malignant Phenotype of Triple-Negative Breast Cancer and Induces Apoptosis and HO-1-Dependent Ferroptosis. Molecules, 28(8), 3389. https://doi.org/10.3390/molecules28083389