Article

Effect of Redox Potential on Diiron-Mediated Disproportionation of Hydrogen Peroxide

Research Group of Bioorganic and Biocoordination Chemistry, University of Pannonia, H-8201 Veszprém, Hungary
*
Author to whom correspondence should be addressed.
Molecules 2023, 28(7), 2905; https://doi.org/10.3390/molecules28072905
Submission received: 7 March 2023 / Revised: 20 March 2023 / Accepted: 22 March 2023 / Published: 23 March 2023
(This article belongs to the Section Inorganic Chemistry)

Abstract

:
Heme and nonheme dimanganese catalases are widely distributed in living organisms to participate in antioxidant defenses that protect biological systems from oxidative stress. The key step in these processes is the disproportionation of H2O2 to O2 and water, which can be interpreted via two different mechanisms, namely via the formation of high-valent oxoiron(IV) and peroxodimanganese(III) or diiron(III) intermediates. In order to better understand the mechanism of this important process, we have chosen such synthetic model compounds that can be used to map the nature of the catalytically active species and the factors influencing their activities. Our previously reported μ-1,2-peroxo-diiron(III)-containing biomimics are good candidates, as both proposed reactive intermediates (FeIVO and FeIII2(μ-O2)) can be derived from them. Based on this, we have investigated and compared five heterobidentate-ligand-containing model systems including the previously reported and fully characterized [FeII(L1−4)3]2+ (L1 = 2-(2′-pyridyl)-1H-benzimidazole, L2 = 2-(2′-pyridyl)-N-methyl-benzimidazole, L3 = 2-(4-thiazolyl)-1H-benzimidazole and L4 = 2-(4′-methyl-2′-pyridyl)-1H-benzimidazole) and the novel [FeII(L5)3]2+ (L5 = 2-(1H-1,2,4-triazol-3-yl)-pyridine) precursor complexes with their spectroscopically characterized μ-1,2-peroxo-diiron(III) intermediates. Based on the reaction kinetic measurements and previous computational studies, it can be said that the disproportionation reaction of H2O2 can be interpreted through the formation of an electrophilic oxoiron(IV) intermediate that can be derived from the homolysis of the O–O bond of the forming μ-1,2-peroxo-diiron(III) complexes. We also found that the disproportionation rate of the H2O2 shows a linear correlation with the FeIII/FeII redox potential (in the range of 804 mV-1039 mV vs. SCE) of the catalysts controlled by the modification of the ligand environment. Furthermore, it is important to note that the two most active catalysts with L3 and L5 ligands have a high-spin electronic configuration.

Graphical Abstract

1. Introduction

Iron and manganese are the most important candidates for both oxygen activation and environmental sustainability. Both metal ions have a variety of oxidation states that can be easily tuned in terms of Lewis acidity and hardness/softness, which can lead to fine-tuning of redox systems. Catalases (including hydrogen peroxide oxidoreductase) are important antioxidants necessary for life in oxygen-metabolizing cells to regulate H2O2 concentration by accelerating the disproportionation of a toxic oxygen metabolite, hydrogen peroxide, forming dioxygen and water [1,2,3,4,5]. H2O2 as reactive oxygen species (ROS) can easily be formed enzymatically by oxidases and non-enzymatically as a byproduct of respiration or autoxidation of cellular components. Most physio-pathological situations such as neurodegenerative diseases (Parkinson’s disease and Alzheimer’s disease), chronic inflammatory diseases, chronic obstructive pulmonary diseases (COPD), chronic kidney diseases (CKD), metabolic diseases (diabetes) or cancers can be associated with oxidative stress resulting from H2O2 [6,7,8,9,10,11,12,13,14]. Hydrogen peroxide exerts its toxic effects in several ways, including the activation of transition metal ions to Fenton chemistry, generating hydroxyl radicals that can damage of various biomolecules such as lipids, proteins or DNA and even cellular death [15,16,17,18].
Catalase enzymes are found in both aerobic prokaryotic and eukaryotic cells of aerobic organisms. Iron is an inorganic cofactor essential for many organisms. Bacteria adapt to the environment, which limits the availability of iron and the use of other metals such as manganese ions for their essential functions. Two families of catalases are known, one having a heme cofactor and the other a structurally distinct family containing nonheme manganese such as L. plantarum and T. thermophilus [1].
Heme-containing (type I) catalases are mostly found in aerobic organisms and have been characterized both structurally and biochemically. These enzymes bind an iron-porphyrin (FeP) redox cofactor in their active site, which undergoes a two-electron change in its oxidation state during the transformation from Fe(III)P to an Fe(IV)OP• oxo-ferryl porphyrin π-radical complex (Compound I) [4,5].
The involvement of manganese in oxygen metabolism is well known, e.g., in manganese superoxide dismutase with a mononuclear manganese and the photosynthetic oxygen-evolving complex with a tetranuclear manganese complexes in their active sites. Manganese catalases are generally rare compared with their type I heme-containing counterparts but are widely found in prokaryotic life. The manganese-containing nonheme type II catalases can be found in various microorganisms including the lactic acid bacteria (e.g., Lactobacillus plantarum (LPC) [19,20]) and thermophiles (e.g., Thermus thermophilus and Thermoleophilum album [21,22,23,24,25]). These enzymes differ in their active site, which leads to different biological functions; the L. plantarum enzyme can act as catalase, whereas the T. thermophilus (TTC) enzyme can function as a catalase/peroxidase (Scheme 1A). These enzymes (so-called “pseudocatalases”) contain a dinuclear manganese active site that changes between the reduced Mn2(II,II) and oxidized Mn3(III,III) forms during the catalytic cycles, which can be interpreted through the formation of a terminal peroxo intermediate and its activation via O–O bond cleavage [20,25]. Since the heme-containing catalase forms an extremely reactive intermediate that can oxidize protein side chains in the absence of hydrogen peroxide, manganese catalases whose active site is stable both in oxidized and reduced forms may provide an advantage at low hydrogen peroxide levels [26].
In contrast to their structure, the cyanobacterial manganese catalase (KatB) from Anabaena shows a significantly different active site that shows high similarity to the active site of the ferritin-like ruberythrin (RBR) enzymes [27]. RBRs are nonheme diiron proteins, found in many organisms and serve as peroxide scavengers in defense against oxidative stress similarly to Mn catalases. The Mn–Mn distance in KatB (~3.8 Å) is almost identical to that observed for iron-containing ribonucleotide reductase R2 (3.6–3.7 Å). In contrast to the TTC and LPC enzymes with short Mn–Mn distances (3.0–3.1 Å), the symmetric active sites and the relatively large M–M distances in KatB and R2 favor the μ-1,2-binding mode of the peroxide (Scheme 1B). The high degree of similarity of the active centers of these enzymes presupposes similar reactive intermediates and similar reaction mechanisms. The relatively large M–M distance in the enzyme KatB and R2 may lead to the homolysis of the peroxo intermediate, resulting in the formation of reactive oxoiron(IV)/oxomanganese(IV) species. Based on this hypothesis, a mechanism similar to oxoiron(IV)-containing heme catalases cannot be ruled out.
Harmful effects of H2O2 on biological processes such as aging, cancer and neurodegenerative diseases have been confirmed by numerous studies. These findings led to the development of synthetic catalase mimetics as therapeutic agents that may be effective against oxidative stress in human diseases such as cancer, Alzheimer’s disease, aging and inflammatory and heart diseases. Among them, manganese-based mimics are the most widely investigated, mainly because of their low toxicity (Mn is not prone to generate HO• radical in Fenton type reactions); however, there are several iron- and copper-based systems too. A number of mechanistic and spectroscopic studies have been reported on the catalase activity of non-porphyrin mono- and dinuclear complexes with various ligands including Schiff bases, corroles, polyamines and polypyridyl derivatives. These papers mainly focused on the comparison of mono and dinuclear copper, manganese and iron complexes and the effect of various factors such as ligand donor sites, endogenous acid/base groups and steric parameters [28,29,30,31,32,33,34,35,36,37].
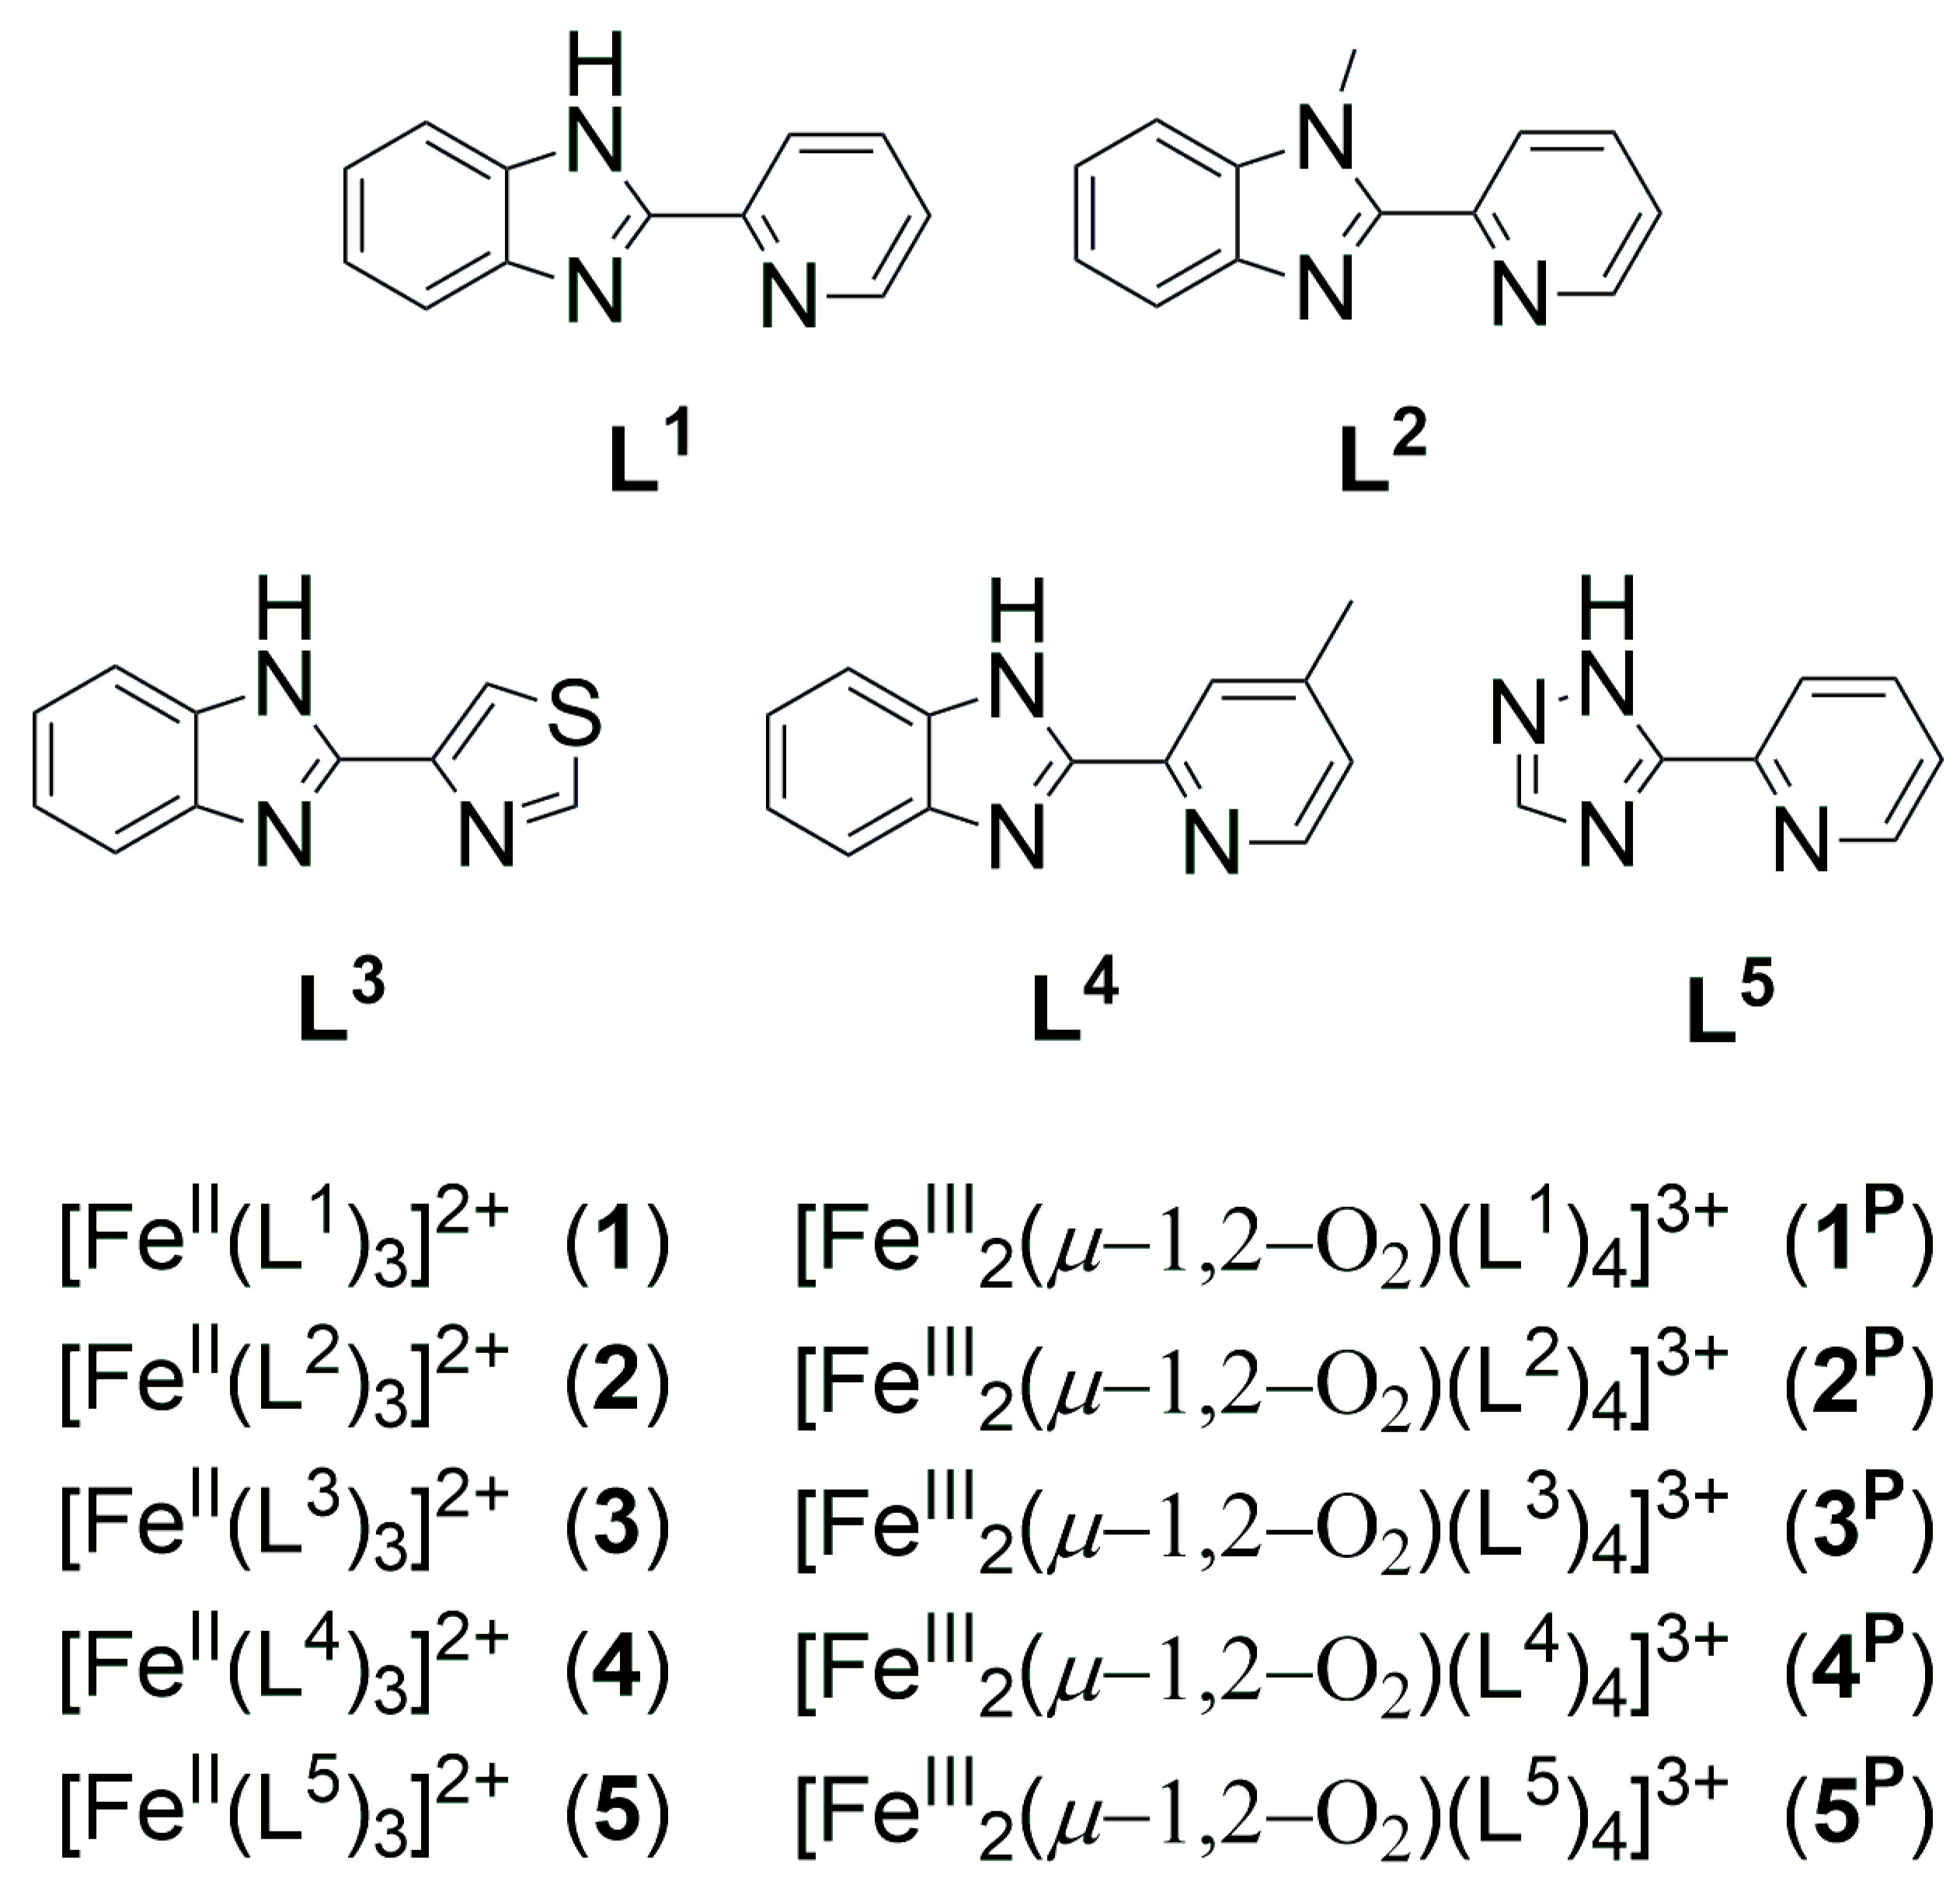
As a possible structural and functional model of dimanganese and diiron (RBR) catalase enzymes, we have recently investigated the reactivity and the mechanism of two different kinds of peroxo-diiron(III) adducts, namely [FeIII2(μ-O2)(L1−2)4(CH3CN)]4+ (L1 = 2-(2′-pyridyl)-1H-benzimidazole, L2 = 2-(2′-pyridyl)-N-methyl-benzimidazole) [38,39,40,41] and [FeIII2(μ-O)(μ-1,2-O2)(IndH)2(Solv)2]2+ (IndH = 1,3-bis(2-pyridyl-imino)-isoindolines), with H2O2 and compared their mechanisms [42,43,44,45]. In the first case we have obtained direct kinetic and computational evidence for the formation of low-spin oxoiron(IV) via the dissociation process [40], whereas in the second case the peroxo-diiron(III) intermediate was the key intermediate [45]. As a continuation of these studies, five heterobidentate-ligand-containing model compounds, including the previously reported and fully characterized [FeII(L1−2)3]2+ [39], [FeII(L3)3]2+ [46] and [FeII(L4)3]2+ [47] (L1 = 2-(2′-pyridyl)-1H-benzimidazole, L2 = 2-(2′-pyridyl)-N-methyl-benzimidazole, L3 = 2-(4-thiazolyl)-1H-benzimidazole and L4 = 2-(4′-methyl-2′-pyridyl)-1H-benzimidazole) and the novel [FeII(L5)3]2+ (L5 = 2-(1H-1,2,4-triazol-3-yl)pyridine), were selected to investigate the mechanism and the effect of the redox potential and the spin-state of the catalyst on the reactivity towards H2O2 (Scheme 2).

2. Results and Discussions

The UV–Vis spectra of complexes 1, 2 and 4 in acetonitrile showed two major features, a band around 380–550 nm and a stronger band around 270–370 nm (Figure 1a). These bands are typical for pyridine-based ligands containing low-spin iron(II) complexes and can be assigned to metal-to-ligand charge transfer (MLCT) and ligand-centered π to π* transitions, respectively [39,48,49,50,51]. In contrast to the low-spin complexes 1, 2 and 4, in solution, 3 and 5 show no absorption in the visible region, which is consistent with the latter complexes’ high-spin electronic configuration [46]. A general bathochromic effect was observed as the number of aromatic rings increased in the ligand framework (see L1, L2 and L4 compared with L5). This phenomenon can be explained by an important delocalization of π electrons promoted by the linear annelation. Spectroscopic and redox data for complexes 1 to 5 are summarized in Table 1.
Complexes 15 exhibit a quasi-reversible redox couple at ca. 860.5, 805.5, 946, 804 and 1039 mV vs. SCE, respectively (Figure 1b). The FeIII/FeII redox couples for 3 and 5 are at considerably higher potentials than for 2 and 4. The electrochemical data confirm that in compounds 3 and 5 the iron centers are stronger Lewis acids than those in 2 and 4, which can be explained with the electron withdrawing nature of the thiazolyl and triazolyl groups compared with pyridyl and benzimidazole, respectively. Introducing an electron-donating methyl substituent at the 5-position of the pyridine rings (4) shifted the half-way potential to about 56.5 mV more negative than that of 1, strengthening the electron density of FeIII d-orbitals and making oxidation less facile. Almost the same effect was observed in the case of the N-methylated benzimidazole arm of 2 (55 mV). A linear correlation was found between the energy of the metal-to-ligand charge transfer (MLCT) band and the half-wave potentials, indicating that the substitutions performed on the ligand greatly influenced the electron density of the metal center and thereby its redox properties (Figure 2a). These data can also serve as a basis to investigate possible correlations between the half-wave potentials of the catalysts and their catalytic activities.
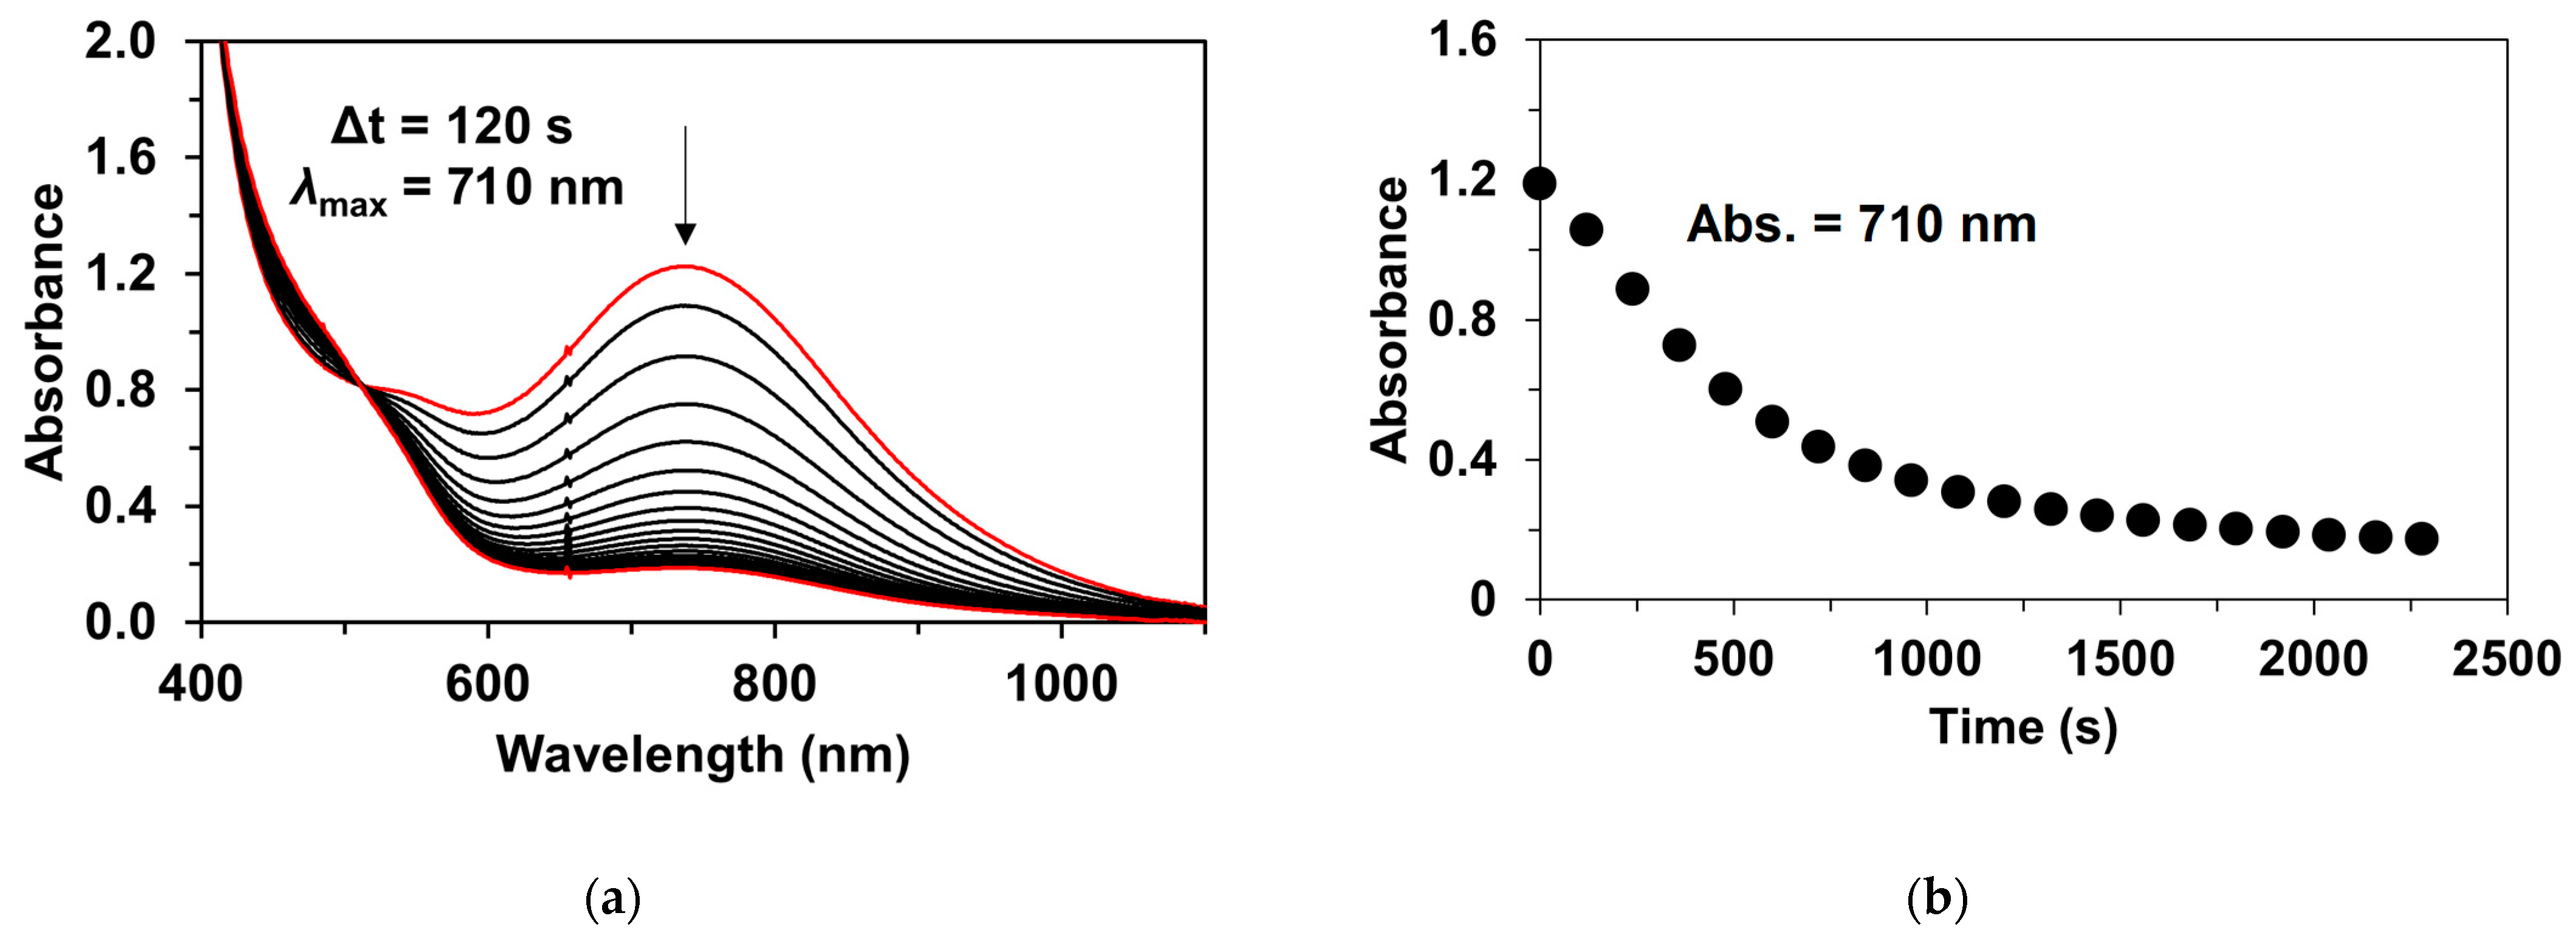
To date, around 40 peroxo-diiron(III) complexes are known as possible biomimics of diiron enzymes. Similarly to our previously reported [FeIII2(μ-O2)(L1−3)4(CH3CN)]4+ (1P-3P) species, complex 4P and 5P can be generated in acetonitrile with H2O2. These species, similarly to 1P3P (λmax = 720 (ε = 1360 M−1 cm−1); λmax = 685 (ε = 1400 M−1 cm−1); and λmax = 705 (ε = 1200 M−1 cm−1), respectively) [39,46], show characteristic absorption bands at λmax = 710 (ε = 1360 M−1 cm−1) and 695 nm (ε = 1200 M−1 cm−1), which can be assigned to the charge transfer between FeIII and the O22− ligand (Figure 2B) [42]. The half-lives (t1/2) for 1P and 4P generated by four equivalents of H2O2 at 298 K are 390 s and 500 s, respectively, demonstrating that 4P is more stable than 1P. A similar trend can be observed based on their self-decay data (ksd = 1.955 × 10⁻³ s−1 for 1P and 1.177 × 10⁻³ s−1 for 4P) under identical conditions at 298 K (Figure 3a,b) [40]. The most reactive species is 5P; however, we could not determine its t1/2 and ksd data because its steady-state concentration in the presence of four equivalents of H2O2 is below 10% at 298 K.
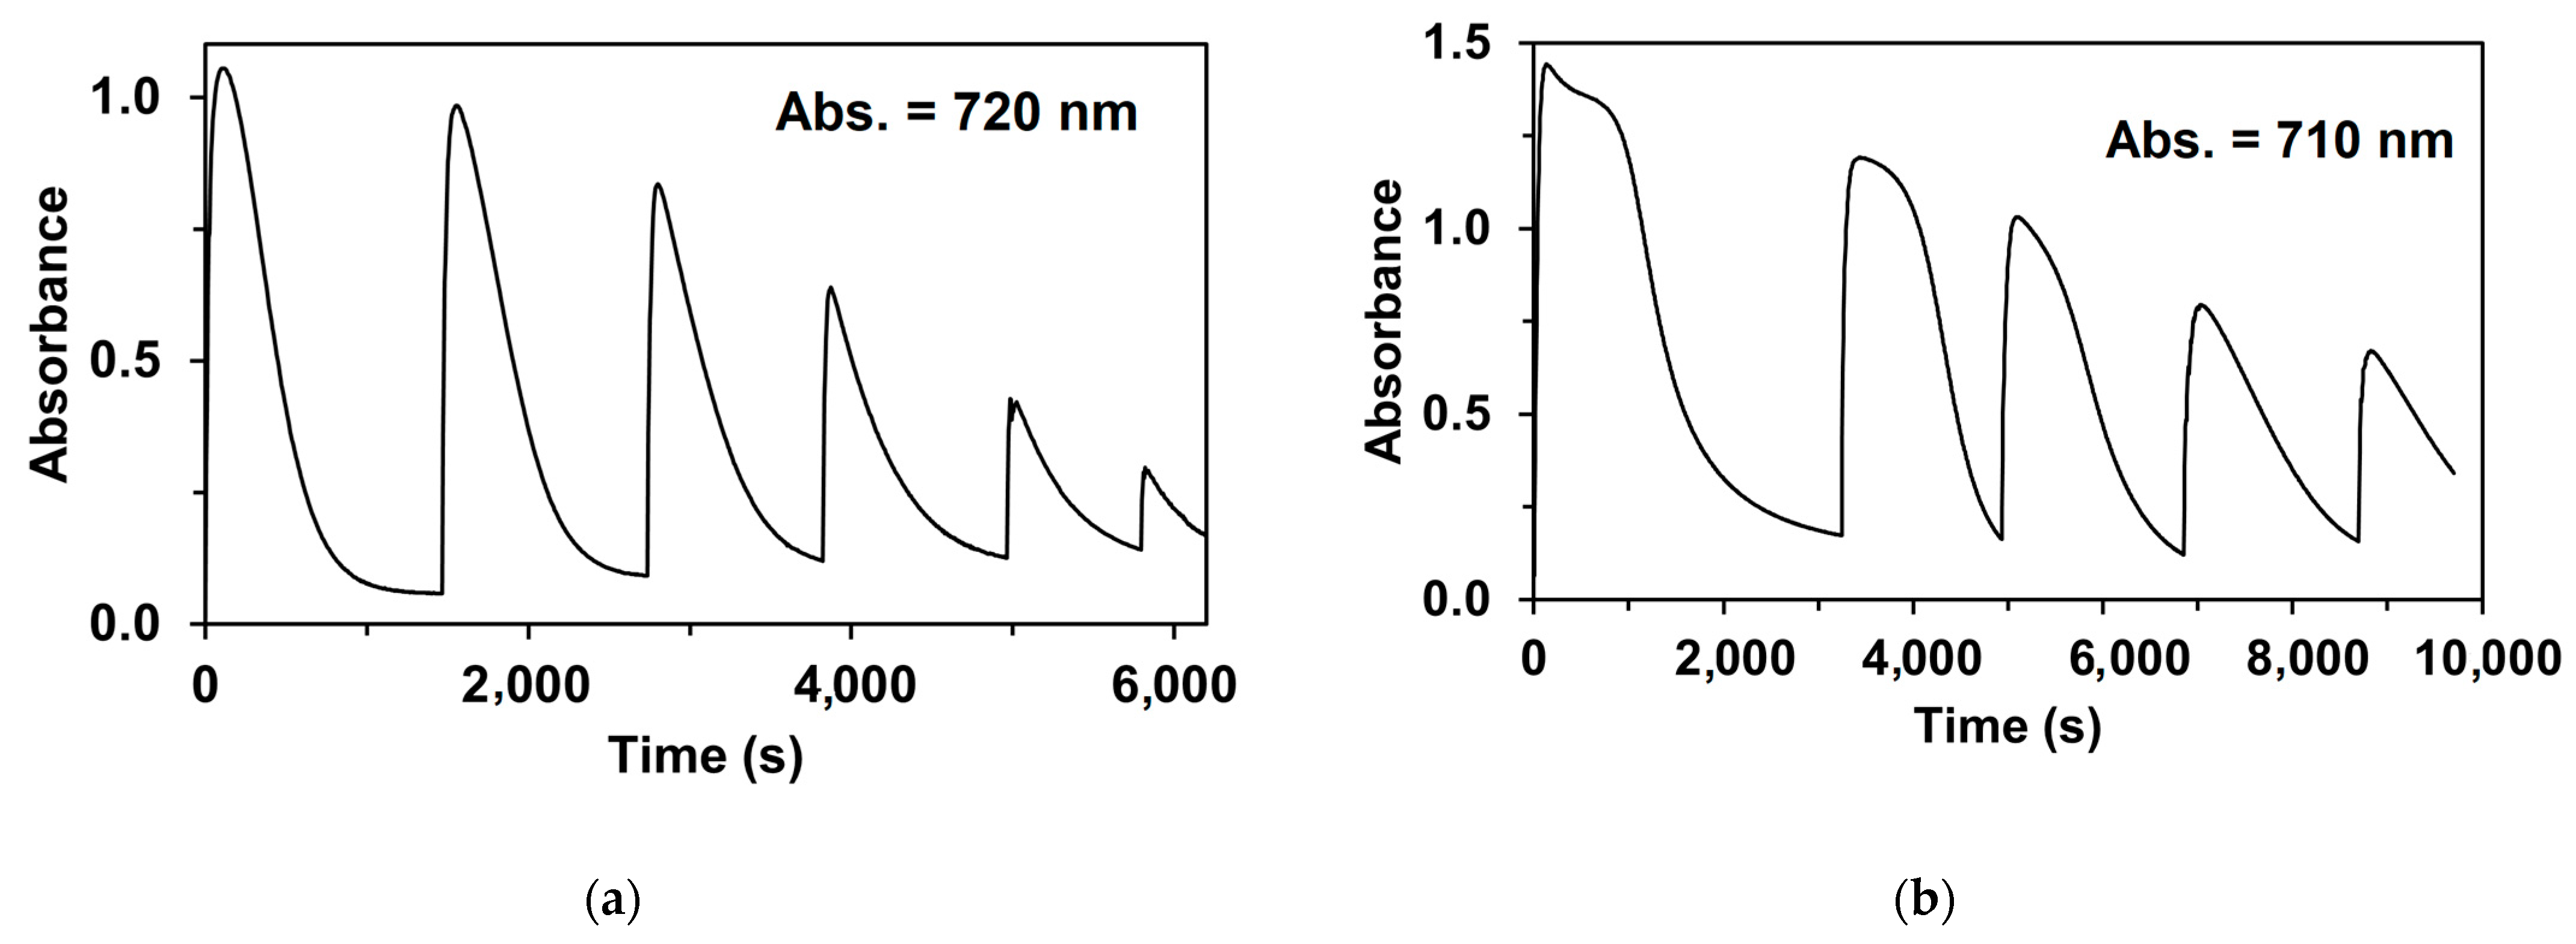
It was also established that by adding additional H2O2 (four equivalents), 1P and 4P can be regenerated 2–3 times after decomposition (Figure 4a,b) with a relatively high yield (>50%). A similar result was observed in the case of 5P but with much higher H2O2 (Figure 5a) and a much lower steady-state concentration of 5P. Many fewer cycles and yields can be achieved with 3P (Figure 5b).
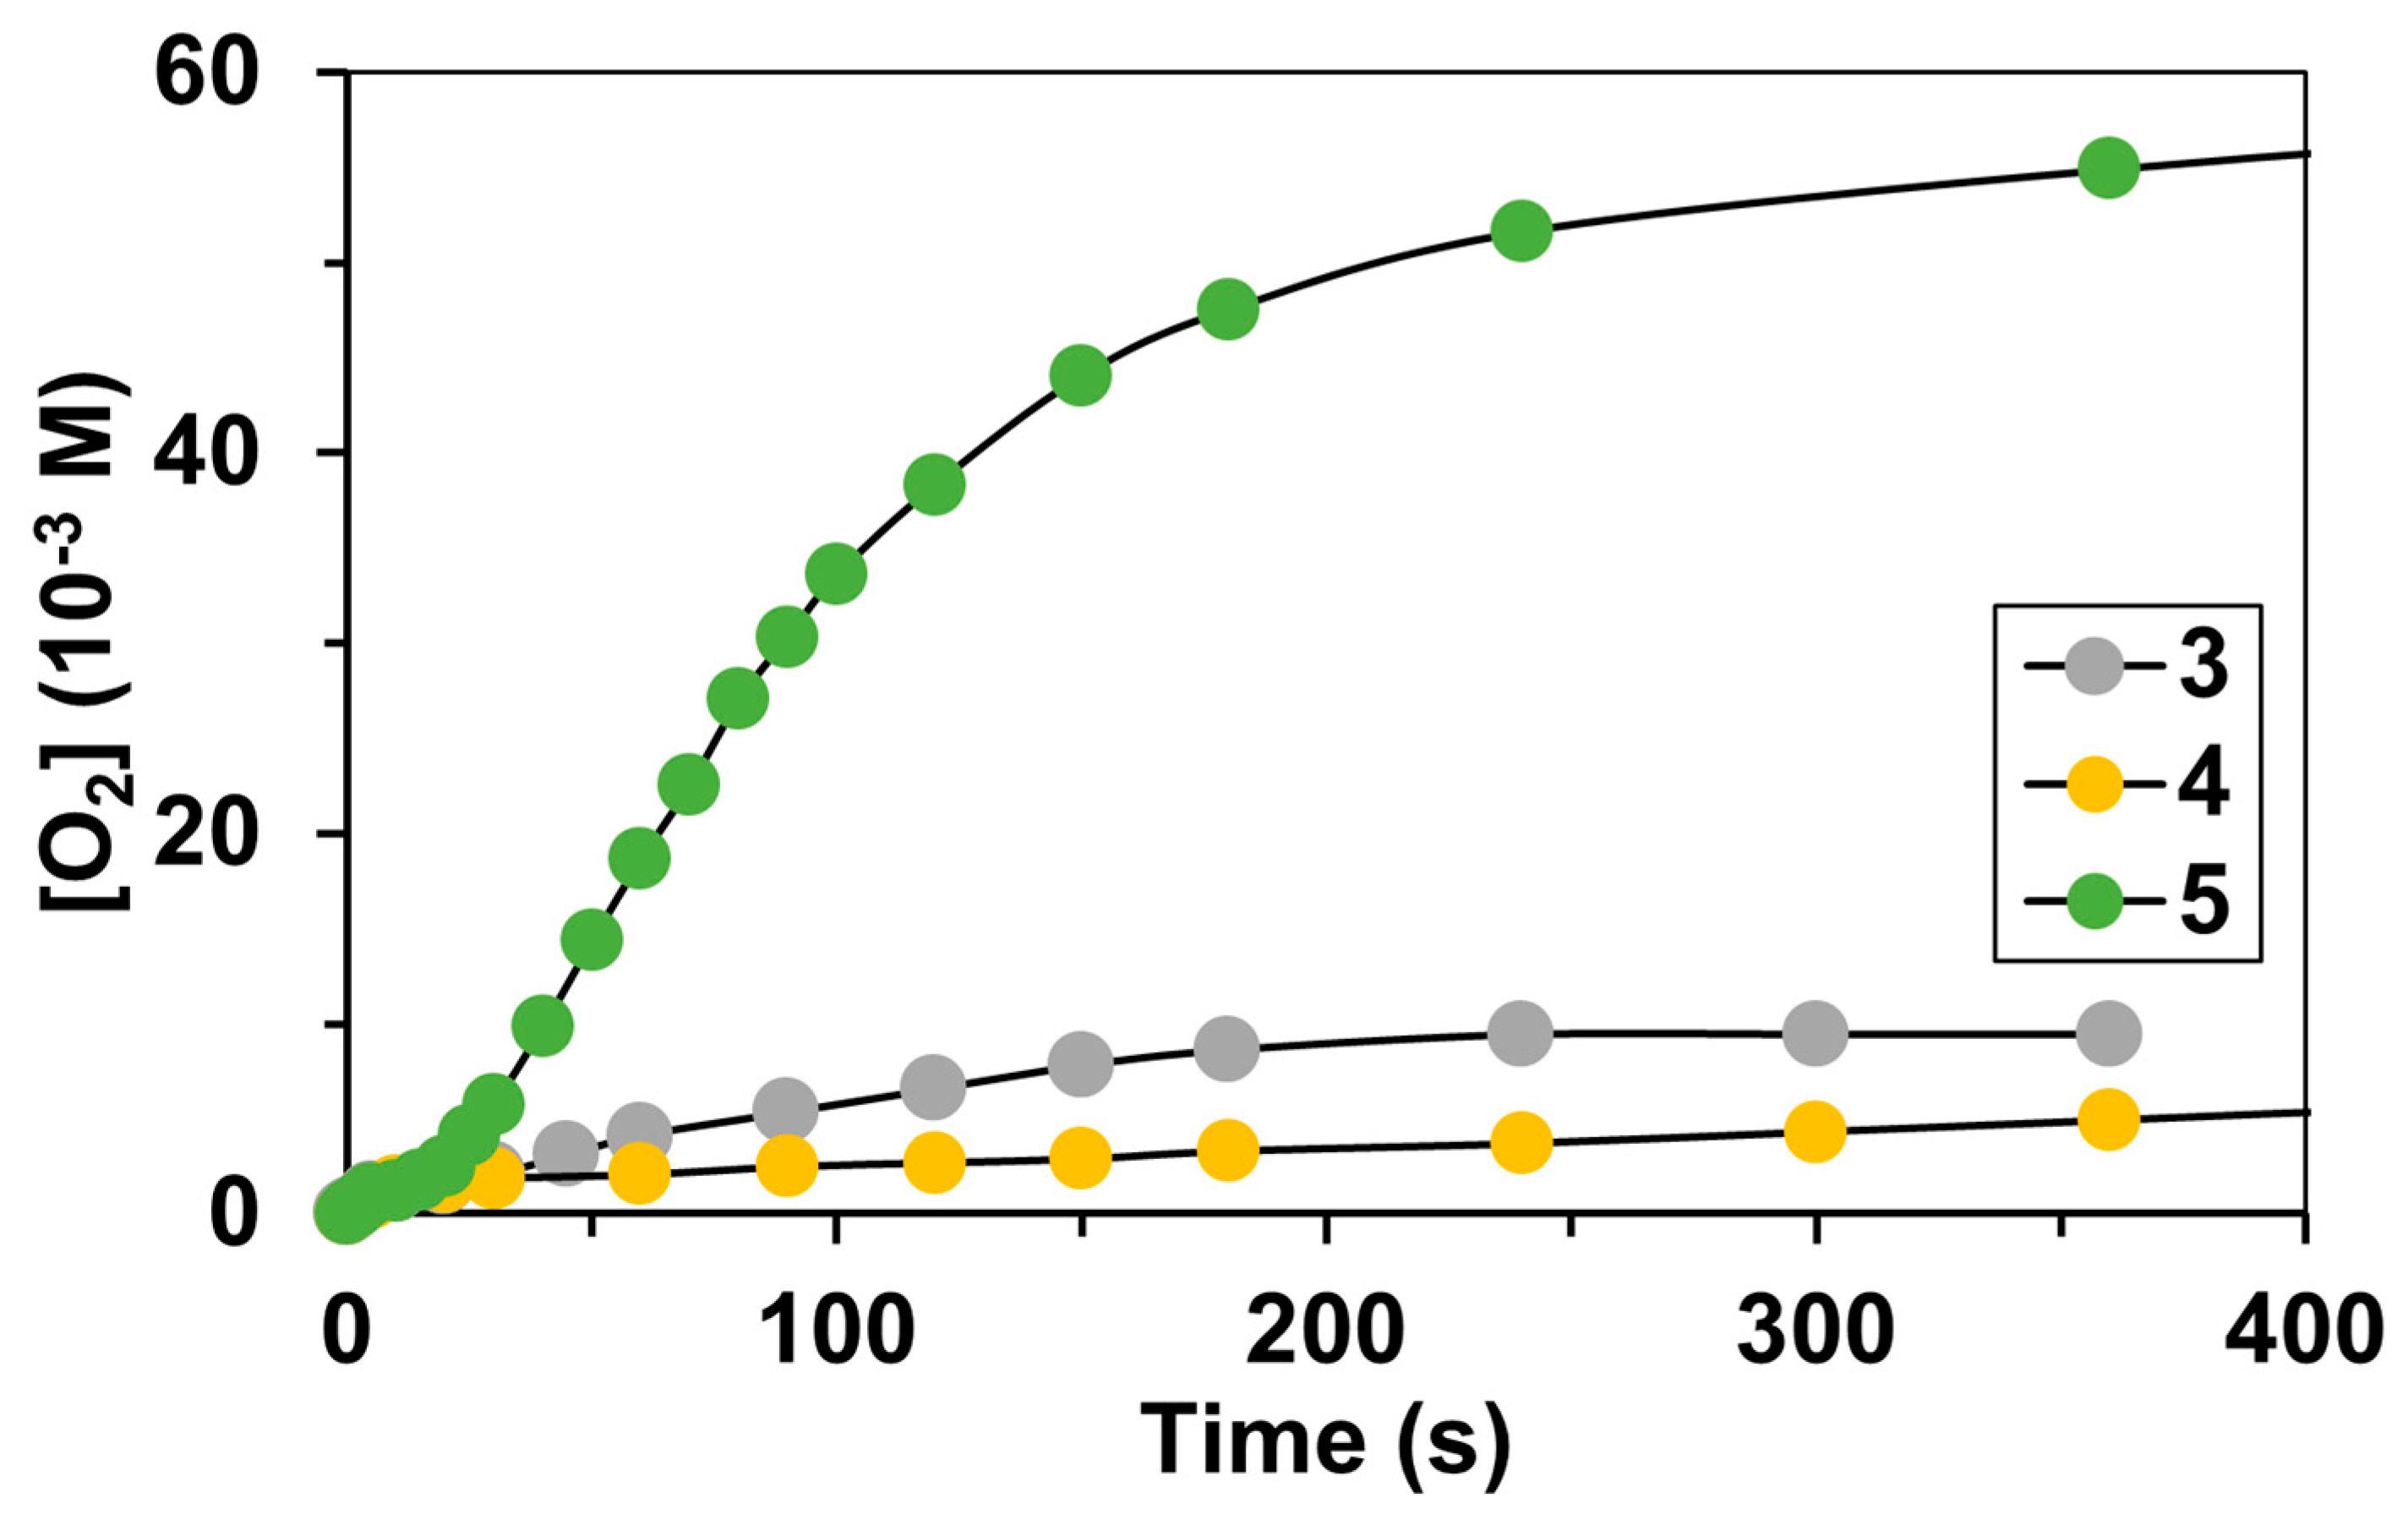
To compare the reactivity of catalysts 15 with H2O2, the reactions were carried out under the same conditions ([15]: [H2O2] = 1: 300 at 298 K), and the amount of dioxygen evolved during the disproportionation of H2O2 into H2O and O2 was monitored using a gas volumetric method (Figure 6). Under this condition, the highest catalytic activity can be observed by the use of complex 5, based on the calculated yield (of dioxygen), TON (TON = turnover number = mol H2O2/mol catalyst) and TOF (turnover frequency = mol H2O2/mol catalyst/h calculated as 3600 × (Vin/2/[15]0) values (Table 2 and Figure 7). These data for 5 are Yield = 48%, TON = 145 and TOF = 1065 h−1. The TOF values for 5 are significantly higher than those observed for previously reported FeII(IndH) systems, including [FeIII2(μ-O)(μ-1,2-O2)(IndH)2(Solv)2]2+ intermediate formation (~300 h−1) [45]. In contrast, the lowest activity was observed in the case of complex 4 with Yield = 6.8%, TON = 20.4 and TOF = 27 h−1 under identical conditions. Much more favorable values were observed in all cases at lower substrate (H2O2) concentrations, which can be explained by the water content (Figure 7a,b). As we noticed before (Figure 4 and Figure 5), the amount of the peroxo complexes decreases significantly with the increase in water, which suggests that the 1P5P intermediates play a key role in the catalytic cycles.
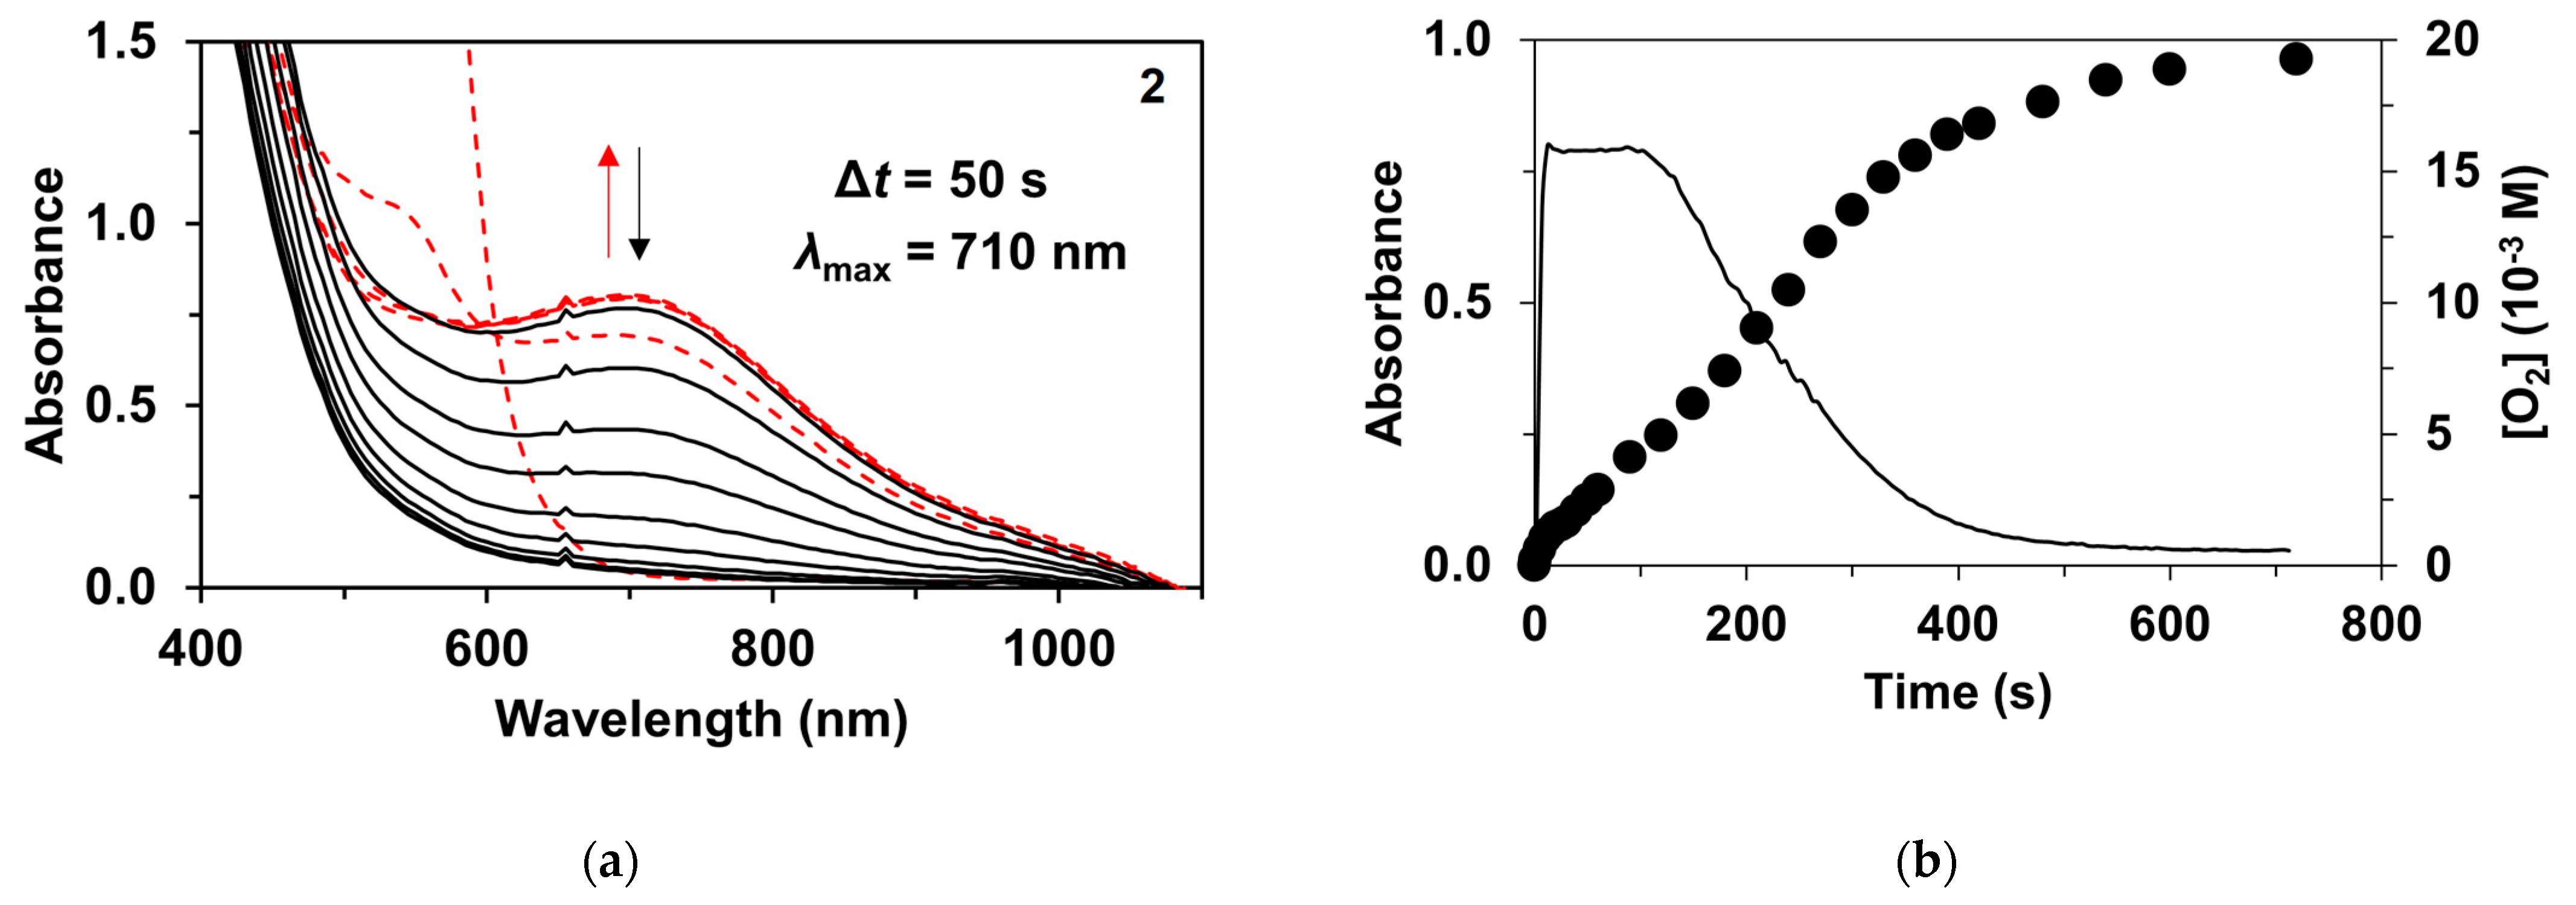
To prove this assumption, we followed the formation and decomposition of peroxo intermediates (rise and fall of their visible chromophores at λmax = 720 (Figure 8a), 710 (Figure 9a), 700 (Figure 10a), 710 (Figure 11a) and 695 nm (Figure 12a)), as well as the appearance of evolving dioxygen during the disproportionation reaction of H2O2, using parallel UV–Vis and gas volume measurement methods (Figure 8b, Figure 9b, Figure 10b, Figure 11b and Figure 12b). Based on the above measurements, the profile of the catalytic reactions can be divided into two main steps, namely a short lag phase with the formation and accumulation of peroxo intermediates, followed by their decomposition with linear dioxygen formation.
Detailed kinetic studies of the in situ formed μ-1,2-peroxo-diiron(III)-mediated disproportionation reaction of H2O2 were carried in MeCN at 298 K under pseudo-first-order conditions with an excess of H2O2 ([35]0: [H2O2]0 = 0.5–2.5 mM: 150–300 mM) using an initial rate method monitoring the increase in the evolved dioxygen by gas volumetric measurement. The estimated initial rates (under same conditions) according to the reaction rate order are Vi = 1.51 × 10⁻⁵ M s−1, Vi = 1.86 × 10⁻⁵ M s−1, Vi = 3.40 × 10⁻⁵ M s−1, Vi = 5.65 × 10⁻⁵ M s−1 and Vi = 59.2 × 10⁻⁵ M s−1, respectively to compounds 4, 1, 2, 3 and 5, respectively, at 298 K. Based on the observed initial rates, compound 5 has significantly higher reactivity than 4.
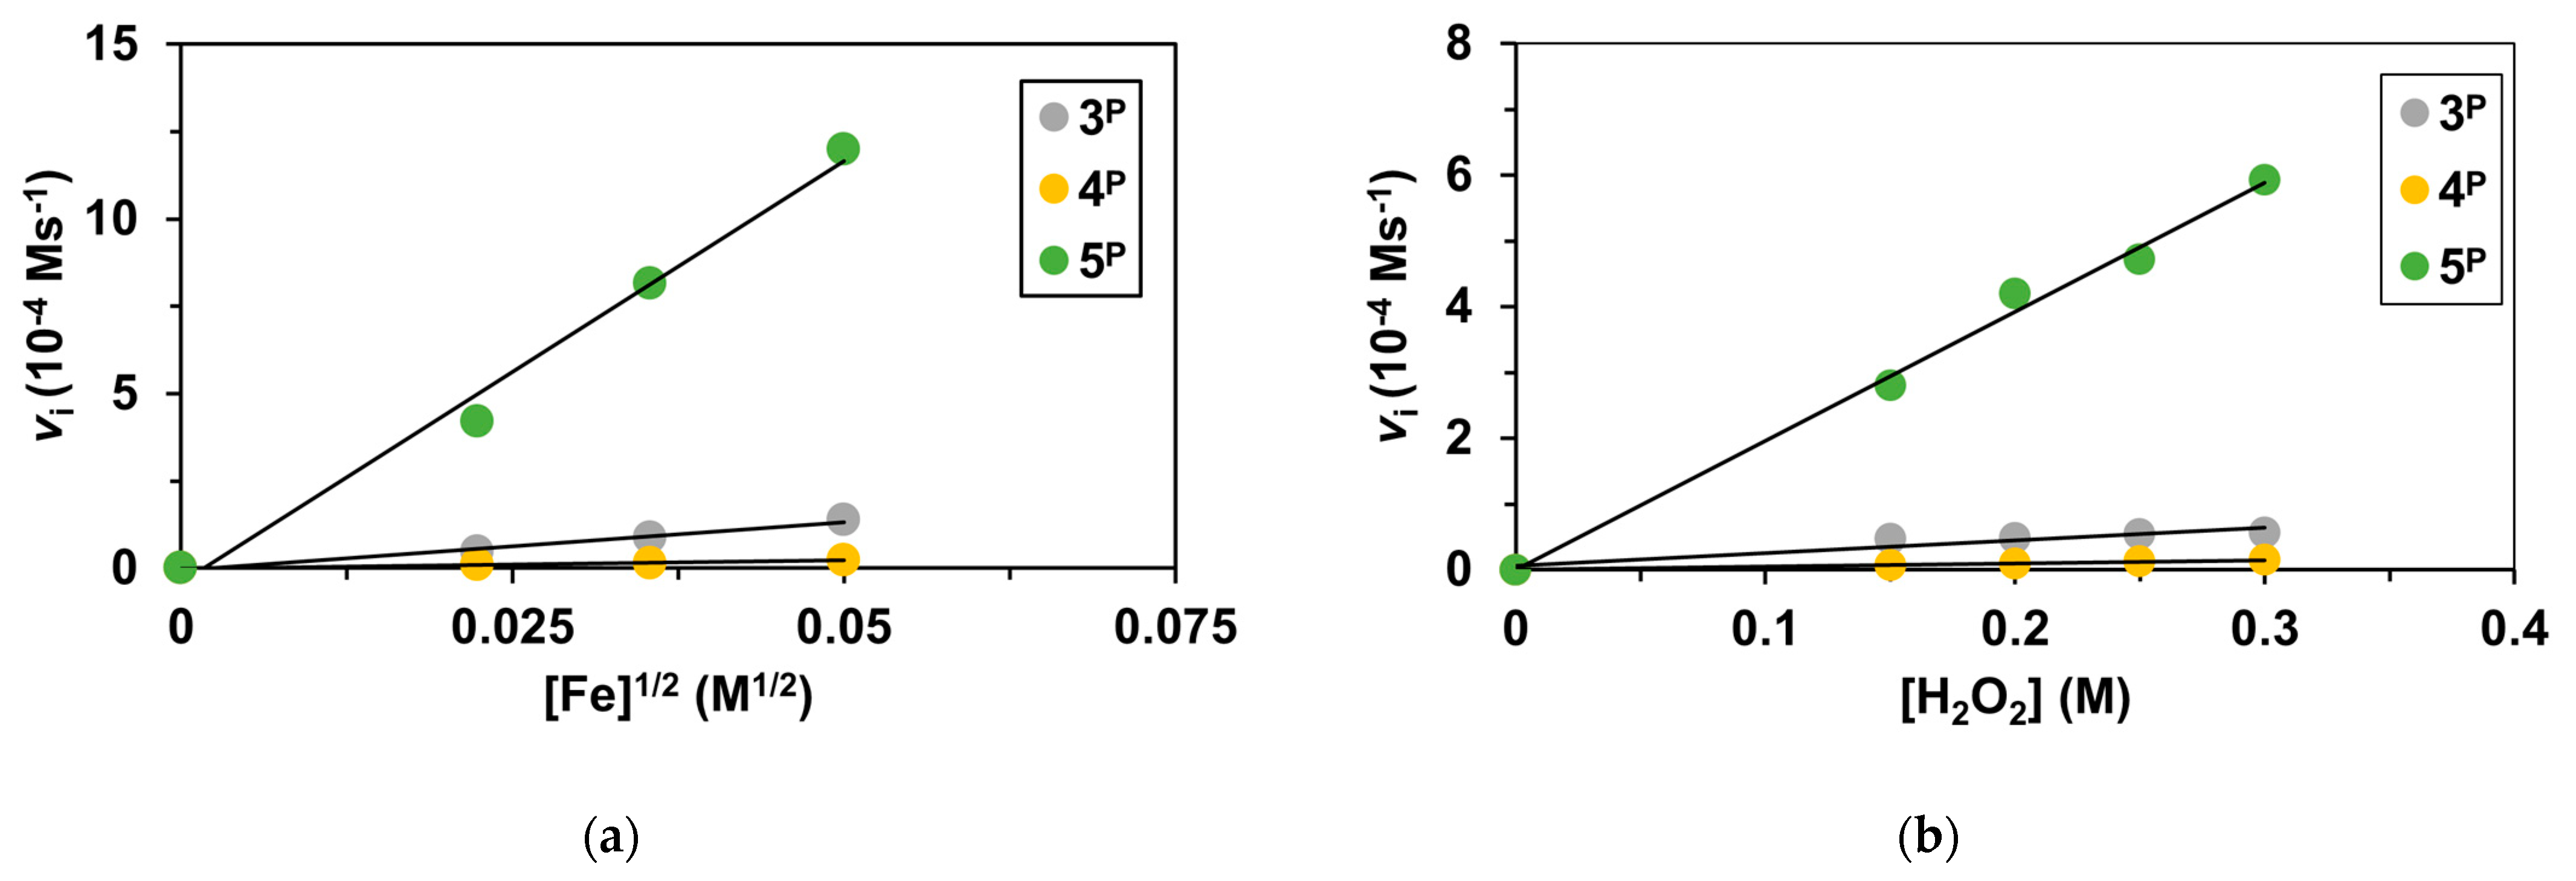
In order to determine the rate dependence on the various reactants, disproportionation runs were performed at different substrate and catalyst concentrations (Table 3). At constant [H2O2]0, the initial rate of H2O2 disproportionation varies linearly with the in situ-formed [catalyst 3P, 4P or 5P]0.5, meaning that all reactions are half-order in catalyst and suggesting a dissociation process via homolytic cleavage of the O─O bond (Figure 13a), similarly to the previously published 1 and 2 H2O2 systems [40]. However, at low H2O2 concentrations, the reactions are first-order in peroxide concentration as shown in Figure 13b, to establish a rate law of +d[O2]/dt = kcat[H2O2][1P-5P]0.5 with kcat = 2.81 × 10⁻³ M−1/2 s−1 for 1P [40], 5.06 × 10⁻³ M−1/2 s−1 for 2P [40], kcat = 11.3 × 10⁻³ M−1/2 s−1 for 3P, kcat = 2.16 × 10⁻³ M−1/2 s−1 for 4P and kcat = 96.1 × 10⁻³ M−1/2 s−1 for 5P at 25 °C.
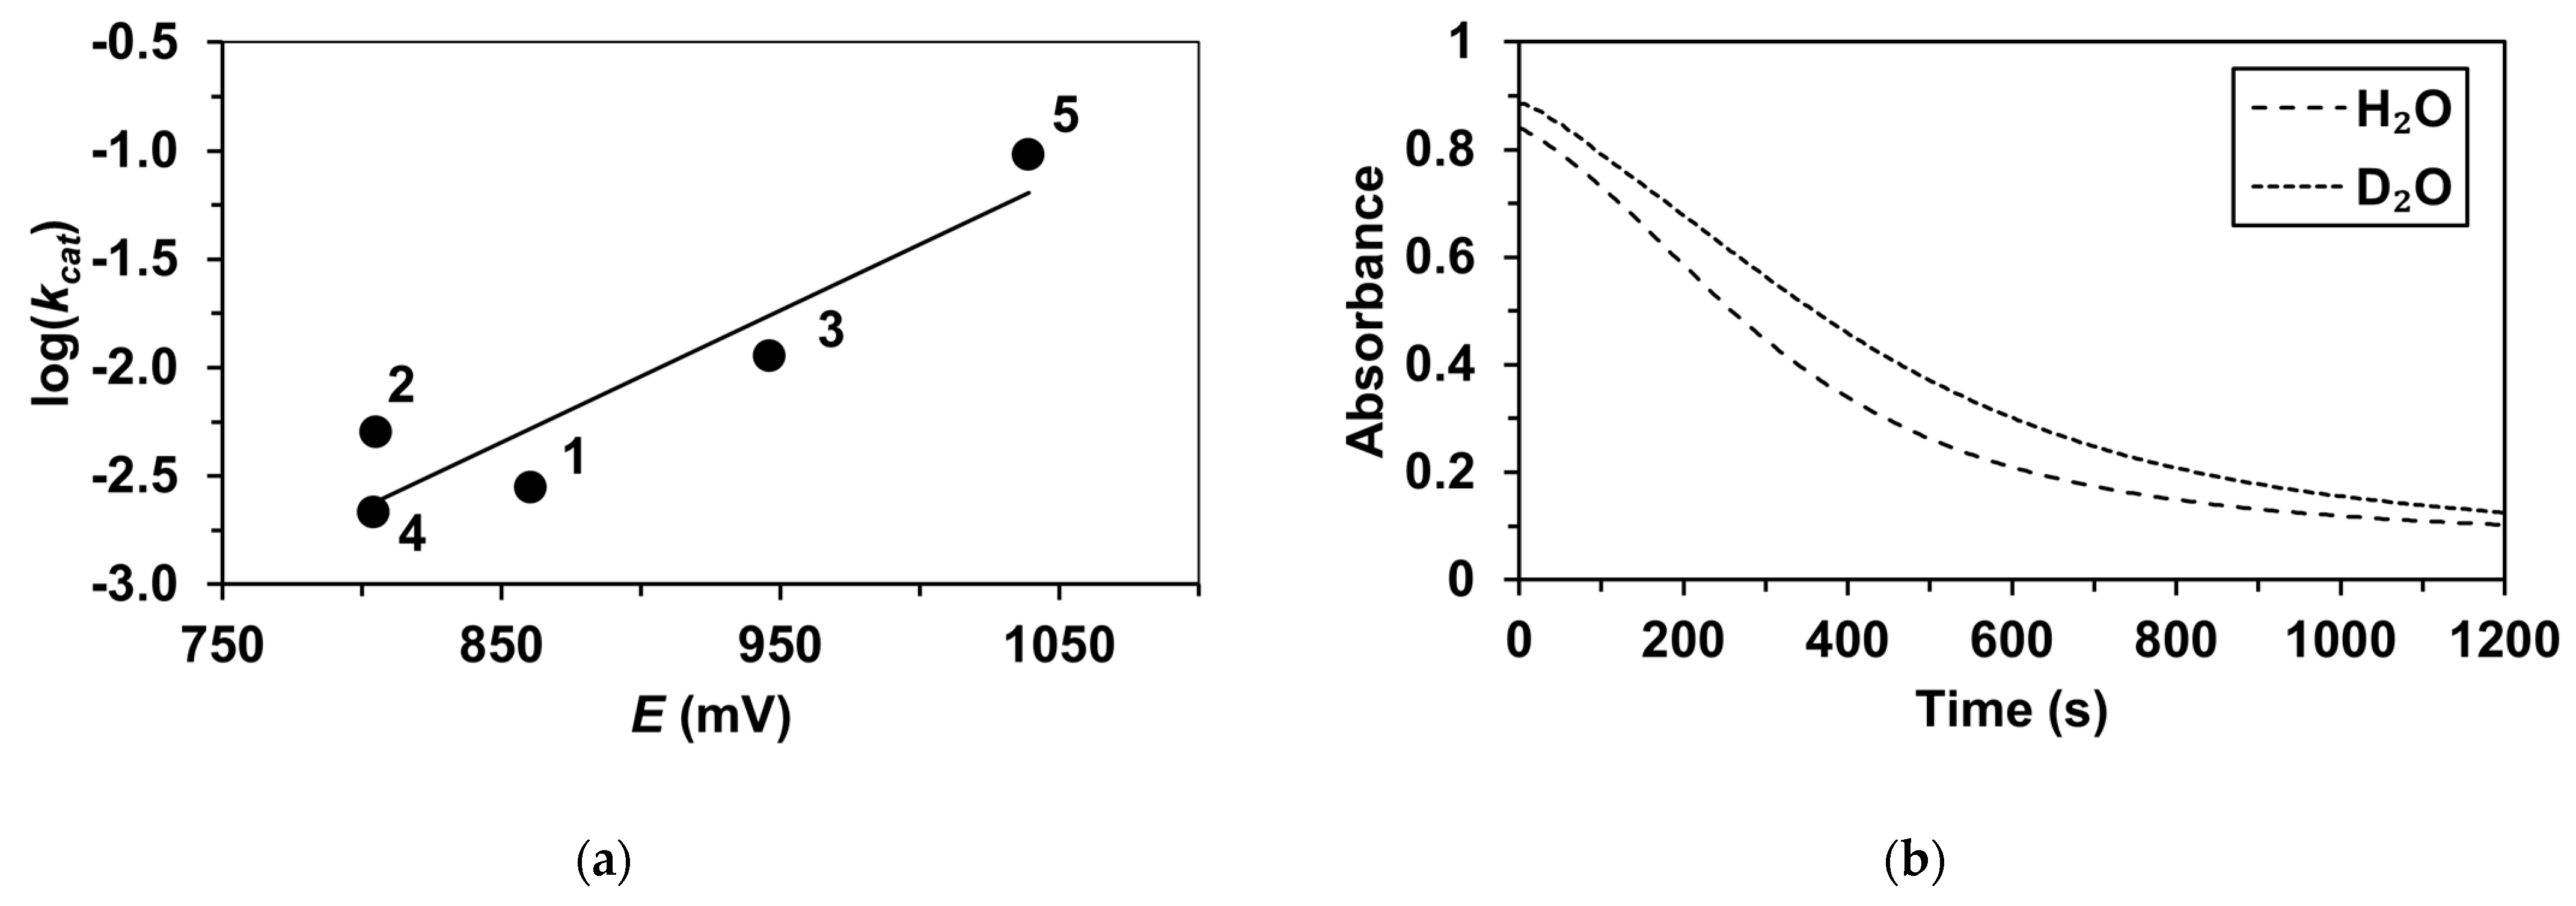
In the next step, the effect of ligand modification on the reaction rate was investigated by introducing an electron-donating (-CH3) substituent into the benzimidazole (L2, 2) and phenyl ring (L4, 4), replacing a pyridyl arm with a thiazolyl ((L3, 3) and a benzimidazole arm with triazole (L5, 5). We found that complexes 3 and 5 containing the thiazolyl and triazole side chains are the most effective oxidants with the fastest rates: kcat = 11.3 × 10³ M1/2 s1 and 96.1 × 10³ M1/2 s1, respectively. On the other hand, complexes 1 and 4, with unsubstituted and 4-methylpyridine arms, are the less efficient oxidants with kcat = 2.81 × 10³ M1/2 s1 and 2.16 × 10³ M1/2 s1, respectively. These results provide clear evidence that the ligand environment of the metal center influences the redox potential and the catalase activity of the complexes. Table 1 and Figure 14a show that the redox potential (E1/2) of the complexes and their activity increase with the increase in the electron-withdrawing capacity of the substituent/side-chain. A kinetic isotope effect (KIE) of 1.36 was observed for the decay of 4P when the experiments were carried out in the presence of added H2O (k = 3.68 × 10³ s1) or D2O (k = 2.70 × 10³ s1) (Figure 14b). These results indicate the role of the water during the diiron-peroxo-mediated disproportionation reaction.

3. Experimental

3.1. Materials and Methods

All chemicals including L1 = 2-(2-pyridyl)-1H-benzimidazole, L2 = 2-(2′-pyridyl)-N-methyl-benzimidazole, L3 = 2-(4-thiazolyl)-1H-benzimidazole, L4 = 2-(4-Methyl-2-pyridyl)-1H-benzimidazole and L5 = 2-(1H-1,2,4-triazol-3-yl)pyridine ligands were obtained from Aldrich Chemical Co. and used without further purification unless otherwise indicated. Solvents were dried according to the published procedures, distilled and stored under argon. [FeII(L2)3](CF3SO3)2 (4) and [FeII(L1−3)3](CF3SO3)2 (1) were synthesized according to the literature methods [39,46]. UV–visible spectra were recorded on an Agilent 8453 diode-array spectrophotometer using quartz cells. The infrared spectroscopy measurements were carried out using an IRAffinity-1s spectrophotometer with a MIRacle10 (Diamond/ZnSe) one reflection ATR plate and LabSolutions IR Series Software. Cyclic voltammetric experiments were carried out using an SP-150 potentiostat and EC-Lab V11.41 software. During the measurements, we used a three-electrode setup where a 3.0 mm diameter glassy-carbon electrode was the working electrode, a Pt wire was the counter electrode and an Ag/Ag+ (1M TBAClO4 in acetonitrile) was the reference electrode. The supporting electrolyte was a 0.1 M solution of tetrabutylammonium perchlorate.

3.2. Synthesis of [FeII(L3)3](CF3SO3)2 (5)

The FeII(CF3SO3)2 (0.67 g, 1.9 mmol) was dissolved in dry acetonitrile (15 mL) under an Ar atmosphere. Then, the 2-(1H-1,2,4-triazol-3-yl)-pyridine, L5 (0.823 g, 5.7 mmol) was added to the stirred solution. The color of the solution turned brown. The solution was stirred for 4 h under an Ar atmosphere. The solution was layered with diethyl ether (15 mL) after the complete diffusion the solvent was removed and the precipitated yellow solid was washed again with diethyl ether and dried in vacuum. Yield: 1.41 g (94%). Anal. Calcd. for C21H18F6FeN12O6S2: C, 51.03; H, 3.67; N, 34.00. Found: C, 51.23; H, 3.54; N, 34.13. FT-IR bands (ATR, cm−1): 3145 w, 2926 w, 1610 w, 1504 w, 1481 w, 1456 w, 1431 w, 1394 w, 1350 w, 1309 m, 1288 s, 1232 s, 1209 s, 1159 s, 1087 w, 1053 w, 1028 s, 999 m, 975 m, 854 w, 798 m, 746 m, 725 s, 632 s. UV–Vis absorption (CH3CN) [λmax nm, (logε)] 196 (4.65), 236 (4.51), 277 (4.4), 372 (3.27).

3.3. Gas Volumetric Measurements

The catalase-like activity was investigated through the evolution of dioxygen. The reactions were carried out in a 30 cm3 reactor under air at 25 °C. In a typical experiment, 4 × 10⁻⁵ mol of [FeII(L3)3](CF3SO3)2, [FeII(L4)3](CF3SO3)2 and [FeII(L5)3](CF3SO3)2 (3/4/5) was dissolved in 20 cm3 CH3CN and the reactor was closed with a rubber septum. The flask was connected to a graduated burette filled with oil. The right amount of H2O2 was added to the reactor through the septum and the reaction was followed by the amount of the dioxygen evolved. At constant [H2O2]0, the reactions exhibit ½-order kinetics on catalysts (in situ formed 1P5P) and the ½-order rate constants (k1′) were obtained from the slope of the plot of Vi (after the leg phase) vs. [1P5P]. At fixed [1P5P], reaction rates showed a good linear dependence with [H2O2]0, affording first-order rate constants (k1′’). The catalytic constants were obtained from either k1′/[H2O2]0 or k1′’/[1P5P]1/2.

3.4. UV–Vis Spectroscopic Measurements

The reactive species [FeIII2(μ-1,2-O2)(L1−5)4] (1P5P) were generated by adding 150–300 equivalent H2O2 to the solutions of (15) in a 1 cm quartz UV cuvette at 25 °C. The total volume was 2 cm3 (in CH3CN). The formation and the decay of (1P5P) was monitored with a UV–Vis spectrophotometer at 720, 710, 700, 710 and 695 nm, respectively. In a typical experiment, 4 × 10⁻⁵ mol of (15) was dissolved in 2 cm3 CH3CN and the right amount of H2O2 was added to the cuvette. Reactions were run at least in triplicate, and the data reported are the average of the reactions.

4. Conclusions

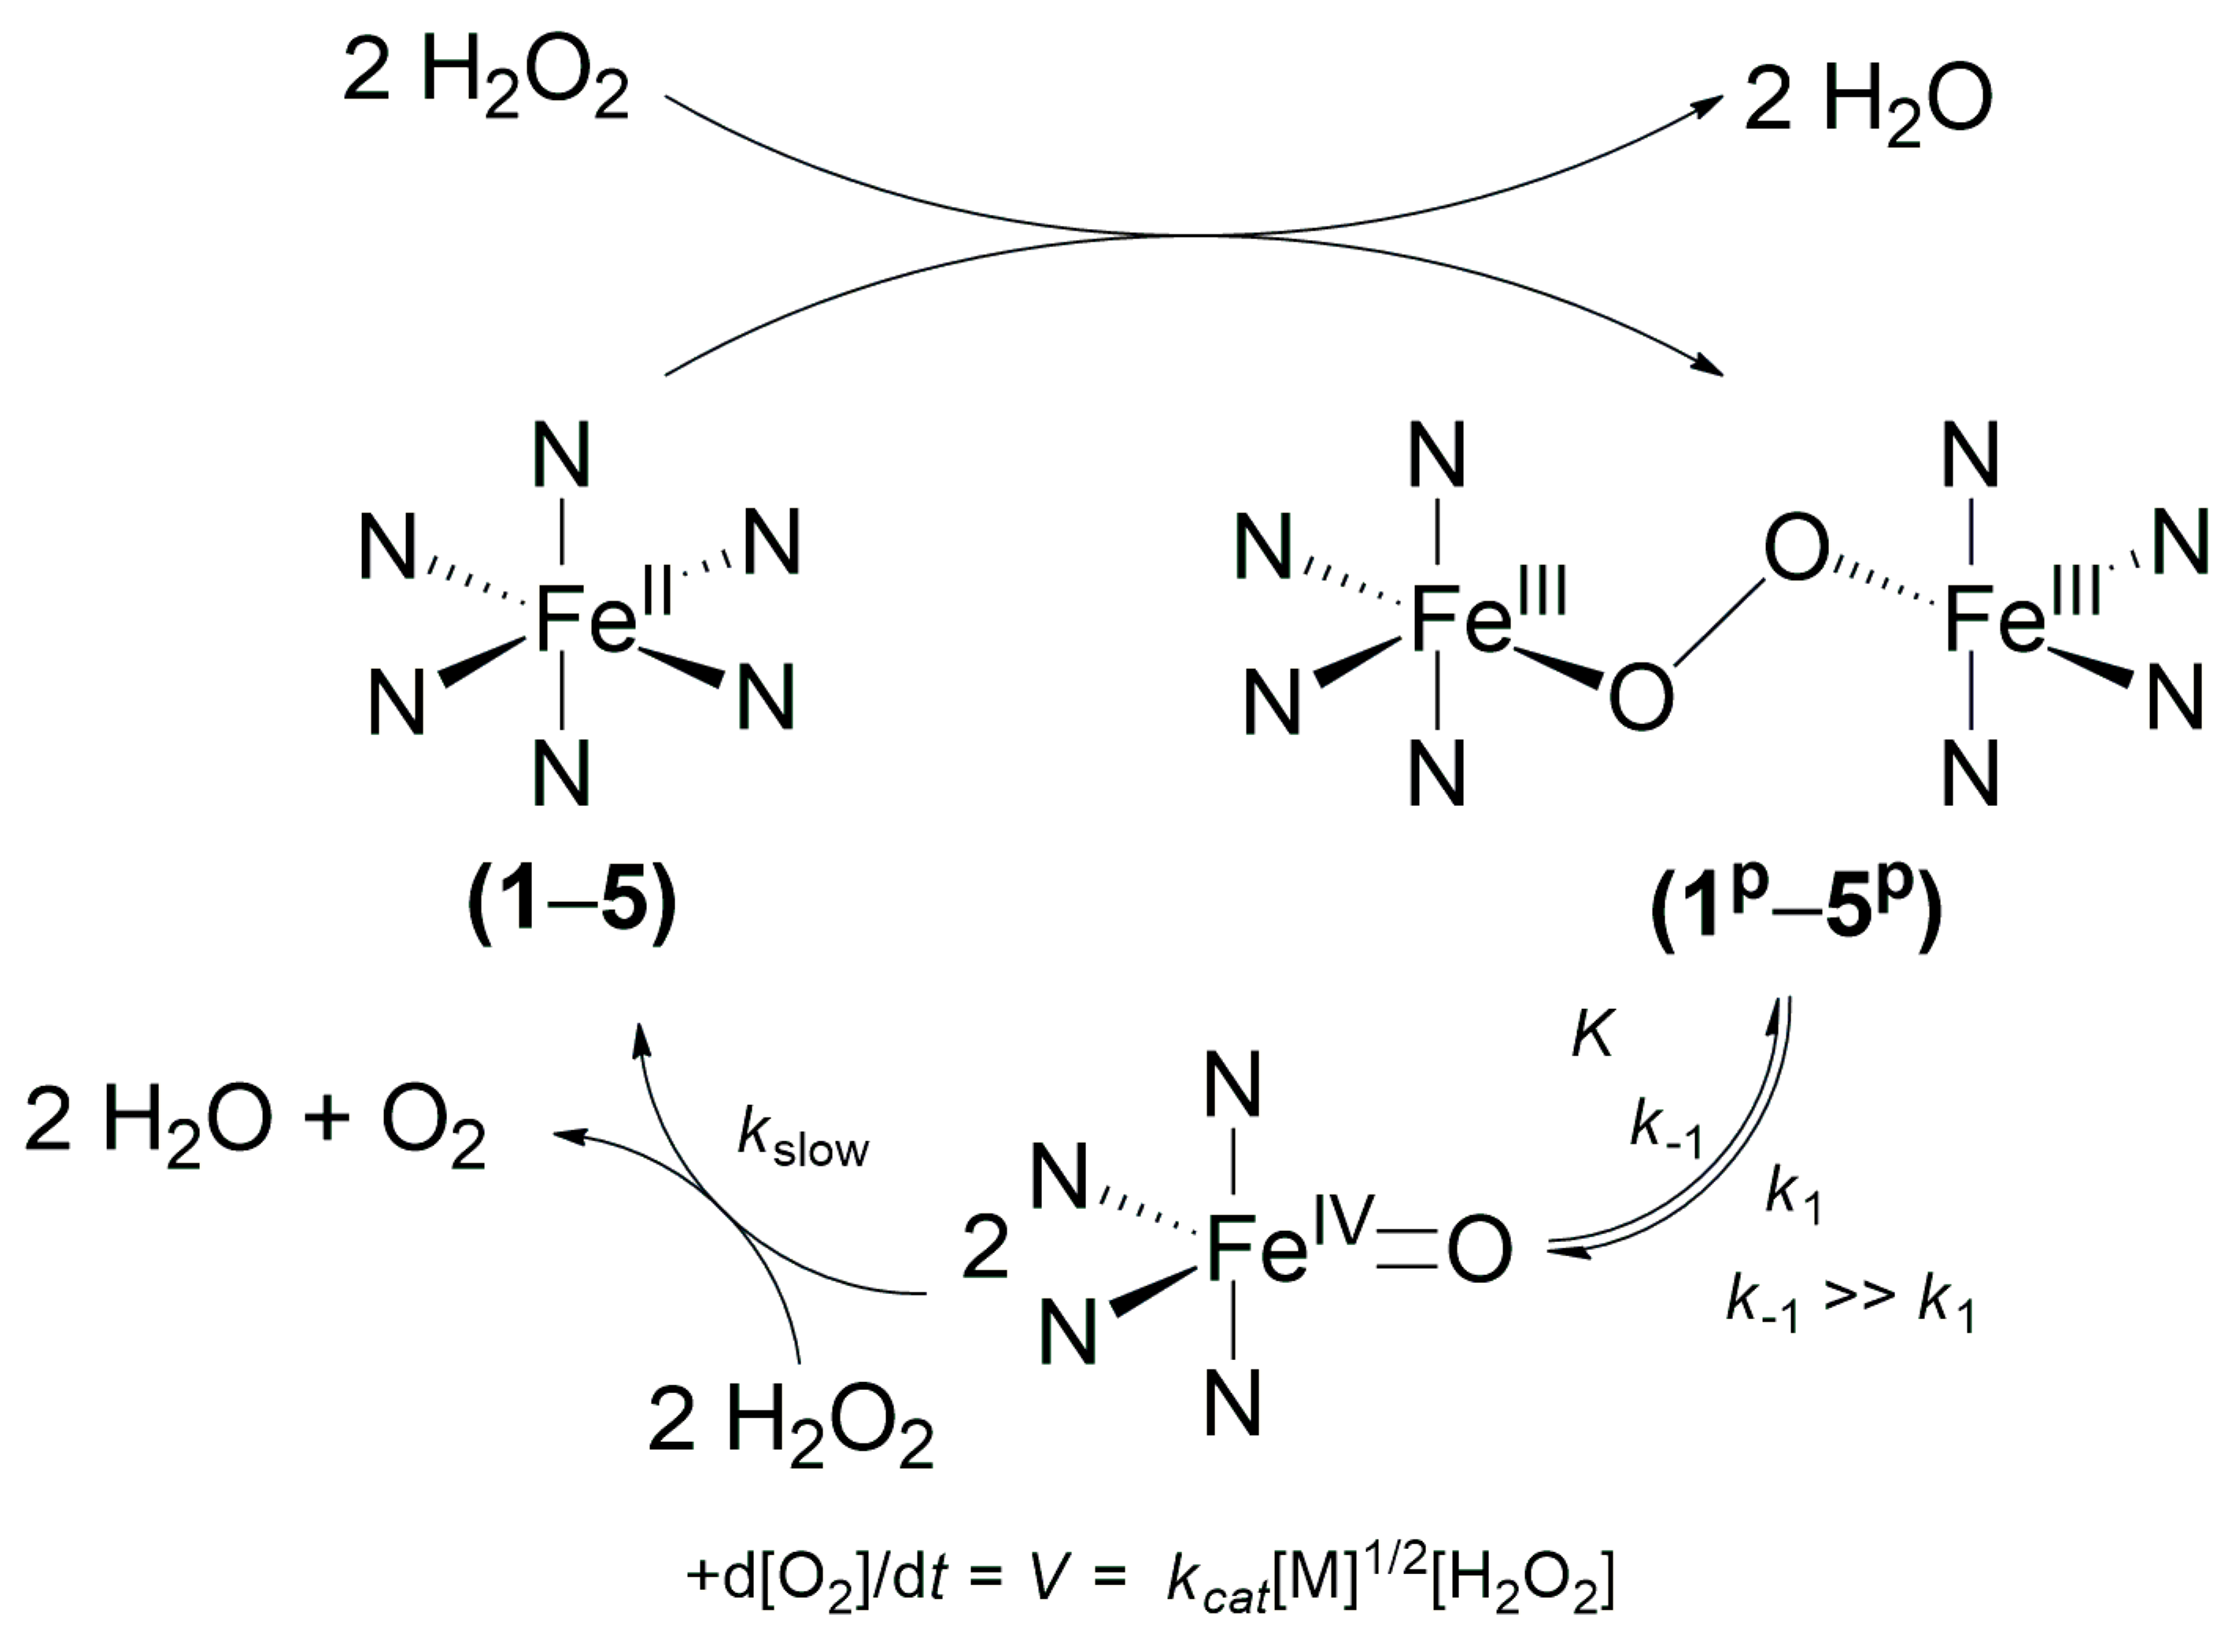
The reactivity of three iron(II) complexes (3, 4 and 5) with heterobidentate ligands compared with the previously reported 1 and 2 have been investigated in the disproportionation reaction of H2O2 as possible biomimics of catalase enzymes. It can be concluded that the formation of the corresponding μ-1,2-peroxo-diiron(III) complexes (1P5P) and their catalase-like activity can be clearly verified in the case of all three precursor complexes (15). Similar to our previous kinetic results on the 1P(2P)-containing system, we have got a half-order for 3P, 4P and 5P, which further confirms the dissociative mechanism, including the homolytic O–O cleavage and the formation of mononuclear oxoiron(IV) species. The formation of oxoiron(IV) can be described by a pre-equilibrium process, which is shifted in the direction of the starting peroxo complex. Its presence in a steady-state concentration is also supported by previous theoretical calculations [40]. During fine-tuning of the catalyst, we found clear evidence that the electron-deficient sites (3 and 5) are significantly more reactive, the higher the redox potentials of the FeIII/FeII redox couple, the higher the catalase-like activity. Furthermore, it is important to note that the two most active catalysts with L3 and L5 ligands have a high-spin electronic configuration. This is in good agreement with the electrophilic nature of the proposed oxoiron(IV) species during the catalytic cycle. Based on the obtained results, the proposed route may represent a new alternative to the mechanism of dinuclear catalase systems (Scheme 3).

Author Contributions

Resources, D.L.-B. and P.T.; writing—original draft preparation and supervision, J.K. All authors have read and agreed to the published version of the manuscript.

Funding

This research received no external funding.

Data Availability Statement

Not available.

Acknowledgments

Financial support of the Hungarian National Research, Development and Innovation Fund, OTKA K142212 (J.K.) and ÚNKP-22-3 (P.T.) New National Excellence Program of the Ministry for Culture and Innovation are gratefully acknowledged.

Conflicts of Interest

The authors declare no conflict of interest.

Sample Availability

Samples of the compounds are not available.

References

  1. Beyer, W.F.; Fridovich, I. Catalases-with and without heme. Basic Life Sci. 1988, 49, 651–661. [Google Scholar] [PubMed]
  2. Zamocky, M.; Furtmuller, P.G.; Obinger, C. Evolution of catalases from bacteria to humans. Antioxid. Redox Signal. 2008, 10, 1527–1548. [Google Scholar] [CrossRef] [PubMed] [Green Version]
  3. Zamocky, M.; Gasselhuber, B.; Furtmüller, P.G.; Obinger, C. Molecular evolution of hydrogen peroxide degrading enzymes. Arch. Biochem. Biophys. 2012, 525, 131–144. [Google Scholar] [CrossRef] [PubMed] [Green Version]
  4. Ko, T.P.; Day, J.; Malkin, A.J.; McPherson, A. Structure of orthorhombic crystals of beef liver catalase. Acta Crystallogr. 1999, D55, 1383–1394. [Google Scholar] [CrossRef] [Green Version]
  5. Ivancich, A.; Jouve, H.M.; Sartor, B.; Gaillard, J. EPR investigation of compound I in Proteus mirabilis and bovin liver catalases: Formation of porphyrin and tyrosyl radical intermediates. Biochemistry 1997, 36, 9356–9364. [Google Scholar] [CrossRef] [PubMed]
  6. Góth, L. Two cases of acatalasemia in Hungary. Clin. Chim. Acta 1992, 207, 155–158. [Google Scholar] [CrossRef]
  7. Al-Abrash, A.S.; Al-Quobaili, F.A.; Al-Akhras, G.N. Catalase evaluation in different human diseases associated with oxidative stress. Saudi Med. J. 2000, 21, 826–830. [Google Scholar]
  8. Habib, L.K.; Lee, M.T.C.; Yang, J. Inhibitors of catalaseamyloid interactions protect cells from β-amyloid induced oxidative stress and toxicity. J. Biol. Chem. 2010, 285, 38933–38943. [Google Scholar] [CrossRef] [Green Version]
  9. Ogata, M. Acatalasemia. Hum. Gen. 1991, 86, 331–340. [Google Scholar] [CrossRef]
  10. Tiedge, M.; Lortz, S.; Drinkgern, J.; Lenzen, S. Relation between antioxidant enzyme gene expression and antioxidative defense status of insulin-producing cells. Diabetes 1997, 46, 1733–1742. [Google Scholar] [CrossRef]
  11. Rolo, A.P.; Pameira, C.M. Diabetes and mitochondrial function: Role of hyperglycemia and oxidative stress. Tox. Appl. Pharm. 2006, 212, 167–178. [Google Scholar] [CrossRef] [Green Version]
  12. Markesbery, W.R. Oxidative stress hypothesis in Alzheimer’s disease. Free Radic. Biol. Med. 1997, 23, 134–147. [Google Scholar] [CrossRef] [PubMed]
  13. Przedborski, S.; Ischiropoulos, H. Reactive oxygen and nitrogen species: Weapons of neuronal destruction in models of Parkinson’s disease. Antioxid. Redox Signal. 2005, 7, 685–693. [Google Scholar] [CrossRef]
  14. Halliwell, B.; Gutteridge, J.M.C. Oxygen free radicals and iron in relation to biology and medicine: Some problems and concepts. Arch. Biochem. Biophys. 1986, 246, 501–514. [Google Scholar] [CrossRef] [PubMed]
  15. Imlay, J.A. Pathways of oxidative damage. Annu. Rev. Microbiol. 2003, 57, 395–418. [Google Scholar] [CrossRef]
  16. Farr, S.B.; Kogoma, T. Oxidative stress responses in Escherichia coli and Salmonella typhimurium. Microbiol. Rev. 1991, 55, 561–585. [Google Scholar] [CrossRef]
  17. Zuber, P. Management of oxidative stress in Bacillus. Annu. Rev. Microbiol. 2009, 63, 575–597. [Google Scholar] [CrossRef]
  18. Nicholls, P.; Fita, I.; Loewen, P.C. Enzymology and structure of catalases. Adv. Inorg. Chem. 2001, 51, 51–106. [Google Scholar]
  19. Kono, Y.; Fridovich, I. Isolation and characterization of the pseudocatalase of Lactobacillus plantarum. J. Biol. Chem. 1983, 258, 6015–6019. [Google Scholar] [CrossRef]
  20. Barynin, V.V.; Whittaker, M.M.; Antonyuk, S.V.; Lamzin, V.S.; Harrison, P.M.; Artymiuk, P.J.; Whittaker, J.W. Crystal Structure of Manganese Catalase from Lactobacillus plantarum. Structure 2001, 9, 725–738. [Google Scholar] [CrossRef] [PubMed]
  21. Antonyuk, S.V.; Melik-Adman, V.R.; Popov, A.N.; Lamzin, V.S.; Hempstead, P.D.; Harrison, P.M.; Artymyuk, P.J.; Barynin, V.V. Three-dimensional structure of the enzyme dimanganese catalase from Thermus thermophilus at 1 Å resolution. Crystallogr. Rep. 2000, 45, 105–113. [Google Scholar] [CrossRef]
  22. Barynin, V.V.; Grebenko, A.I. T-catalase is nonheme catalase of the extremely thermophilic bacterium Thermus thermophilus HB8. Dokl. Akad. Nauk SSSR 1986, 286, 461–464. [Google Scholar]
  23. Allgood, G.S.; Perry, J.J. Characterization of a manganese-containing catalase from the obligate thermophile Thermoleophilum album. J. Bacteriol. 1986, 168, 563–567. [Google Scholar] [CrossRef] [Green Version]
  24. Amo, T.; Atomi, H.; Imanaka, T. Unique Presence of a Manganese Catalase in a Hyperthermophilic Archaeon, Pyrobaculum calidifontis VA1. J. Bacteriol. 2002, 184, 3305–3312. [Google Scholar] [CrossRef] [PubMed] [Green Version]
  25. Whittaker, J.W. Non-heme manganese catalase-the “other” catalase, Arch. Biochem. Biophys. 2012, 525, 111–120. [Google Scholar] [CrossRef] [Green Version]
  26. Bihani, S.C.; Chakravarty, D.; Ballal, A. KatB, a cyanobacterial Mn-catalase with unique active site configuration: Implications for enzyme function. Free Rad. Biol. Med. 2016, 93, 118–129. [Google Scholar] [CrossRef]
  27. Cardenas, J.P.; Quatrini, R.; Holmes, D.S. Aerobic Lineage of the Oxidative Stress Response Protein Rubrerythrin Emerged in an Ancient Microaerobic, (Hyper)Thermophilic Environment. Front. Microbiol. 2016, 7, 1822–1831. [Google Scholar] [CrossRef] [Green Version]
  28. Signorella, S.; Palopoli, C.; Ledesma, G. Rationally designed mimics of antioxidant manganoenzymes: Role of structural features in the quest for catalysts with catalase and superoxide dismutase activity. Coord. Chem. Rev. 2018, 365, 75–102. [Google Scholar] [CrossRef]
  29. Wu, A.J.; Penner-Hahn, J.E.; Pecoraro, V.L. Structural, Spectroscopic, and Reactivity Models for the Manganese Catalases. Chem. Rev. 2004, 104, 903–938. [Google Scholar] [CrossRef] [PubMed]
  30. Tovmasyan, A.; Maia, C.G.C.; Weitner, T.; Carballal, S.; Sampaio, R.S.; Lieb, D.; Ghazaryan, R.; Ivanovic-Burmazovic, I.; Radi, R.; Reboucas, J.S.; et al. A comprehensive evaluation of catalase-like activity of different classes of redox-active therapeutics. Free Rad. Biol. Med. 2015, 86, 308–321. [Google Scholar] [CrossRef] [Green Version]
  31. Batinic-Haberle, I.; Tovmasyan, A.; Spasojevic, I. An educational overview of the chemistry, biochemistry and therapeutic aspects of Mn porphyrins—From superoxide dismutation to HO-driven pathways. Redox Biol. 2015, 5, 43–65. [Google Scholar] [CrossRef] [PubMed] [Green Version]
  32. Kaizer, J.; Baráth, G.; Speier, G.; Réglier, M.; Giorgi, M. Synthesis, structure and catalase mimics of novel homoleptic manganese(II) complexes of 1,3-bis(2′-pyridylimino)isoindoline, Mn(4R-ind)2 (R = H, Me). Inorg. Chem. Commun. 2007, 10, 292–294. [Google Scholar] [CrossRef]
  33. Kaizer, J.; Kripli, B.; Speier, G.; Párkányi, L. Synthesis, structure, and catalase-like activity of a novel manganese(II) complex: Dichloro [1,3-bis(2′-benzimidazolylimino)isoindoline]manganese(II). Polyhedron 2009, 28, 933–936. [Google Scholar] [CrossRef]
  34. Kaizer, J.; Csay, T.; Kővári, P.; Speier, G.; Párkányi, L. Catalase mimics of a manganese(II) complex: The effect of axial ligands and pH. J. Mol. Catal. A Chem. 2008, 280, 203–209. [Google Scholar] [CrossRef]
  35. Kripli, B.; Garda, Z.; Sólyom, B.; Tircsó, G.; Kaizer, J. Formation, stability and catalase-like activity of mononuclear manganese(II) and oxomanganese(IV) complexes in protic and aprotic solvents. New J. Chem. 2020, 44, 5545–5555. [Google Scholar] [CrossRef]
  36. Stadtman, E.R.; Berlett, B.S.; Chock, P.B. Manganese-dependent disproportionation of hydrogen peroxide in bicarbonate buffer. Proc. Natl. Acad. Sci. USA 1990, 87, 384–388. [Google Scholar] [CrossRef] [Green Version]
  37. Kripli, B.; Sólyom, B.; Speier, G.; Kaizer, J. Stability and Catalase-Like Activity of a Mononuclear Non-Heme Oxoiron(IV) Complex in Aqueous Solution. Molecules 2019, 24, 3236. [Google Scholar] [CrossRef] [PubMed] [Green Version]
  38. Meena, B.I.; Kaizer, J. Design and Fine-Tuning Redox Potentials of Manganese(II) Complexes with Ioindoline-Based Ligands: H2O2 Oxidation and Oxidative Bleaching Performance in Aqueous Solution. Catalysts 2020, 10, 404. [Google Scholar] [CrossRef] [Green Version]
  39. Pap, J.S.; Draksharapu, A.; Giorgi, M.; Browne, W.R.; Kaizer, J.; Speier, G. Stabilisation of mu-peroxido-bridged Fe(III) intermediates with non-symmetric bidentate N-donor ligands. Chem. Commun. 2014, 50, 1326–1329. [Google Scholar] [CrossRef] [Green Version]
  40. Szávuly, M.I.; Surducan, M.; Nagy, E.; Surányi, M.; Speier, G.; Silaghi-Dumitrescu, R.; Kaizer, J. Functional models of nonheme enzymes: Kinetic and computational evidence for the formation of oxoiron(IV) species from peroxo-diiron(III) complexes, and their reactivity towards phenols and H2O2. Dalton Trans. 2016, 45, 14709–14718. [Google Scholar] [CrossRef]
  41. Kripli, B.; Csendes, F.V.; Török, P.; Speier, G.; Kaizer, J. Stoichiometric Aldehyde Deformylation Mediated by Nucleophilic Peroxo-diiron(III) Complex as a Functional Model of Aldehyde Deformylating Oxygenase. Chem. Eur. J. 2019, 25, 14290–14294. [Google Scholar] [CrossRef]
  42. Pap, J.S.; Cranswick, M.A.; Balogh-Hergovich, É.; Baráth, G.; Giorgi, M.; Rohde, G.T.; Kaizer, J.; Speier, G.; Que, L., Jr. An Iron(II)[1,3-bis(2′-pyridylimino)isoindoline] Complex as a Catalyst for Substrate Oxidation with H2O2—Evidence for a Transient Peroxidodiiron(III) Species. Eur. J. Inorg. Chem. 2013, 2013, 3858–3866. [Google Scholar] [CrossRef] [Green Version]
  43. Kripli, B.; Szávuly, M.; Csendes, F.V.; Kaizer, J. Functional models of nonheme diiron enzymes: Reactivity of the mu-oxo-mu-1,2-peroxo-diiron(III) intermediate in electrophilic and nucleophilic reactions. Dalton Trans. 2020, 49, 1742–1746. [Google Scholar] [CrossRef] [PubMed]
  44. Oloo, W.N.; Fielding, A.J.; Que, L., Jr. Rate determining water assisted O-O bond cleavage of a FeIII-OOH intermediate in a bioinspired nonheme iron-catalyzed oxidation. J. Am. Chem. Soc. 2013, 135, 6438–6441. [Google Scholar] [CrossRef] [PubMed]
  45. Lakk-Bogáth, D.; Török, P.; Csendes, F.V.; Keszei, S.; Gantner, B.; Kaizer, J. Disproportionation of H2O2 Mediated by Diiron-Peroxo Complexes as Catalase Mimics. Molecules 2021, 26, 4501. [Google Scholar] [CrossRef]
  46. Török, P.; Unjaroen, D.; Csendes, F.V.; Giorgi, M.; Browne, W.R.; Kaizer, J. A nonheme peroxo-diiron(III) complex exhibiting both nucleophilic and electrophilic oxidation of organic substrates. Dalton Trans. 2021, 50, 7181–7185. [Google Scholar] [CrossRef] [PubMed]
  47. Török, P.; Lakk-Bogáth, D.; Kaizer, J. Stoichiometric Alkane and Aldehyde Hydroxylation Reactions Mediated by In Situ Generated Iron(III)-Iodosylbenzene Adduct. Molecules 2023, 28, 1855. [Google Scholar] [CrossRef]
  48. Reeder, K.A.; Dose, E.V.; Wilson, L.J. Solution-state spin-equilibrium properties of the tris[2-(2-pyridyl)imidazole]iron(II) and tris[2-(2-pyridyl)benzimidazole]iron(II) cations. Inorg. Chem. 1978, 17, 1071–1075. [Google Scholar] [CrossRef]
  49. Britovsek, G.J.P.; England, J.; White, A.J.P. Non-heme Iron(II) Complexes Containing Tripodal Tetradentate Nitrogen Ligands and Their Application in Alkane Oxidation Catalysis. Inorg. Chem. 2005, 44, 8125–8134. [Google Scholar] [CrossRef]
  50. Prat, I.; Company, A.; Corona, T.; Parella, T.; Ribas, X.; Costas, M. Assessing the Impact of Electronic and Steric Tuning of the Ligand in the Spin State and Catalytic Oxidation Ability of the FeII(Pytacn) Family of Complexes. Inorg. Chem. 2013, 52, 9229–9244. [Google Scholar] [CrossRef]
  51. Mialane, P.; Nivorojkine, A.; Pratviel, G.; Azéma, L.; Slany, M.; Godde, F.; Simaan, A.; Banse, F.; Kargar-Grisel, T.; Bouchoux, G.; et al. Structures of Fe(II) complexes with N,N,N′-tris(2-pyridylmethyl)ethane-1,2-diamine type ligands. Bleomycin-like DNA cleavage and enhancement by an alkylammonium substituent on the N′ atom of the ligand. Inorg. Chem. 1999, 38, 1085–1092. [Google Scholar] [CrossRef] [PubMed]
Scheme 1. Geometric structures of dinuclear manganese and iron catalases (LPC/TTC (A) and KatB/Ruberythrin (B)), including their native and H2O2 complexes.
Molecules 28 02905 sch001
Scheme 2. Structure of the ligands and their complexes involved in this study.
Molecules 28 02905 sch002
Figure 1. Characterization of [FeII(L1-L5)]3](CF3SO3)2 (15) (L1 = 2-(2′-pyridyl)- 1H-benzimidazole; L2 = 2-(2′-pyridyl)-N-methyl-benzimidazole; L3 = 2-(4-thiazolyl)-1H-benzimidazole; L4 = 2-(4′-methyl-2′-pyridyl)-1H-benzimidazole; L5 = 2-(1H-1,2,4-triazol-3-yl)-pyridine) complexes. (a) Electronic spectra of [FeII(L1-L5)]3](CF3SO3)2 (15) complexes: [15] = 2.0 × 10⁻⁵ M, T = 293 K, l = 1 cm, V = 2 mL MeCN. (b) Cyclic voltammograms of [FeII(L1-L5)]3](CF3SO3)2 (15) complexes: [15] = 1.0 × 10⁻³ M, in (0.1 M TBAClO4) MeCN (10 cm3), scan rate: 500 mV/s.
Molecules 28 02905 g001
Figure 2. (a) Correlation between the redox potential (E1/2) and the metal-to-ligand charge transfer (MLCT) bands of [FeII(L1-L5)]3](CF3SO3)2 (15) complexes. (b) Characteristic UV–Vis spectra of [FeIII2(μ-O2)(L1−5)4(Solv)2]3+ (1P5P) complexes generated by excess of H2O2: [15]0 = 0.5 × 10⁻³ M, T = 298 K, l = 1 cm, V = 2 mL MeCN.
Molecules 28 02905 g002
Figure 3. Self-decay of [FeIII2(μ-O2)(L2)4(Solv)2]3+ (4P) generated in the reaction of 4 with 4 equivalent of H2O2. (a) UV–Vis spectral change during the decay of 4P. (b) Time course of the self-decay of 4P: [4]0 = 1.0 × 10⁻³ M, [H2O2]0 = 4.0 × 10⁻³ M, l = 1 cm, V = 2 mL MeCN; ksd = 1.955 × 10⁻³ s−1 for 1P and 1.177 × 10⁻³ s−1 for 4P at 298 K.
Molecules 28 02905 g003
Figure 4. Time course of the formation and decay of μ-1,2-peroxo-diiron(III) (1P and 4P) complexes generated in the reaction of 1 and 4 with 4 equivalent of H2O2 for 5–6 cycles. (a) Generation and decay of 1P for 6 cycles. (b) Generation and decay of 4P for 5 cycles. [1 and 4]0 = 1.0 × 10⁻³ M, [H2O2] = 4.0 × 10⁻³ M (5-6×), T = 298 K, l = 1 cm, V = 2 mL MeCN.
Molecules 28 02905 g004
Figure 5. Time course of the formation and decay of μ-1,2-peroxo-diiron(III) (3P and 5P) complexes. (a) Time course of the formation and decay of μ-1,2-peroxo-diiron(III) (5P) complex generated in the reaction of 5 with 50 equivalents of H2O2 for 5 cycles: [5]0 = 1.0 × 10⁻³ M, H2O2 = 5.0 × 10⁻² M, T = 298 K, l = 1 cm, V = 2 mL MeCN. (b) Generation and decay of 3P for 3 cycles. [3]0 = 1.0 × 10⁻³ M, [H2O2] = 4.0 × 10⁻³ M (3×), T = 298 K, l = 1 cm, V = 2 mL MeCN.
Molecules 28 02905 g005
Figure 6. Time traces for the 3P5P-mediated disproportionation reaction of H2O2: [35]0 = 1.0 × 10⁻³ M, [H2O2]0 = 300 × 10−3 M, T = 298 K, V = 20 mL MeCN.
Molecules 28 02905 g006
Figure 7. Comparison of the catalase-like activity of [FeII(L1-L5)]3](CF3SO3)2 (15) complexes at 298 K. (a) Dependence of the reaction yield on the H2O2 concentration. (b) Dependence of the TON (TON = [H2O2]/[15] on the H2O2 concentration (Table 2).
Molecules 28 02905 g007
Figure 8. (a) UV–Vis spectral changes of 1P during the catalytic disproportionation reaction of H2O2. (b) Time course of the formation and decay of 1P during the catalytic disproportionation reaction of H2O2 and the parallel formation of dioxygen monitored by UV–Vis spectroscopy at 720 nm and by volumetrically determined amounts of evolved dioxygen. [1]0 = 1.0 × 10⁻³ M, [H2O2]0 = 0.3 M, T = 298 K in MeCN.
Molecules 28 02905 g008
Figure 9. (a) UV–Vis spectral changes of 2P during the catalytic disproportionation reaction of H2O2. (b) Time course of the formation and decay of 2P during the catalytic disproportionation reaction of H2O2 and the parallel formation of dioxygen monitored by UV–Vis spectroscopy at 710 nm and by volumetrically determined amounts of evolved dioxygen. [2]0 = 1.0 × 10⁻³ M, [H2O2]0 = 0.3 M, T = 298 K in MeCN.
Molecules 28 02905 g009
Figure 10. (a) UV–Vis spectral changes of 3P during the catalytic disproportionation reaction of H2O2. (b) Time course of the formation and decay of 3P during the catalytic disproportionation reaction of H2O2 and the parallel formation of dioxygen monitored by UV–Vis spectroscopy at 700 nm and by volumetrically determined amounts of evolved dioxygen. [3]0 = 1.0 × 10⁻³ M, [H2O2]0 = 0.3 M, T = 298 K in MeCN.
Molecules 28 02905 g010
Figure 11. (a) UV–Vis spectral changes of 4P during the catalytic disproportionation reaction of H2O2. (b) Time course of the formation and decay of 4P during the catalytic disproportionation reaction of H2O2 and the parallel formation of dioxygen monitored by UV–Vis spectroscopy at 710 nm and by volumetrically determined amounts of evolved dioxygen. [4]0 = 1.0 × 10⁻³ M, [H2O2]0 = 0.3 M, T = 298 K in MeCN.
Molecules 28 02905 g011
Figure 12. (a) UV–Vis spectral changes of 5P during the catalytic disproportionation reaction of H2O2. (b) Time course of the formation and decay of 5P during the catalytic disproportionation reaction of H2O2 and the parallel formation of dioxygen monitored by UV–Vis spectroscopy at 695 nm and by volumetrically determined amounts of evolved dioxygen. [5]0 = 1.0 × 10⁻³ M, [H2O2]0 = 0.3 M, T = 298 K in MeCN.
Molecules 28 02905 g012
Figure 13. Comparison of the 3P5P-mediated disproportionation reaction of H2O2 in MeCN at 298 K. (a) Dependence of the reaction rate (Vi) on the in situ generated [3P5P] concentration: [H2O2]0 = 0.3 M. (b) Dependence of the reaction rate (Vi) on the [H2O2]0 concentration: [3P5P] = 0.5 mM.
Molecules 28 02905 g013
Figure 14. Peroxo-diiron(III)-mediated disproportionation of H2O2 in MeCN at 298 K. (a) Dependence of the reaction rate (kcat) for H2O2 oxidation on the redox potential (E1/2) of the [FeII(L1−5)3]2+ (15) complexes. (b) Kinetic isotope effect (KIE) on the disproportionation of H2O2. [4]0 = 1.0 × 10⁻³ M, [H2O2]0 = 0.05 M, [H2O or D2O]0 = 2.8 M (100 μL) in MeCN.
Molecules 28 02905 g014
Scheme 3. Schematic mechanism of the iron-mediated disproportionation reaction of H2O2.
Molecules 28 02905 sch003
Table 1. Summary of spectroscopic and redox potential data of iron(II) precursor complexes compared with their catalase-like activity.
Catalystλ1Fe(II)
(nm)
ν1Fe(II)
(cm−1)
Epa
(mV)
Epc
(mV)
E1/2
(mV)
kcat1
(10−3M−1/2s−1)
131731,546898823860.52.81 2
231931,348840771805.55.06 2
3301 333,22397092294611.3
431631,6468407688042.16
527736,1011083996103996.6
1 Measurements carried out in MeCN at 298 K (see kinetic part). 2 [40]. 3 [46].
Table 2. Comparison of the catalase-like activity of [FeII(L1-L5)]3](CF3SO3)2 (15) complexes at 298 K.
CatalystYield
(%)
TON/Fe
[H2O2]t/[Catalyst]0
TOF *
[H2O2]t/[Catalyst]0/h
19.528.553
216.348.961
36.720.0102
46.820.427
548.41451065
* Calculated from the Vi values: TOF = 3600 × (Vi/2/[1-5]): [1-5]0 = 1.0 × 10⁻³ M, [H2O2]0 = 300 × 10−3 M, T = 298 K.
Table 3. Kinetic data for the diiron(III)-mediated (3P5P) disproportionation reaction of H2O2 derived from gas volumetric measurements in MeCN at 298 K.
Catalyst[Catalyst]0
(10−3M)
[H2O2]0
(M)
Vi1
(10−5Ms−1)
kcat2
(10−3M−1/2s−1)
3P0.500.204.7810.7
1.250.208.6312.2
2.500.2013.813.8
0.500.154.6413.8
0.500.204.7810.7
0.500.255.359.57
0.500.305.658.42
11.3
4P0.500.200.952.14
1.250.201.502.12
2.500.202.392.39
0.500.150.651.94
0.500.200.952.14
0.500.251.212.16
0.500.301.512.25
2.16
5P0.500.2040.490.3
1.250.2081.5115
2.500.20120120
0.500.1528.183.8
0.500.2040.490.3
0.500.2547.284.4
0.500.3059.288.3
96.1
1 +d[O2]/dt = V = kcat [3P5P]1/2[H2O2]. 2 kcat = V/([H2O2] × [3P5P]).
Disclaimer/Publisher’s Note: The statements, opinions and data contained in all publications are solely those of the individual author(s) and contributor(s) and not of MDPI and/or the editor(s). MDPI and/or the editor(s) disclaim responsibility for any injury to people or property resulting from any ideas, methods, instructions or products referred to in the content.