
Integrated Approach for Synthetic Cathinone Drug Prioritization and Risk Assessment: In Silico Approach and Sub-Chronic Studies in Daphnia magna and Tetrahymena thermophila


 and
and 
Abstract
1. Introduction
2. Results
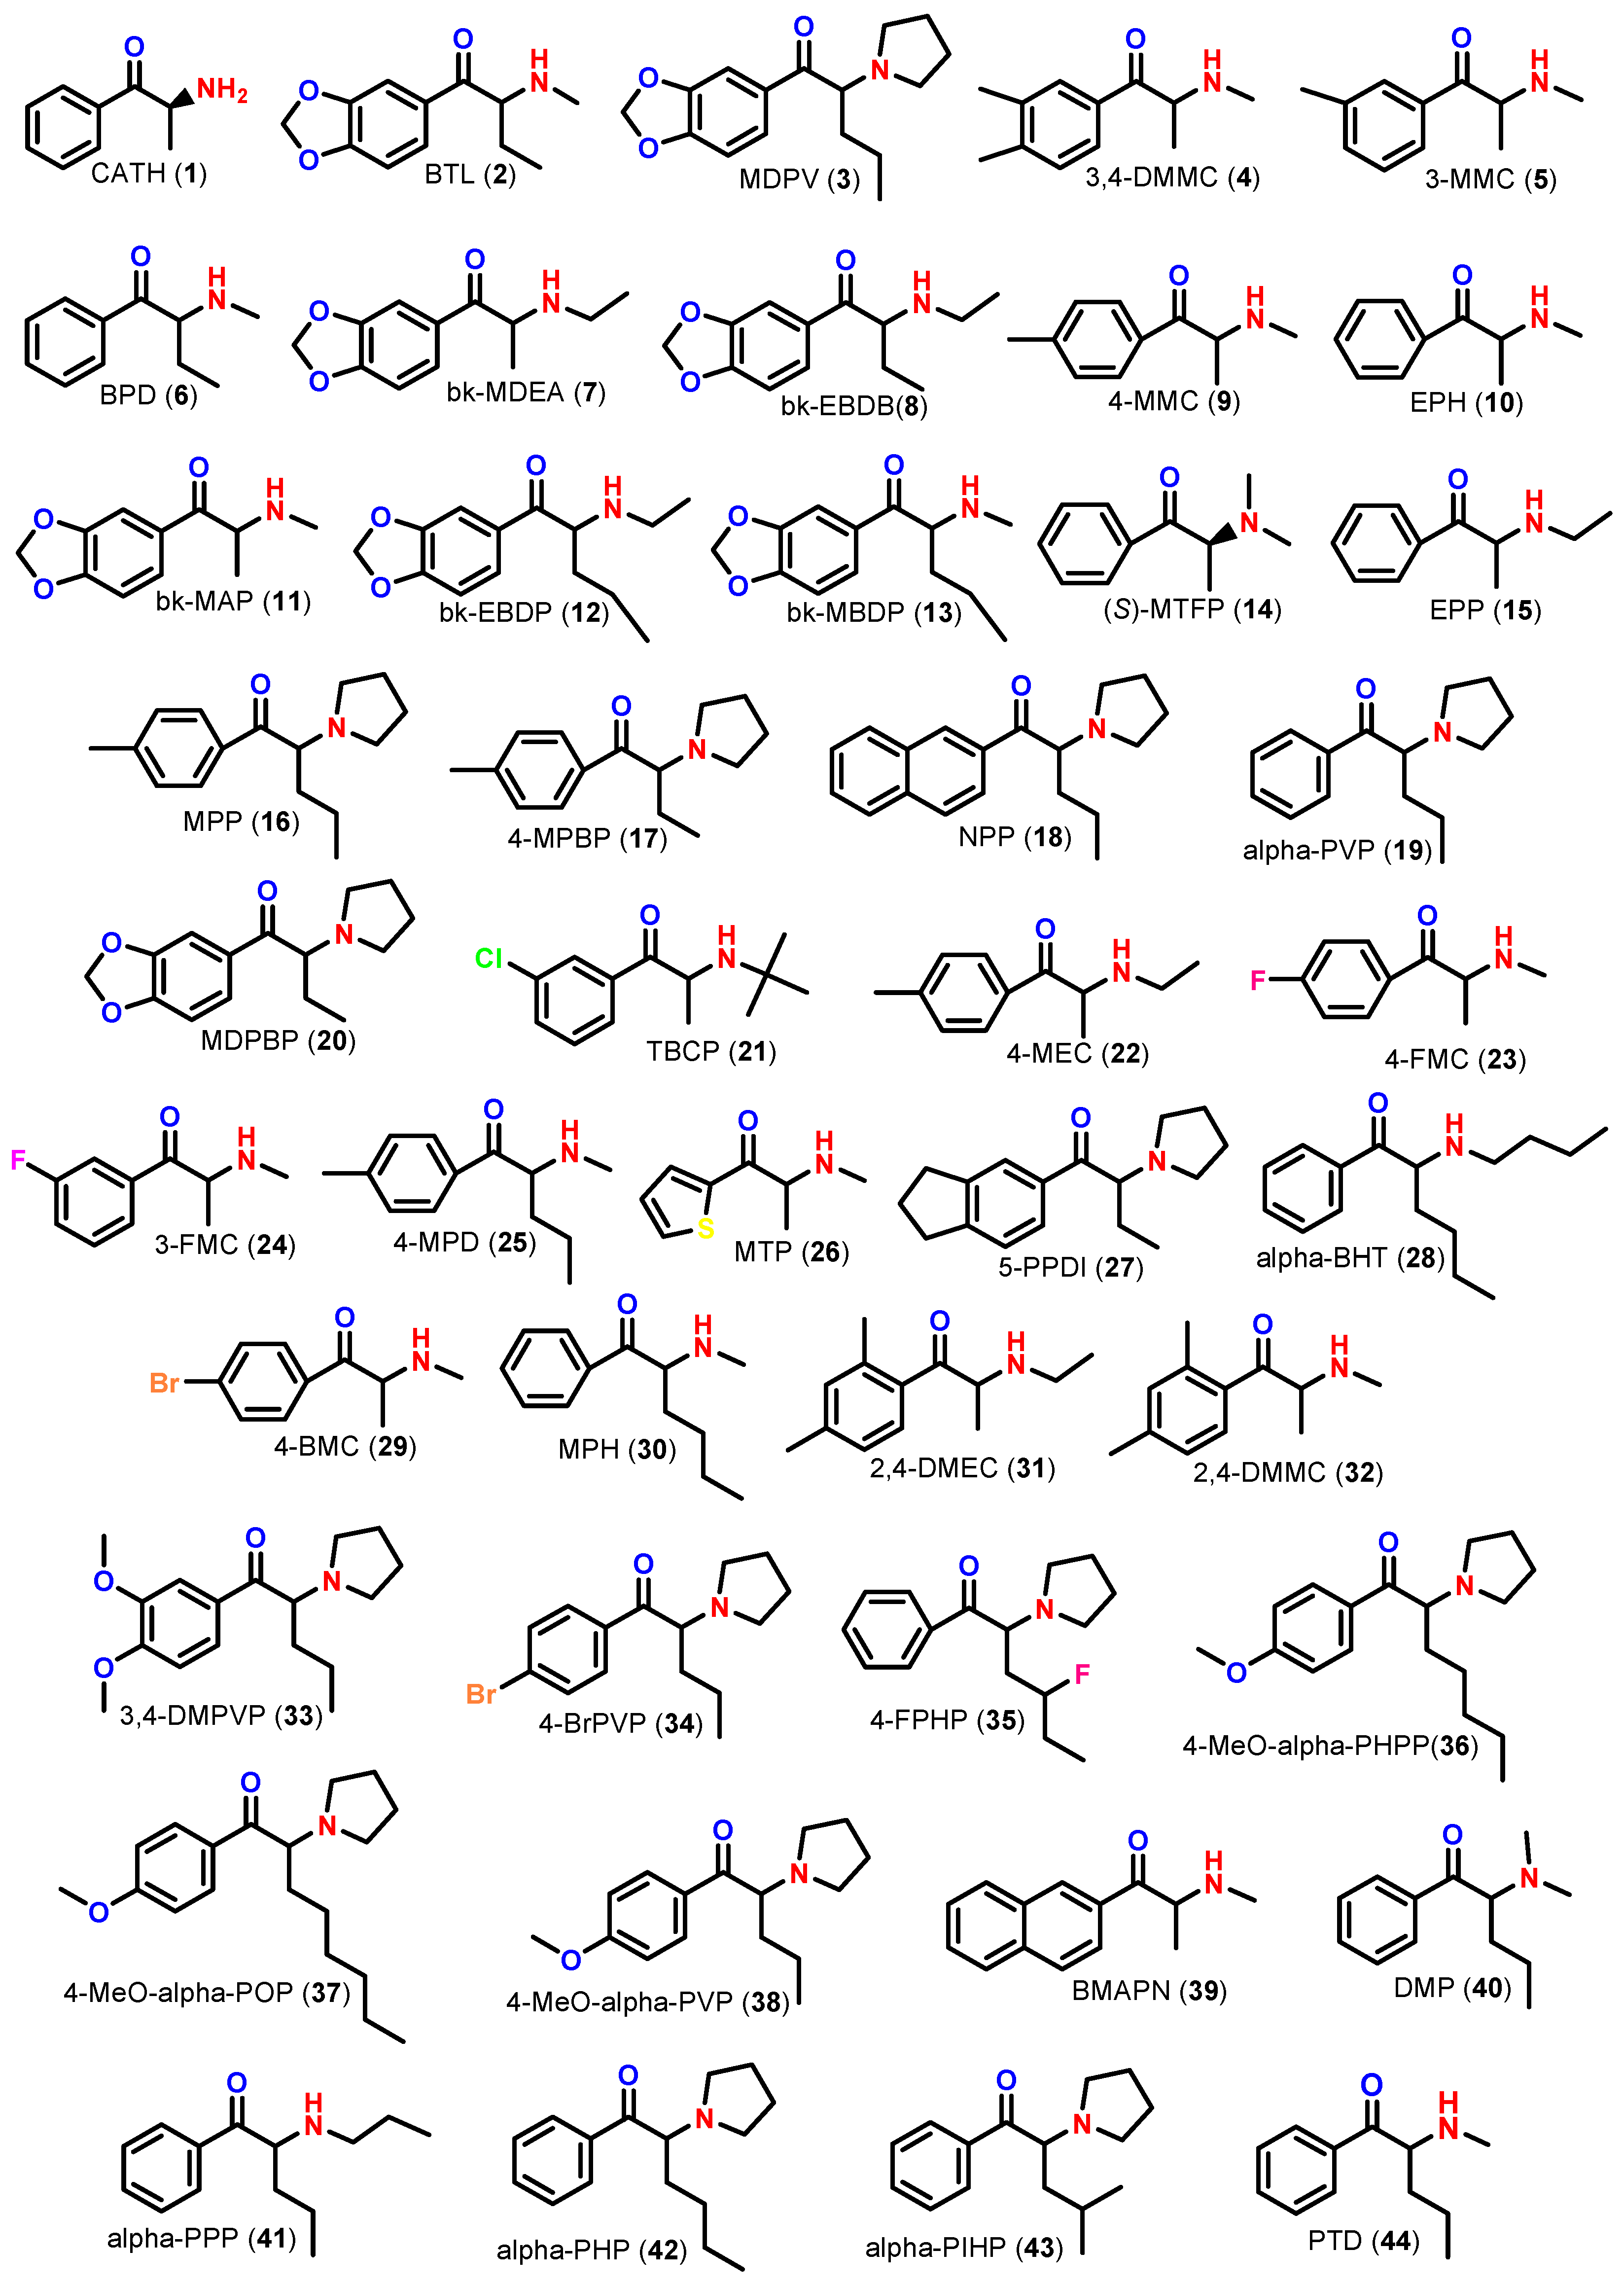
2.1. In Silico Study
2.2. In Vivo Studies
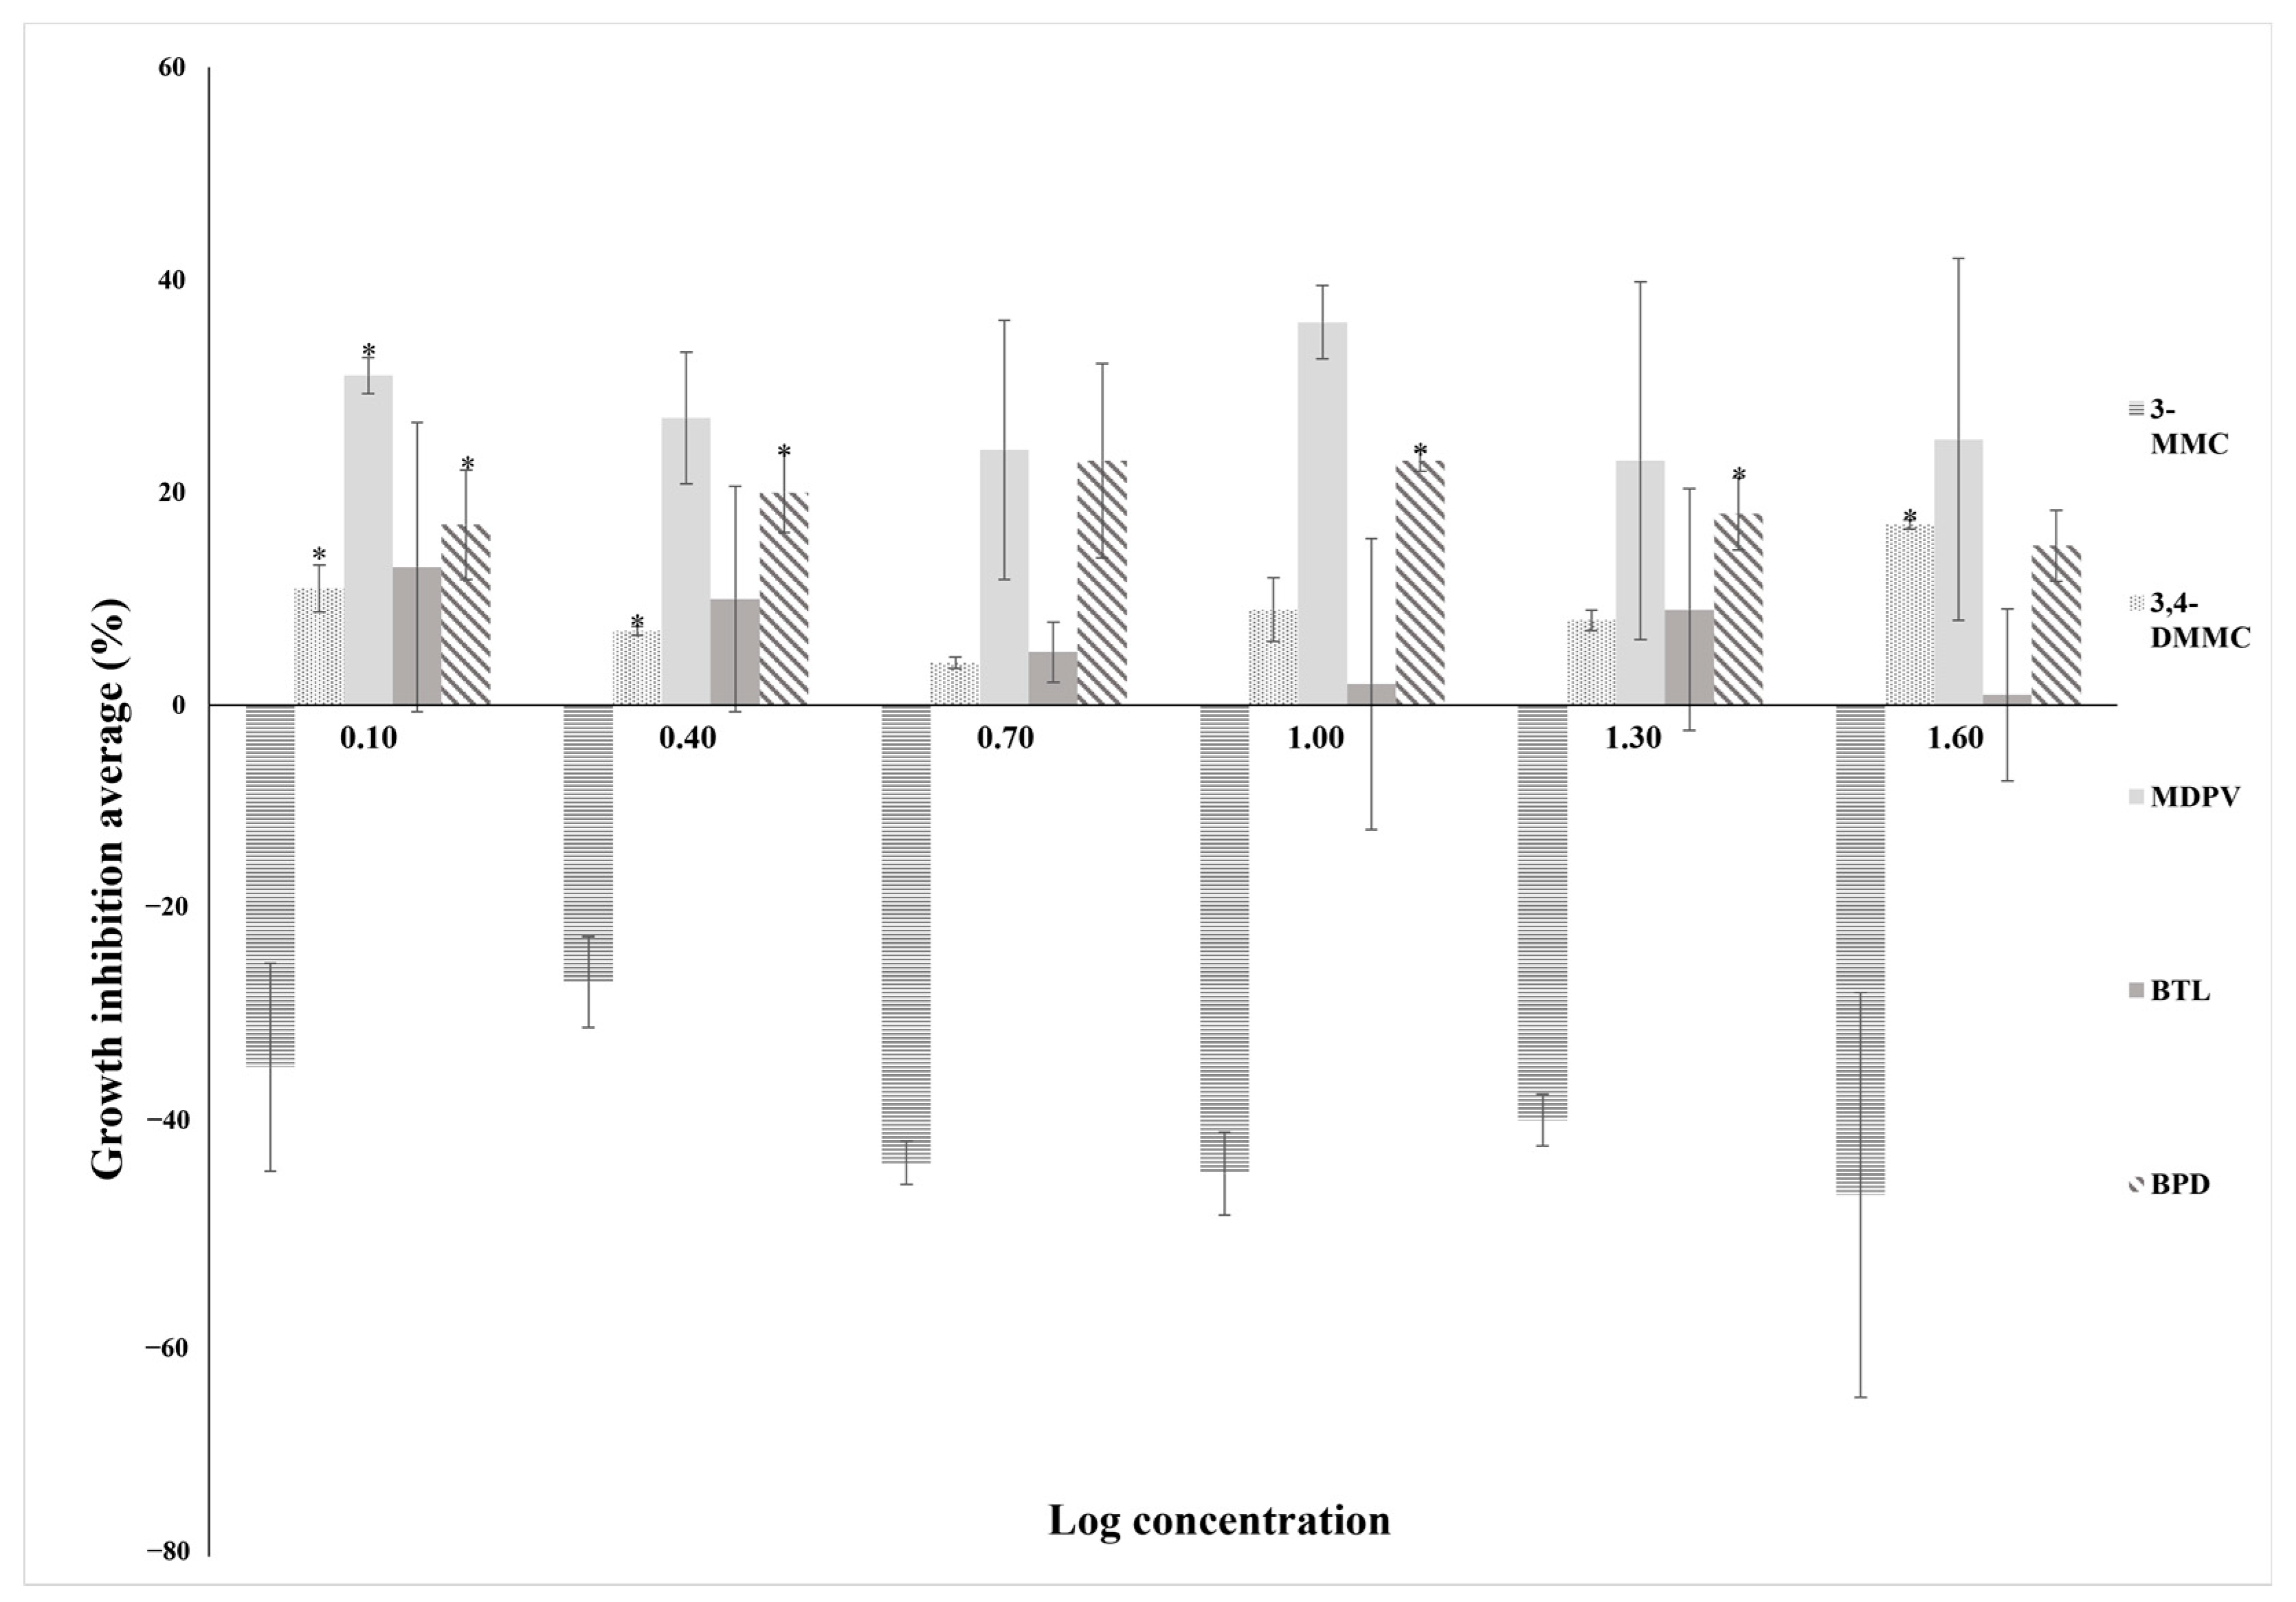
2.2.1. Short-Term Exposure Assays with T. thermophila
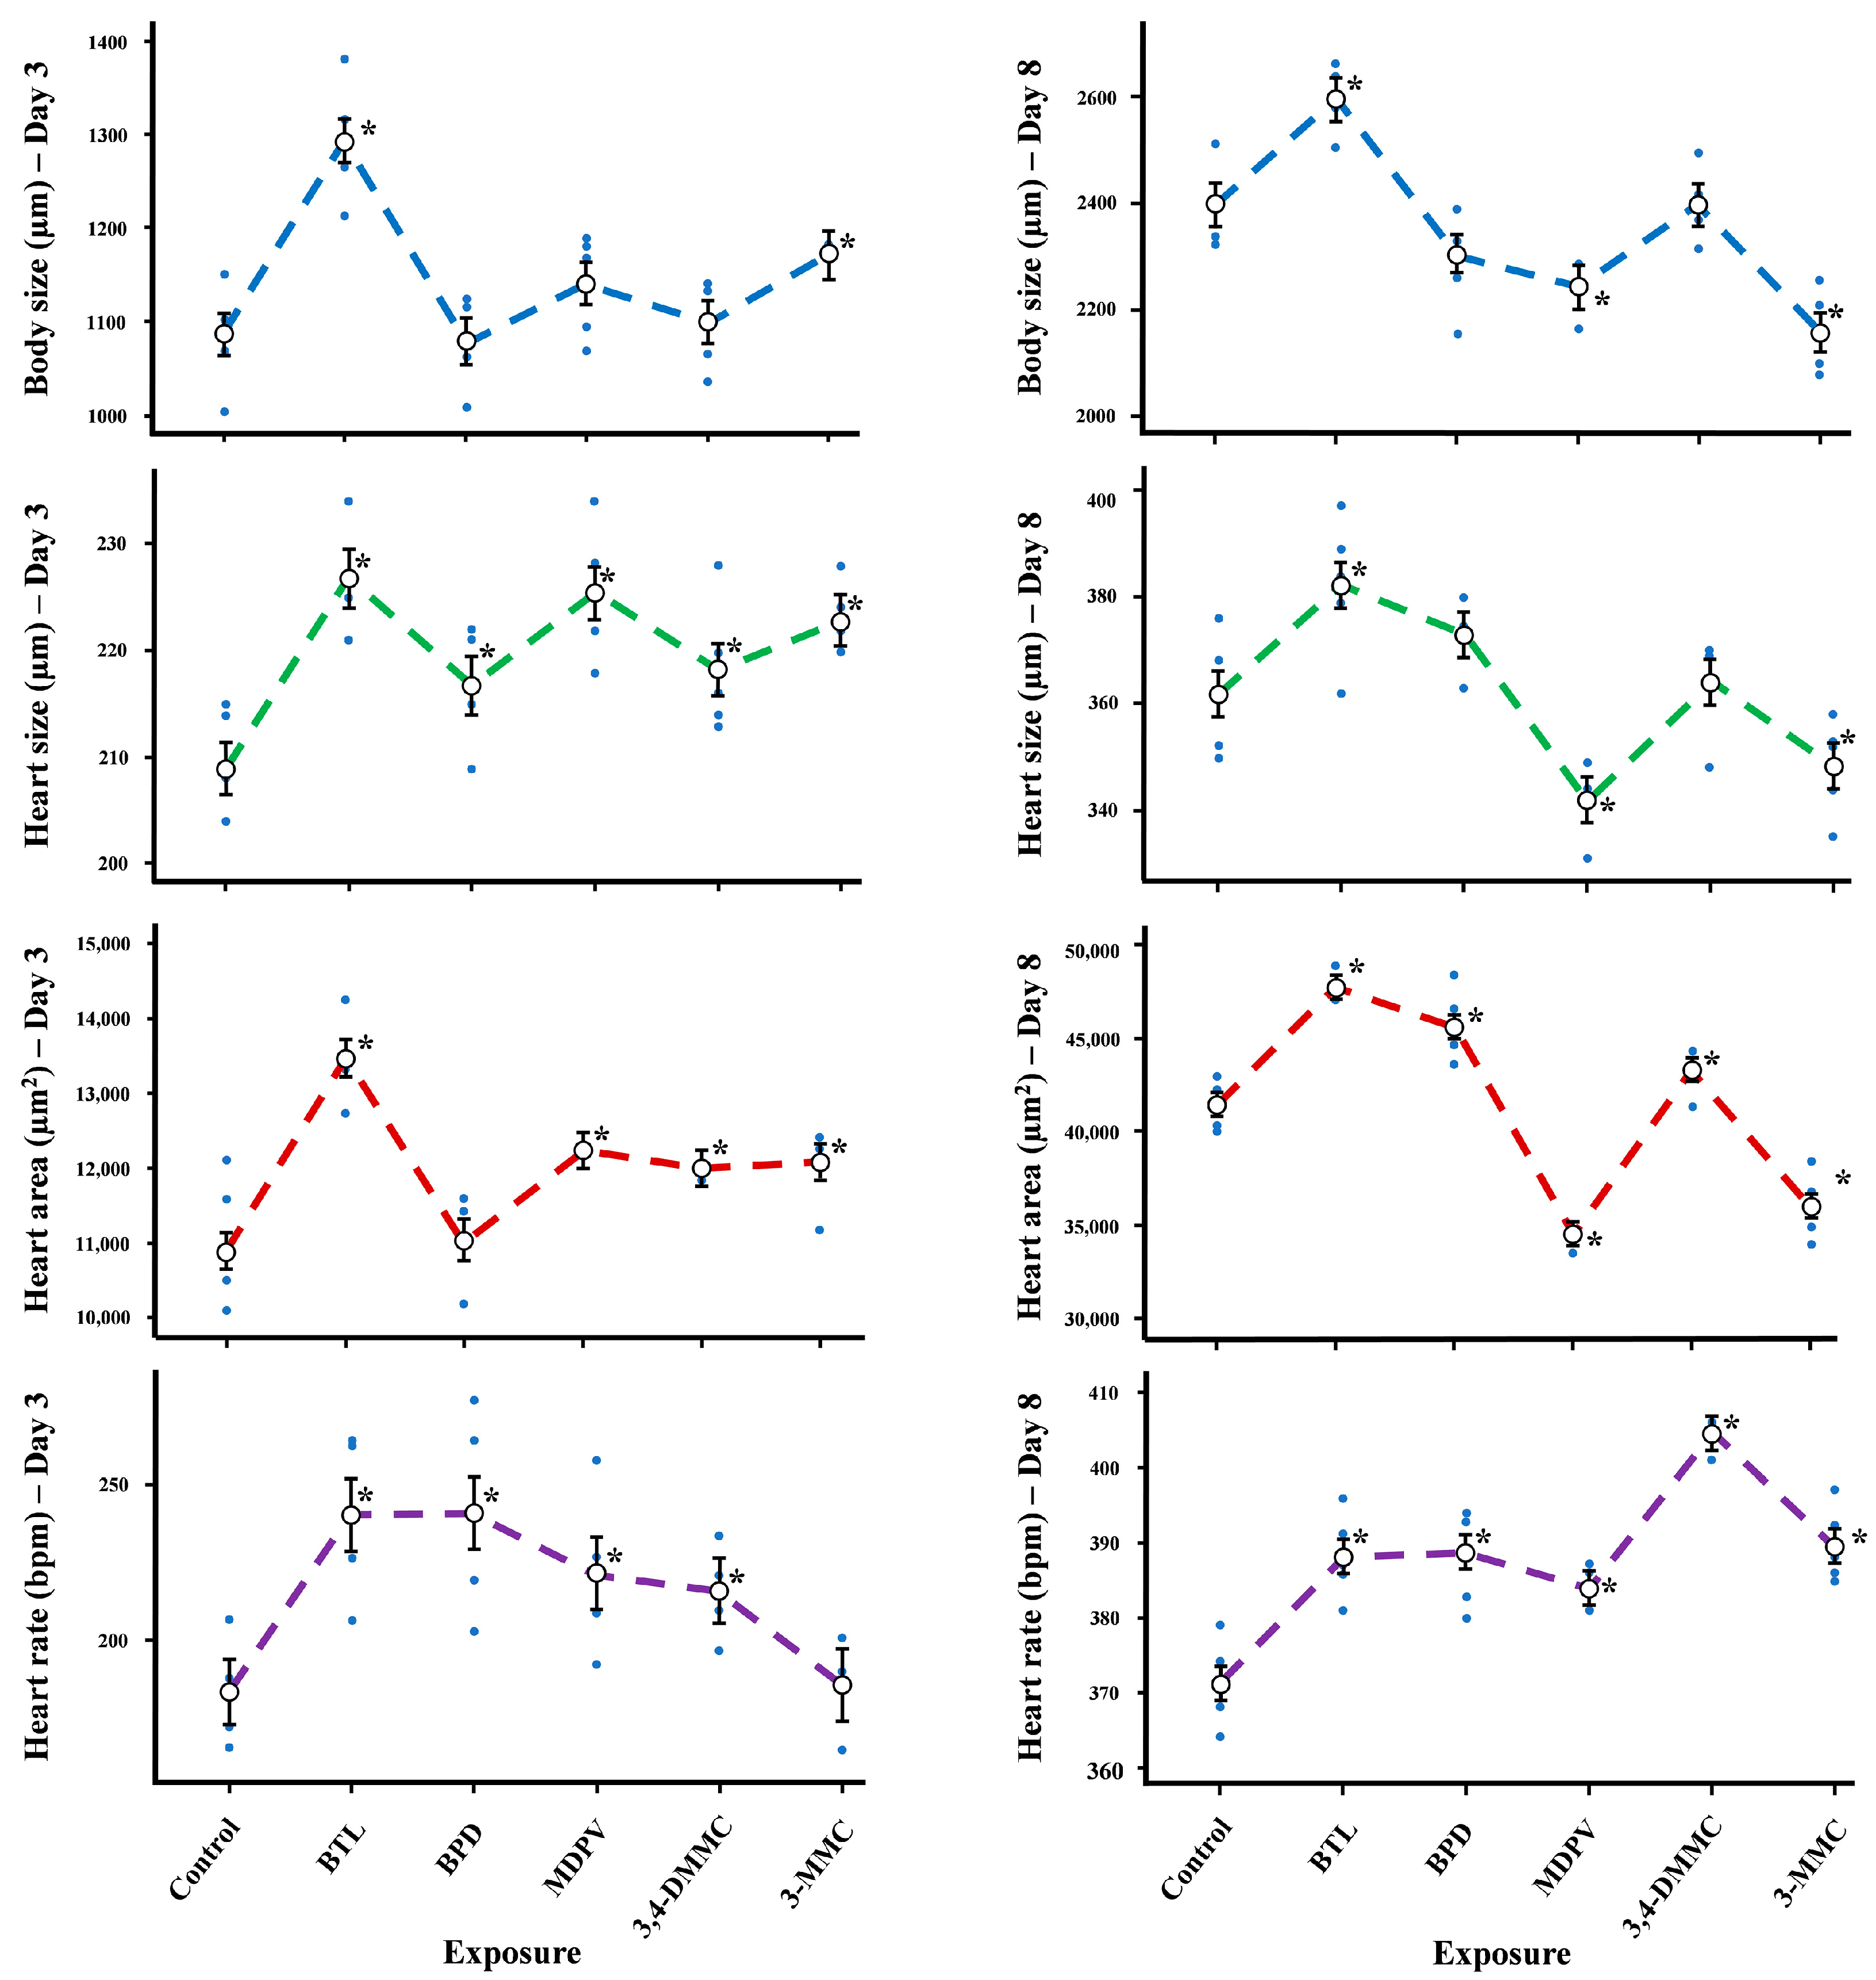
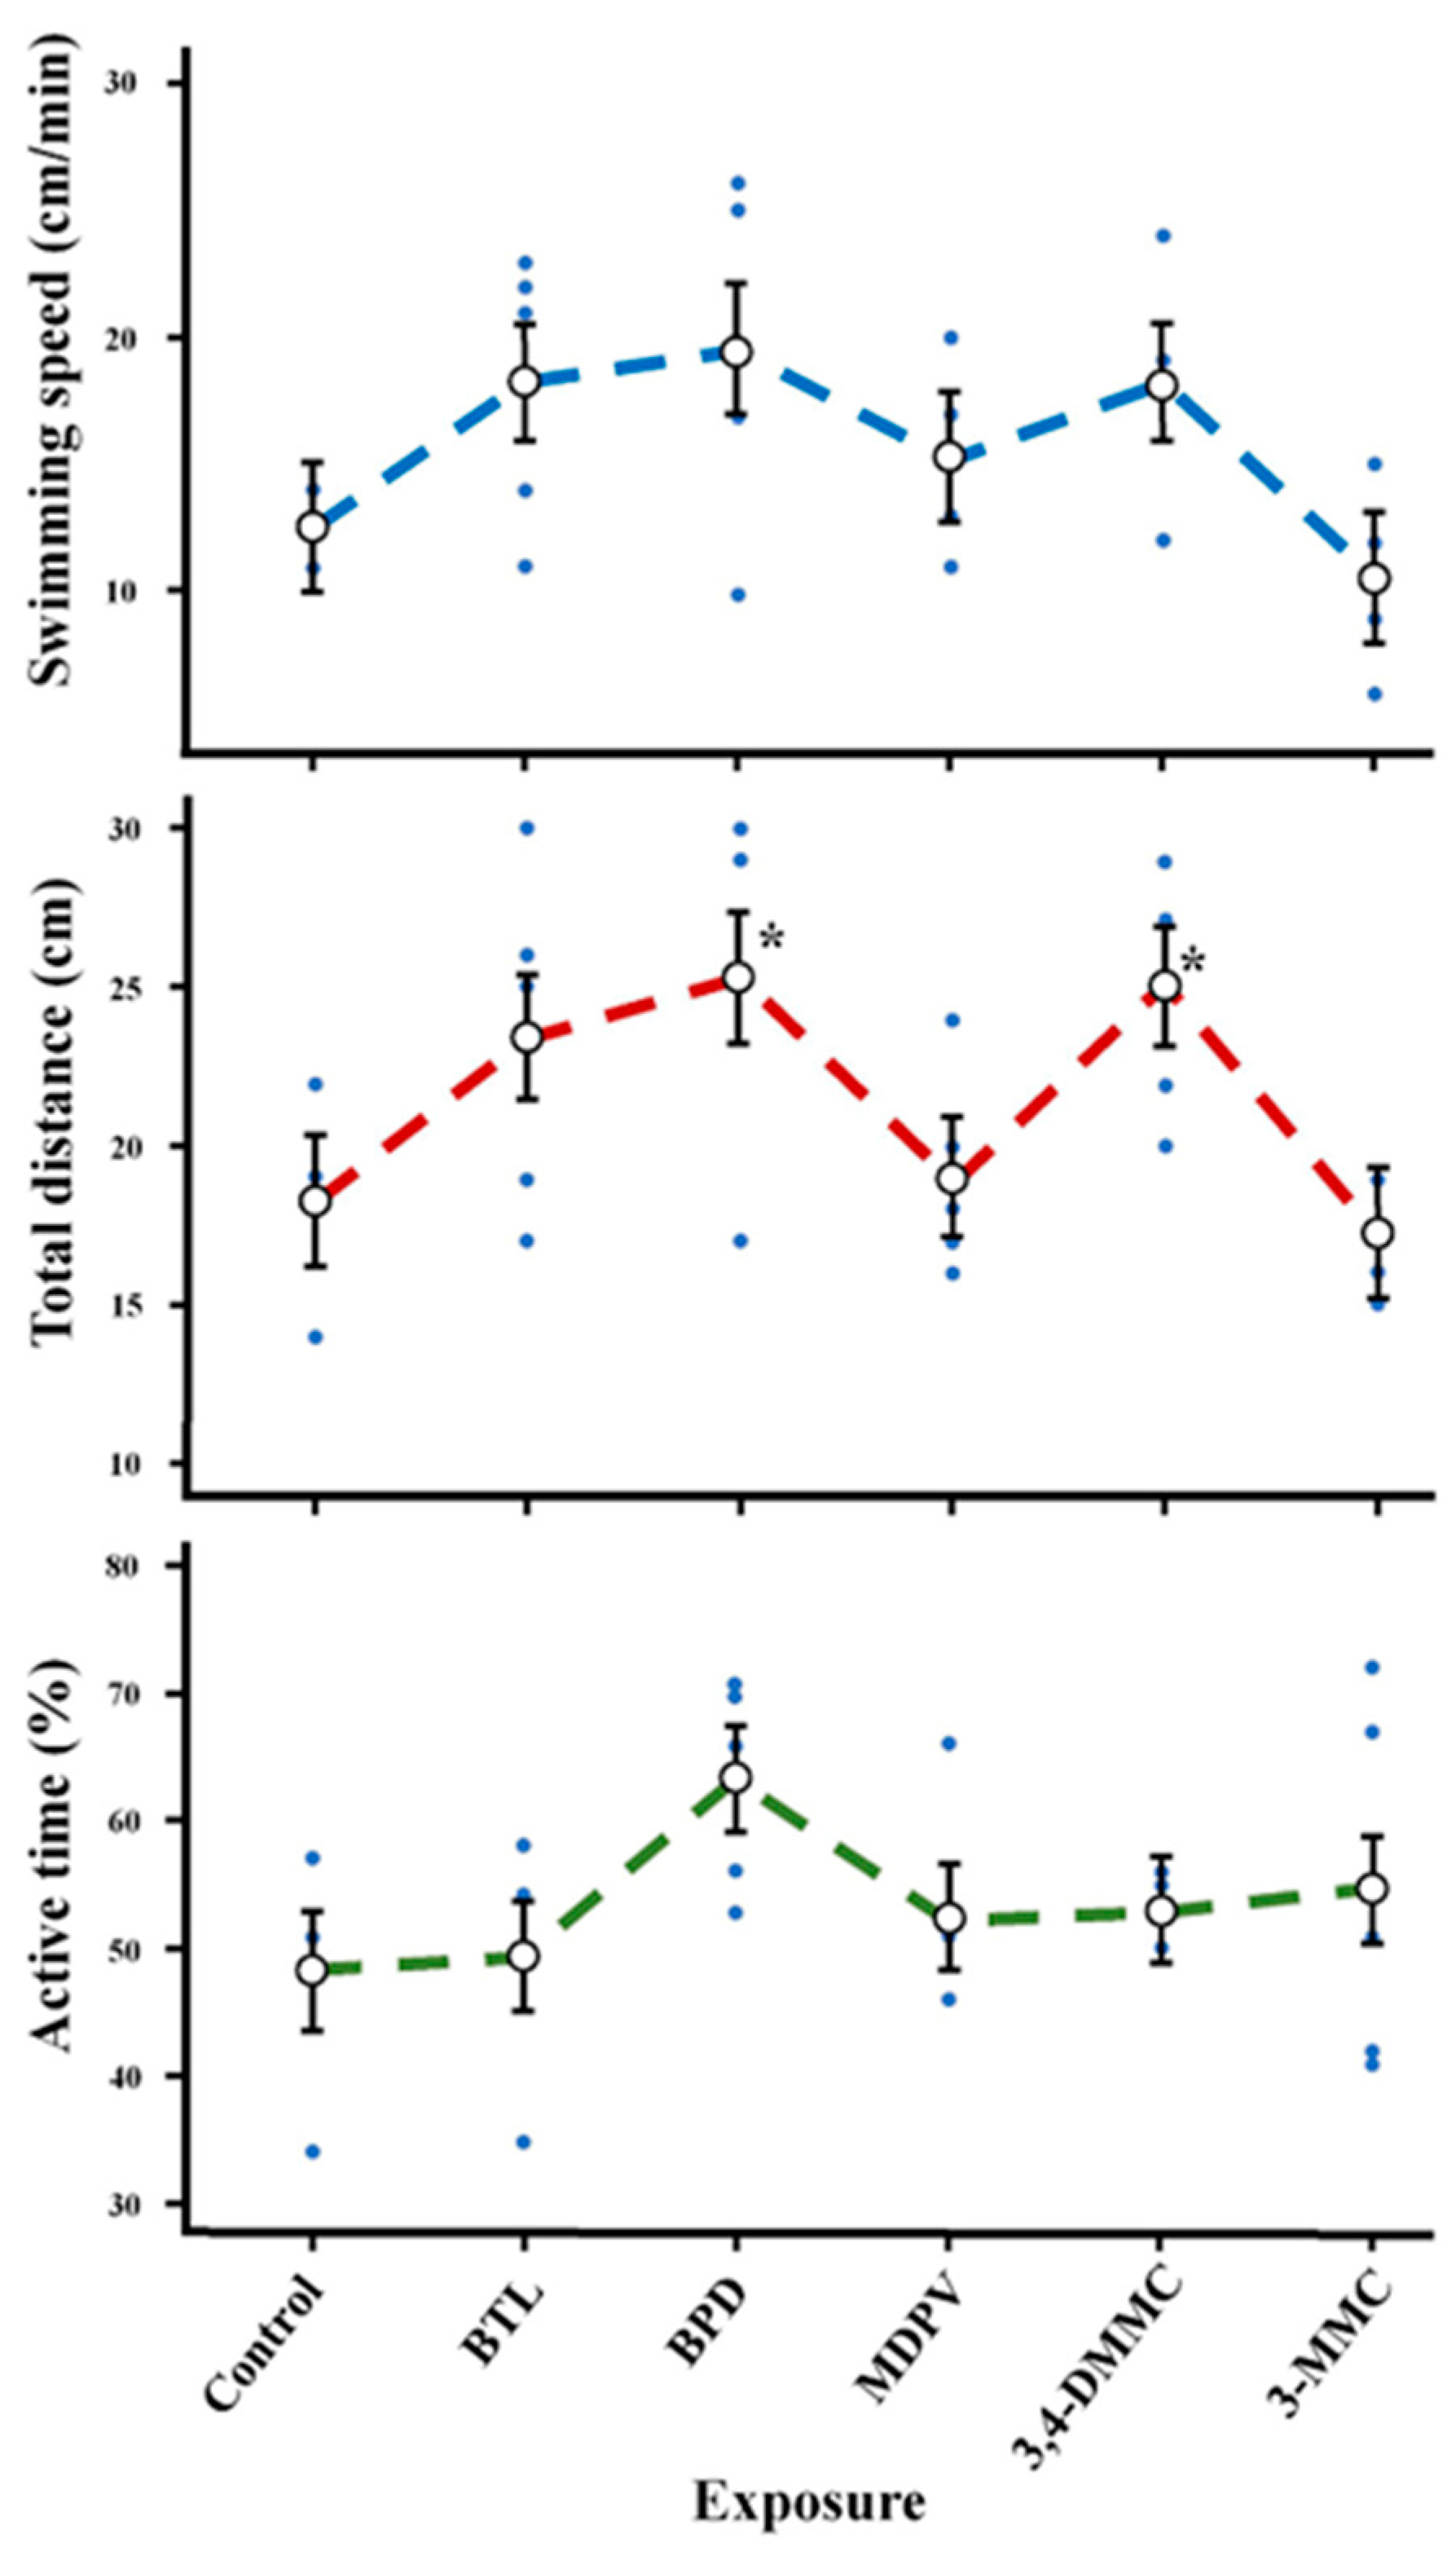
2.2.2. Short-Term and Sublethal Exposure Assay with D. magna
3. Discussion
4. Materials and Methods
4.1. Chemicals and Reagents
4.2. In Silico Study
4.3. Ecotoxicity Assays
4.3.1. Sub-Chronic Assay with T. thermophila
4.3.2. Sublethal Assay with D. magna
D. magna Culture Maintenance
Experimental Design
4.4. Statistical Analysis
5. Conclusions
Supplementary Materials
Author Contributions
Funding
Institutional Review Board Statement
Informed Consent Statement
Data Availability Statement
Acknowledgments
Conflicts of Interest
References
- Bade, R.; White, J.M.; Ghetia, M.; Adiraju, S.; Adhikari, S.; Bijlsma, L.; Boogaerts, T.; Burgard, D.A.; Castiglioni, S.; Celma, A.; et al. A Taste for New Psychoactive Substances: Wastewater Analysis Study of 10 Countries. Environ. Sci. Technol. Lett. 2021, 9, 57–63. [Google Scholar] [CrossRef]
- Langa, I.; Gonçalves, R.; Tiritan, M.E.; Ribeiro, C. Wastewater analysis of psychoactive drugs: Non-enantioselective vs enantioselective methods for estimation of consumption. Forensic Sci. Int. 2021, 325, 110873. [Google Scholar] [CrossRef] [PubMed]
- Peacock, A.; Bruno, R.; Gisev, N.; Degenhardt, L.; Hall, W.; Sedefov, R.; White, J.; Thomas, K.V.; Farrell, M.; Griffiths, P. New psychoactive substances: Challenges for drug surveillance, control, and public health responses. Lancet 2019, 394, 1668–1684. [Google Scholar] [CrossRef] [PubMed]
- European Monitoring Centre for Drugs and Drug Addiction. In New Psychoactive Substances: Global Markets, Glocal Threats and the COVID-19 Pandemic; An Update from the EU Early Warning System (December 2020); Publications Office of the European Union: Luxembourg, 2020.
- Miliano, C.; Margiani, G.; Fattore, L.; De Luca, M. Sales and Advertising Channels of New Psychoactive Substances (NPS): Internet, Social Networks, and Smartphone Apps. Brain Sci. 2018, 8, 123. [Google Scholar] [CrossRef]
- Gore, S.; van Staaden, M.J.; Sprague, J.E.; Huber, R. Synthetic cathinones and their phenethylamine analogues produce distinct psychomotor and reward behavior in crayfish. Behav. Brain Res. 2019, 379, 112368. [Google Scholar] [CrossRef]
- European Monitoring Centre for Drugs and Drug Addiction. Risk assessment report on the new psychoactive substance 2-(methylamino)-1-(3-methylphenyl)propan-1-one (3methylmethcathinone, 3-MMC) in accordance with Article 5c of Regulation (EC) No 1920/2006 (as amended). In Risk Assessments; Publications Office of the European Union: Luxembourg, 2022. [Google Scholar]
- Reuter, P.; Pardo, B. New psychoactive substances: Are there any good options for regulating new psychoactive substances? Int. J. Drug Policy 2016, 40, 117–122. [Google Scholar] [CrossRef]
- Angoa-Pérez, M.; Anneken, J.H.; Kuhn, D.M. Neurotoxicology of synthetic cathinone analogs. Curr. Top. Behav. Neurosci. 2016, 32, 209–230. [Google Scholar] [CrossRef]
- Jurásek, B.; Čmelo, I.; Svoboda, J.; Čejka, J.; Svozil, D.; Kuchař, M. New psychoactive substances on dark web markets: From deal solicitation to forensic analysis of purchased substances. Drug Test. Anal. 2020, 13, 156–168. [Google Scholar] [CrossRef]
- Yao, B.; Yan, S.; Lian, L.; Liu, D.; Cui, J.; Song, W. Occurrence, distribution, and potential health risks of psychoactive substances in Chinese surface waters. J. Hazard. Mater. 2021, 407, 124851. [Google Scholar] [CrossRef]
- Castiglioni, S.; Salgueiro-González, N.; Bijlsma, L.; Celma, A.; Gracia-Lor, E.; Beldean-Galea, M.S.; Mackuľak, T.; Emke, E.; Heath, E.; Kasprzyk-Hordern, B.; et al. New psychoactive substances in several European populations assessed by wastewater-based epidemiology. Water Res. 2021, 195, 116983. [Google Scholar] [CrossRef]
- Bade, R.; Abbate, V.; Abdelaziz, A.; Nguyen, L.; Trobbiani, S.; Stockham, P.; Elliott, S.; White, J.M.; Gerber, C. The complexities associated with new psychoactive substances in influent wastewater: The case of 4-ethylmethcathinone. Drug Test. Anal. 2020, 12, 1494–1500. [Google Scholar] [CrossRef] [PubMed]
- Brandeburová, P.; Bodík, I.; Horáková, I.; Žabka, D.; Castiglioni, S.; Salgueiro-González, N.; Zuccato, E.; Špalková, V.; Mackuľak, T. Wastewater-based epidemiology to assess the occurrence of new psychoactive substances and alcohol consumption in Slovakia. Ecotoxicol. Environ. Saf. 2020, 200, 110762. [Google Scholar] [CrossRef]
- Bade, R.; Bijlsma, L.; Sancho, J.V.; Baz-Lomba, J.A.; Castiglioni, S.; Castrignanò, E.; Causanilles, A.; Gracia-Lor, E.; Kasprzyk-Hordern, B.; Kinyua, J.; et al. Liquid chromatography-tandem mass spectrometry determination of synthetic cathinones and phenethylamines in influent wastewater of eight European cities. Chemosphere 2017, 168, 1032–1041. [Google Scholar] [CrossRef]
- Langa, I.; Tiritan, M.E.; Silva, D.; Ribeiro, C. Gas Chromatography Multiresidue Method for Enantiomeric Fraction Determination of Psychoactive Substances in Effluents and River Surface Waters. Chemosensors 2021, 9, 224. [Google Scholar] [CrossRef]
- Souders, C., II; Davis, R.H.; Qing, H.; Liang, X.; Febo, M.; Martyniuk, C.J. The psychoactive cathinone derivative pyrovalerone alters locomotor activity and decreases dopamine receptor expression in zebrafish (Danio rerio). Brain Behav. 2019, 9, e01420. [Google Scholar] [CrossRef] [PubMed]
- De Felice, B.; Mondellini, S.; Salgueiro-González, N.; Castiglioni, S.; Parolini, M. Methamphetamine exposure modulated oxidative status and altered the reproductive output in Daphnia magna. Sci. Total Environ. 2020, 721, 137728. [Google Scholar] [CrossRef] [PubMed]
- Pérez-Pereira, A.; Ribeiro, C.; Teles, F.; Gonçalves, R.; Gonçalves, V.M.; Pereira, J.A.; Carrola, J.S.; Pires, C.A.; Tiritan, M.E. Ketamine and Norketamine: Enantioresolution and Enantioselective Aquatic Ecotoxicity Studies. Environ. Toxicol. Chem. 2020, 41, 569–579. [Google Scholar] [CrossRef]
- Kuropka, P.; Zawadzki, M.; Szpot, P. A review of synthetic cathinones emerging in recent years (2019–2022). Forensic Toxicol. 2022, 41, 25–46. [Google Scholar] [CrossRef]
- UNODC. World Drug Report 2022; United Nations Publication: Vienna, Austria, 2022. [Google Scholar]
- European Monitoring Centre for Drugs and Drug Addiction. European Drug Report 2021: Trends and Developments; Publications Office of the European Union: Luxembourg, 2021. [Google Scholar]
- Maurya, R.; Pandey, A.K. Importance of protozoa Tetrahymena in toxicological studies: A review. Sci. Total Environ. 2020, 741, 140058. [Google Scholar] [CrossRef]
- Bownik, A. Daphnia swimming behaviour as a biomarker in toxicity assessment: A review. Sci. Total Environ. 2017, 601–602, 194–205. [Google Scholar] [CrossRef]
- Ebert, D. Ecology, Epidemiology, and Evolution of Parasitism in Daphnia; National Center for Biotechnology Information: Bethesda, MD, USA, 2005.
- Castro, B.B.; Freches, A.R.; Rodrigues, M.; Nunes, B.; Antunes, S.C. Transgenerational Effects of Toxicants: An Extension of the Daphnia 21-day Chronic Assay? Arch. Environ. Contam. Toxicol. 2018, 74, 616–626. [Google Scholar] [CrossRef] [PubMed]
- OECD. Test No. 211: Daphnia magna reproduction test. In OECD Guidelines for Testing of Chemicals; OECD: Paris, France, 2012. [Google Scholar]
- OECD. Test No. 244: Protozoan activated sludge inhibition test. In OECD Guidelines for the Testing of Chemicals; OECD: Paris, France, 2017. [Google Scholar]
- Almeida, A.; Silva, B.; Pinho, P.; Remião, F.; Fernandes, C. Synthetic cathinones: Recent developments, enantioselectivity studies and enantioseparation methods. Molecules 2022, 27, 2057. [Google Scholar] [CrossRef] [PubMed]
- Toma, C.; Cappelli, C.I.; Manganaro, A.; Lombardo, A.; Arning, J.; Benfenati, E. New Models to Predict the Acute and Chronic Toxicities of Representative Species of the Main Trophic Levels of Aquatic Environments. Molecules 2021, 26, 6983. [Google Scholar] [CrossRef]
- Zhou, L.; Fan, D.; Yin, W.; Gu, W.; Wang, Z.; Liu, J.; Xu, Y.; Shi, L.; Liu, M.; Ji, G. Comparison of seven in silico tools for evaluating of daphnia and fish acute toxicity: Case study on Chinese Priority Controlled Chemicals and new chemicals. BMC Bioinform. 2021, 22, 151. [Google Scholar] [CrossRef]
- OECD. OECD Guidelines for the testing of chemicals bioaccumulation in sediment-dwelling benthic oligochaetes. In OECD Guideline; OECD: Paris, France, 2008; p. 315. [Google Scholar]
- U.S. EPA. Partition coefficient CG-1400. In Chemical Fate Test Guidelines; EPA 560/6-82-003; National Technical Information Services: Springfield, VA, USA, 1982. [Google Scholar]
- European Parliament and Council. Regulation (EC) No 1907/2006 of the European Parliament and of the Council of 18 December 2006 Concerning the Registration E., Authorisation and Restriction of Chemicals (REACH), Establishing a European Chemicals Agency, Amending Directive 1999/45/EC and Repealing Council Regulation (EEC) No 793/93 and Commission Regulation (EC) No 1488/94 as Well as Council Directive 76/769/EEC and Commission Directives 91/155/EEC, 93/67/EEC, 93/105/EC and 2000/21/EC. OJ L 396; Official Journal of the European Union, European Union: Brussels, Belgium, 2006; pp. 1–849. [Google Scholar]
- Rim, K. In silico prediction of toxicity and its applications for chemicals at work. Toxicol. Environ. Heal. Sci. 2020, 12, 191–202. [Google Scholar] [CrossRef] [PubMed]
- Massarsky, A.; Donnell, M.T.; de Gandiaga, E.; Kozal, J.S.; Garnick, L.; Kubitz, J.A.; Bartell, S.M.; Monnot, A.D. Critical evaluation of ECOSAR and E-FAST platforms to predict ecological risks of PFAS. Environ. Adv. 2022, 8, 100221. [Google Scholar] [CrossRef]
- Bade, R.; White, J.M.; Nguyen, L.; Tscharke, B.J.; Mueller, J.F.; O′Brien, J.W.; Thomas, K.V.; Gerber, C. Determining changes in new psychoactive substance use in Australia by wastewater analysis. Sci. Total Environ. 2020, 731, 139209. [Google Scholar] [CrossRef]
- Bade, R.; Eaglesham, G.; Shimko, K.M.; Mueller, J. Quantification of new psychoactive substances in Australian wastewater utilising direct injection liquid chromatography coupled to tandem mass spectrometry. Talanta 2023, 251, 123767. [Google Scholar] [CrossRef]
- Luan, F.; Wang, T.; Tang, L.; Zhang, S.; Cordeiro, M.N.D.S. Estimation of the Toxicity of Different Substituted Aromatic Compounds to the Aquatic Ciliate Tetrahymena pyriformis by QSAR Approach. Molecules 2018, 23, 1002. [Google Scholar] [CrossRef]
- Mennillo, E.; Arukwe, A.; Monni, G.; Meucci, V.; Intorre, L.; Pretti, C. Ecotoxicological properties of ketoprofen and the S(+)-enantiomer (dexketoprofen): Bioassays in freshwater model species and biomarkers in fish PLHC-1 cell line. Environ. Toxicol. Chem. 2017, 37, 201–212. [Google Scholar] [CrossRef]
- Jeong, T.-Y.; Yoon, D.; Kim, S.; Kim, H.Y.; Kim, S.D. Mode of action characterization for adverse effect of propranolol in Daphnia magna based on behavior and physiology monitoring and metabolite profiling. Environ. Pollut. 2018, 233, 99–108. [Google Scholar] [CrossRef]
- Szabelak, A.; Bownik, A. Behavioral and physiological responses of Daphnia magna to salicylic acid. Chemosphere 2020, 270, 128660. [Google Scholar] [CrossRef] [PubMed]
- Bownik, A.; Ślaska, B.; Dudka, J. Cisplatin affects locomotor activity and physiological endpoints of Daphnia magna. J. Hazard. Mater. 2019, 384, 121259. [Google Scholar] [CrossRef] [PubMed]
- Bownik, A.; Stępniewska, Z. Protective effects of ectoine on behavioral, physiological and biochemical parameters of Daphnia magna subjected to hydrogen peroxide. Comp. Biochem. Physiol. Part C Toxicol. Pharmacol. 2015, 170, 38–49. [Google Scholar] [CrossRef]
- De Felice, B.; Salgueiro-González, N.; Castiglioni, S.; Saino, N.; Parolini, M. Biochemical and behavioral effects induced by cocaine exposure to Daphnia magna. Sci. Total Environ. 2019, 689, 141–148. [Google Scholar] [CrossRef] [PubMed]
- Parolini, M.; De Felice, B.; Ferrario, C.; Salgueiro-González, N.; Castiglioni, S.; Finizio, A.; Tremolada, P. Benzoylecgonine exposure induced oxidative stress and altered swimming behavior and reproduction in Daphnia magna. Environ. Pollut. 2017, 232, 236–244. [Google Scholar] [CrossRef]
- Duan, S.; Fu, Y.; Dong, S.; Ma, Y.; Meng, H.; Guo, R.; Chen, J.; Liu, Y.; Li, Y. Psychoactive drugs citalopram and mirtazapine caused oxidative stress and damage of feeding behavior in Daphnia magna. Ecotoxicol. Environ. Saf. 2021, 230, 113147. [Google Scholar] [CrossRef]
- US EPA. Estimation Programs Interface Suite™ for Microsoft® Windows v 4.11; US EPA: Washington, DC, USA, 2012.
- Chelcea, I.; Örn, S.; Hamers, T.; Koekkoek, J.; Legradi, J.; Vogs, C.; Andersson, P.L. Physiologically Based Toxicokinetic Modeling of Bisphenols in Zebrafish (Danio rerio) Accounting for Variations in Metabolic Rates, Brain Distribution, and Liver Accumulation. Environ. Sci. Technol. 2022, 56, 10216–10228. [Google Scholar] [CrossRef]
- Roveri, V.; Guimarães, L.L.; Toma, W.; Correia, A.T. Occurrence, ecological risk assessment and prioritization of pharmaceuticals and abuse drugs in estuarine waters along the São Paulo coast, Brazil. Environ. Sci. Pollut. Res. 2022, 29, 89712–89726. [Google Scholar] [CrossRef]
- Blázquez, M.; Andreu-Sánchez, O.; Ranero, I.; Fernández-Cruz, M.L.; Benfenati, E. Comparing in vivo data and in silico predictions for acute effects assessment of biocidal active substances and metabolites for aquatic organisms. Ecotoxicol. Environ. Saf. 2020, 205, 111291. [Google Scholar] [CrossRef]
- Meylan, W.M.; Howard, P.H. Atom/Fragment Contribution Method for Estimating Octanol–Water Partition Coefficients. J. Pharm. Sci. 1995, 84, 83–92. [Google Scholar] [CrossRef]
- Meylan, W.M.; Howard, P.H. Upgrade of PCGEMS Water Solubility Estimation Method (May 1994 Draft); Robert, S.B., Ed.; U.S. Environmental Protection Agency, Office of Pollution Prevention and Toxics: Washington, DC, USA; Syracuse Research Corporation, Environmental Science Center: Syracuse, NY, USA, 1994.
- Meylan, W.M.; Howard, P.H. Validation of Water Solubility Estimation Methods Using Log Kow for Application in PCGEMS & EPI (September 1994 Final Report); Robert, S.B., Ed.; U.S. Environmental Protection Agency, Office of Pollution Prevention and Toxics: Washington, DC, USA; Syracuse Research Corporation, Environmental Science Center: Syracuse, NY, USA, 1994.
- Meylan, W.M.; Howard, P.H.; Boethling, R.S. Improved method for estimating water solubility from octanol/water partition coefficient. Environ. Toxicol. Chem. 1996, 15, 100–106. [Google Scholar] [CrossRef]
- Arnot, J.; Gobas, F. A review of bioconcentration factor (BCF) and bioaccumulation factor (BAF) assessments for organic chemicals in aquatic organisms. Environ Rev 2006, 14, 257–297. [Google Scholar] [CrossRef]
- CCTE; EPA. Toxicity Estimation Software Tool (TEST); The United States Environmental Protection Agency’s Center for Computational Toxicology and Exposure: Durham, NC, USA, 2022. [CrossRef]
- OECD. Test No. 201: OECD Guidelines for testing of chemicals. In Freshwater Alga and Cyanobacteria, Growth Inhibition Test; OECD: Paris, France, 2011. [Google Scholar]
- Félix, L.M.; Serafim, C.; Martins, M.J.; Valentim, A.M.; Antunes, L.M.; Matos, M.; Coimbra, A.M. Morphological and behavioral responses of zebrafish after 24 h of ketamine embryonic exposure. Toxicol. Appl. Pharmacol. 2017, 321, 27–36. [Google Scholar] [CrossRef] [PubMed]
- Félix, L.M.; Antunes, L.M.; Coimbra, A.M. Ketamine NMDA receptor-independent toxicity during zebrafish (Danio rerio) embryonic development. Neurotoxicology Teratol. 2014, 41, 27–34. [Google Scholar] [CrossRef] [PubMed]
- Masteling, R.; Castro, B.; Antunes, S.; Nunes, B. Whole-organism and biomarker endpoints in Daphnia magna show uncoupling of oxidative stress and endocrine disruption in phenolic derivatives. Ecotoxicol. Environ. Saf. 2016, 134, 64–71. [Google Scholar] [CrossRef] [PubMed]
- Bownik, A.; Stepniewska, Z.; Skowronski, T. Protective effects of ectoine on heat-stressed Daphnia magna. J. Comp. Physiol. B 2014, 184, 961–976. [Google Scholar] [CrossRef]
- Bradford, M. A rapid and sensitive method for the quantitation of microgram quantities of protein utilizing the principle of protein-dye binding. Anal. Biochem. 1976, 72, 248–254. [Google Scholar] [CrossRef]
- Ding, J.; Zou, H.; Liu, Q.; Zhang, S.; Razanajatovo, R. Bioconcentration of the antidepressant fluoxetine and its effects on the physiological and biochemical status in Daphnia magna. Ecotoxicol. Environ. Saf. 2017, 142, 102–109. [Google Scholar] [CrossRef]
- Góth, L. A simple method for determination of serum catalase activity and revision of reference range. Clin. Chim. Acta 1991, 196, 143–152. [Google Scholar] [CrossRef]
- Deng, J.; Yu, L.; Liu, C.; Yu, K.; Shi, X.; Yeung, L.; Lam, P.; Wu, R.; Zhou, B. Hexabromocyclododecane-induced developmental toxicity and apoptosis in zebrafish embryos. Aquat. Toxicol. 2009, 93, 29–36. [Google Scholar] [CrossRef] [PubMed]
- Buege, J.; Aust, S. Microsomal lipid peroxidation. Microsomal Electron. Trans. CYT P-450 1978, 30, 302–306. [Google Scholar]
- Ohkawa, H.; Ohishi, N.; Yagi, K. Assay for lipid peroxides in animal tissues by thiobarbituric acid reaction. Anal. Biochem. 1979, 95, 351–358. [Google Scholar] [CrossRef] [PubMed]
- Jemec, A.; Drobne, D.; Tišler, T.; Trebše, P.; Roš, M.; Sepčić, K. The applicability of acetylcholinesterase and glutathione S-transferase in Daphnia magna toxicity test. Comp. Biochem. Physiol. C Toxicol. Pharmacol. 2007, 144, 303–309. [Google Scholar] [CrossRef] [PubMed]
- Verhoeven, K.J.; Simonsen, K.L.; McIntyre, L.M. Implementing false discovery rate control: Increasing your power. Oikos 2005, 108, 643–647. [Google Scholar] [CrossRef]
- Benjamini, Y.; Hochberg, Y. Controlling the False Discovery Rate: A Practical and Powerful Approach to Multiple Testing. J. R. Stat. Soc. Ser. B Methodol. 1995, 57, 289–300. [Google Scholar] [CrossRef]
- R Core Team. R: A Language and Environment for Statistical Computing; R Foundation for Statistical Computing: Vienna, Austria, 2022; Available online: https://www.R-project.org/ (accessed on 1 March 2023).
- The Jamovi Project. Jamovi. (Version 2.2) [Computer Software]. 2021. Available online: https://www.jamovi.org (accessed on 1 March 2023).
- R Core Team. R: A Language and Environment for Statistical Computing. (Version 4.0) [Computer Software]. R Packages Retrieved from MRAN Snapshot 2021-04-01. 2021. Available online: https://cran.r-project.org (accessed on 1 March 2023).
- Gallucci, M. GAMLj: General Analyses for Linear Models. [Jamovi Module]. 2019. Available online: https://gamlj.github.io/ (accessed on 1 March 2023).


| SC | EPI SuiteTM Program | TESTTM Program | |||||||||
|---|---|---|---|---|---|---|---|---|---|---|---|
| Mr (g mol−1) | WSKOWWINTM | KOWWINTM | ECOSARTM | BCFBAFTM | |||||||
| WSol (mg L−1 at 25 °C) | Log KOW | Organism | Duration and Test | Predicted (mg L−1) | Estimated BCF 1 (L Kg−1 wet wt−1) | Estimated BAF 1 (L Kg−1 wet wt−1) | Estimated BCF 2 (L Kg−1 wet wt−1) | Estimated BAF 2 (L Kg−1 wet wt−1) | Predicted 48 h IGC50 (mg L−1) | ||
| CATH | 149.19 | 51,470.00 | 1.38 | Fish Daphnia Green algae | 96 h/LC50 48 h/LC50 96 h/EC50 | 73.014 8.100 7.705 | 2.947 (UT) 2.407 (MT) 2.257 (LT) | 2.947(UT) 2.407 (MT) 2.257 (LT) | 3.469 (UT) | 3.510 (UT) | 148.21 |
| Fish Daphnia Green algae | ChV ChV ChV | 5.292 0.620 2.429 | |||||||||
| BTL | 221.26 | 3076.00 | 2.40 | Fish Daphnia Green algae | 96 h/LC50 48 h/LC50 96 h/EC50 | 23.181 2.895 2.178 | 25.650 (UT) 17.490 (MT) 15.520 (LT) | 25.660 (UT) 17.500 (MT) 15.530 (LT) | 27.780 (UT) | 28.980 (UT) | 51.80 |
| Fish Daphnia Green algae | ChV ChV ChV | 1.171 0.249 0.748 | |||||||||
| MDPV | 275.35 | 70.24 | 3.97 | Fish Daphnia Green algae | 96 h/LC50 48 h/LC50 96 h/EC50 | 2.675 0.401 0.210 | 83.320 (UT) 104.500 (MT) 110.500 (LT) | 83.320 (UT) 104.600 (MT) 111.900 (LT) | 973.500 (UT) | 2146.000 (UT) | 6.50 |
| Fish Daphnia Green algae | ChV ChV ChV | 0.077 0.041 0.082 | |||||||||
| 3,4-DMMC | 191.28 | 1515.00 | 2.94 | Fish Daphnia Green algae | 96 h/LC50 48 h/LC50 96 h/EC50 | 8.832 1.175 0.780 | 74.450 (UT) 54.140 (MT) 48.510 (LT) | 74.460 (UT) 54.170 (MT) 48.630 (LT) | 94.260 (UT) | 105.800 (UT) | 17.83 |
| Fish Daphnia Green algae | ChV ChV ChV | 0.368 0.107 0.280 | |||||||||
| 3-MMC | 177.25 | 5211.00 | 2.39 | Fish Daphnia Green algae | 96 h/LC50 48 h/LC50 96 h/EC50 | 18.731 2.338 1.761 | 25.300 (UT) 17.270 (MT) 15.320 (LT) | 25.300 (UT) 17.270 (MT) 15.340 (LT) | 27.430 (UT) | 28.610 (UT) | 39.03 |
| Fish Daphnia Green algae | ChV ChV ChV | 0.948 0.201 0.604 | |||||||||
| BPD | 177.25 | 5819.00 | 2.34 | Fish Daphnia Green algae | 96 h/LC50 48 h/LC50 96 h/EC50 | 20.393 2.529 1.930 | 20.170 (UT) 14.540 (MT) 13.040 (LT) | 20.170 (UT) 14.540 (MT) 13.050 (LT) | 24.210 (UT) | 25.150 (UT) | 47.47 |
| Fish Daphnia Green algae | ChV ChV ChV | 1.053 0.216 0.659 | |||||||||
| bk-MDEA | 221.26 | 3076.00 | 2.40 | Fish Daphnia Green algae | 96 h/LC50 48 h/LC50 96 h/EC50 | 23.181 2.895 2.178 | 25.650 (UT) 17.490 (MT) 15.520 (LT) | 25.660 (UT) 17.500 (MT) 15.530 (LT) | 27.780 (UT) | 28.980 (UT) | 51.56 |
| Fish Daphnia Green algae | ChV ChV ChV | 1.171 0.249 0.748 | |||||||||
| bk-EBDB | 235.29 | 984.30 | 2.89 | Fish Daphnia Green algae | 96 h/LC50 48 h/LC50 96 h/EC50 | 11.727 1.551 1.042 | 72.840 (UT) 50.650 (MT) 44.970 (LT) | 72.850 (UT) 50.690 (MT) 45.100 (LT) | 84.040 (UT) | 93.330 (UT) | 27.48 |
| Fish Daphnia Green algae | ChV ChV ChV | 0.498 0.141 0.373 | |||||||||
| 4-MMC | 177.25 | 5211.00 | 2.39 | Fish Daphnia Green algae | 96 h/LC50 48 h/LC50 96 h/EC50 | 18.731 2.338 1.761 | 25.300 (UT) 17.270 (MT) 15.320 (LT) | 25.300 (UT) 17.270 (MT) 15.340 (LT) | 27.430 (UT) | 28.610 (UT) | 34.76 |
| Fish Daphnia Green algae | ChV ChV ChV | 0.948 0.201 0.604 | |||||||||
| EPH | 163.22 | 17,810.00 | 1.85 | Fish Daphnia Green algae | 96 h/LC50 48 h/LC50 96 h/EC50 | 39.476 4.623 3.951 | 7.413 (UT) 5.429 (MT) 4.923 (LT) | 7.413 (UT) 5.429 (MT) 4.924 (LT) | 8.424 (UT) | 8.587 (UT) | 97.31 |
| Fish Daphnia Green algae | ChV ChV ChV | 2.426 0.373 1.295 | |||||||||
| bk-MAP | 207.23 | 9572.00 | 1.91 | Fish Daphnid Green algae | 96 h/LC50 48 h/LC50 96 h/EC50 | 45.640 5.384 4.535 | 9.078 (UT) 6.339 (MT) 5.689 (LT) | 9.078 (UT) 6.340 (MT) 5.691 (LT) | 9.577 (UT) | 9.777 (UT) | 74.66 |
| Fish Daphnia Green algae | ChV ChV ChV | 2.744 0.438 1.494 | |||||||||
| bk-EBDP | 249.31 | 313.90 | 3.38 | Fish Daphnia Green algae | 96 h/LC50 48 h/LC50 96 h/EC50 | 5.911 0.828 0.497 | 194.700 (UT) 144.200 (MT) 129.600 (LT) | 194.800 (UT) 144.600 (MT) 130.900 (LT) | 257.000 (UT) | 338.900 (UT) | 17.68 |
| Fish Daphnia Green algae | ChV ChV ChV | 0.211 0.079 0.185 | |||||||||
| bk-MBDP | 235.29 | 984.30 | 2.89 | Fish Daphnia Green algae | 96 h/LC50 48 h/LC50 96 h/EC50 | 11.727 1.551 1.042 | 72.840 (UT) 50.650 (MT) 44.970 (LT) | 72.850 (UT) 50.690 (MT) 45.100 (LT) | 84.040 (UT) | 93.330 (UT) | 25.78 |
| Fish Daphnia Green algae | ChV ChV ChV | 0.498 0.141 0.373 | |||||||||
| (S)-MTFP | 177.25 | 10,090.00 | 2.06 | Fish Daphnia Green algae | 96 h/LC50 48 h/LC50 96 h/EC50 | 31.145 3.738 3.043 | 5.591 (UT) 5.416 (MT) 5.239 (LT) | 5.591 (UT) 5.416 (MT) 5.239 (LT) | 13.140 (UT) | 13.470 (UT) | 94.97 |
| Fish Daphnia Green algae | ChV ChV ChV | 1.776 0.309 1.015 | |||||||||
| EPP | 177.25 | 5819.00 | 2.34 | Fish Daphnia Green algae | 96 h/LC50 48 h/LC50 96 h/EC50 | 20.393 2.529 1.930 | 20.170 (UT) 14.540 (MT) 13.040 (LT) | 20.170 (UT) 14.540 (MT) 13.050 (LT) | 24.210 (UT) | 25.150 (UT) | 28.95 |
| Fish Daphnia Green algae | ChV ChV ChV | 1.053 0.216 0.659 | |||||||||
| MPP | 245.37 | 39.83 | 4.46 | Fish Daphnia Green algae | 96 h/LC50 48 h/LC50 96 h/EC50 | 1.144 0.181 0.085 | 117.200 (UT) 154.200 (MT) 166.500 (LT) | 117.200 (UT) 155.000 (MT) 174.000 (LT) | 2790.000 (UT) | 13,000.000 (UT) | 4.33 |
| Fish Daphnia Green algae | ChV ChV ChV | 0.028 0.020 0.035 | |||||||||
| 4-MPBP | 231.34 | 124.80 | 3.97 | Fish Daphnia Green algae | 96 h/LC50 48 h/LC50 96 h/EC50 | 2.267 0.340 0.178 | 81.370 (UT) 102.100 (MT) 108.000 (LT) | 81.370 (UT) 102.300 (MT) 109.400 (LT) | 961.200 (UT) | 2104.000 (UT) | 6.55 |
| Fish Daphnia Green algae | ChV ChV ChV | 0.066 0.035 0.070 | |||||||||
| NPP | 281.40 | 7.25 | 5.09 | Fish Daphnia Green algae | 96 h/LC50 48 h/LC50 96 h/EC50 | 0.507 0.086 0.035 | 373.800 (UT) 497.600 (MT) 540.200 (LT) | 375.900 (UT) 535.500 (MT) 724.200 (LT) | 9086.000 (UT) | 149,800.000 (UT) | 1.11 |
| Fish Daphnia Green algae | ChV ChV ChV | 0.010 0.010 0.015 | |||||||||
| α-PVP | 231.34 | 139.40 | 3.91 | Fish Daphnia Green algae | 96 h/LC50 48 h/LC50 96 h/EC50 | 2.468 0.367 0.195 | 32.920 (UT) 43.170 (MT) 46.600 (LT) | 32.920 (UT) 43.190 (MT) 46.910 (LT) | 847.900 (UT) | 1735.000 (UT) | 6.54 |
| Fish Daphnia Green algae | ChV ChV ChV | 0.073 0.037 0.076 | |||||||||
| MDPBP | 261.32 | 221.50 | 3.48 | Fish Daphnia Green algae | 96 h/LC50 48 h/LC50 96 h/EC50 | 5.336 0.756 0.443 | 54.280 (UT) 62.650 (MT) 64.060 (LT) | 54.280 (UT) 62.670 (MT) 64.290 (LT) | 321.800 (UT) | 449.500 (UT) | 13.42 |
| Fish Daphnia Green algae | ChV ChV ChV | 0.184 0.073 0.167 | |||||||||
| TBCP | 239.75 | 140.20 | 3.85 | Fish Daphnia Green algae | 96 h/LC50 48 h/LC50 96 h/EC50 | 2.786 0.412 0.222 | 573.300 (UT) 424.800 (MT) 381.700 (LT) | 579.600 (UT) 435.800 (MT) 399.700 (LT) | 747.100 (UT) | 1435.000 (UT) | 4.61 |
| Fish Daphnia Green algae | ChV ChV ChV | 0.084 0.042 0.086 | |||||||||
| 4-MEC | 191.28 | 1692.00 | 2.89 | Fish Daphnia Green algae | 96 h/LC50 48 h/LC50 96 h/EC50 | 9.616 1.271 0.855 | 71.780 (UT) 49.950 (MT) 44.370 (LT) | 71.790 (UT) 49.990 (MT) 44.490 (LT) | 82.960 (UT) | 92.020 (UT) | 16.91 |
| Fish Daphnia Green algae | ChV ChV ChV | 0.409 0.115 0.306 | |||||||||
| 4-FMC | 181.21 | 9860.00 | 2.05 | Fish Daphnia Green algae | 96 h/LC50 48 h/LC50 96 h/EC50 | 32.366 3.880 3.166 | 12.320 (UT) 8.423 (MT) 7.509 (LT) | 12.320 (UT) 8.424 (MT) 7.514 (LT) | 12.840 (UT) | 13.160 (UT) | 54.94 |
| Fish Daphnia Green algae | ChV ChV ChV | 1.853 0.320 1.055 | |||||||||
| 3-FMC | 181.21 | 9860.00 | 2.05 | Fish Daphnia Green algae | 96 h/LC50 48 h/LC50 96 h/EC50 | 32.366 3.880 3.166 | 12.320 (UT) 8.423 (MT) 7.509 (LT) | 12.320 (UT) 8.424 (MT) 7.514 (LT) | 12.840 (UT) | 13.160 (UT) | 59.07 |
| Fish Daphnia Green algae | ChV ChV ChV | 1.853 0.320 1.055 | |||||||||
| 4-MPD | 205.30 | 546.60 | 3.38 | Fish Daphnia Green algae | 96 h/LC50 48 h/LC50 96 h/EC50 | 4.910 0.687 0.413 | 191.700 (UT) 142.100 (MT) 127.800 (LT) | 191.700 (UT) 142.500 (MT) 129.000 (LT) | 253.700 (UT) | 333.500 (UT) | 7.69 |
| Fish Daphnid Green algae | ChV ChV ChV | 0.175 0.066 0.154 | |||||||||
| MTP | 169.25 | 23,770.00 | 1.67 | Fish Daphnia Green algae | 96 h/LC50 48 h/LC50 96 h/EC50 | 53.728 6.162 5.488 | 5.364 (UT) 3.959 (MT) 3.612 (LT) | 5.364 (UT) 3.960 (MT) 3.612 (LT) | 5.871 (UT) | 5.964 (UT) | 31.57 |
| Fish Daphnia Green algae | ChV ChV ChV | 3.519 0.488 1.772 | |||||||||
| 5-PPDI | 257.38 | 14.53 | 4.89 | Fish Daphnia Green algae | 96 h/LC50 48 h/LC50 96 h/EC50 | 0.621 0.104 0.044 | 42.730 (UT) 58.090 (MT) 63.790 (LT) | 42.730 (UT) 58.400 (MT) 68.350 (LT) | 6543.000 (UT) | 71,490.000 (UT) | 5.30 |
| Fish Daphnia Green algae | ChV ChV ChV | 0.013 0.012 0.019 | |||||||||
| α-BHP | 247.38 | 20.05 | 4.79 | Fish Daphnia Green algae | 96 h/LC50 48 h/LC50 96 h/EC50 | 0.693 0.114 0.050 | 793.200 (UT) 961.100 (MT) 1001.000 (LT) | 805.400 (UT) 1047.000 (MT) 1263.000 (LT) | 5456.000 (UT) | 48,620.000 (UT) | 2.36 |
| Fish Daphnia Green algae | ChV ChV ChV | 0.015 0.013 0.021 | |||||||||
| 4-BMC | 242.12 | 1223.00 | 2.74 | Fish Daphnia Green algae | 96 h/LC50 48 h/LC50 96 h/EC50 | 15.235 1.979 1.378 | 54.330 (UT) 36.800 (MT) 32.530 (LT) | 54.330 (UT) 36.830 (MT) 32.610 (LT) | 59.250 (UT) | 64.050 (UT) | 13.81 |
| Fish Daphnia Green algae | ChV ChV ChV | 0.683 0.177 0.487 | |||||||||
| MPH | 205.30 | 610.50 | 3.32 | Fish Daphnia Green algae | 96 h/LC50 48 h/LC50 96 h/EC50 | 5.346 0.743 0.452 | 131.600 (UT) 108.600 (MT) 100.100 (LT) | 131.600 (UT) 108.700 (MT) 100.600 (LT) | 223.300 (UT) | 285.200 (UT) | 7.42 |
| Fish Daphnia Green algae | ChV ChV ChV | 0.195 0.071 0.168 | |||||||||
| 2,4-DMEC | 205.30 | 489.40 | 3.43 | Fish Daphnia Green algae | 96 h/LC50 48 h/LC50 96 h/EC50 | 4.510 0.635 0.377 | 185.100 (UT) 147.500 (MT) 134.800 (LT) | 185.200 (UT) 147.900 (MT) 136.000 (LT) | 288.300 (UT) | 391.000 (UT) | 9.64 |
| Fish Daphnia Green algae | ChV ChV ChV | 0.158 0.061 0.141 | |||||||||
| 2,4-DMMC | 191.28 | 1515.00 | 2.94 | Fish Daphnia Green algae | 96 h/LC50 48 h/LC50 96 h/EC50 | 8.832 1.175 0.780 | 74.450 (UT) 54.140 (MT) 48.510 (LT) | 74.460 (UT) 54.170 (MT) 48.630 (LT) | 94.260 (UT) | 105.800 (UT) | 17.09 |
| Fish Daphnia Green algae | ChV ChV ChV | 0.368 0.107 0.280 | |||||||||
| 3,4-DMPVP | 291.39 | 128.90 | 3.56 | Fish Daphnia Green algae | 96 h/LC50 48 h/LC50 96 h/EC50 | 5.318 0.760 0.438 | 42.960 (UT) 52.300 (MT) 54.630 (LT) | 42.960 (UT) 52.320 (MT) 54.830 (LT) | 380.800 (UT) | 559.200 (UT) | 6.16 |
| Fish Daphnia Green algae | ChV ChV ChV | 0.178 0.074 0.166 | |||||||||
| 4-BrPVP | 310.24 | 8.65 | 4.80 | Fish Daphnia Green algae | 96 h/LC50 48 h/LC50 96 h/EC50 | 0.861 0.142 0.062 | 205.000 (UT) 272.200 (MT) 295.200 (LT) | 205.200 (UT) 278.000 (MT) 333.600 (LT) | 5524.000 (UT) | 49,900.000 (UT) | 2.23 |
| Fish Daphnia Green algae | ChV ChV ChV | 0.019 0.016 0.026 | |||||||||
| 4-FPHP | 263.36 | 23.81 | 4.60 | Fish Daphnia Green algae | 96 h/LC50 48 h/LC50 96 h/EC50 | 0.987 0.159 0.072 | 201.000 (UT) 262.000 (MT) 281.800 (LT) | 201.100 (UT) 265.500 (MT) 305.000 (LT) | 3752.000 (UT) | 22,860.000 (UT) | 1.67 |
| Fish Daphnia Green algae | ChV ChV ChV | 0.023 0.018 0.030 | |||||||||
| 4-MeO-α-PHPP | 289.42 | 8.14 | 4.97 | Fish Daphnia Green algae | 96 h/LC50 48 h/LC50 96 h/EC50 | 0.618 0.104 0.043 | 191.800 (UT) 257.900 (MT) 281.300 (LT) | 192.000 (UT) 265.500 (MT) 333.900 (LT) | 7541.000 (UT) | 97,660.000 (UT) | 2.01 |
| Fish Daphnia Green algae | ChV ChV ChV | 0.013 0.012 0.018 | |||||||||
| 4-MeO-α-POP | 303.45 | 2.57 | 5.47 | Fish Daphnia Green algae | 96 h/LC50 48 h/LC50 96 h/EC50 | 0.308 0.055 0.020 | 255.800 (UT) 348.200 (MT) 382.100 (LT) | 257.400 (UT) 391.900 (MT) 640.200 (LT) | 15,020.000 (UT) | 56,8100.000 (UT) | 1.27 |
| Fish Daphnia Green algae | ChV ChV ChV | 0.005 0.007 0.009 | |||||||||
| 4-MeO-α-PVP | 261.37 | 81.19 | 3.99 | Fish Daphnia Green algae | 96 h/LC50 48 h/LC50 96 h/EC50 | 2.467 0.371 0.193 | 88.810 (UT) 111.200 (MT) 117.500 (LT) | 88.820 (UT) 111.400 (MT) 119.100 (LT) | 1016.000 (UT) | 2293.000 (UT) | 4.85 |
| Fish Daphnia Green algae | ChV ChV ChV | 0.071 0.038 0.076 | |||||||||
| BMAPN | 213.28 | 995.50 | 3.02 | Fish Daphnia Green algae | 96 h/LC50 48 h/LC50 96 h/EC50 | 8.707 1.169 0.762 | 104.300 (UT) 70.280 (MT) 62.010 (LT) | 104.300 (UT) 70.450 (MT) 62.370 (LT) | 113.400 (UT) | 130.000 (UT) | 5.85 |
| Fish Daphnia Green algae | ChV ChV ChV | 0.353 0.108 0.276 | |||||||||
| DMP | 205.30 | 1059.00 | 3.04 | Fish Daphnia Green algae | 96 h/LC50 48 h/LC50 96 h/EC50 | 8.164 1.098 0.713 | 21.390 (UT) 24.400 (MT) 24.860 (LT) | 21.390 (UT) 24.400 (MT) 24.880 (LT) | 118.000 (UT) | 135.900 (UT) | 26.52 |
| Fish Daphnia Green algae | ChV ChV ChV | 0.329 0.102 0.258 | |||||||||
| α-PPP | 219.33 | 196.30 | 3.81 | Fish Daphnia Green algae | 96 h/LC50 48 h/LC50 96 h/EC50 | 2.717 0.400 0.217 | 259.000 (UT) 249.700 (MT) 240.100 (LT) | 259.100 (UT) 250.800 (MT) 244.600 (LT) | 679.400 (UT) | 1247.000 (UT) | 5.61 |
| Fish Daphnia Green algae | ChV ChV ChV | 0.083 0.040 0.084 | |||||||||
| α-PHP | 245.37 | 44.49 | 4.40 | Fish Daphnia Green algae | 96 h/LC50 48 h/LC50 96 h/EC50 | 1.245 0.196 0.093 | 49.750 (UT) 66.710 (MT) 72.740 (LT) | 49.750 (UT) 66.840 (MT) 74.570 (LT) | 2480.000 (UT) | 10,450.000 (UT) | 4.25 |
| Fish Daphnia Green algae | ChV ChV ChV | 0.031 0.021 0.038 | |||||||||
| α-PIHP | 245.37 | 51.40 | 4.33 | Fish Daphnia Green algae | 96 h/LC50 48 h/LC50 96 h/EC50 | 1.392 0.217 0.105 | 44.290 (UT) 59.290 (MT) 64.610 (LT) | 44.290 (UT) 59.380 (MT) 65.910 (LT) | 2121.000 (UT) | 7884.000 (UT) | 5.29 |
| Fish Daphnia Green algae | ChV ChV ChV | 0.036 0.023 0.042 | |||||||||
| PTD | 191.28 | 1890.00 | 2.83 | Fish Daphnia Green algae | 96 h/LC50 48 h/LC50 96 h/EC50 | 10.469 1.374 0.937 | 53.500 (UT) 40.350 (MT) 36.450 (LT) | 53.500 (UT) 49.360 (MT) 36.510 (LT) | 73.020 (UT) | 80.130 (UT) | 19.28 |
| Fish Daphnia Green algae | ChV ChV ChV | 0.454 0.124 0.333 | |||||||||
| SC Exposure/Log Concentration | Growth Inhibition Average (%) | |||||
|---|---|---|---|---|---|---|
| 0.10 | 0.40 | 0.70 | 1.00 | 1.30 | 1.60 | |
| BPD | 17 | 20 | 23 | 23 | 18 | 15 |
| 3,4-DMMC | 11 | 7 | 4 | 9 | 8 | 17 |
| 3-MMC | −34 | −26 | −43 | −44 | −39 | −46 |
| MDPV | 31 | 27 | 24 | 36 | 23 | 25 |
| BTL | 13 | 10 | 5 | 2 | 9 | 1 |
| Variable | Day 3 | Day 8 | ||||
|---|---|---|---|---|---|---|
| d.f. | F | p | d.f. | F | p | |
| Body Size (μm) | 5, 22 | 12.3 | <0.001 | 5, 20 | 15.7 | <0.001 |
| Heart Size (μm) | 5, 22 | 6.95 | <0.001 | 5, 24 | 12.4 | <0.001 |
| Heart Area (μm2) | 5, 23 | 13.9 | <0.001 | 5, 24 | 77.8 | <0.001 |
| Heart Rate (bpm) | 5, 20 | 5.08 | 0.004 | 5, 24 | 23.6 | <0.001 |
| Variable | Day 5 | ||
|---|---|---|---|
| d.f. | F | p | |
| Swimming Speed (cm min−1) | 5, 20 | 2.04 | 0.116 |
| Total Distance Travelled (cm) | 5, 21 | 3.27 | 0.024 |
| Active Time (%) | 5, 23 | 1.56 | 0.210 |
| Variable | Day 8 | ||
|---|---|---|---|
| d.f. | χ2 | p | |
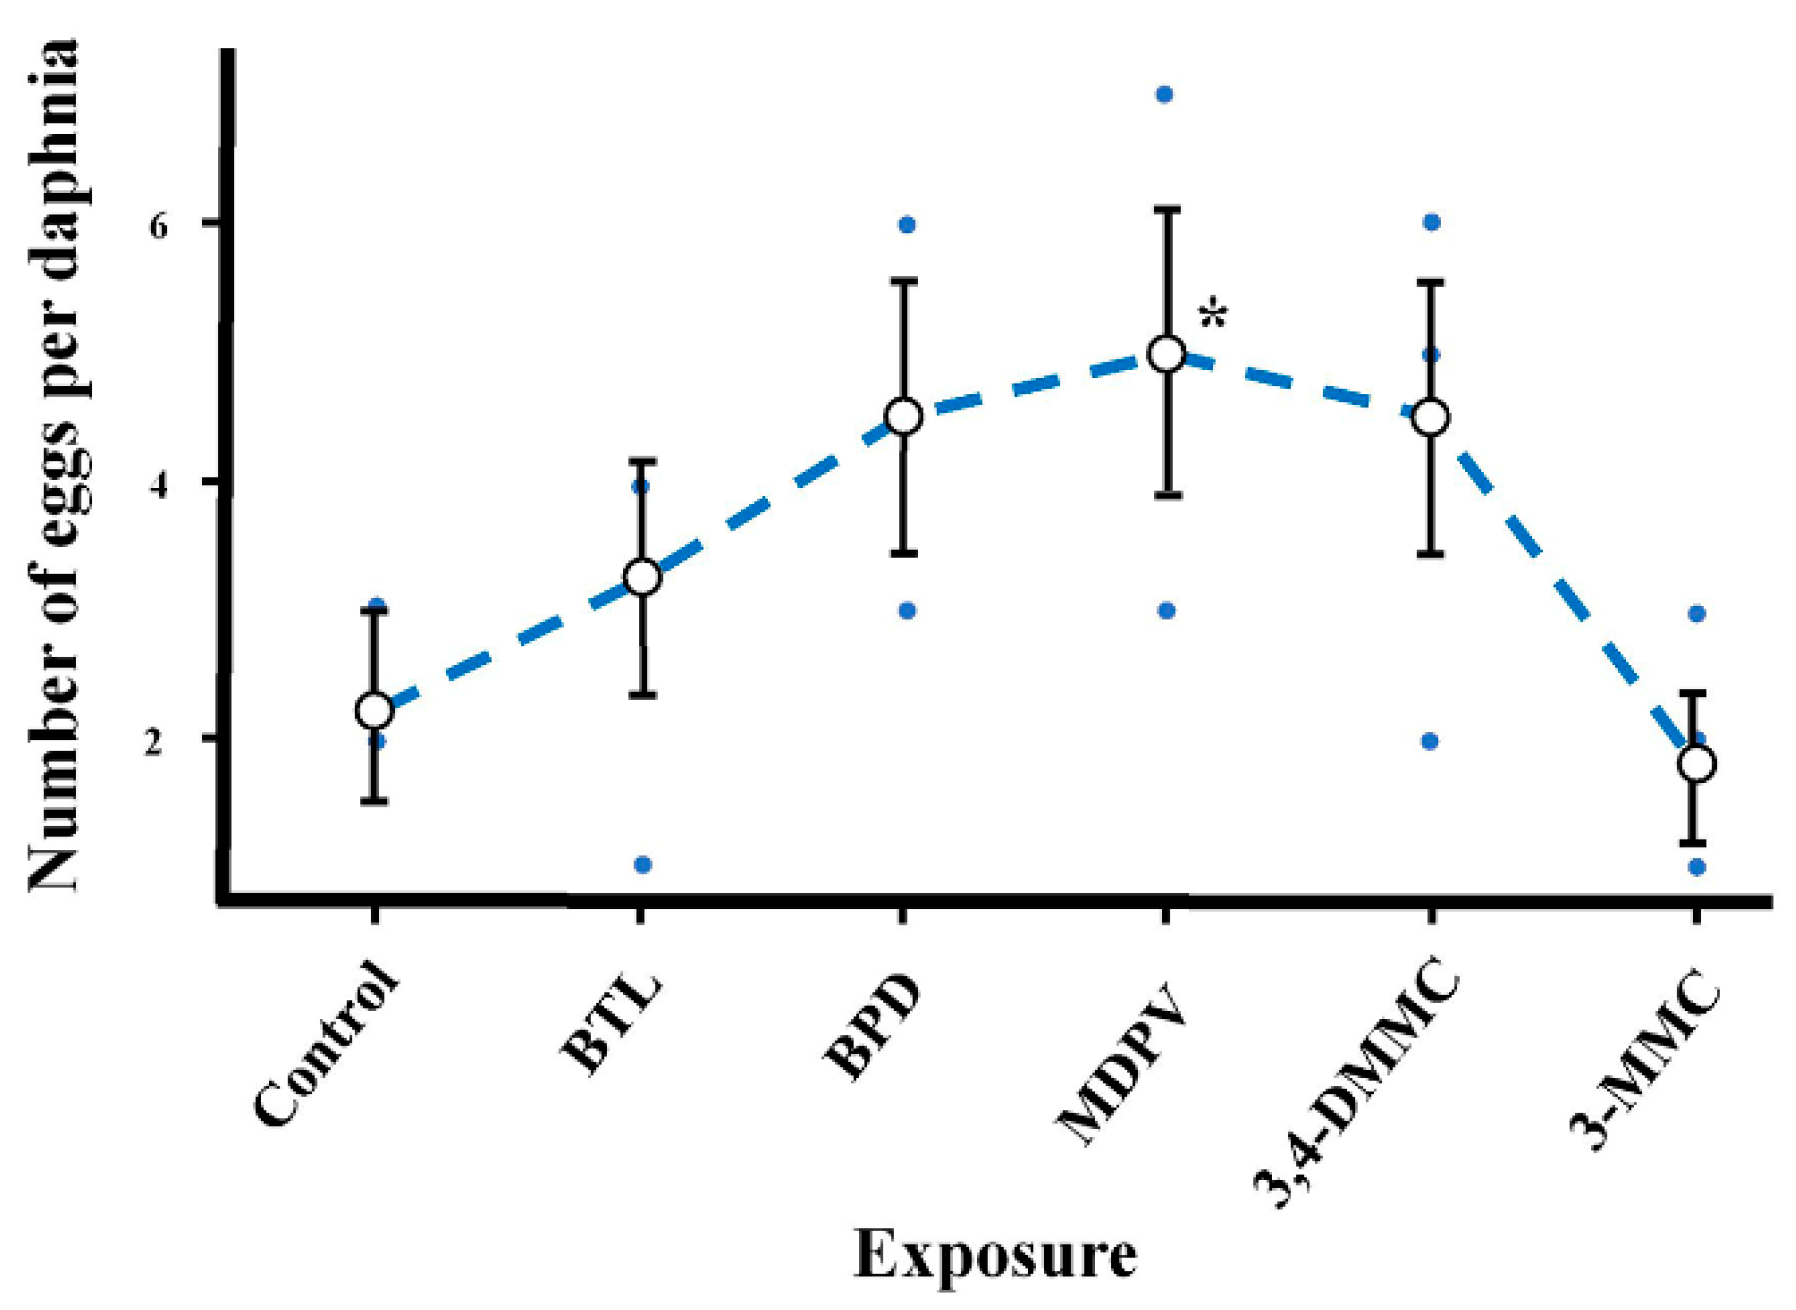
| Number of Eggs per Daphnia | 5, 19 | 11.5 | 0.042 |
| Variable | Day 8 | ||
|---|---|---|---|
| d.f. | F | p | |
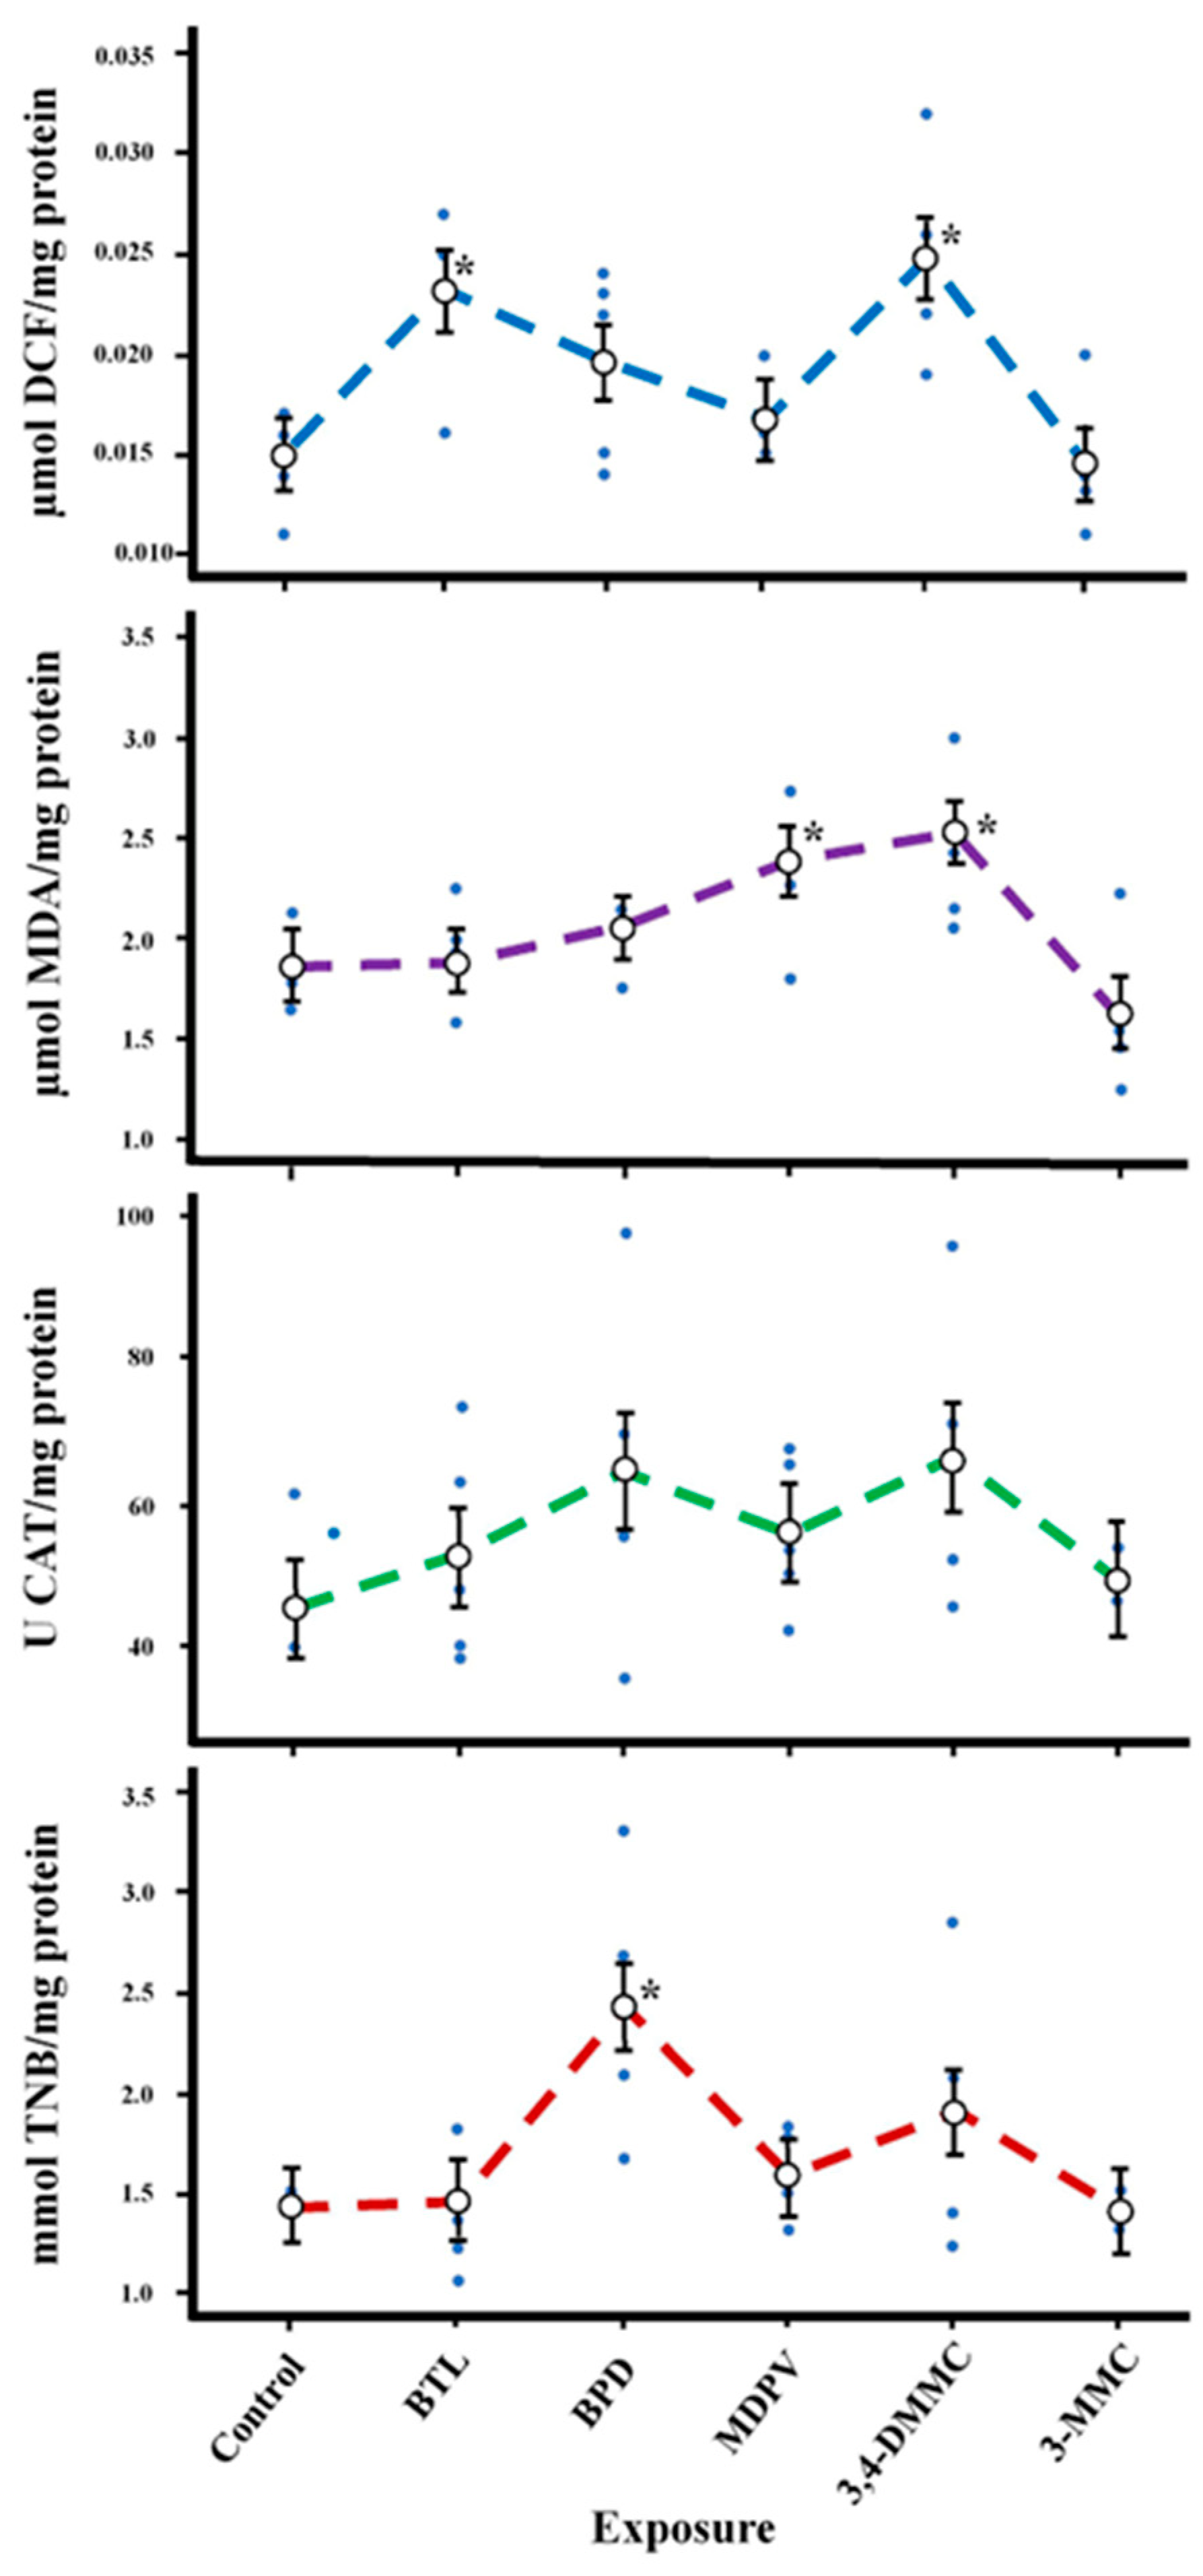
| ROS (µmol DCF mg−1 Protein) | 5, 21 | 4.91 | 0.004 |
| TBARS (µmol MDA mg−1 Protein) | 5, 21 | 4.32 | 0.007 |
| CAT (U CAT mg−1 Protein) | 5, 21 | 1.27 | 0.313 |
| AChE (mmol TNB mg−1 Protein) | 5, 21 | 3.66 | 0.015 |
Disclaimer/Publisher’s Note: The statements, opinions and data contained in all publications are solely those of the individual author(s) and contributor(s) and not of MDPI and/or the editor(s). MDPI and/or the editor(s) disclaim responsibility for any injury to people or property resulting from any ideas, methods, instructions or products referred to in the content. |
© 2023 by the authors. Licensee MDPI, Basel, Switzerland. This article is an open access article distributed under the terms and conditions of the Creative Commons Attribution (CC BY) license (https://creativecommons.org/licenses/by/4.0/).
Share and Cite
Pérez-Pereira, A.; Carvalho, A.R.; Carrola, J.S.; Tiritan, M.E.; Ribeiro, C. Integrated Approach for Synthetic Cathinone Drug Prioritization and Risk Assessment: In Silico Approach and Sub-Chronic Studies in Daphnia magna and Tetrahymena thermophila. Molecules 2023, 28, 2899. https://doi.org/10.3390/molecules28072899
Pérez-Pereira A, Carvalho AR, Carrola JS, Tiritan ME, Ribeiro C. Integrated Approach for Synthetic Cathinone Drug Prioritization and Risk Assessment: In Silico Approach and Sub-Chronic Studies in Daphnia magna and Tetrahymena thermophila. Molecules. 2023; 28(7):2899. https://doi.org/10.3390/molecules28072899
Chicago/Turabian StylePérez-Pereira, Ariana, Ana Rita Carvalho, João Soares Carrola, Maria Elizabeth Tiritan, and Cláudia Ribeiro. 2023. "Integrated Approach for Synthetic Cathinone Drug Prioritization and Risk Assessment: In Silico Approach and Sub-Chronic Studies in Daphnia magna and Tetrahymena thermophila" Molecules 28, no. 7: 2899. https://doi.org/10.3390/molecules28072899
APA StylePérez-Pereira, A., Carvalho, A. R., Carrola, J. S., Tiritan, M. E., & Ribeiro, C. (2023). Integrated Approach for Synthetic Cathinone Drug Prioritization and Risk Assessment: In Silico Approach and Sub-Chronic Studies in Daphnia magna and Tetrahymena thermophila. Molecules, 28(7), 2899. https://doi.org/10.3390/molecules28072899