
The Mechanism of Kelulut Honey in Reversing Metabolic Changes in Rats Fed with High-Carbohydrate High-Fat Diet


Abstract
1. Introduction
2. Results
2.1. Liquid Chromatography-Mass Spectrometry (LC-MS) Analysis of Kelulut Honey
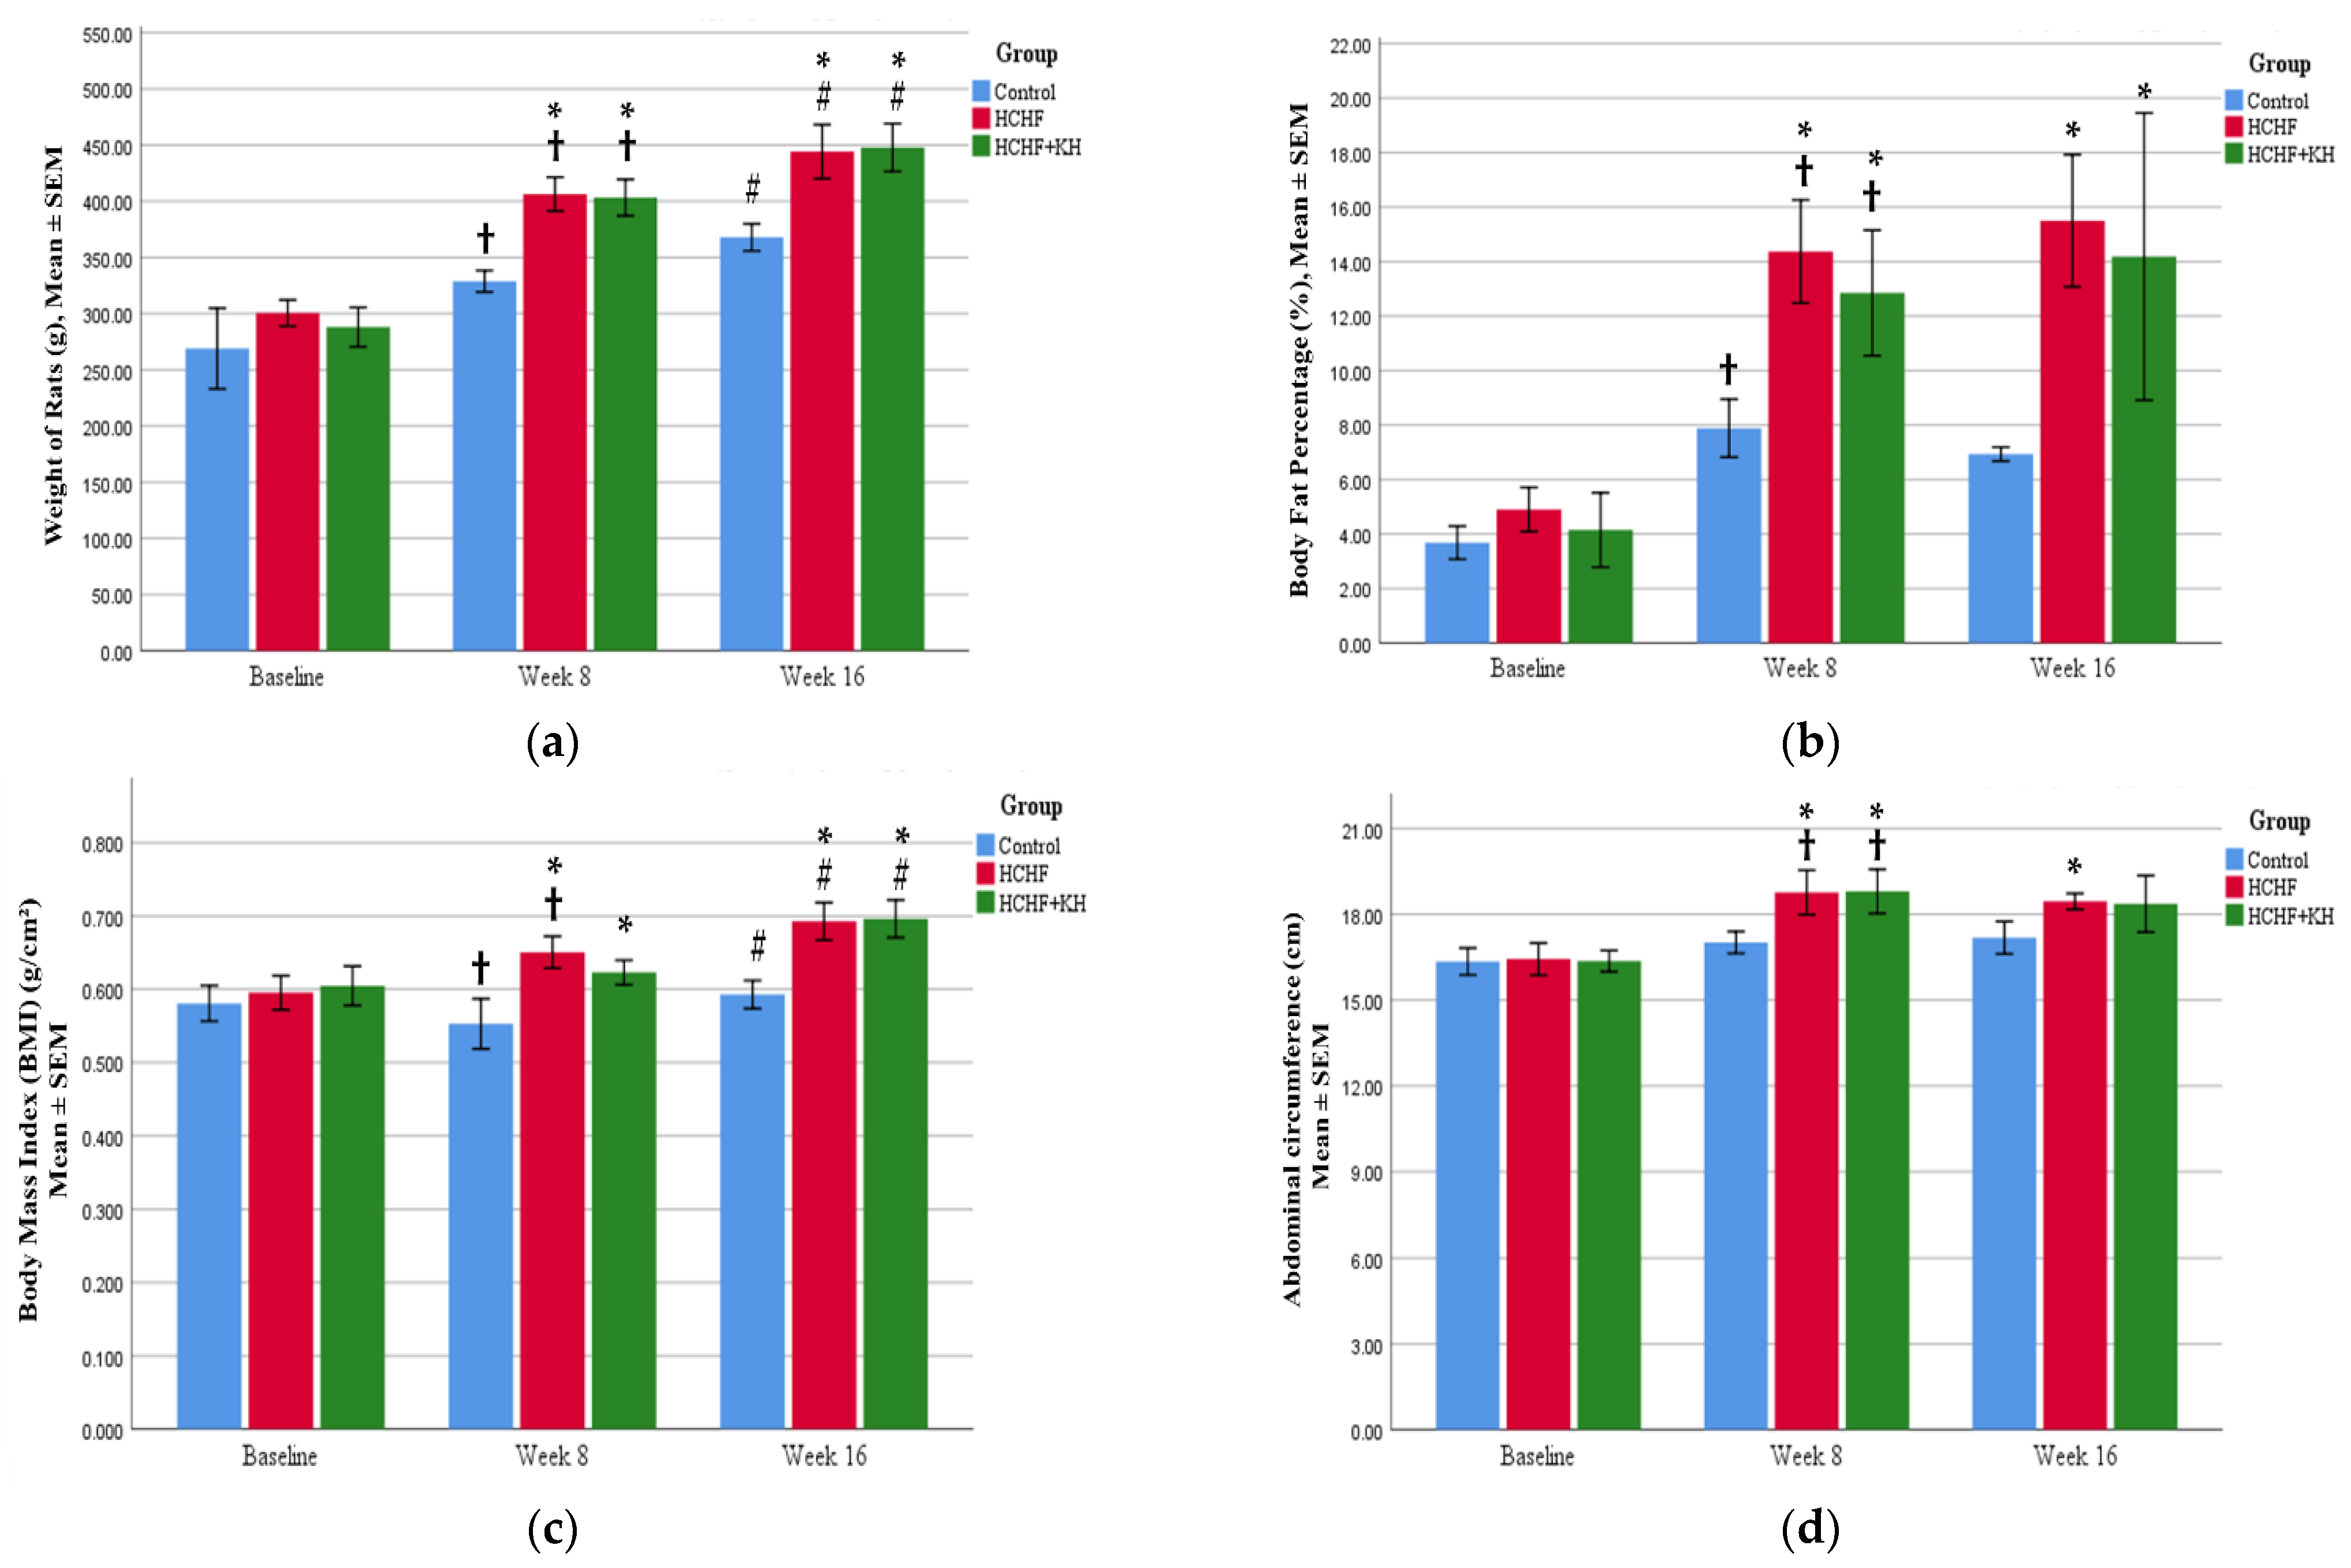
2.2. Changes in Weight, Waist Circumference, BMI and Fat Percentage
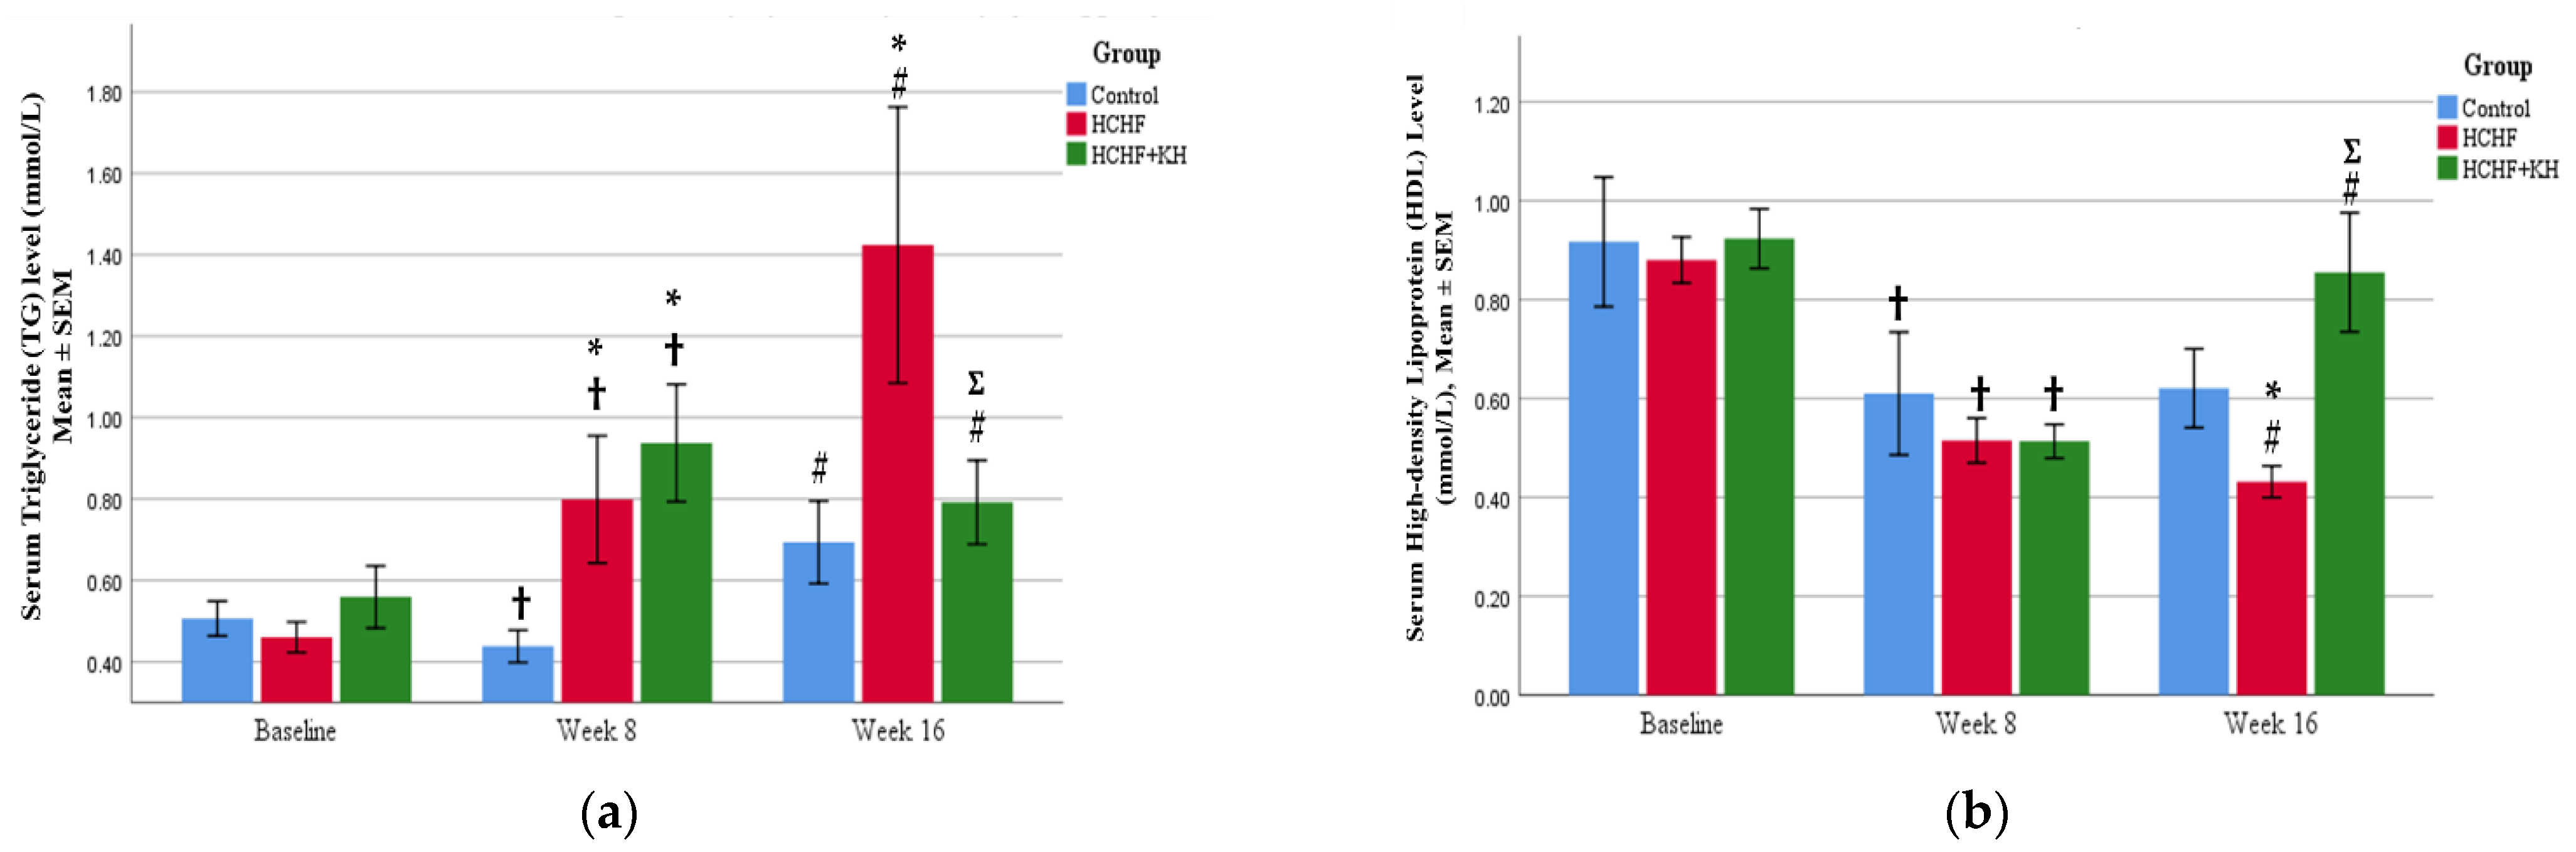
2.3. Serum TG and HDL
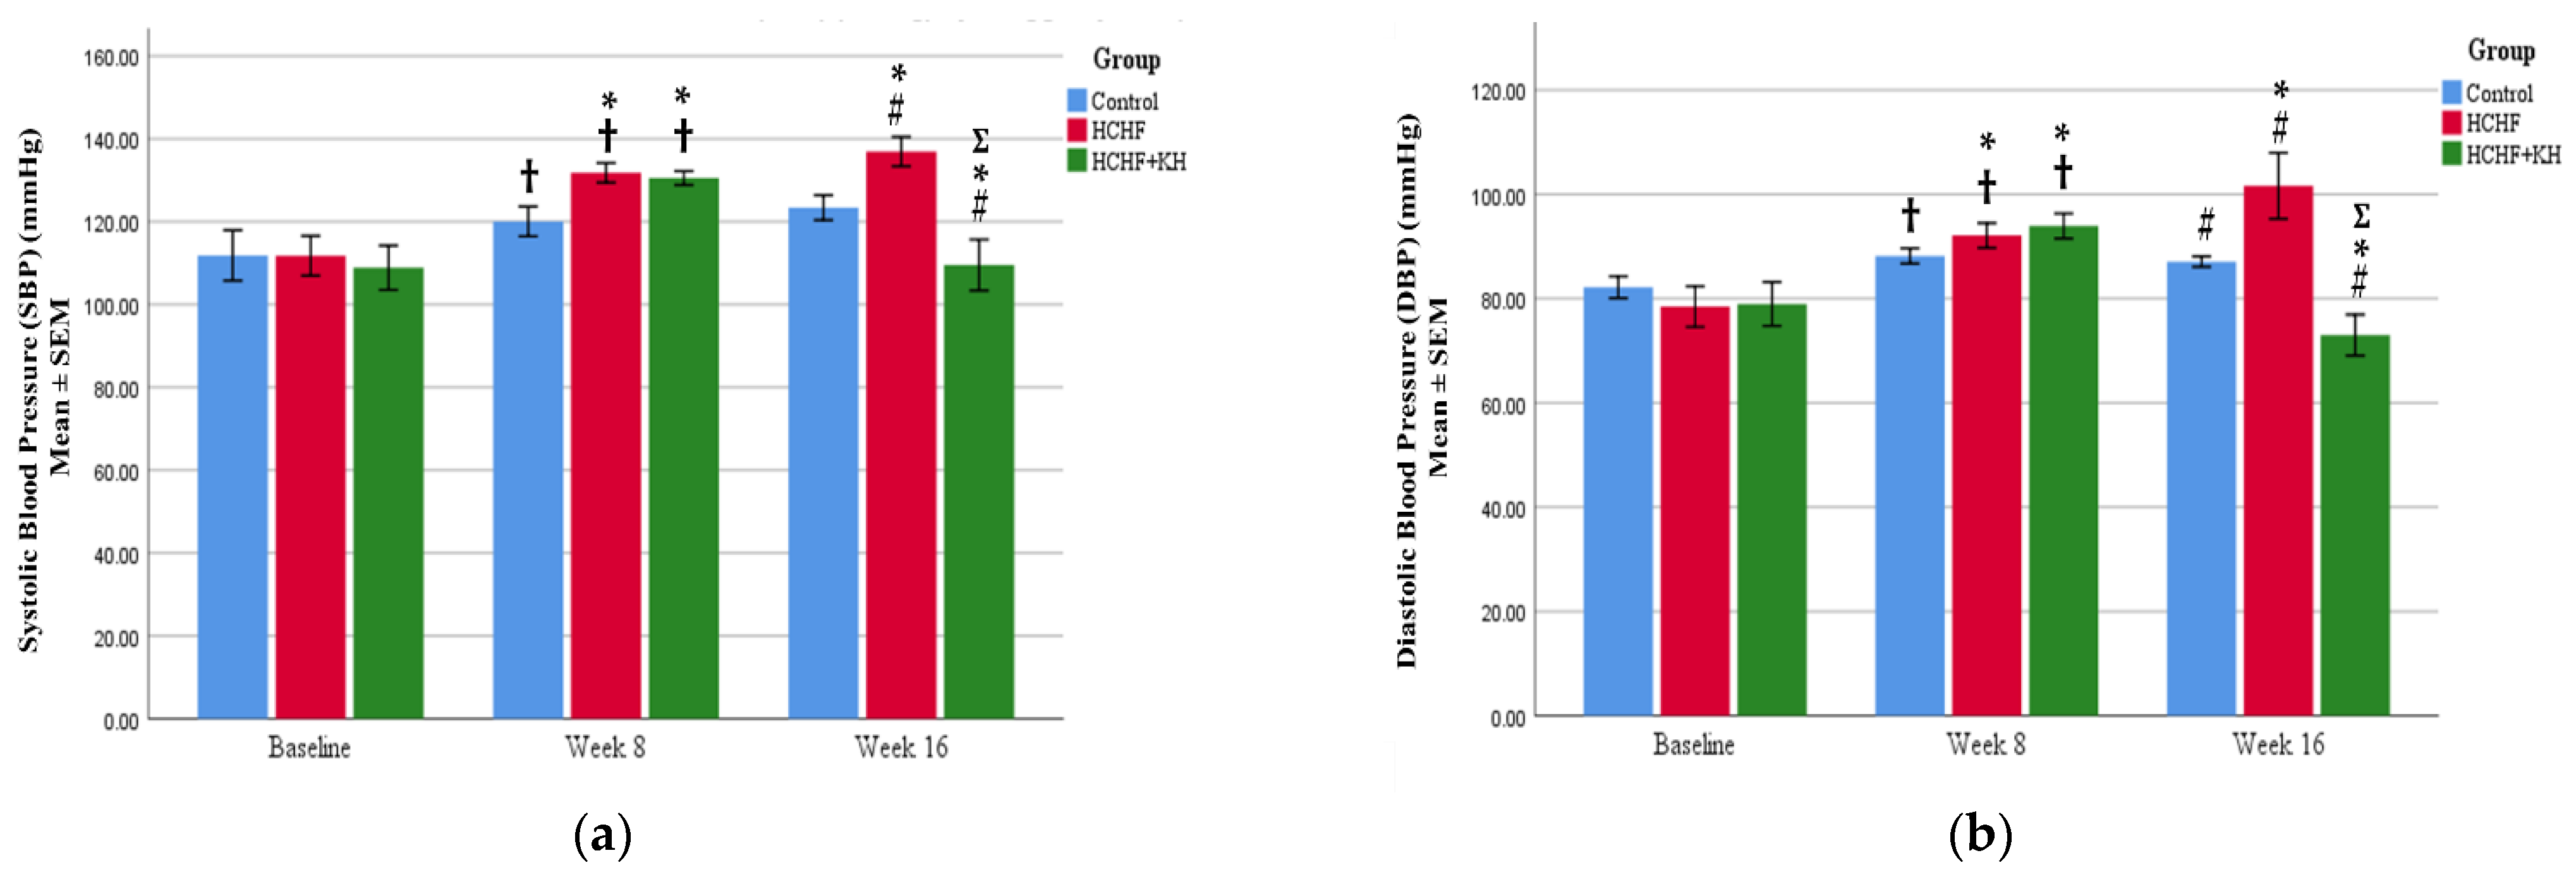
2.4. Systolic and Diastolic Blood Pressure
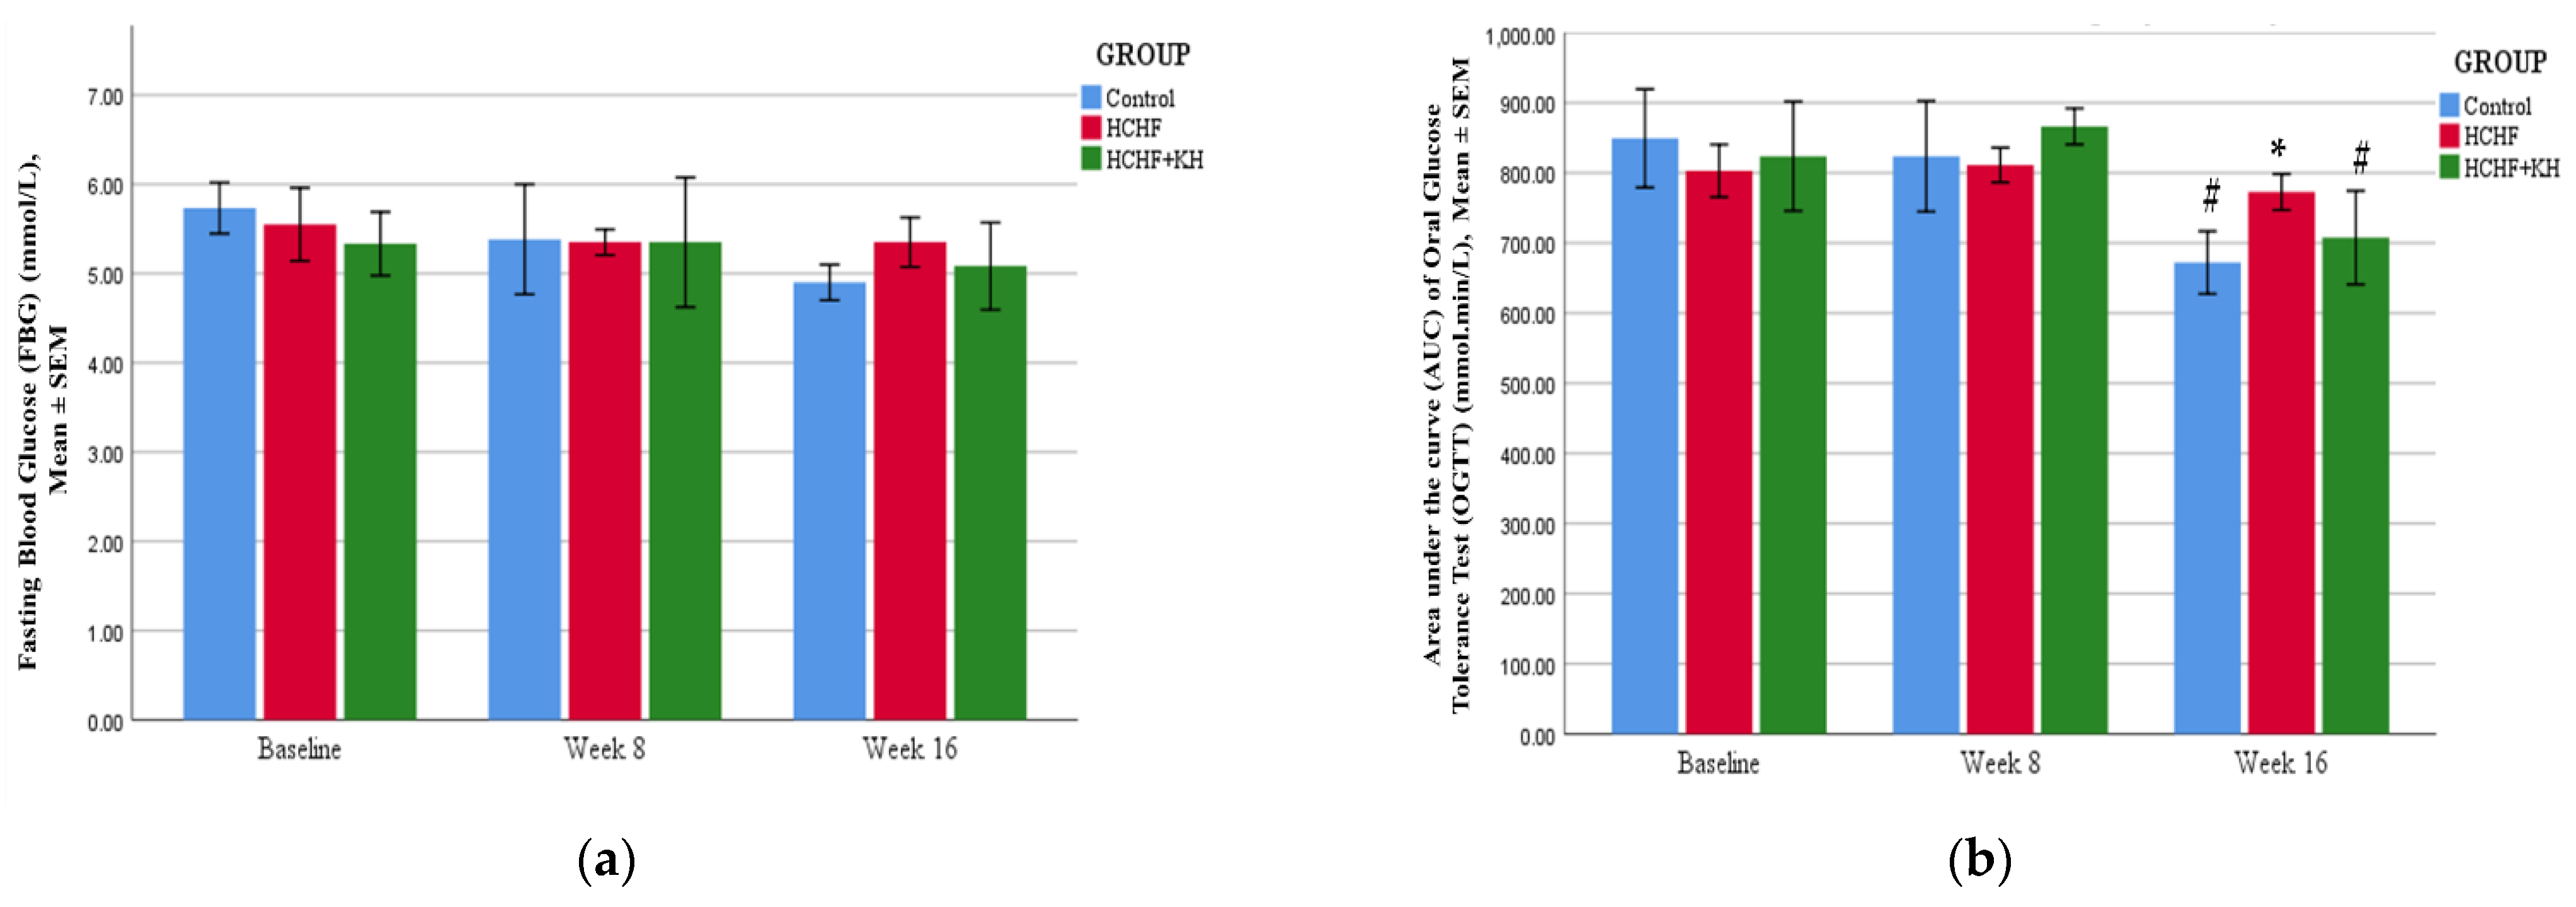
2.5. Fasting Blood Glucose and Oral Glucose Tolerance Test
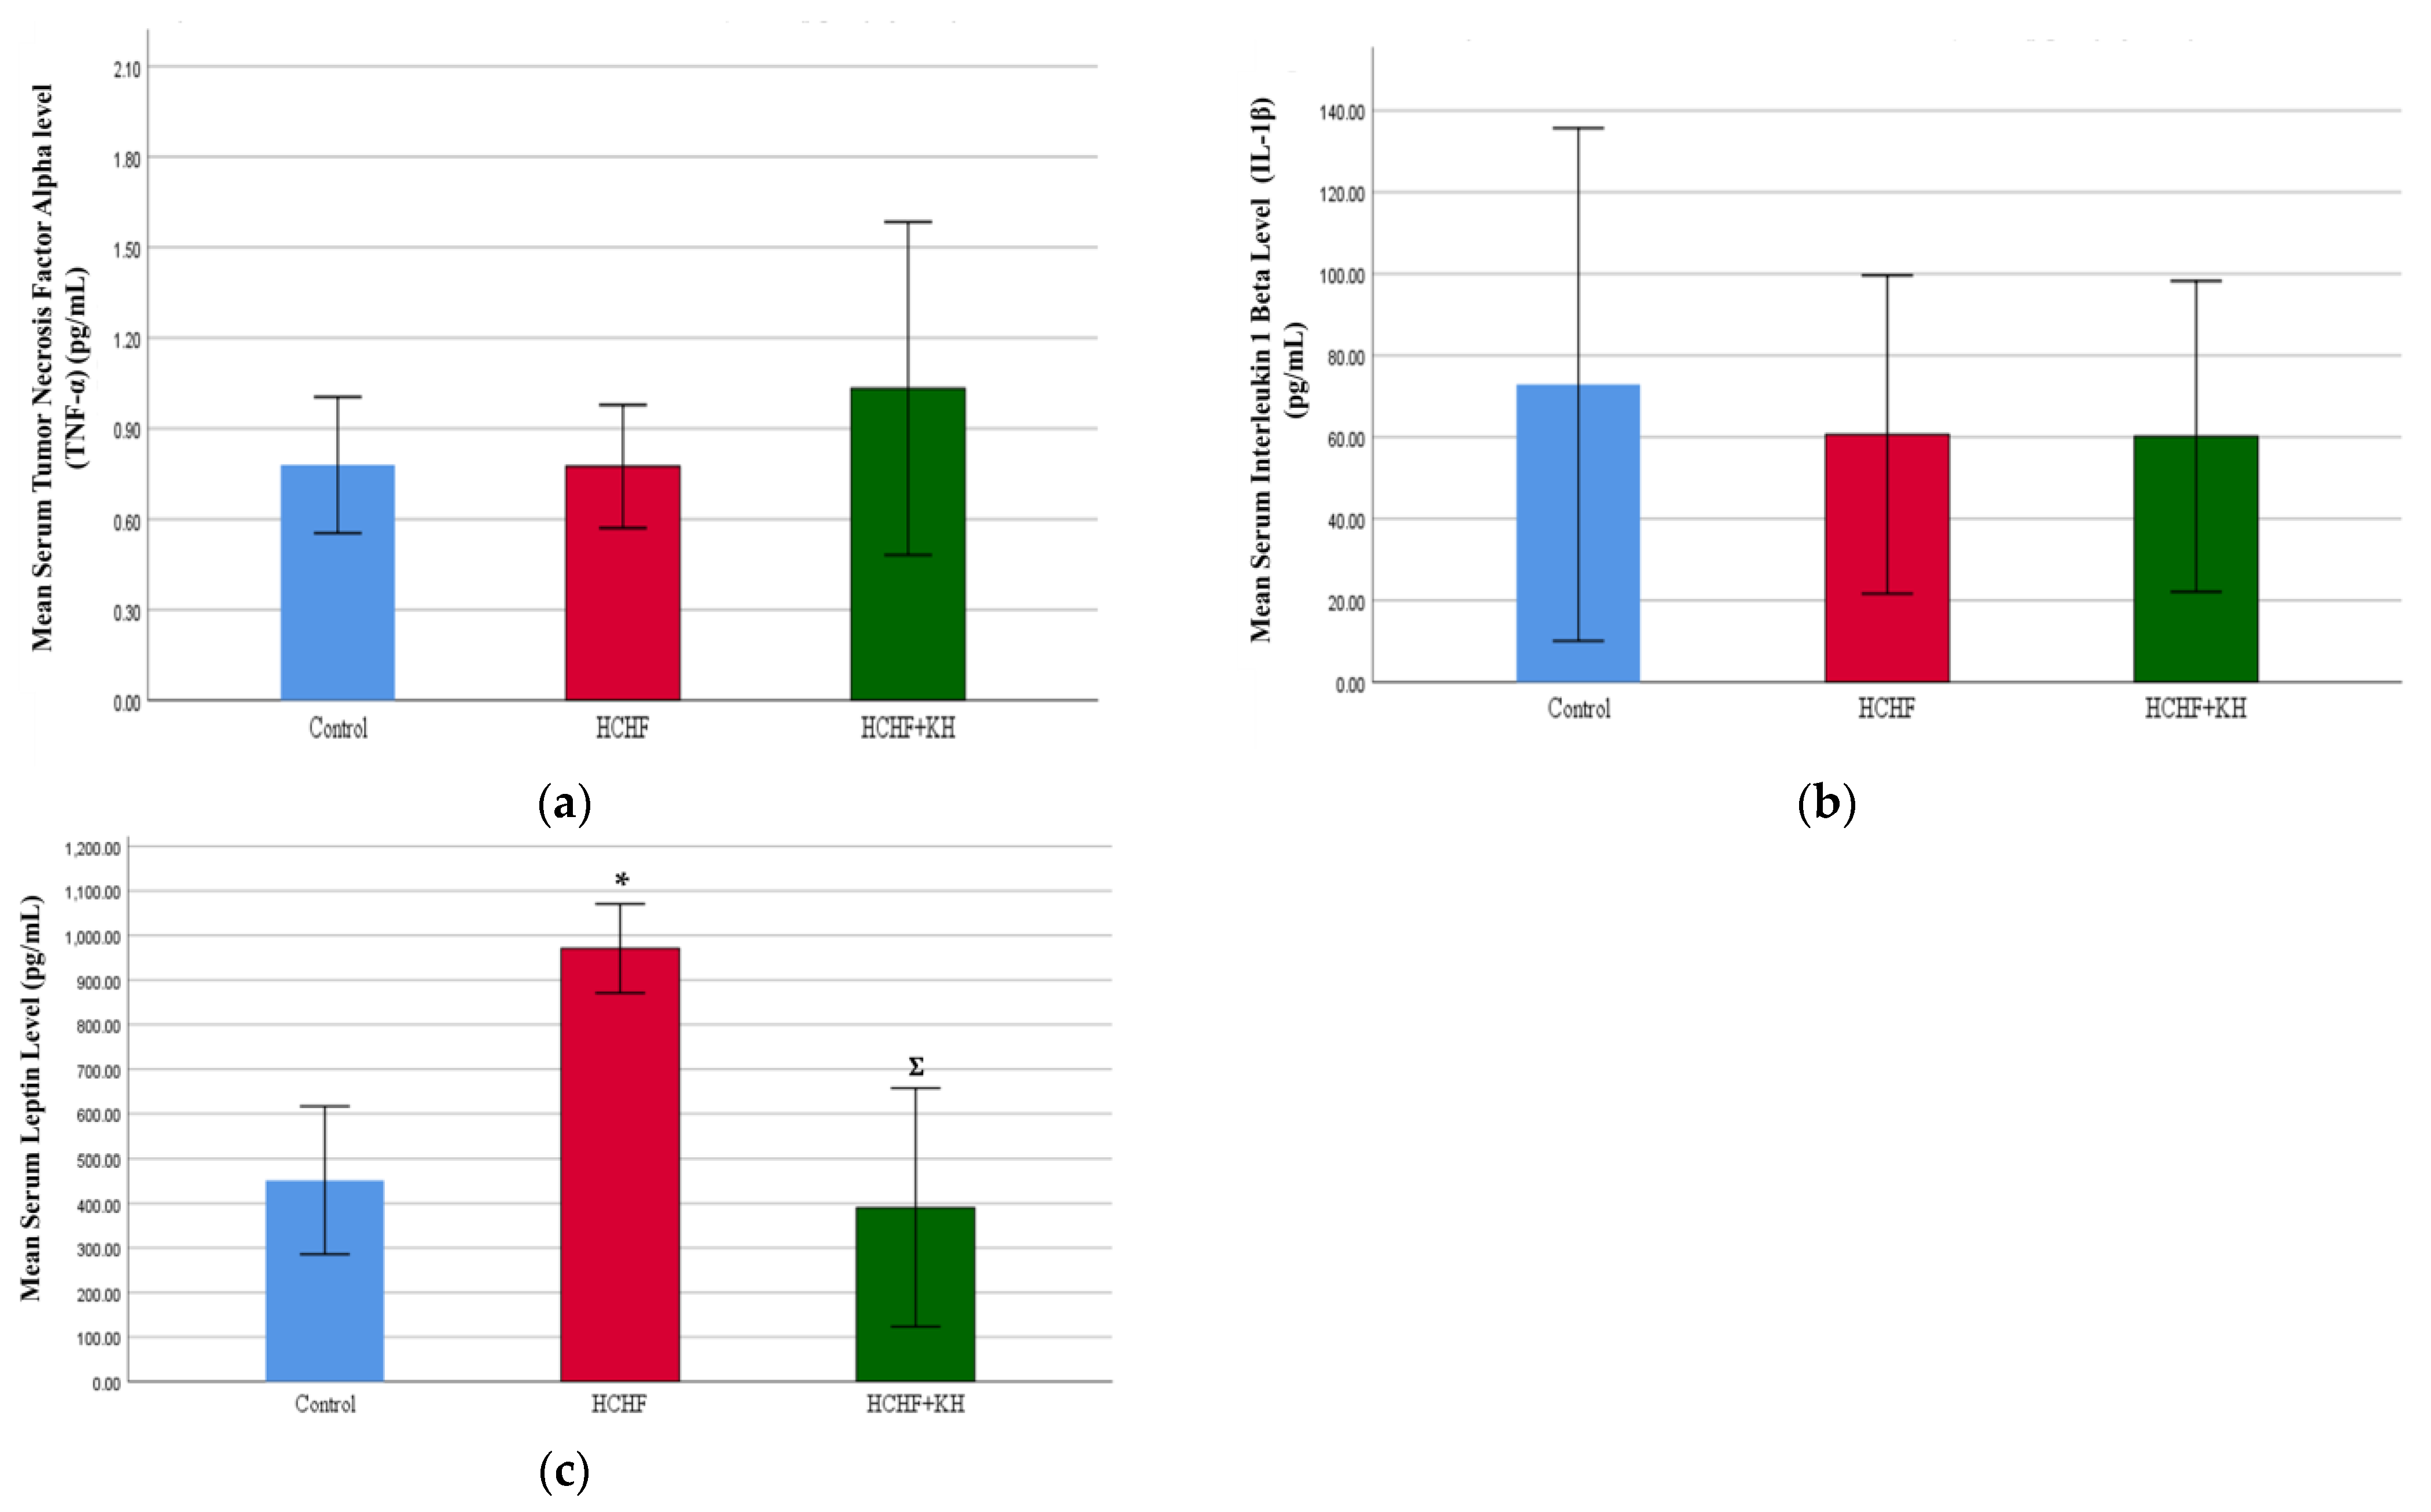
2.6. Serum Tumour Necrosis Factor Alpha (TNF-α), Interleukin-1-Beta (IL-1β) and Leptin
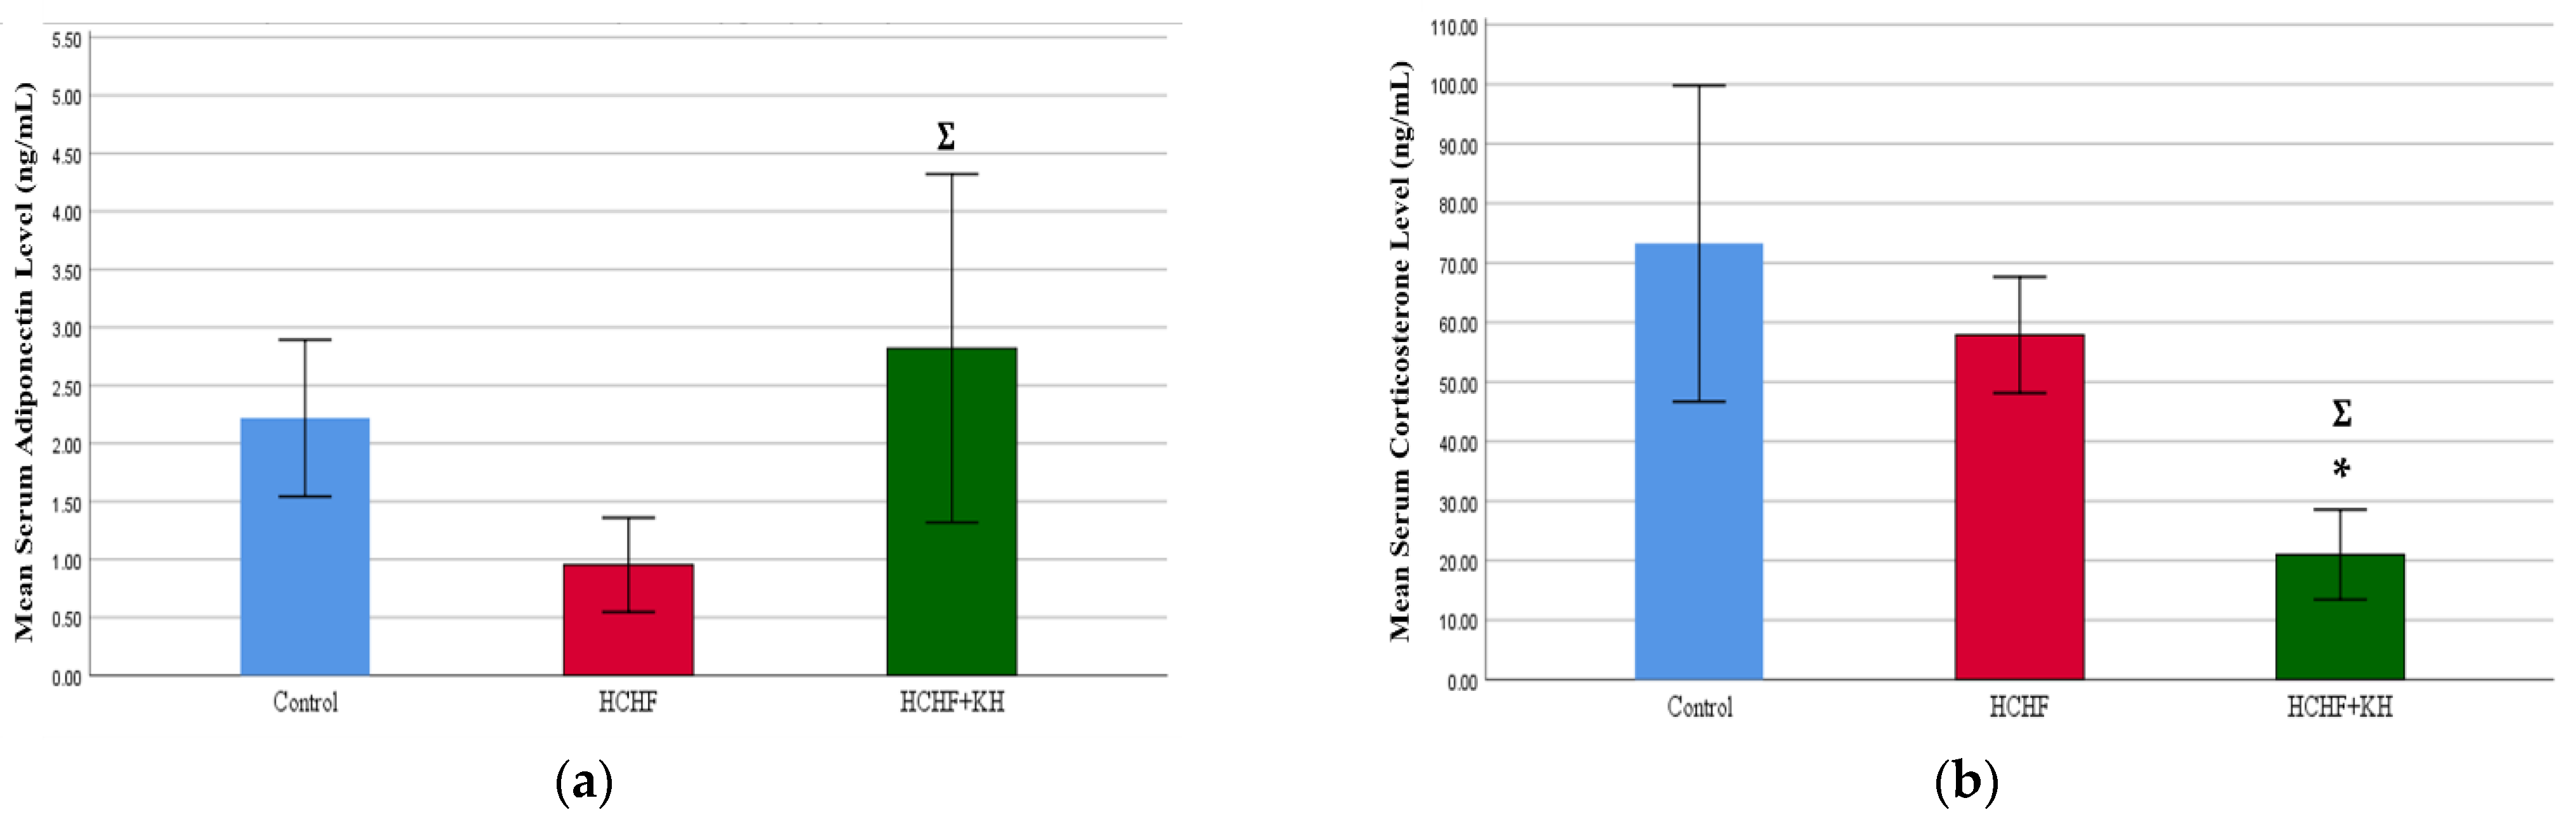
2.7. Serum Adiponectin and Corticosterone
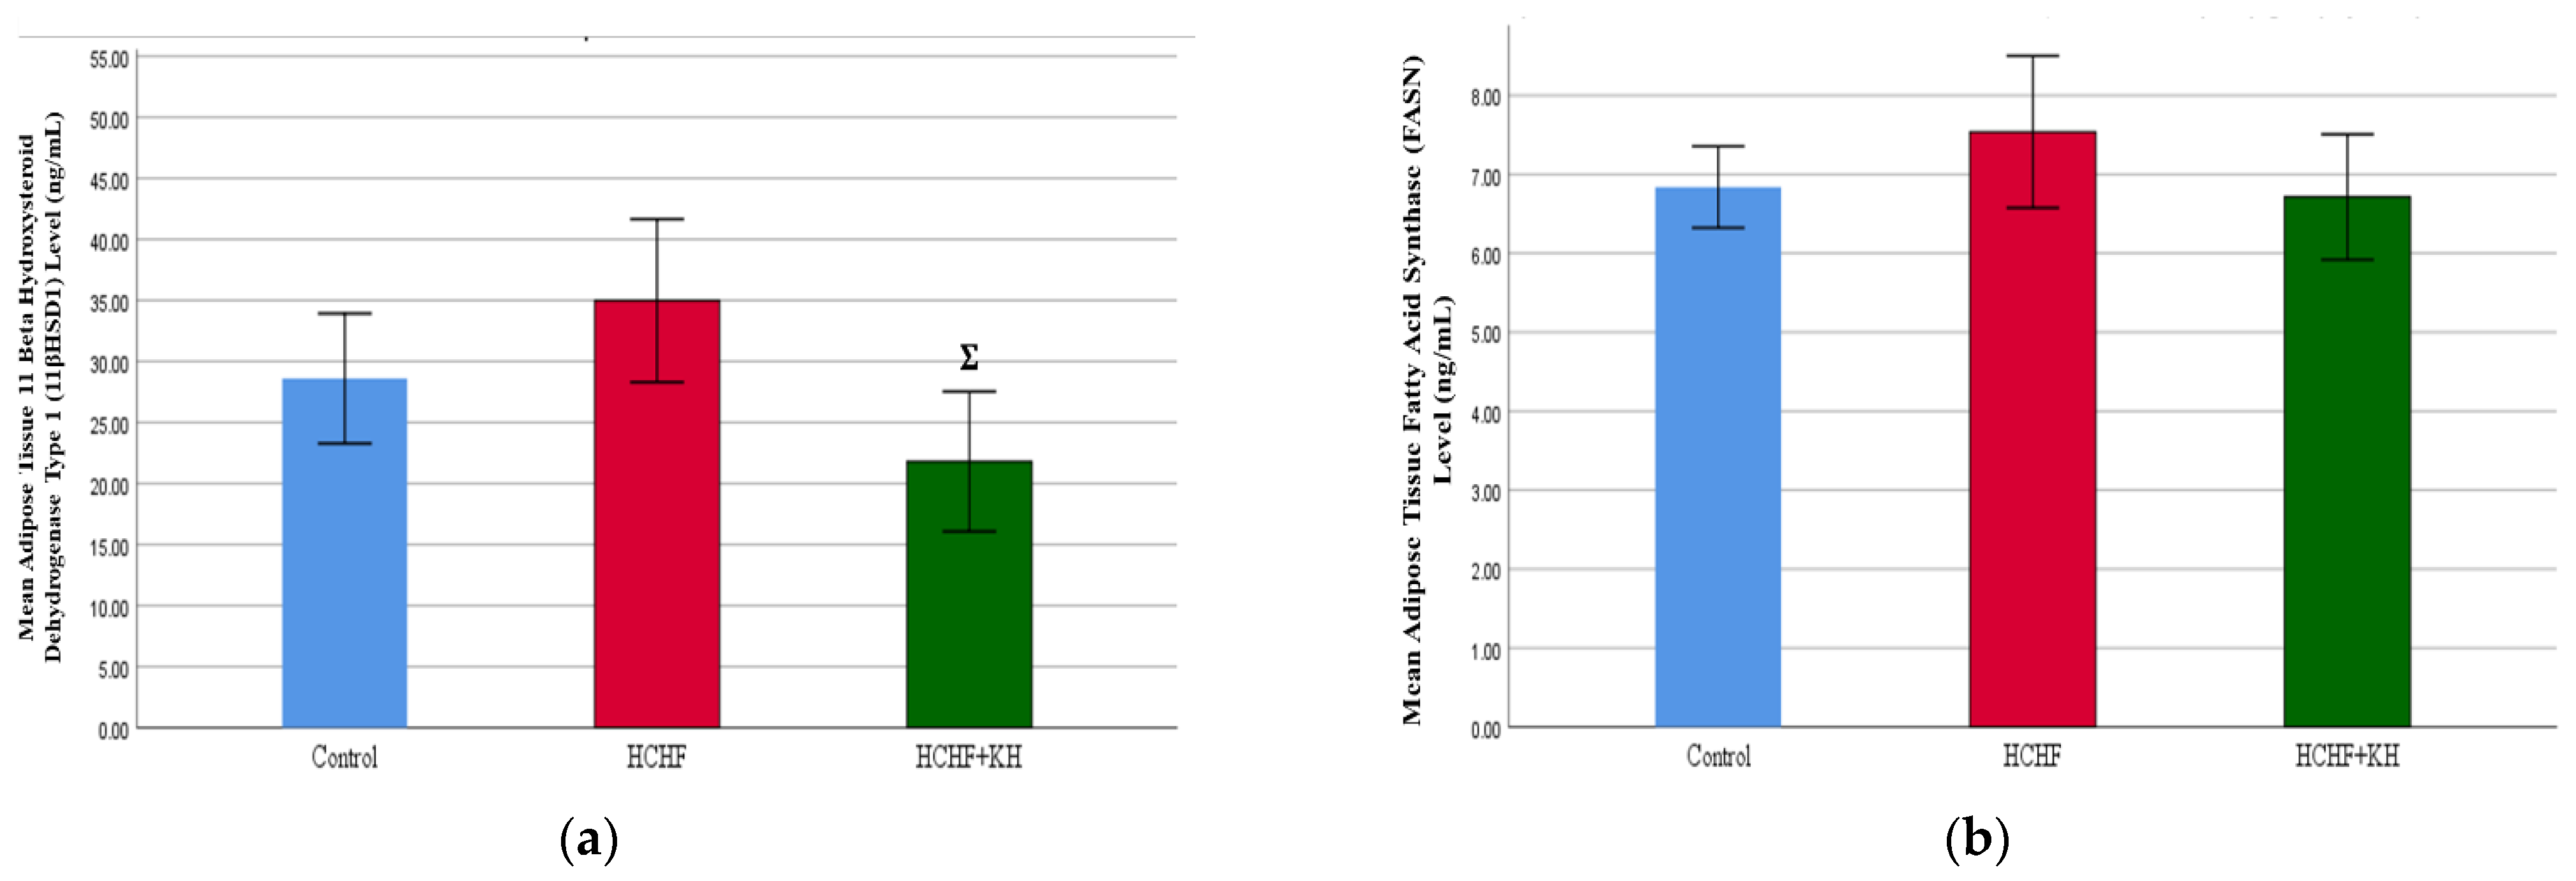
2.8. 11-Beta-Hydroxysteroid Dehydrogenase Type-1 (11βHSD1) Enzyme and Fatty Acid Synthase Enzyme (FASN)
2.9. Histomorphometry of Adipose Tissue, Liver, Pancreas and Renal Tissue
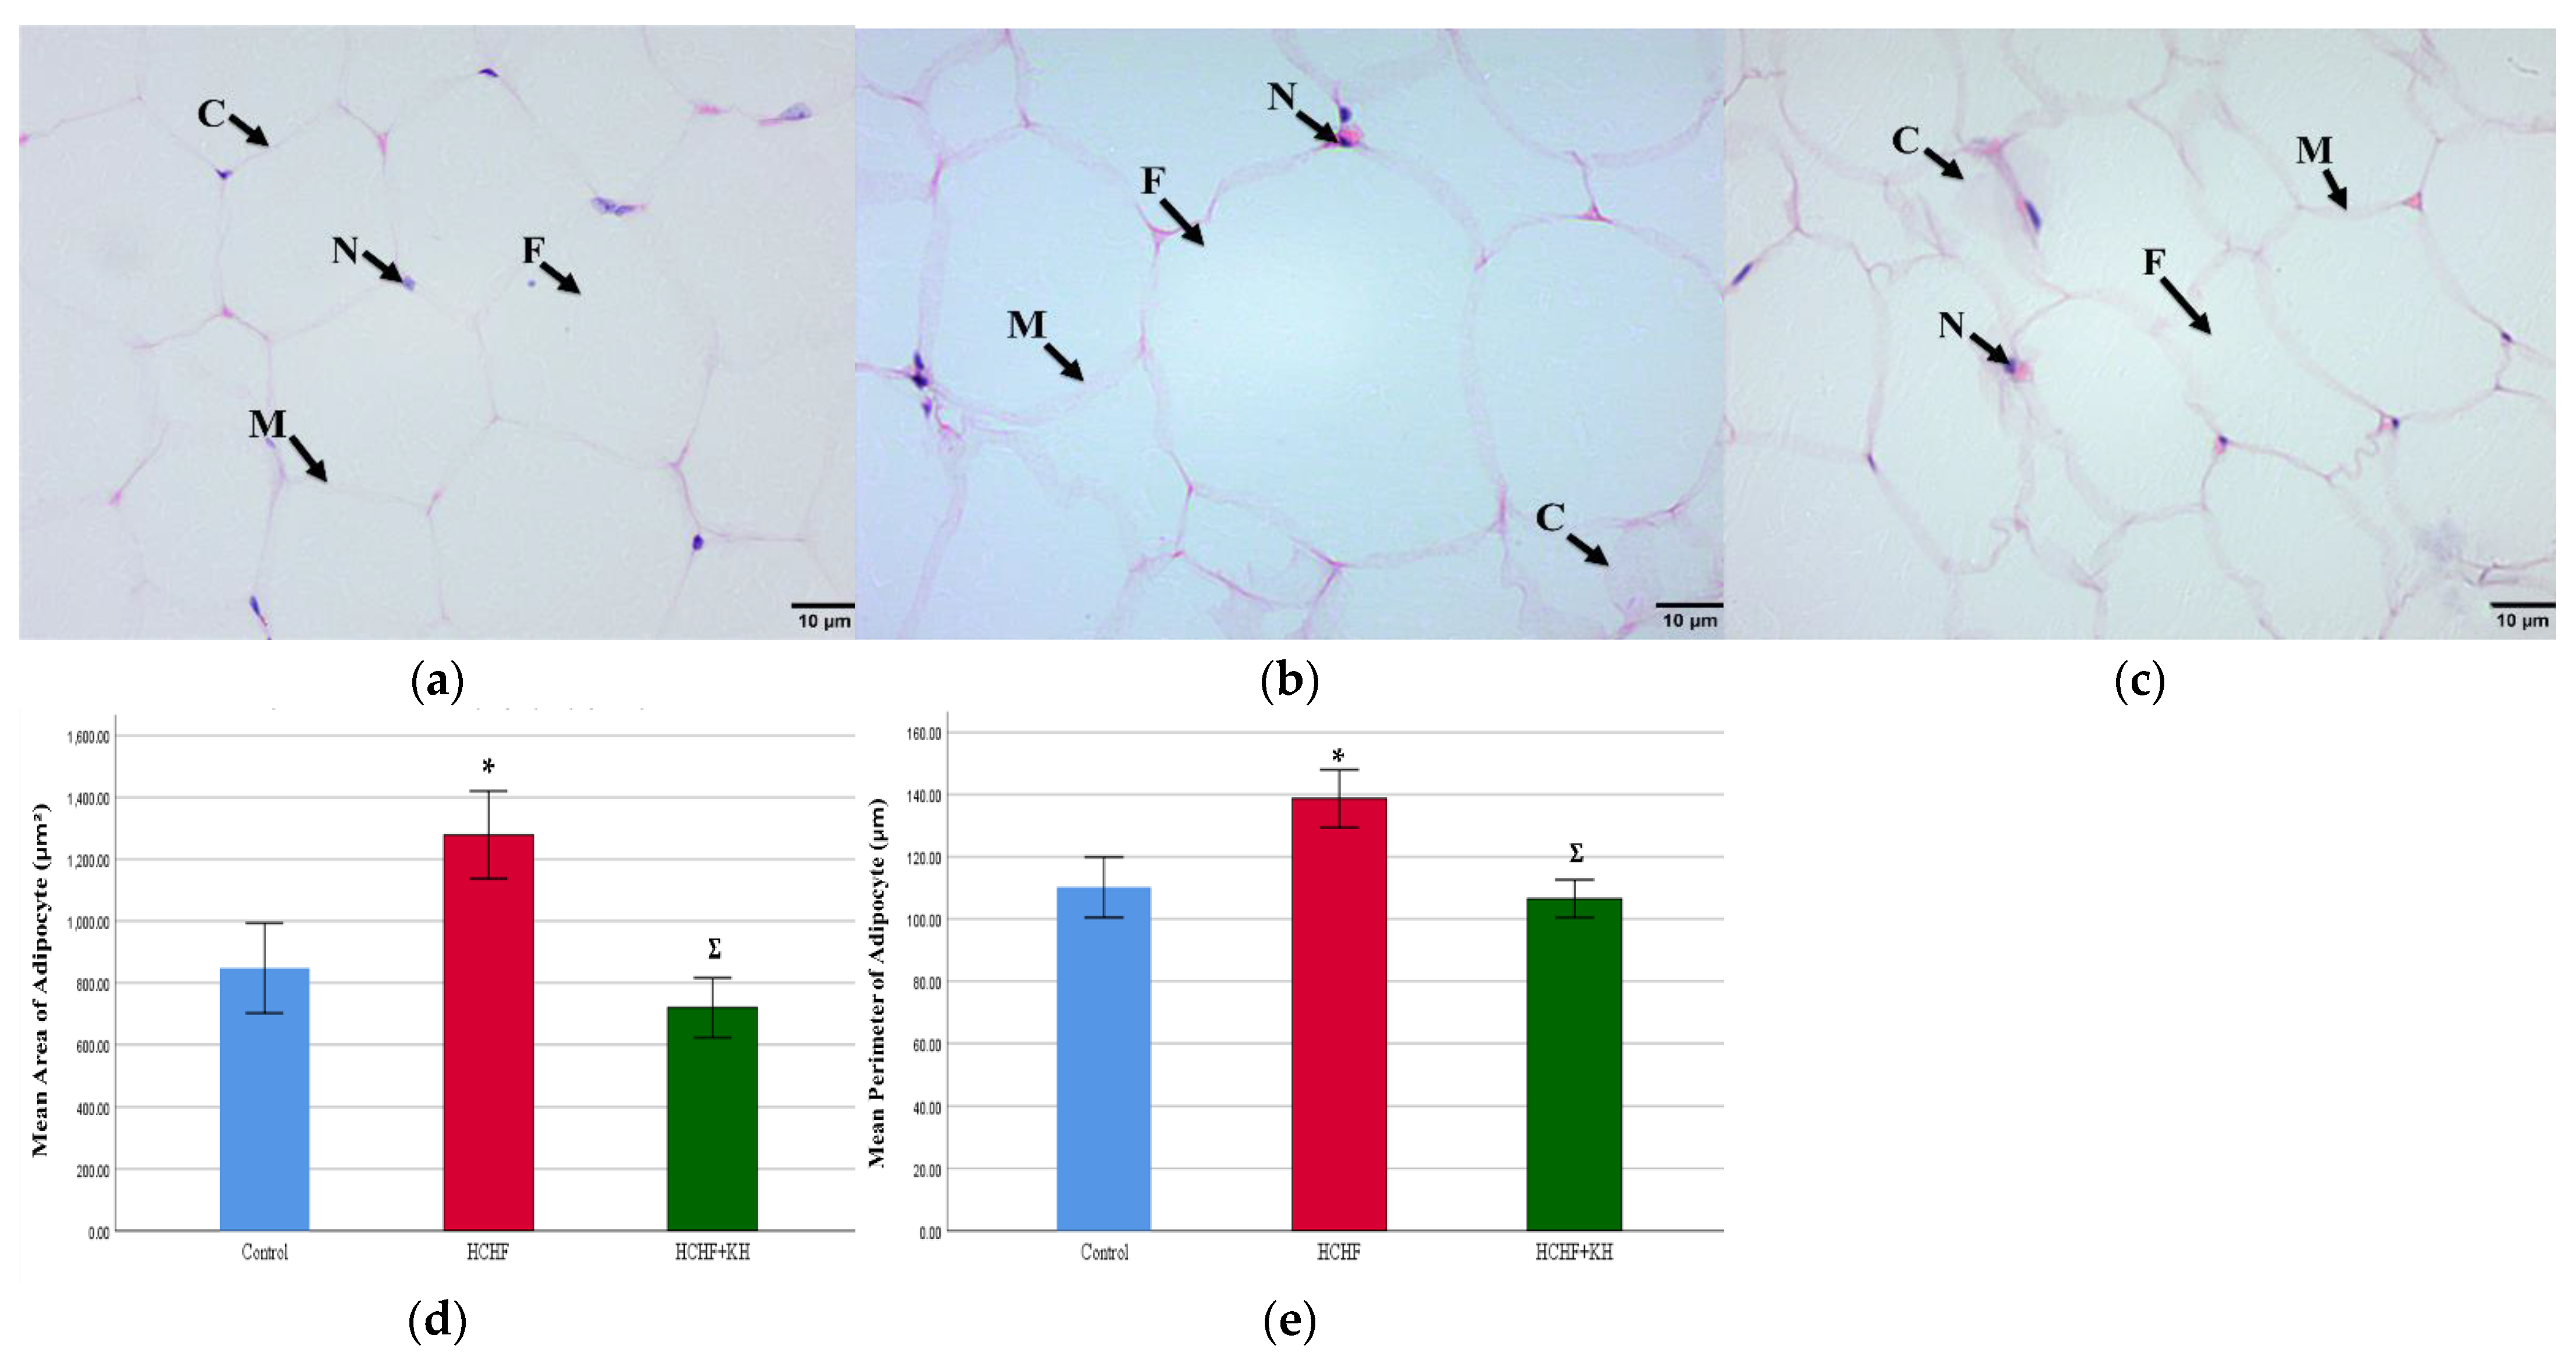
2.9.1. Adipose Tissue
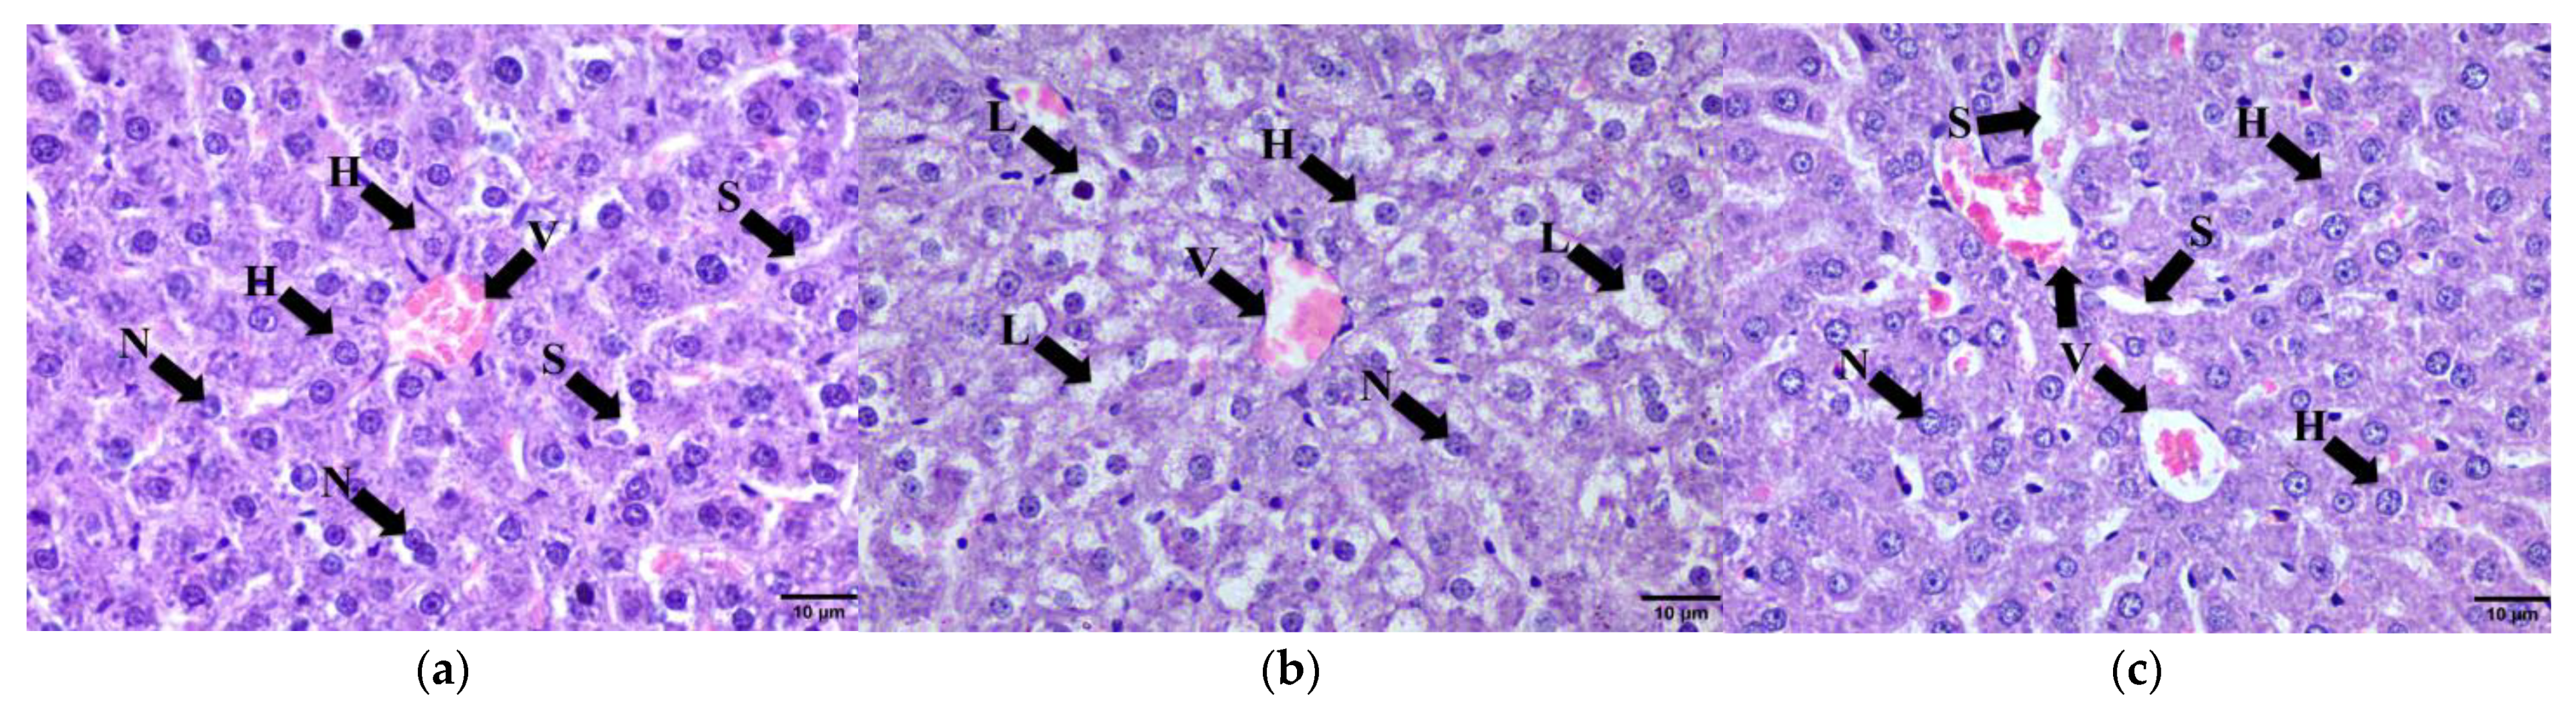
2.9.2. Liver
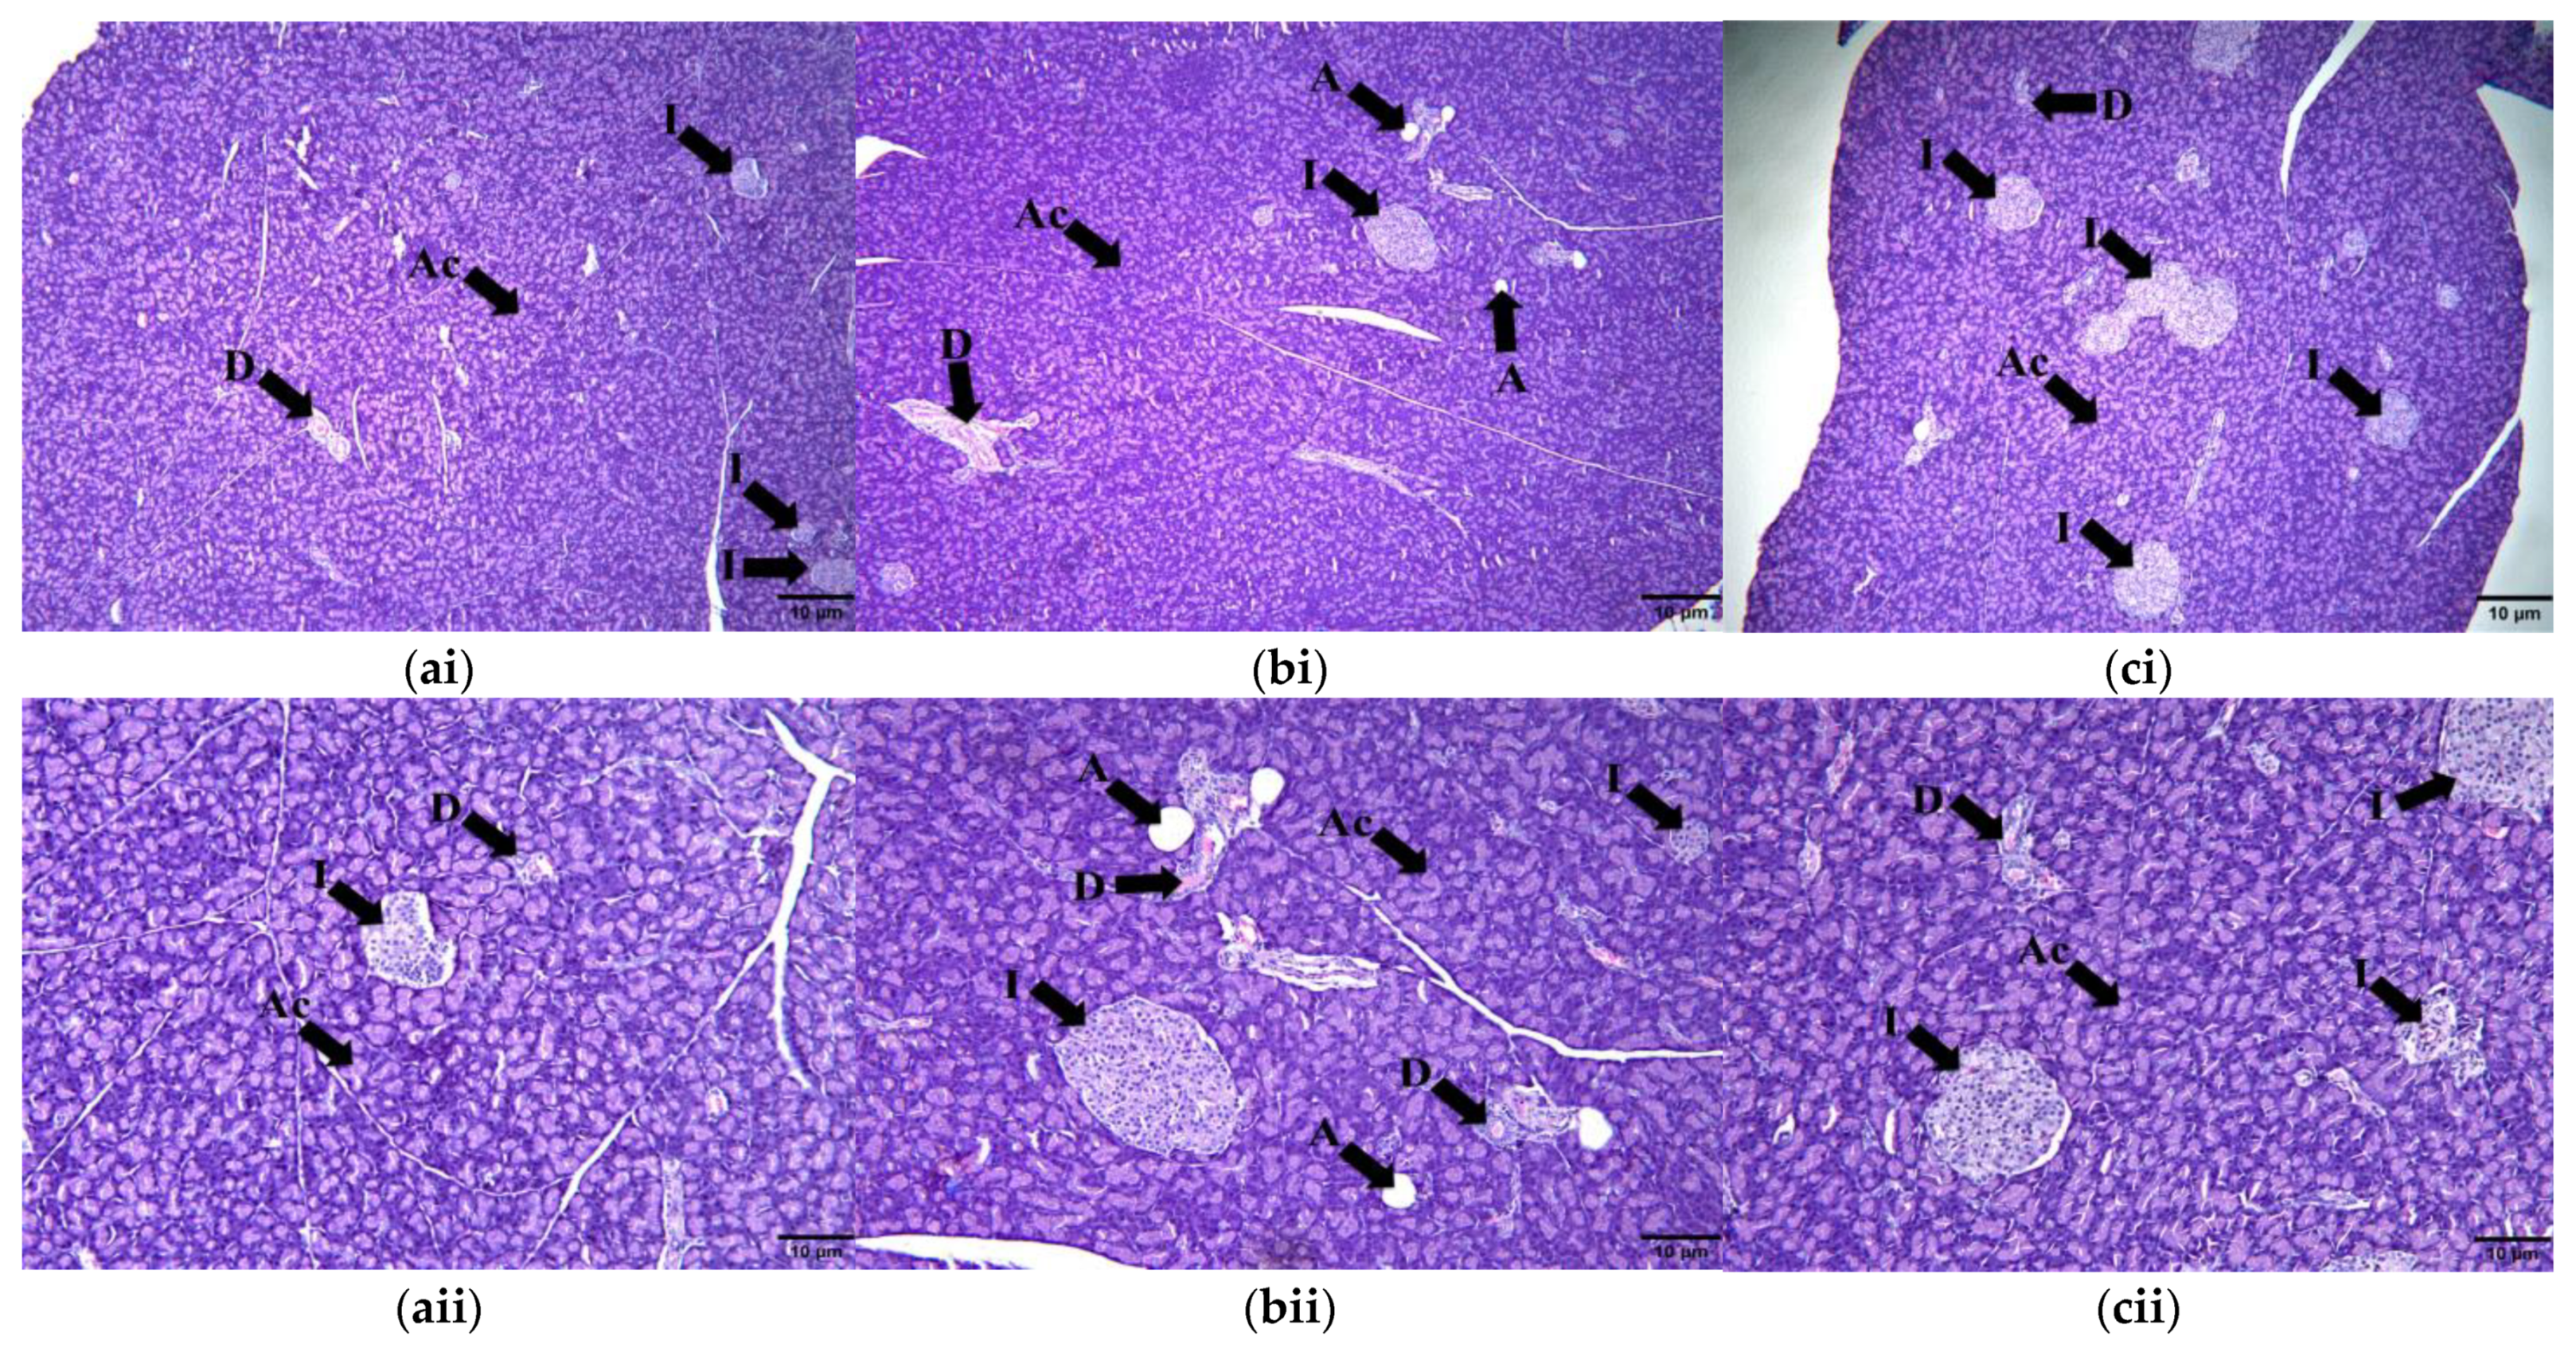
2.9.3. Pancreas
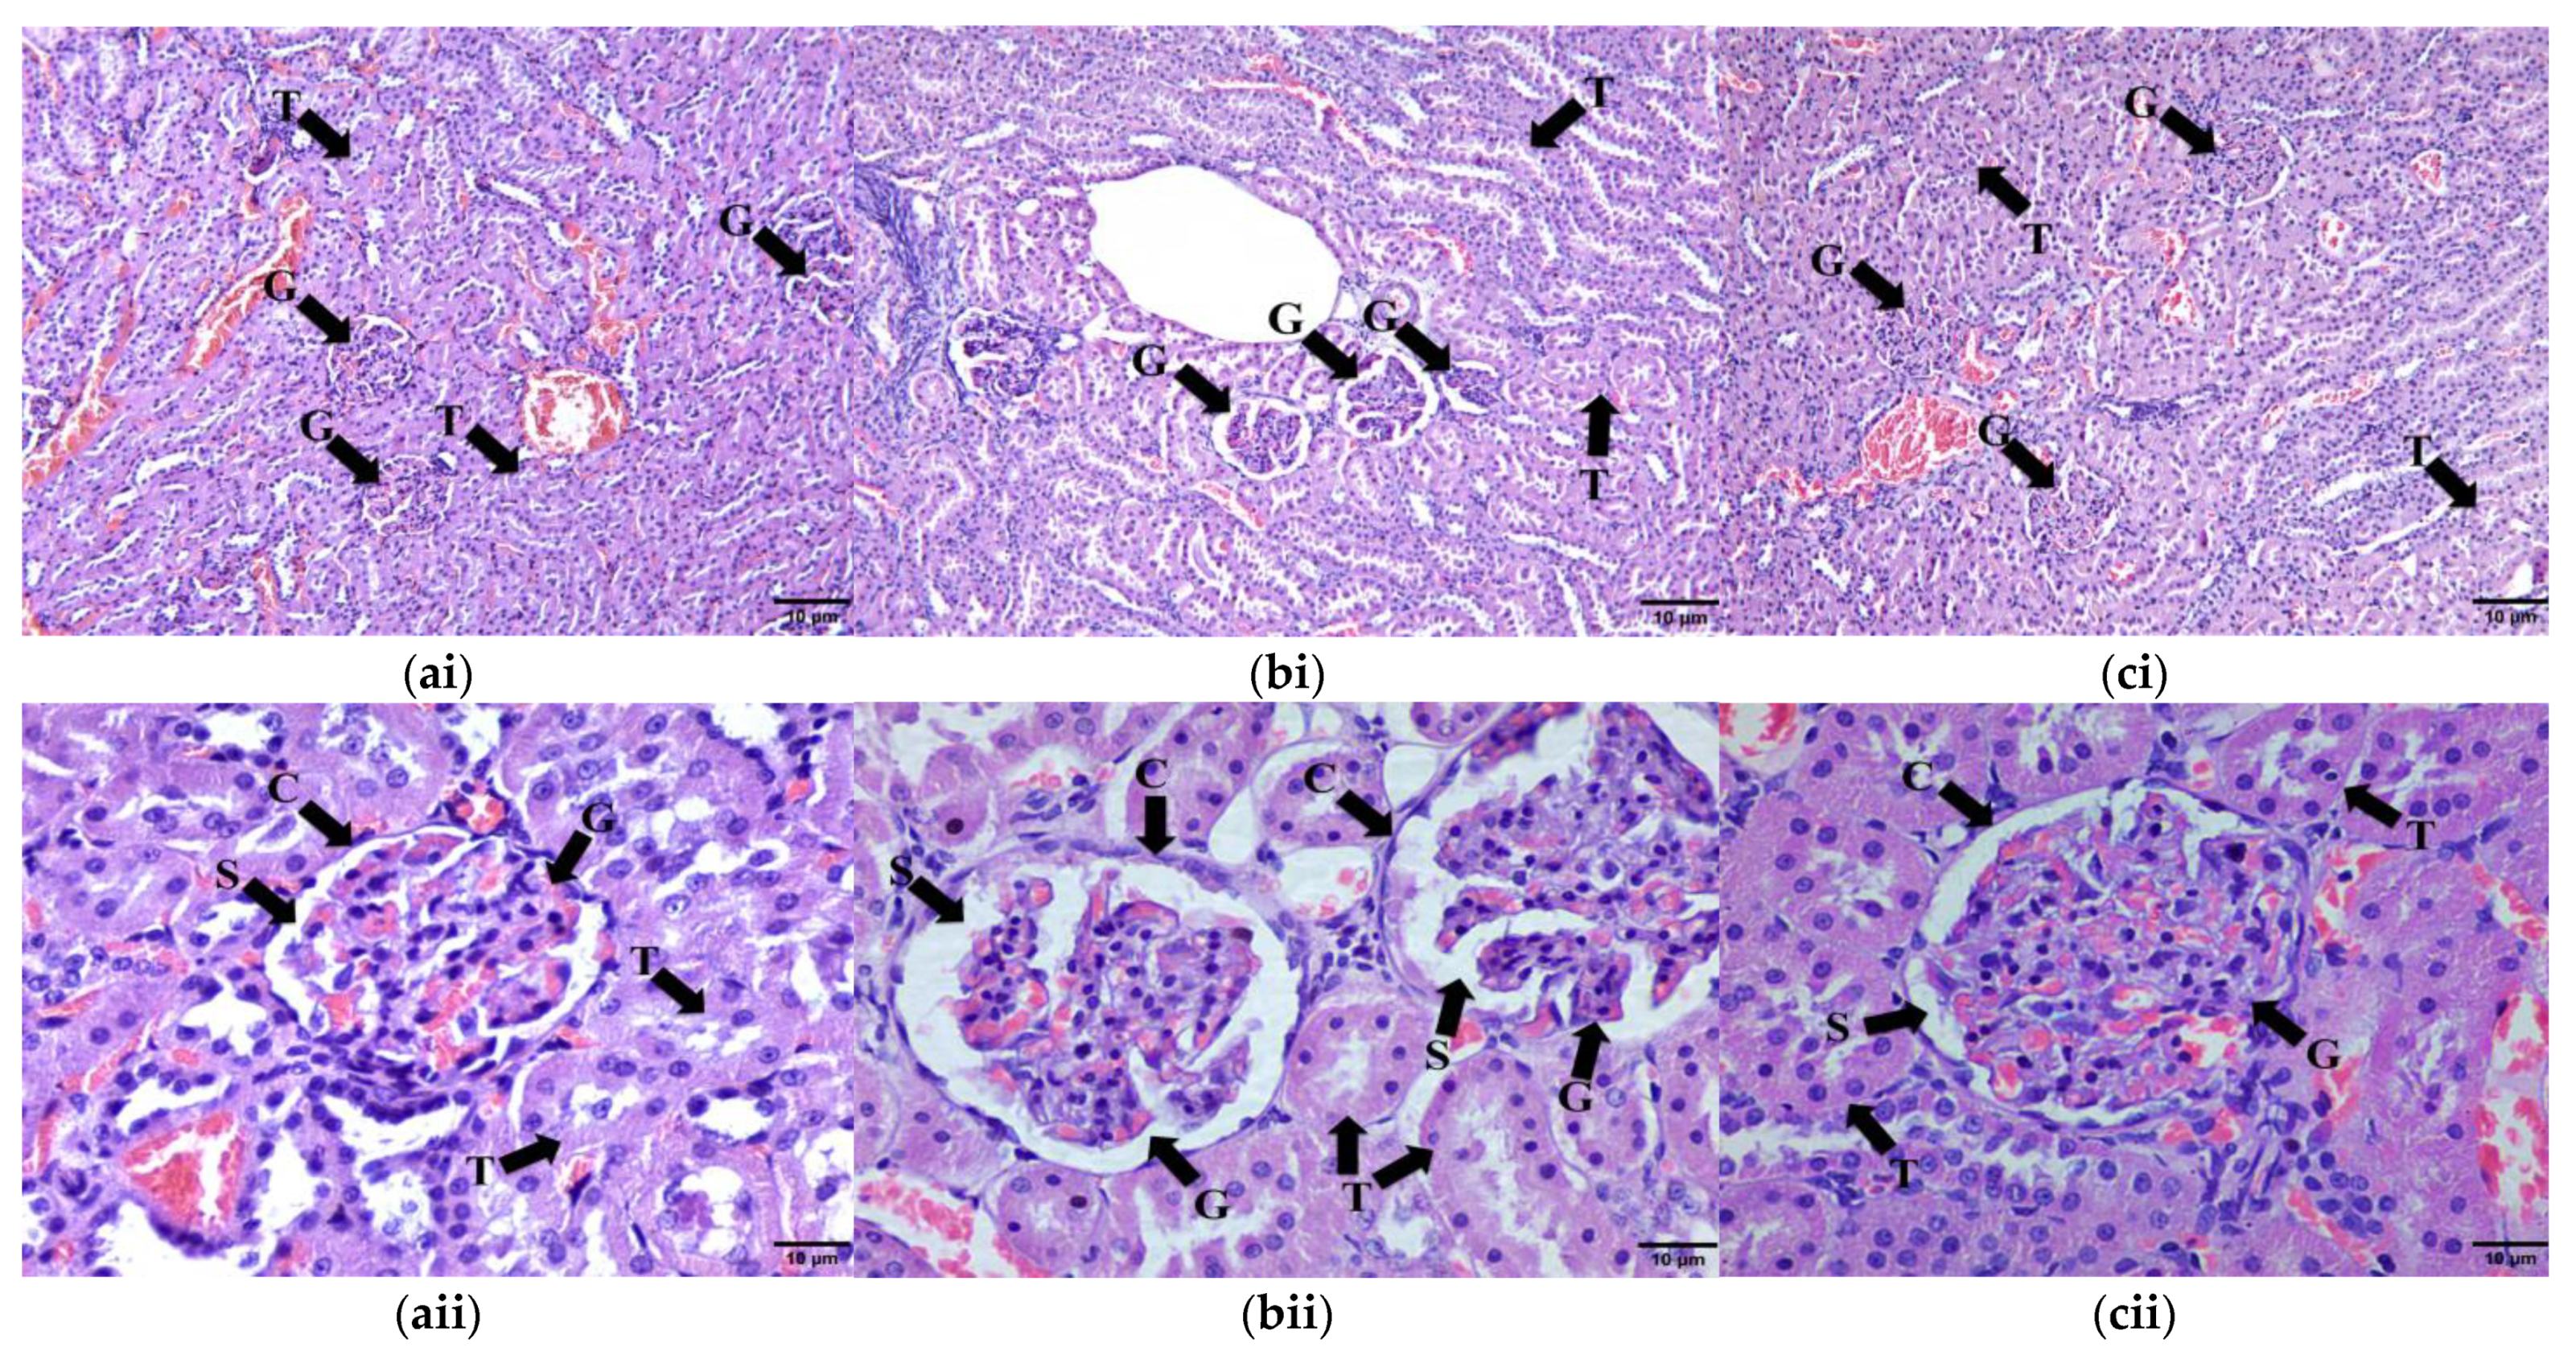
2.9.4. Kidney Tissue
3. Materials and Methods
3.1. Liquid Chromatography-Mass Spectrometry (LC-MS) Analysis of Kelulut Honey
3.2. High-Carbohydrate, High-Fat Diet Preparation
3.3. Kelulut Honey Preparation
3.4. Experimental Animals
3.5. Study Design
3.6. Metabolic Parameters
3.6.1. Measurement of Body Weight, Abdominal Circumference and Body Mass Index
3.6.2. Fat Percentage Measurement
3.6.3. Serum Fasting Triglyceride and High-Density Lipoprotein
3.6.4. Blood Pressure Measurement
3.6.5. Fasting Blood Glucose and Oral Glucose Tolerance Test
3.7. Inflammatory and Obesity Markers
3.7.1. Serum Tumour Necrosis Factor Alpha (TNF-α), Interleukin-1-Beta (IL-1β) and Leptin
3.7.2. Serum Adiponectin and Corticosterone
3.7.3. Adipose Tissue Homogenization
3.7.4. 11-Beta-Hydroxysteroid Dehydrogenase Type-1 (11βHSD1) Enzyme and Fatty Acid Synthase Enzyme (FASN)
3.8. Histomorphometry of Adipose Tissue, Liver, Pancreas and Renal Tissue
3.9. Statistical Analysis
4. Discussion
5. Conclusions
Author Contributions
Funding
Institutional Review Board Statement
Informed Consent Statement
Data Availability Statement
Acknowledgments
Conflicts of Interest
Sample Availability
References
- Alberti, K.G.M.M.; Eckel, R.H.; Grundy, S.M.; Zimmet, P.Z.; Cleeman, J.I.; Donato, K.A.; Fruchart, J.C.; James, W.P.T.; Loria, C.M.; Smith, S.C. Harmonizing the Metabolic Syndrome: A Joint Interim Statement of the International Diabetes Federation Task Force on Epidemiology and Prevention; National Heart, Lung, and Blood Institute; American Heart Association; World Heart Federation; International. Circulation 2009, 120, 1640–1645. [Google Scholar] [CrossRef]
- Alberti, G.; Zimmet, P.; Grundy, S.M. The IDF Consensus Worldwide Definition of the Metabolic Syndrome. Available online: https://www.idf.org/e-library/consensus-statements/60-idfconsensus-worldwide-definitionof-the-metabolic-syndrome.html (accessed on 29 July 2022).
- Ranasinghe, P.; Mathangasinghe, Y.; Jayawardena, R.; Hills, A.P.; Misra, A. Prevalence and Trends of Metabolic Syndrome among Adults in the Asia-Pacific Region: A Systematic Review. BMC Public Health 2017, 17, 101. [Google Scholar] [CrossRef]
- Zafar, U.; Khaliq, S.; Ahmad, H.U.; Manzoor, S.; Lone, K.P. Metabolic Syndrome: An Update on Diagnostic Criteria, Pathogenesis, and Genetic Links. Hormones 2018, 17, 299–313. [Google Scholar] [CrossRef] [PubMed]
- Michailidou, Z. Fundamental Roles for Hypoxia Signalling in Adipose Tissue Metabolism and Inflammation in Obesity. Curr. Opin. Physiol. 2019, 12, 39–43. [Google Scholar] [CrossRef]
- Shetty, S.S.; Kumari, S. Fatty Acids and Their Role in Type-2 Diabetes (Review). Exp. Ther. Med. 2021, 22, 706. [Google Scholar] [CrossRef] [PubMed]
- Vekic, J.; Zeljkovic, A.; Stefanovic, A.; Jelic-Ivanovic, Z.; Spasojevic-Kalimanovska, V. Obesity and Dyslipidemia. Metabolism. 2019, 92, 71–81. [Google Scholar] [CrossRef]
- Tomlinson, B.; Chan, P.; Lam, C.W.K. Postprandial Hyperlipidemia as a Risk Factor in Patients with Type 2 Diabetes. Expert Rev. Endocrinol. Metab. 2020, 15, 147–157. [Google Scholar] [CrossRef]
- Wang, J.; Wang, H.; Luo, W.; Guo, C.; Wang, J.; Chen, Y.E.; Chang, L.; Eitzman, D.T. Leptin-Induced Endothelial Dysfunction Is Mediated by Sympathetic Nervous System Activity. J. Am. Heart Assoc. 2013, 2, e000299. [Google Scholar] [CrossRef] [PubMed]
- Marsh, A.J.; Fontes, M.A.P.; Killinger, S.; Pawlak, D.B.; Polson, J.W.; Dampney, R.A.L. Cardiovascular Responses Evoked by Leptin Acting on Neurons in the Ventromedial and Dorsomedial Hypothalamus. Hypertension 2003, 42, 488–493. [Google Scholar] [CrossRef] [PubMed]
- Milan, G.; Granzotto, M.; Scarda, A.; Calcagno, A.; Pagano, C.; Federspil, G.; Vettor, R. Resistin and Adiponectin Expression in Visceral Fat of Obese Rats: Effect of Weight Loss. Obes. Res. 2002, 10, 1095–1103. [Google Scholar] [CrossRef] [PubMed]
- Fumeron, F.F.; Aubert, R.; Siddiq, A.; Betoulle, D.; Péan, F.; Hadjadj, S.; Tichet, J.; Wilpart, E.; Chesnier, M.-C.; Balkau, B.; et al. Adiponectin Gene Polymorphisms and Adiponectin Levels Are Independently Associated With the Development of Hyperglycemia During a 3-Year Period. Diabetes 2004, 53, 1150–1157. [Google Scholar] [CrossRef] [PubMed]
- Ryan, A.S.; Nicklas, B.J.; Berman, D.M.; Elahi, D. Adiponectin Levels Do Not Change with Moderate Dietary Induced Weight Loss and Exercise in Obese Postmenopausal Women. Int. J. Obes. 2003, 27, 1066–1071. [Google Scholar] [CrossRef] [PubMed]
- Rizzo, M.; Patti, A.M.; Al-Rasadi, K.; Giglio, R.V.; Nikolic, D.; Mannina, C.; Castellino, G.; Chianetta, R.; Banach, M.; Cicero, A.F.G.; et al. Natural Approaches in Metabolic Syndrome Management. Arch Med Sci 2018, 14, 422–441. [Google Scholar] [CrossRef]
- Feldeisen, S.E.; Tucker, K.L. Nutritional Strategies in the Prevention and Treatment of Metabolic Syndrome. Appl. Physiol. Nutr. Metab. 2007, 32, 46–60. [Google Scholar] [CrossRef]
- Graf, B.L.; Raskin, I.; Cefalu, W.T.; Ribnicky, D.M. Plant Derived Therapeutics for the Treatment of Metabolic Syndrome. Curr. Opin. Investig. Drugs 2011, 11, 1107–1115. [Google Scholar]
- Nisar, A.; Bono, A.; Ahmad, H.; Lateef, A.; Mushtaq, M. Simultaneous Identification of Phenolic Compound from the Honey of Stingless Bee by Using HPLC. Recent Adv. Biol. Med. 2019, 5, 11573. [Google Scholar] [CrossRef]
- Aziz, M.S.A.; Giribabu, N.; Rao, P.V.; Salleh, N. Pancreatoprotective Effects of Geniotrigona Thoracica Stingless Bee Honey in Streptozotocin-Nicotinamide-Induced Male Diabetic Rats. Biomed. Pharmacother. 2017, 89, 135–145. [Google Scholar] [CrossRef] [PubMed]
- Erejuwa, O.O.; Suleiman, S.A.; Ab Wahab, M.S.; Sirajudeen, K.N.S.; Salleh, S.; Gurtu, S. Honey Supplementation in Spontaneously Hypertensive Rats Elicits Antihypertensive Effect via Amelioration of Renal Oxidative Stress. Oxid. Med. Cell. Longev. 2012, 2012, 374037. [Google Scholar] [CrossRef]
- Nemoseck, T.M.; Carmody, E.G.; Furchner-Evanson, A.; Gleason, M.; Li, A.; Potter, H.; Rezende, L.M.; Lane, K.J.; Kern, M. Honey Promotes Lower Weight Gain, Adiposity, and Triglycerides than Sucrose in Rats. Nutr. Res. 2011, 31, 55–60. [Google Scholar] [CrossRef]
- Kek, S.P.; Chin, N.L.; Yusof, Y.A.; Tan, S.W.; Chua, L.S. Total Phenolic Contents and Colour Intensity of Malaysian Honeys from the Apis Spp. and Trigona Spp. Bees. Agric. Agric. Sci. Procedia 2014, 2, 150–155. [Google Scholar] [CrossRef]
- Ranneh, Y.; Ali, F.; Zarei, M.; Akim, A.M.; Hamid, H.A.; Khazaai, H. Malaysian Stingless Bee and Tualang Honeys: A Comparative Characterization of Total Antioxidant Capacity and Phenolic Profile Using Liquid Chromatography-Mass Spectrometry. Food Sci. Technol. 2018, 89, 1–9. [Google Scholar] [CrossRef]
- Ramli, N.Z.; Chin, K.Y.; Zarkasi, K.A.; Ahmad, F. The Beneficial Effects of Stingless Bee Honey from Heterotrigona Itama against Metabolic Changes in Rats Fed with High-Carbohydrate and High-Fat Diet. Int. J. Environ. Res. Public Health 2019, 16, 4987. [Google Scholar] [CrossRef] [PubMed]
- Rafie, A.Z.M.; Syahir, A.; Ahmad, W.A.N.W.; Mustafa, M.Z.; Mariatulqabtiah, A.R. Supplementation of Stingless Bee Honey from Heterotrigona Itama Improves Antiobesity Parameters in High-Fat Diet Induced Obese Rat Model. Evid.-Based Complement. Altern. Med. 2018, 2018, 6371582. [Google Scholar] [CrossRef]
- Wong, S.K.; Chin, K.Y.; Suhaimi, F.H.; Ahmad, F.; Ima-Nirwana, S. The Effects of a Modified High-Carbohydrate High-Fat Diet on Metabolic Syndrome Parameters in Male Rats. Exp. Clin. Endocrinol. Diabetes 2018, 126, 205–212. [Google Scholar] [CrossRef] [PubMed]
- Bian, Y.; Lei, J.; Zhong, J.; Wang, B.; Wan, Y.; Li, J.; Liao, C.; He, Y.; Liu, Z.; Ito, K.; et al. Kaempferol Reduces Obesity, Prevents Intestinal Inflammation, and Modulates Gut Microbiota in High-Fat Diet Mice. J. Nutr. Biochem. 2022, 99, 108840. [Google Scholar] [CrossRef] [PubMed]
- Hoang, M.H.; Jia, Y.; Mok, B.; Jun, H.; Hwang, K.Y.; Lee, S.J. Kaempferol Ameliorates Symptoms of Metabolic Syndrome by Regulating Activities of Liver X Receptor-β. J. Nutr. Biochem. 2015, 26, 868–875. [Google Scholar] [CrossRef]
- Zhang, Y.; Liu, D. Flavonol Kaempferol Improves Chronic Hyperglycemia-Impaired Pancreatic Beta-Cell Viability and Insulin Secretory Function. Eur. J. Pharmacol. 2011, 670, 325–332. [Google Scholar] [CrossRef] [PubMed]
- Zhang, Y.; Gu, M.; Cai, W.; Yu, L.; Feng, L.; Zhang, L.; Zang, Q.; Wang, Y.; Wang, D.; Chen, H.; et al. Dietary Component Isorhamnetin Is a PPARγ Antagonist and Ameliorates Metabolic Disorders Induced by Diet or Leptin Deficiency. Sci. Rep. 2016, 6, 19288. [Google Scholar] [CrossRef]
- Pu, P.; Gao, D.M.; Mohamed, S.; Chen, J.; Zhang, J.; Zhou, X.Y.; Zhou, N.J.; Xie, J.; Jiang, H. Naringin Ameliorates Metabolic Syndrome by Activating AMP-Activated Protein Kinase in Mice Fed a High-Fat Diet. Arch. Biochem. Biophys. 2012, 518, 61–70. [Google Scholar] [CrossRef]
- Subramanian, M.; Thotakura, B.; Chandra Sekaran, S.P.; Jyothi, A.K.; Sundaramurthi, I. Naringin Ameliorates Streptozotocin-Induced Diabetes through Forkhead Box M1-Mediated Beta Cell Proliferation. Cells Tissues Organs 2018, 206, 242–253. [Google Scholar] [CrossRef]
- Szelényi, P.; Somogyi, A.; Sarnyai, F.; Zámbó, V.; Simon-Szabó, L.; Kereszturi, É.; Csala, M. Microsomal Pre-Receptor Cortisol Production Is Inhibited by Resveratrol and Epigallocatechin Gallate through Different Mechanisms. BioFactors 2019, 45, 236–243. [Google Scholar] [CrossRef]
- Hintzpeter, J.; Stapelfeld, C.; Loerz, C.; Martin, H.J.; Maser, E. Green Tea and One of Its Constituents, Epigallocatechine-3-Gallate, Are Potent Inhibitors of Human 11β-Hydroxysteroid Dehydrogenase Type 1. PLoS ONE 2014, 9, 2–10. [Google Scholar] [CrossRef] [PubMed]
- Pathak, N.M.; Millar, P.J.B.; Pathak, V.; Flatt, P.R.; Gault, V.A. Beneficial Metabolic Effects of Dietary Epigallocatechin Gallate Alone and in Combination with Exendin-4 in High Fat Diabetic Mice. Mol. Cell. Endocrinol. 2017, 460, 200–208. [Google Scholar] [CrossRef]
- Cheng, C.W.; Chang, W.L.; Chang, L.C.; Wu, C.C.; Lin, Y.F.; Chen, J.S. Ferulic Acid, an Angelica Sinensis-Derived Polyphenol, Slows the Progression of Membranous Nephropathy in a Mouse Model. Evid.-Based Complement. Altern. Med. 2012, 2012, 161235. [Google Scholar] [CrossRef]
- Eslamifar, Z.; Moridnia, A.; Sabbagh, S.; Ghaffaripour, R.; Jafaripour, L.; Behzadifard, M. Ameliorative Effects of Gallic Acid on Cisplatin-Induced Nephrotoxicity in Rat Variations of Biochemistry, Histopathology, and Gene Expression. Biomed Res. Int. 2021, 2021, 2195238. [Google Scholar] [CrossRef]
- Ye, T.; Zhen, J.; Du, Y.; Zhou, J.K.; Peng, A.; Vaziri, N.D.; Mohan, C.; Xu, Y.; Zhou, X.J. Green Tea Polyphenol (-)-Epigallocatechin-3-Gallate Restores Nrf2 Activity and Ameliorates Crescentic Glomerulonephritis. PLoS ONE 2015, 10, e0119543. [Google Scholar] [CrossRef] [PubMed]
- Pei, K.; Ou, J.; Huang, J.; Ou, S. P-Coumaric Acid and Its Conjugates: Dietary Sources, Pharmacokinetic Properties and Biological Activities. J. Sci. Food Agric. 2015, 96, 2952–2962. [Google Scholar] [CrossRef] [PubMed]
- Abdel-Moneim, A.; El-Twab, S.M.A.; Yousef, A.I.; Reheim, E.S.A.; Ashour, M.B. Modulation of Hyperglycemia and Dyslipidemia in Experimental Type 2 Diabetes by Gallic Acid and P-Coumaric Acid: The Role of Adipocytokines and PPARγ. Biomed. Pharmacother. 2018, 105, 1091–1097. [Google Scholar] [CrossRef]
- Raatz, S.K.; Johnson, L.A.K.; Picklo, M.J. Consumption of Honey, Sucrose, and High-Fructose Corn Syrup Produces Similar Metabolic Effects in Glucose-Tolerant and -Intolerant Individuals1,2. J. Nutr. 2015, 145, 2265–2272. [Google Scholar] [CrossRef]
- Prana, V.; Tieri, P.; Palumbo, M.C.; Mancini, E.; Castiglione, F. Modeling the Effect of High Calorie Diet on the Interplay between Adipose Tissue, Inflammation, and Diabetes. Comput. Math. Methods Med. 2019, 2019, 7525834. [Google Scholar] [CrossRef]
- Meln, I.; Wolff, G.; Gajek, T.; Koddebusch, J.; Lerch, S.; Harbrecht, L.; Hong, W.; Bayindir-Buchhalter, I.; Krunic, D.; Augustin, H.G.; et al. Dietary Calories and Lipids Synergistically Shape Adipose Tissue Cellularity during Postnatal Growth. Mol. Metab. 2019, 24, 139–148. [Google Scholar] [CrossRef]
- Kelishadi, R.; Mansourian, M.; Heidari-Beni, M. Association of Fructose Consumption and Components of Metabolic Syndrome in Human Studies: A Systematic Review and Meta-Analysis. Nutrition 2014, 30, 503–510. [Google Scholar] [CrossRef] [PubMed]
- Keles, U.; Ow, J.R.; Kuentzel, K.B.; Zhao, L.N.; Kaldis, P. Liver-Derived Metabolites as Signaling Molecules in Fatty Liver Disease. Cell. Mol. Life Sci. 2023, 80, 4. [Google Scholar] [CrossRef] [PubMed]
- Song, K.; Kim, H.-S.; Chae, H.W. Nonalcoholic Fatty Liver Disease and Insulin Resistance in Children Running Title: Fatty Liver and Insulin Resistance. Clin. Exp. Paediatr. 2023, 1–29. [Google Scholar] [CrossRef]
- Panchal, S.K.; Poudyal, H.; Iyer, A.; Nazer, R.; Alam, M.A.; Diwan, V.; Kauter, K.; Sernia, C.; Campbell, F.; Ward, L.; et al. High-Carbohydrate, High-Fat Diet-Induced Metabolic Syndrome and Cardiovascular Remodeling in Rats. J. Cardiovasc. Pharmacol. 2011, 57, 51–64. [Google Scholar] [CrossRef]
- Duvnjak, L.; Duvnjak, M. The Metabolic Syndrome - an Ongoing Story. J. Physiol. Pharmacol. 2009, 60, 19–24. [Google Scholar]
- Kotsis, V.; Stabouli, S.; Papakatsika, S.; Rizos, Z.; Parati, G. Mechanisms of Obesity-Induced Hypertension. Hypertens. Res. 2010, 33, 386–393. [Google Scholar] [CrossRef]
- Erejuwa, O.O.; Aja, D.O.J.; Uwaezuoke, N.I.; Nwadike, K.I.; Ezeokpo, B.C.; Akpan, J.L.; Nwobodo, N.N.; Araromi, E.; Asika, E. Effects of Honey Supplementation on Renal Dysfunction and Metabolic Acidosis in Rats with High-Fat Diet-Induced Chronic Kidney Disease. J. Basic Clin. Physiol. Pharmacol. 2020, 32. [Google Scholar] [CrossRef]
- Seravalle, G.; Grassi, G. Obesity and Hypertension. Pharmacol. Res. 2017, 122, 1–7. [Google Scholar] [CrossRef]
- Then, C.; Ritzel, K.; Herder, C.; Then, H.; Sujana, C.; Heier, M.; Meisinger, C.; Peters, A.; Koenig, W.; Rathmann, W.; et al. Association of Renin and Aldosterone with Glucose Metabolism in a Western European Population: The KORA F4/FF4 Study. BMJ Open Diabetes Res. Care 2022, 10, e002558. [Google Scholar] [CrossRef]
- Fawzy, N.A.; Shah, H.; Abdulkader, H.; Razak, A.; Sabbah, A.N.; Arabi, Z. Obesity-Related Kidney Disease: Beyond Hypertension And. Front. Endocrinol. 2023, 13, 1095211. [Google Scholar] [CrossRef]
- Huby, A.C.; Antonova, G.; Groenendyk, J.; Gomez-Sanchez, C.E.; Bollag, W.B.; Filosa, J.A.; De Chantemèle, E.J.B. Adipocyte-Derived Hormone Leptin Is a Direct Regulator of Aldosterone Secretion, Which Promotes Endothelial Dysfunction and Cardiac Fibrosis. Circulation 2015, 132, 2134–2145. [Google Scholar] [CrossRef] [PubMed]
- Huby, A.C.; Otvos, L.; De Chantemèle, E.J.B. Leptin Induces Hypertension and Endothelial Dysfunction via Aldosterone-Dependent Mechanisms in Obese Female Mice. Hypertension 2016, 67, 1020–1028. [Google Scholar] [CrossRef] [PubMed]
- Chen, H.; Li, M.; Liu, L.; Zhu, D.; Tian, G. Highlight Article: Telmisartan Improves Myocardial Remodeling by Inhibiting Leptin Autocrine Activity and Activating PPARγ. Exp. Biol. Med. 2020, 245, 654–666. [Google Scholar] [CrossRef]
- Grundy, S.M. Pre-Diabetes, Metabolic Syndrome, and Cardiovascular Risk. J. Am. Coll. Cardiol. 2012, 59, 635–643. [Google Scholar] [CrossRef]
- Ferrannini, E.; Gastaldelli, A.; Iozzo, P. Pathophysiology of Prediabetes. Med. Clin. North Am. 2011, 95, 327–339. [Google Scholar] [CrossRef]
- Townsend, D.K.; McGregor, K.; Wu, E.; Cialkowski, K.; Haub, M.D.; Barstow, T.J. Insulin Resistance and Metabolic Syndrome Criteria in Lean, Normoglycemic College-Age Subjects. Diabetes Metab. Syndr. Clin. Res. Rev. 2018, 12, 609–616. [Google Scholar] [CrossRef]
- Hatanaka, M.; Anderson-Baucum, E.; Lakhter, A.; Kono, T.; Maier, B.; Tersey, S.A.; Tanizawa, Y.; Evans-Molina, C.; Mirmira, R.G.; Sims, E.K. Chronic High Fat Feeding Restricts Islet MRNA Translation Initiation Independently of ER Stress via DNA Damage and P53 Activation. Sci. Rep. 2017, 7, 3758. [Google Scholar] [CrossRef]
- Hudish, L.I.; Reusch, J.E.B.; Sussel, L. β Cell Dysfunction during Progression of Metabolic Syndrome to Type 2 Diabetes. J. Clin. Investig. 2019, 129, 4001–4008. [Google Scholar] [CrossRef]
- Nolan, C.J.; Prentki, M. Insulin Resistance and Insulin Hypersecretion in the Metabolic Syndrome and Type 2 Diabetes: Time for a Conceptual Framework Shift. Diabetes Vasc. Dis. Res. 2019, 16, 118–127. [Google Scholar] [CrossRef]
- Azam, N.S.M.; Soh, N.A.C.; Rapi, H.S.; Ismail, N.; Jusoh, A.Z.; Haron, M.N.; Ali, A.M.; Maulidiani, M.; Ismail, W.I.W. In Vivo Study of Subacute Oral Toxicity of Kelulut Honey. Int. Food Res. J. 2022, 29, 1188–1204. [Google Scholar] [CrossRef]
- Gonzalez-Arceo, M.; Gomez-Lopez, I.; Carr-Ugarte, H.; Eseberri, I.; Gonzalez, M.; Cano, M.P.; Portillo, M.P.; Gomez-Zorita, S. Anti-Obesity Effects of Isorhamnetin and Isorhamnetin Conjugates. Int. J. Mol. Sci. 2023, 24, 299. [Google Scholar] [CrossRef] [PubMed]
- Lee, M.S.; Kim, Y. Effects of Isorhamnetin on Adipocyte Mitochondrial Biogenesis and Ampk Activation. Molecules 2018, 23, 1853. [Google Scholar] [CrossRef] [PubMed]
- Tumova, J.; Andel, M.; Trnka, J. Excess of Free Fatty Acids as a Cause of Metabolic Dysfunction in Skeletal Muscle. Physiol. Res. 2016, 65, 193–207. [Google Scholar] [CrossRef]
- Paschos, P.; Paletas, K. Non Alcoholic Fatty Liver Disease and Metabolic Syndrome. Hippokratia 2009, 13, 9–19. [Google Scholar]
- Miah, P.; Mohona, S.B.S.; Rahman, M.M.; Subhan, N.; Khan, F.; Hossain, H.; Sharker, S.M.; Alam, M.A. Supplementation of Cumin Seed Powder Prevents Oxidative Stress, Hyperlipidemia and Non-Alcoholic Fatty Liver in High Fat Diet Fed Rats. Biomed. Pharmacother. 2021, 141, 111908. [Google Scholar] [CrossRef]
- Sergent, T.; Vanderstraeten, J.; Winand, J.; Beguin, P.; Schneider, Y.J. Phenolic Compounds and Plant Extracts as Potential Natural Anti-Obesity Substances. Food Chem. 2012, 135, 68–73. [Google Scholar] [CrossRef]
- Yoon, D.S.; Cho, S.Y.; Yoon, H.J.; Kim, S.R.; Jung, U.J. Protective Effects of P-Coumaric Acid against High-Fat Diet-Induced Metabolic Dysregulation in Mice. Biomed. Pharmacother. 2021, 142, 111969. [Google Scholar] [CrossRef]
- Sun, A.R.J.; Panchal, S.K.; Friis, T.; Sekar, S.; Crawford, R.; Brown, L.; Xiao, Y.; Prasadam, I. Obesity-Associated Metabolic Syndrome Spontaneously Induces Infiltration of pro-Inflammatory Macrophage in Synovium and Promotes Osteoarthritis. PLoS ONE 2017, 12, e0183693. [Google Scholar] [CrossRef]
- Ranneh, Y.; Akim, A.M.; Hamid, H.A.; Khazaai, H.; Fadel, A.; Mahmoud, A.M. Stingless Bee Honey Protects against Lipopolysaccharide Induced-Chronic Subclinical Systemic Inflammation and Oxidative Stress by Modulating Nrf2, NF-ΚB and P38 MAPK. Nutr. Metab. 2019, 16, 15. [Google Scholar] [CrossRef]
- Wang, Z.; Sun, W.; Sun, X.; Wang, Y.; Zhou, M. Kaempferol Ameliorates Cisplatin Induced Nephrotoxicity by Modulating Oxidative Stress, Inflammation and Apoptosis via ERK and NF-ΚB Pathways. AMB Express 2020, 10, 58. [Google Scholar] [CrossRef] [PubMed]
- Huang, X.; You, Y.; Xi, Y.; Ni, B.; Chu, X.; Zhang, R.; You, H. P-Coumaric Acid Attenuates IL-1β-Induced Inflammatory Responses and Cellular Senescence in Rat Chondrocytes. Inflammation 2020, 43, 619–628. [Google Scholar] [CrossRef]
- Jiang, H.; Yamashita, Y.; Nakamura, A.; Croft, K.; Ashida, H. Quercetin and Its Metabolite Isorhamnetin Promote Glucose Uptake through Different Signalling Pathways in Myotubes. Sci. Rep. 2019, 9, 2690. [Google Scholar] [CrossRef] [PubMed]
- Stȩpień, M.; Stȩpień, A.; Wlazeł, R.N.; Paradowski, M.; Banach, M.; Rysz, J. Obesity Indices and Inflammatory Markers in Obese Non-Diabetic Normo- and Hypertensive Patients: A Comparative Pilot Study. Lipids Health Dis. 2014, 13, 29. [Google Scholar] [CrossRef] [PubMed]
- Neves, C.V.B.; Mambrini, J.V.D.M.; Torres, K.C.L.; Teixeira-Carvalho, A.; Martins-Filho, O.A.; Lima-Costa, M.F.; Peixoto, S.V. Association of Metabolic Syndrome with Inflammatory Markers in a Sample of Community-Dwelling Older Adults. Cad. Saude Publica 2019, 35, e00129918. [Google Scholar] [CrossRef] [PubMed]
- Barona, J.; Blesso, C.N.; Andersen, C.J.; Park, Y.; Lee, J.; Fernandez, M.L. Grape Consumption Increases Anti-Inflammatory Markers and Upregulates Peripheral Nitric Oxide Synthase in the Absence of Dyslipidemias in Men with Metabolic Syndrome. Nutrients 2012, 4, 1945–1957. [Google Scholar] [CrossRef]
- Stull, A.J.; Cash, K.C.; Johnson, W.D.; Champagne, C.M.; Cefalu, W.T. Bioactives in Blueberries Improve Insulin Sensitivity in Obese, Insulin-Resistant Men and Women. J. Nutr. 2010, 140, 1764–1768. [Google Scholar] [CrossRef]
- Staab, C.A.; Maser, E. 11β-Hydroxysteroid Dehydrogenase Type 1 Is an Important Regulator at the Interface of Obesity and Inflammation. J. Steroid Biochem. Mol. Biol. 2010, 119, 56–72. [Google Scholar] [CrossRef]
- Walker, G.E.; Marzullo, P.; Prodam, F.; Bona, G.; Di Blasio, A.M. Obesity Modifies Expression Profiles of Metabolic Markers in Superficial and Deep Subcutaneous Abdominal Adipose Tissue Depots. Endocrine 2013, 46, 99–106. [Google Scholar] [CrossRef]
- Masuzaki, H.; Paterson, J.; Shinyama, H.; Morton, N.M.; Mullins, J.J.; Seckl, J.R.; Flier, J.S. A Transgenic Model of Visceral Obesity and the Metabolic Syndrome. Science 2001, 294, 2166–2170. [Google Scholar] [CrossRef]
- Szelényi, P.; Révész, K.; Konta, L.; Tüttõ, A.; Mandl, J.; Kereszturi, É.; Csala, M. Inhibition of Microsomal Cortisol Production by (-)-Epigallocatechin-3-Gallate through a Redox Shift in the Endoplasmic Reticulum-A Potential New Target for Treating Obesity-Related Diseases. BioFactors 2013, 39, 534–541. [Google Scholar] [CrossRef]
- Lee, M.J.; Pramyothin, P.; Karastergiou, K.; Fried, S.K. Deconstructing the Roles of Glucocorticoids in Adipose Tissue Biology and the Development of Central Obesity. Biochim. Biophys. Acta-Mol. Basis Dis. 2014, 1842, 473–481. [Google Scholar] [CrossRef] [PubMed]
- Deng, G.; Long, Y.; Yu, Y.R.; Li, M.R. Adiponectin Directly Improves Endothelial Dysfunction in Obese Rats through the AMPK-ENOS Pathway. Int. J. Obes. (Lond). 2010, 34, 165–171. [Google Scholar] [CrossRef]
- Achari, A.E.; Jain, S.K. Adiponectin, a Therapeutic Target for Obesity, Diabetes, and Endothelial Dysfunction. Int. J. Mol. Sci. 2017, 18, 1321. [Google Scholar] [CrossRef]
- Wang, C.; Mao, X.; Wang, L.; Liu, M.; Wetzel, M.D.; Guan, K.L.; Dong, L.Q.; Liu, F. Adiponectin Sensitizes Insulin Signaling by Reducing P70 S6 Kinase-Mediated Serine Phosphorylation of IRS-1. J. Biol. Chem. 2007, 282, 7991–7996. [Google Scholar] [CrossRef] [PubMed]
- Rakatzi, I.; Mueller, H.; Ritzeler, O.; Tennagels, N.; Eckel, J. Adiponectin Counteracts Cytokine- and Fatty Acid-Induced Apoptosis in the Pancreatic Beta-Cell Line INS-1. Diabetologia 2004, 47, 249–258. [Google Scholar] [CrossRef] [PubMed]
- Shin, M.K.; Eraso, C.C.; Mu, Y.P.; Gu, C.; Yeung, B.H.Y.; Kim, L.J.; Liu, X.R.; Wu, Z.J.; Paudel, O.; Pichard, L.E.; et al. Leptin Induces Hypertension Acting on Transient Receptor Potential Melastatin 7 Channel in the Carotid Body. Circ. Res. 2019, 125, 989–1002. [Google Scholar] [CrossRef]
- Xue, B.; Yu, Y.; Zhang, Z.; Guo, F.; Beltz, T.G.; Thunhorst, R.L.; Felder, R.B.; Johnson, A.K. Leptin Mediates High-Fat Diet Sensitization of Angiotensin II-Elicited Hypertension by Upregulating the Brain Renin-Angiotensin System and Inflammation. Hypertension 2016, 67, 970–976. [Google Scholar] [CrossRef]
- Kalil, G.Z.; Haynes, W.G. Sympathetic Nervous System in Obesity-Related Hypertension: Mechanisms and Clinical Implications. Hypertens. Res. 2012, 35, 4–16. [Google Scholar] [CrossRef]
- Godoy-Lugo, J.A.; Mendez, D.A.; Rodriguez, R.; Nishiyama, A.; Nakano, D.; Soñanez-Organis, J.G.; Ortiz, R.M. Improved Lipogenesis Gene Expression in Liver Is Associated with Elevated Plasma Angiotensin 1-7 after AT1 Receptor Blockade in Insulin-Resistant OLETF Rats. Mol. Cell. Endocrinol. 2022, 555, 111729. [Google Scholar] [CrossRef]
- Suzuki, T.; Muramatsu, T.; Morioka, K.; Goda, T.; Mochizuki, K. ChREBP Binding and Histone Modifications Modulate Hepatic Expression of the Fasn Gene in a Metabolic Syndrome Rat Model. Nutrition 2015, 31, 877–883. [Google Scholar] [CrossRef] [PubMed]
- Matsuzaka, T.; Shimano, H.; Yahagi, N.; Amemiya-Kudo, M.; Okazaki, H.; Tamura, Y.; Iizuka, Y.; Ohashi, K.; Tomita, S.; Sekiya, M.; et al. Insulin-Independent Induction of Sterol Regulatory Element-Binding Protein-1c Expression in the Livers of Streptozotocin-Treated Mice. Diabetes 2004, 53, 560–569. [Google Scholar] [CrossRef] [PubMed]
- Gómez-Zorita, S.; Lasa, A.; Abendaño, N.; Fernández-Quintela, A.; Mosqueda-Solís, A.; Garcia-Sobreviela, M.P.; Arbonés-Mainar, J.M.; Portillo, M.P. Phenolic Compounds Apigenin, Hesperidin and Kaempferol Reduce in Vitro Lipid Accumulation in Human Adipocytes. J. Transl. Med. 2017, 15, 237. [Google Scholar] [CrossRef] [PubMed]
- Kek, S.P.; Chin, N.L.; Yusof, Y.A.; Tan, S.W.; Chua, L.S. Classification of Entomological Origin of Honey Based on Its Physicochemical and Antioxidant Properties. Int. J. Food Prop. 2018, 20, S2723–S2738. [Google Scholar] [CrossRef]


| No. | Mass (Da) | Compound Name | Formula |
|---|---|---|---|
| 1 | 404.0896 | Cnidimonal | C23H16O7 |
| 2 | 610.13226 | Epigallocatechin(4β,8)-gallocatechin | C30H26O14 |
| 3 | 678.15847 | 1,3,5-O-Tricaffeoyl-quinic acid | C34H30O15 |
| 4 | 368.11073 | 5-Feruloylquinic acid | C17H20O9 |
| 5 | 164.04734 | E-p-coumaric acid | C9H8O3 |
| 6 | 368.11073 | Methyl chlorogenate | C17H20O9 |
| 7 | 594.15847 | Kaempferol-3-O-neohesperidoside | C27H30O15 |
| 8 | 594.15847 | Kaempferol-3-O-rutinoside | C27H30O15 |
| 9 | 580.17921 | Naringin | C27H32O14 |
| 10 | 768.21129 | Viscumneoside VII | C34H40O20 |
| 11 | 770.22694 | Isorhamnetin-3-O-(2G-α-l-rhamnosyl)-rutinoside | C34H42O20 |
| 12 | 450.11621 | Luteolin-7-O-α-d-glucoside | C21H22O11 |
| 13 | 450.11621 | Neoastilbin | C21H22O11 |
| 14 | 576.12678 | Procyanidin A2 | C30H24O12 |
| 15 | 468.10565 | Apocynin B | C24H20O10 |
| 16 | 610.15338 | Kaempferol-3,7-di-O-β-d-glucoside | C27H30O16 |
| 17 | 624.16903 | Isorhamnetin-3-O-β-rutinoside | C28H32O16 |
Disclaimer/Publisher’s Note: The statements, opinions and data contained in all publications are solely those of the individual author(s) and contributor(s) and not of MDPI and/or the editor(s). MDPI and/or the editor(s) disclaim responsibility for any injury to people or property resulting from any ideas, methods, instructions or products referred to in the content. |
© 2023 by the authors. Licensee MDPI, Basel, Switzerland. This article is an open access article distributed under the terms and conditions of the Creative Commons Attribution (CC BY) license (https://creativecommons.org/licenses/by/4.0/).
Share and Cite
Hashim, K.-N.; Chin, K.-Y.; Ahmad, F. The Mechanism of Kelulut Honey in Reversing Metabolic Changes in Rats Fed with High-Carbohydrate High-Fat Diet. Molecules 2023, 28, 2790. https://doi.org/10.3390/molecules28062790
Hashim K-N, Chin K-Y, Ahmad F. The Mechanism of Kelulut Honey in Reversing Metabolic Changes in Rats Fed with High-Carbohydrate High-Fat Diet. Molecules. 2023; 28(6):2790. https://doi.org/10.3390/molecules28062790
Chicago/Turabian StyleHashim, Khairun-Nisa, Kok-Yong Chin, and Fairus Ahmad. 2023. "The Mechanism of Kelulut Honey in Reversing Metabolic Changes in Rats Fed with High-Carbohydrate High-Fat Diet" Molecules 28, no. 6: 2790. https://doi.org/10.3390/molecules28062790
APA StyleHashim, K.-N., Chin, K.-Y., & Ahmad, F. (2023). The Mechanism of Kelulut Honey in Reversing Metabolic Changes in Rats Fed with High-Carbohydrate High-Fat Diet. Molecules, 28(6), 2790. https://doi.org/10.3390/molecules28062790