

Vanadium Extraction from the Flotation Concentrate of Vanadium-Bearing Shale by Process of Non-Roasting Enhanced Acid Leaching and Thermodynamics

Abstract
:1. Introduction
2. Results and Discussion
2.1. Thermodynamics
2.1.1. Basic Analysis of Gibbs Free Energy Change
2.1.2. Dissolution Reaction of Vanadium-Bearing Mica
Dissolution Reaction of Vanadium
Dissolution Reaction of Aluminum
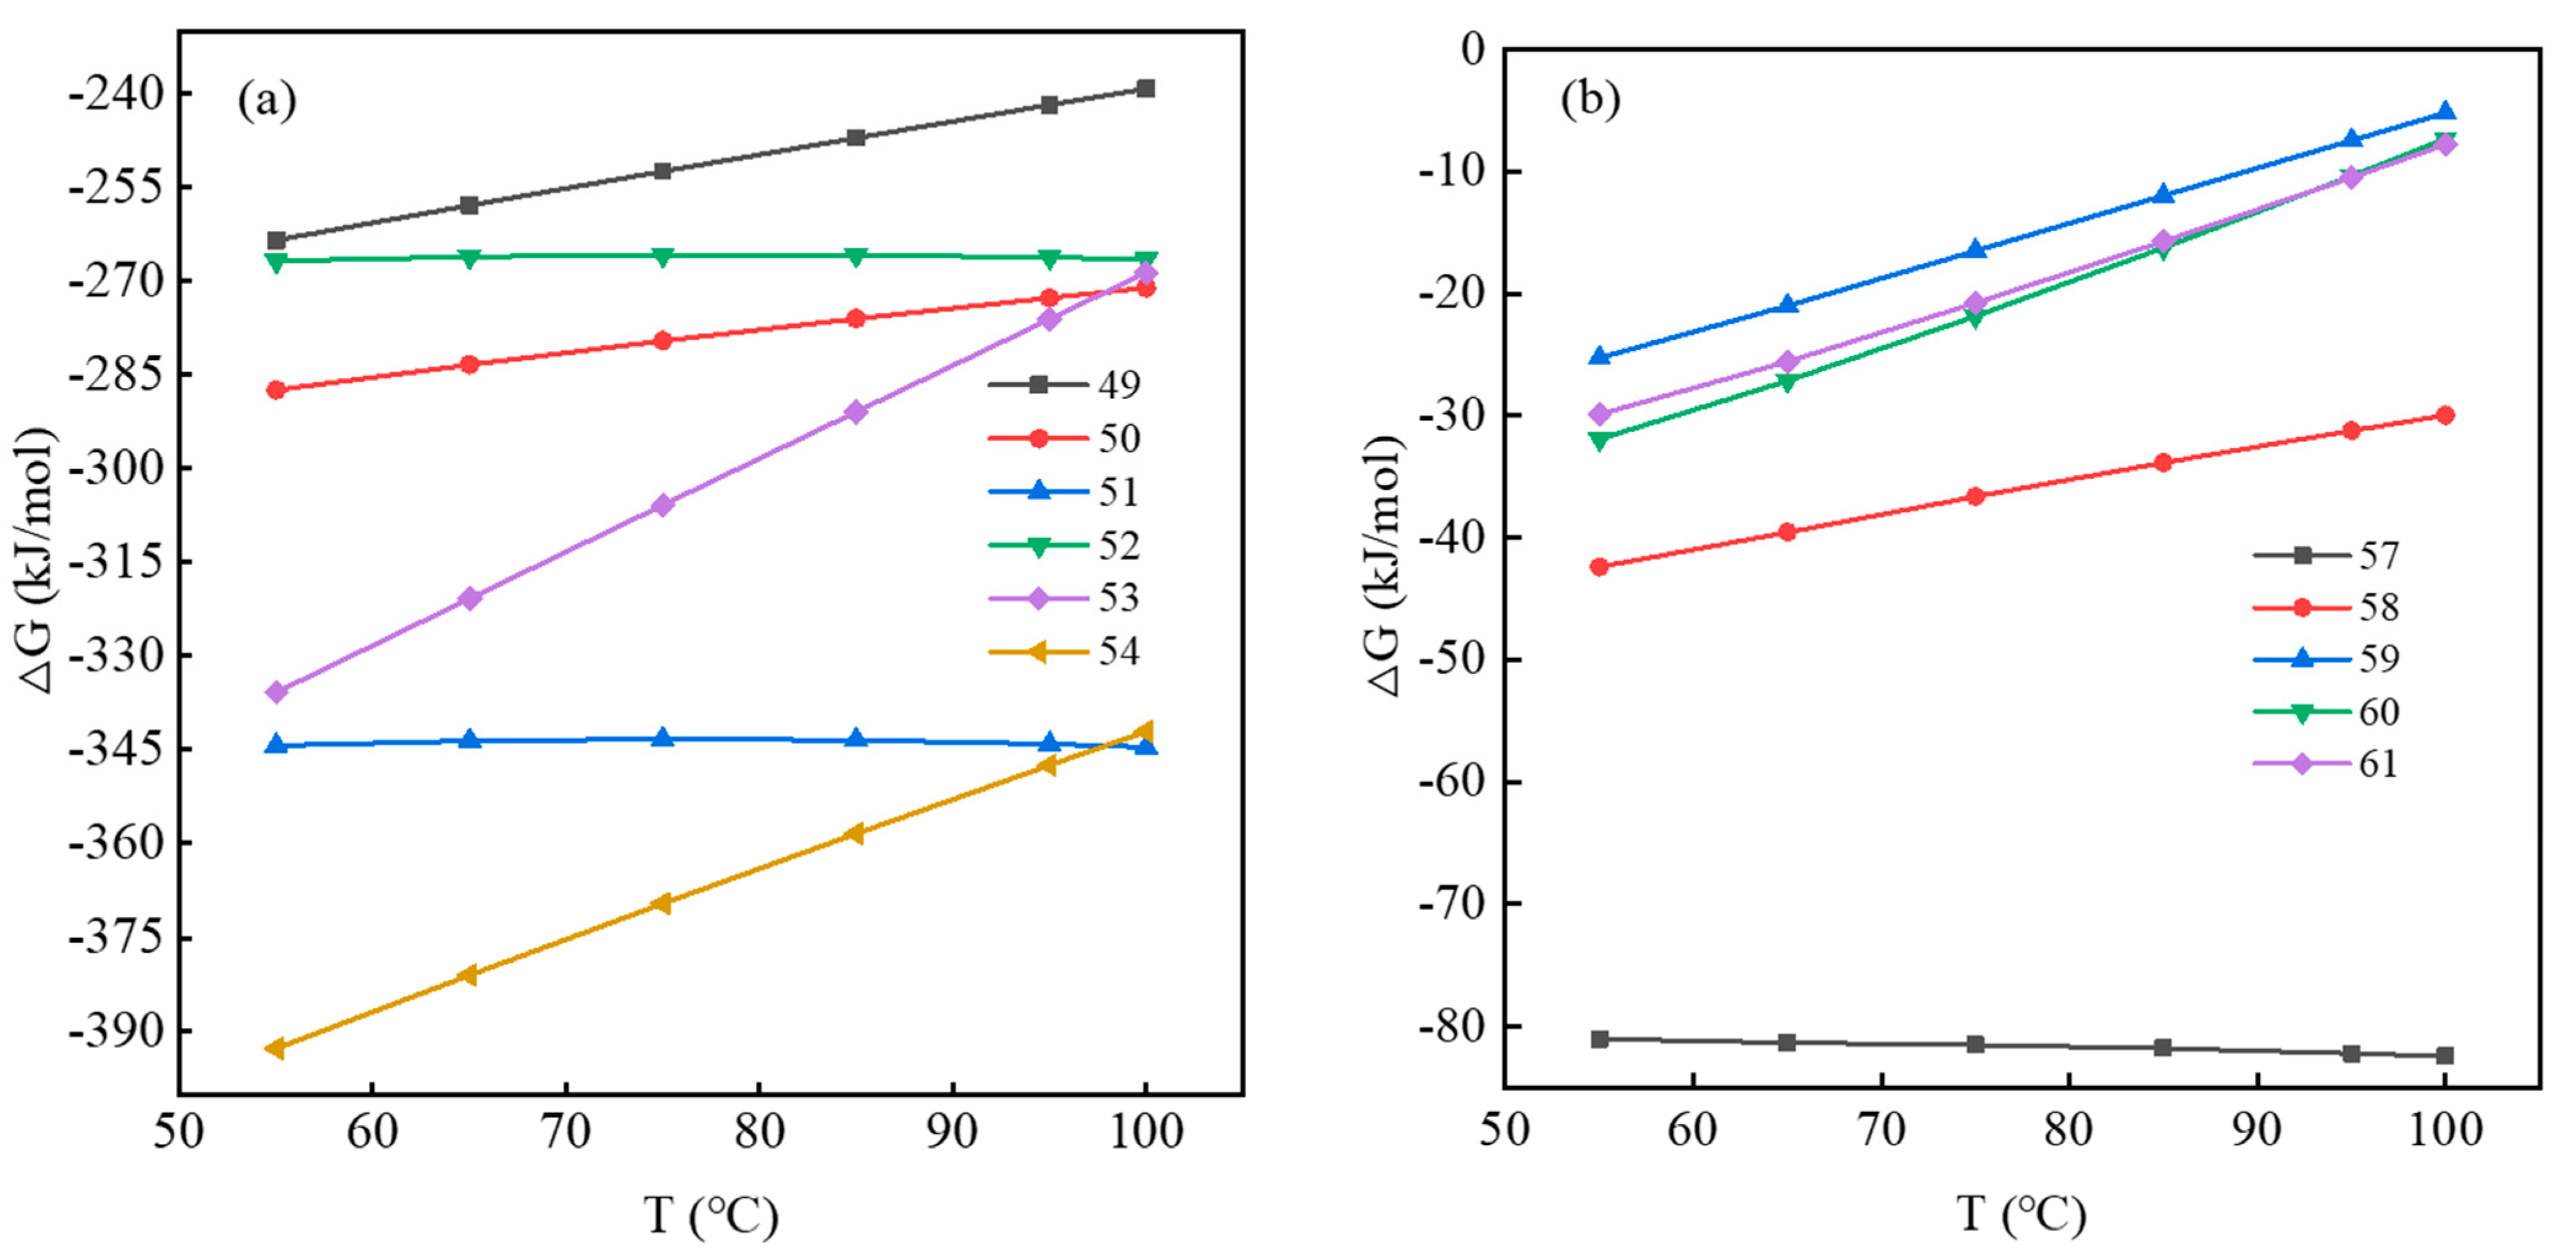
Gibbs Free Energy of Vanadium-Bearing Mica Dissolution Reaction
2.1.3. Dissolution Reaction of Vanadium-Bearing Garnet
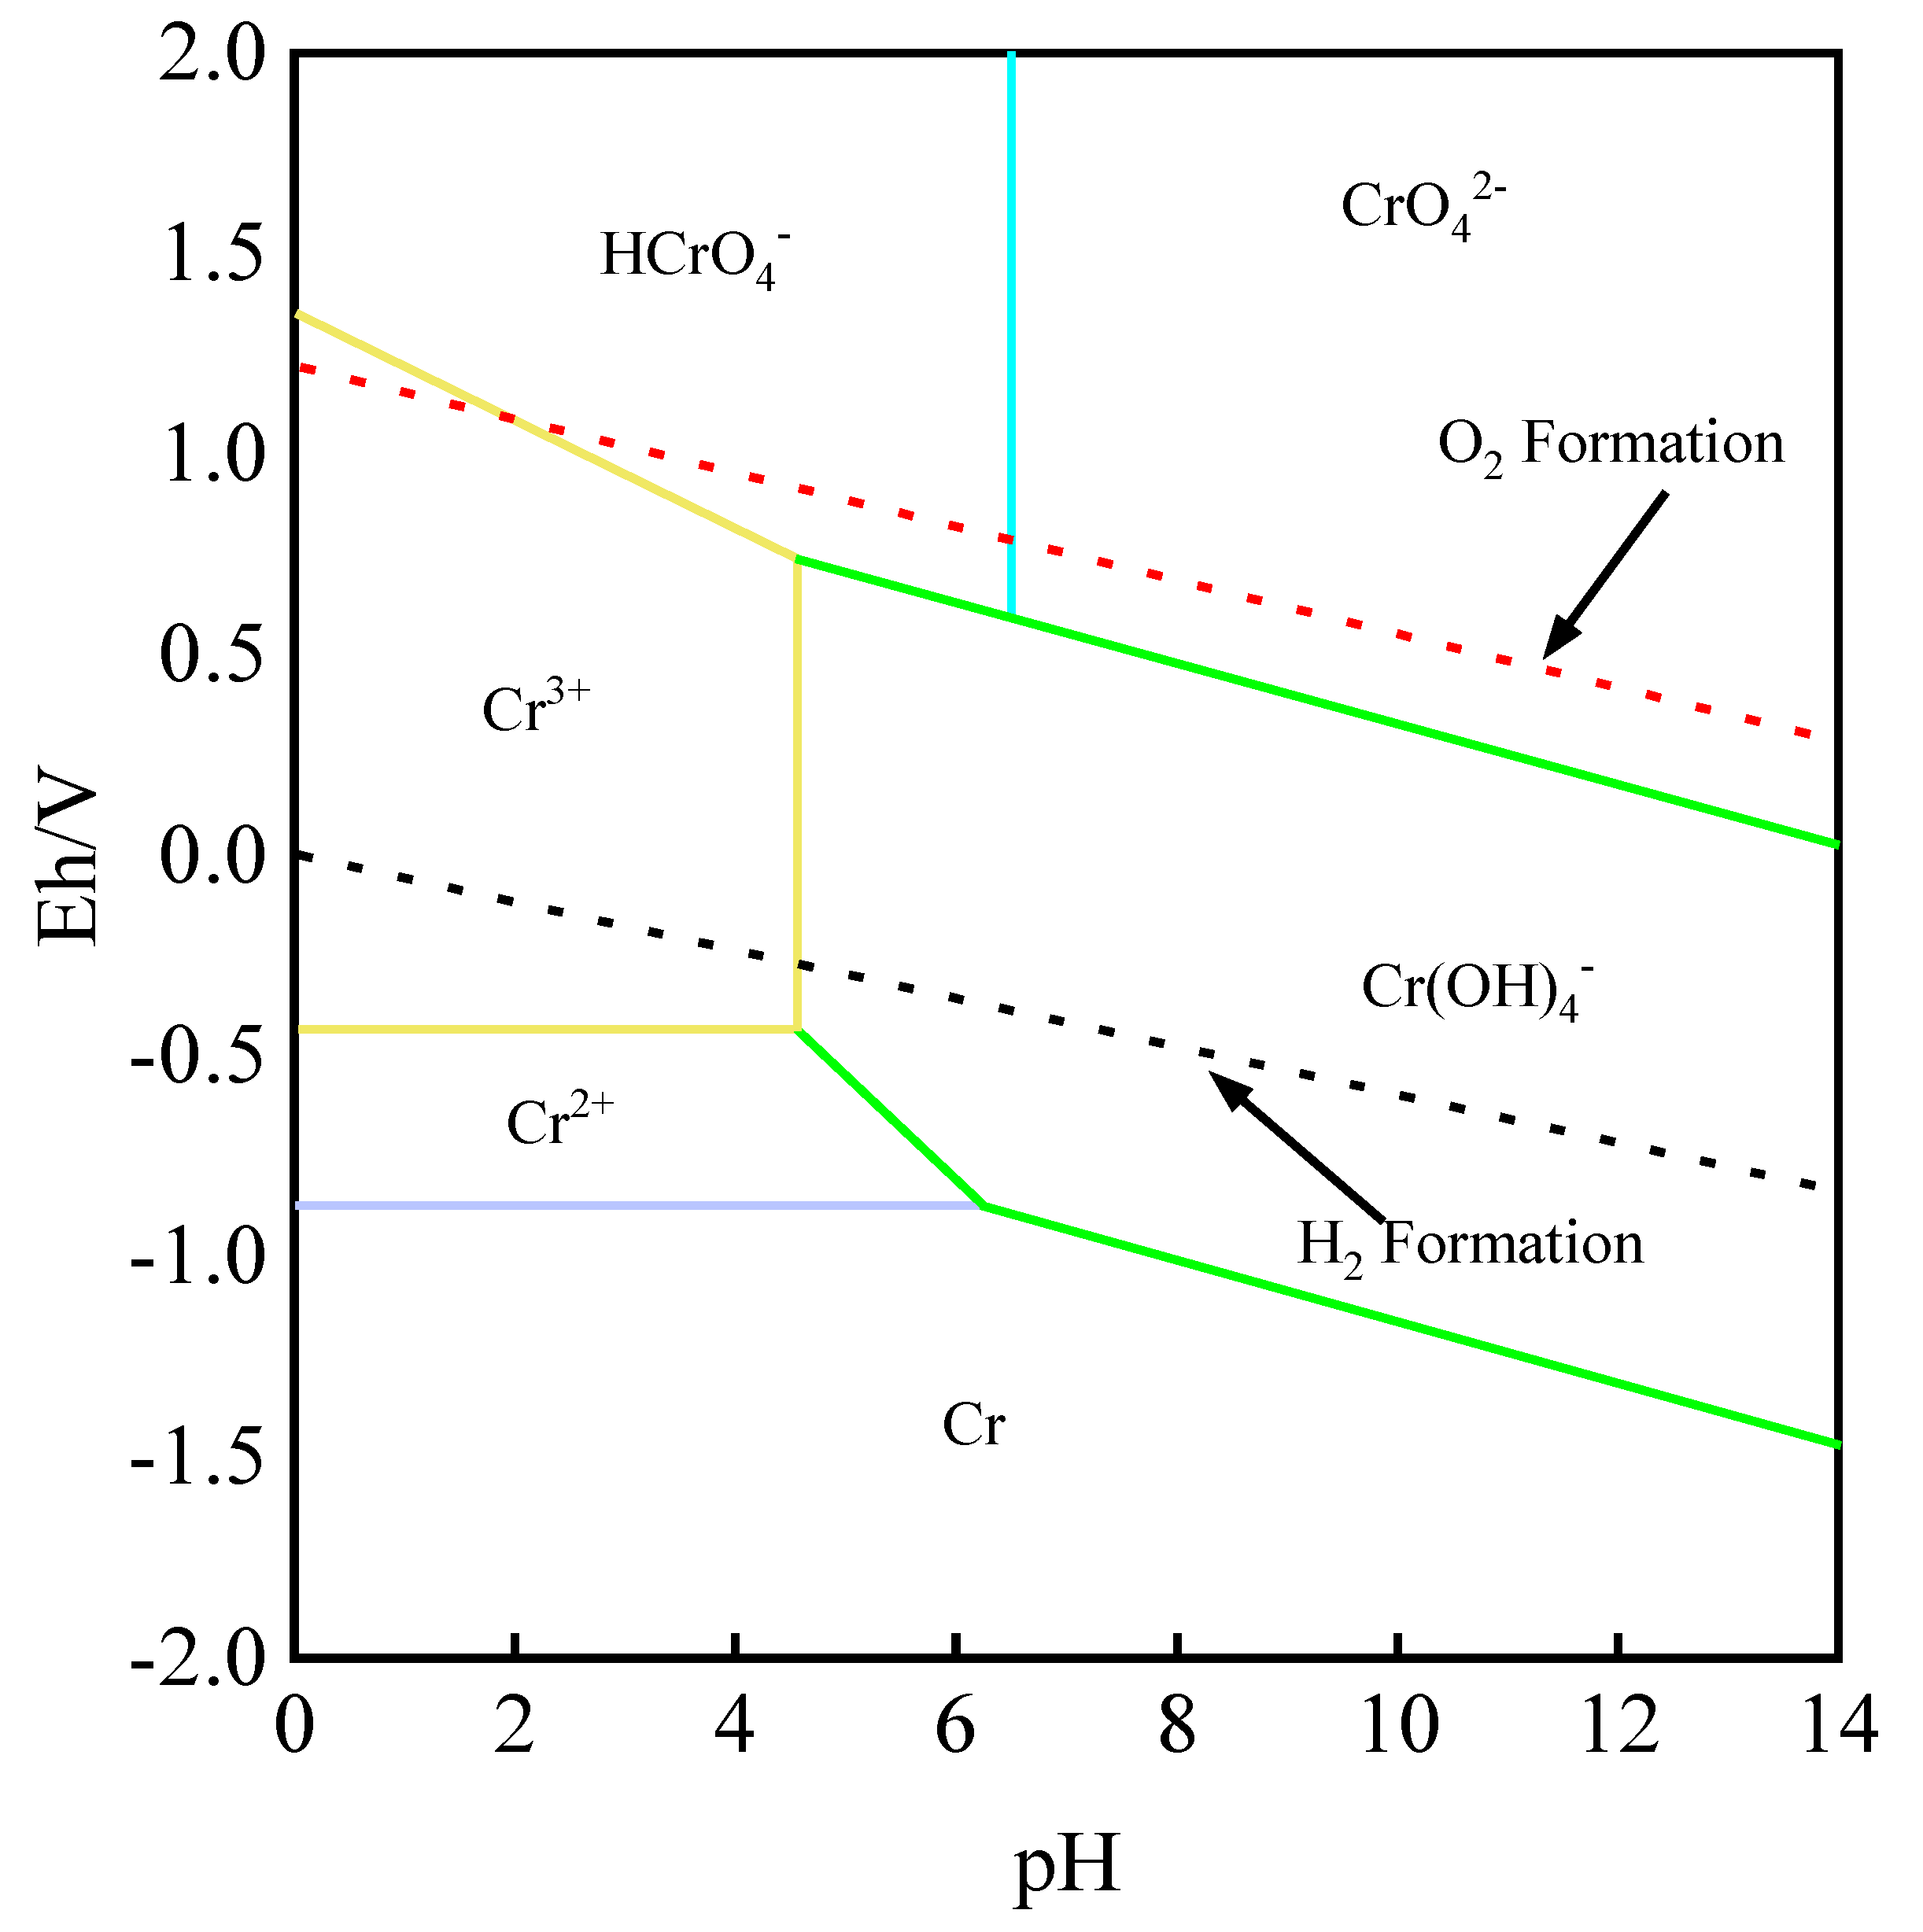
Dissolution Reaction of Chromium
Gibbs Free Energy of Vanadium Bearing Garnet Dissolution Reaction
2.2. Leaching
2.2.1. Effect of Sulfuric Acid Dosage on Leaching
2.2.2. Effect of Time on Leaching
2.2.3. Effect of Liquid–Solid Ratio on Leaching
2.2.4. Effect of MnO2 Dosage on Leaching
2.2.5. Effect of CaF2 Dosage on Leaching
2.2.6. Effect of Temperature on Leaching
2.3. XRD Analysis
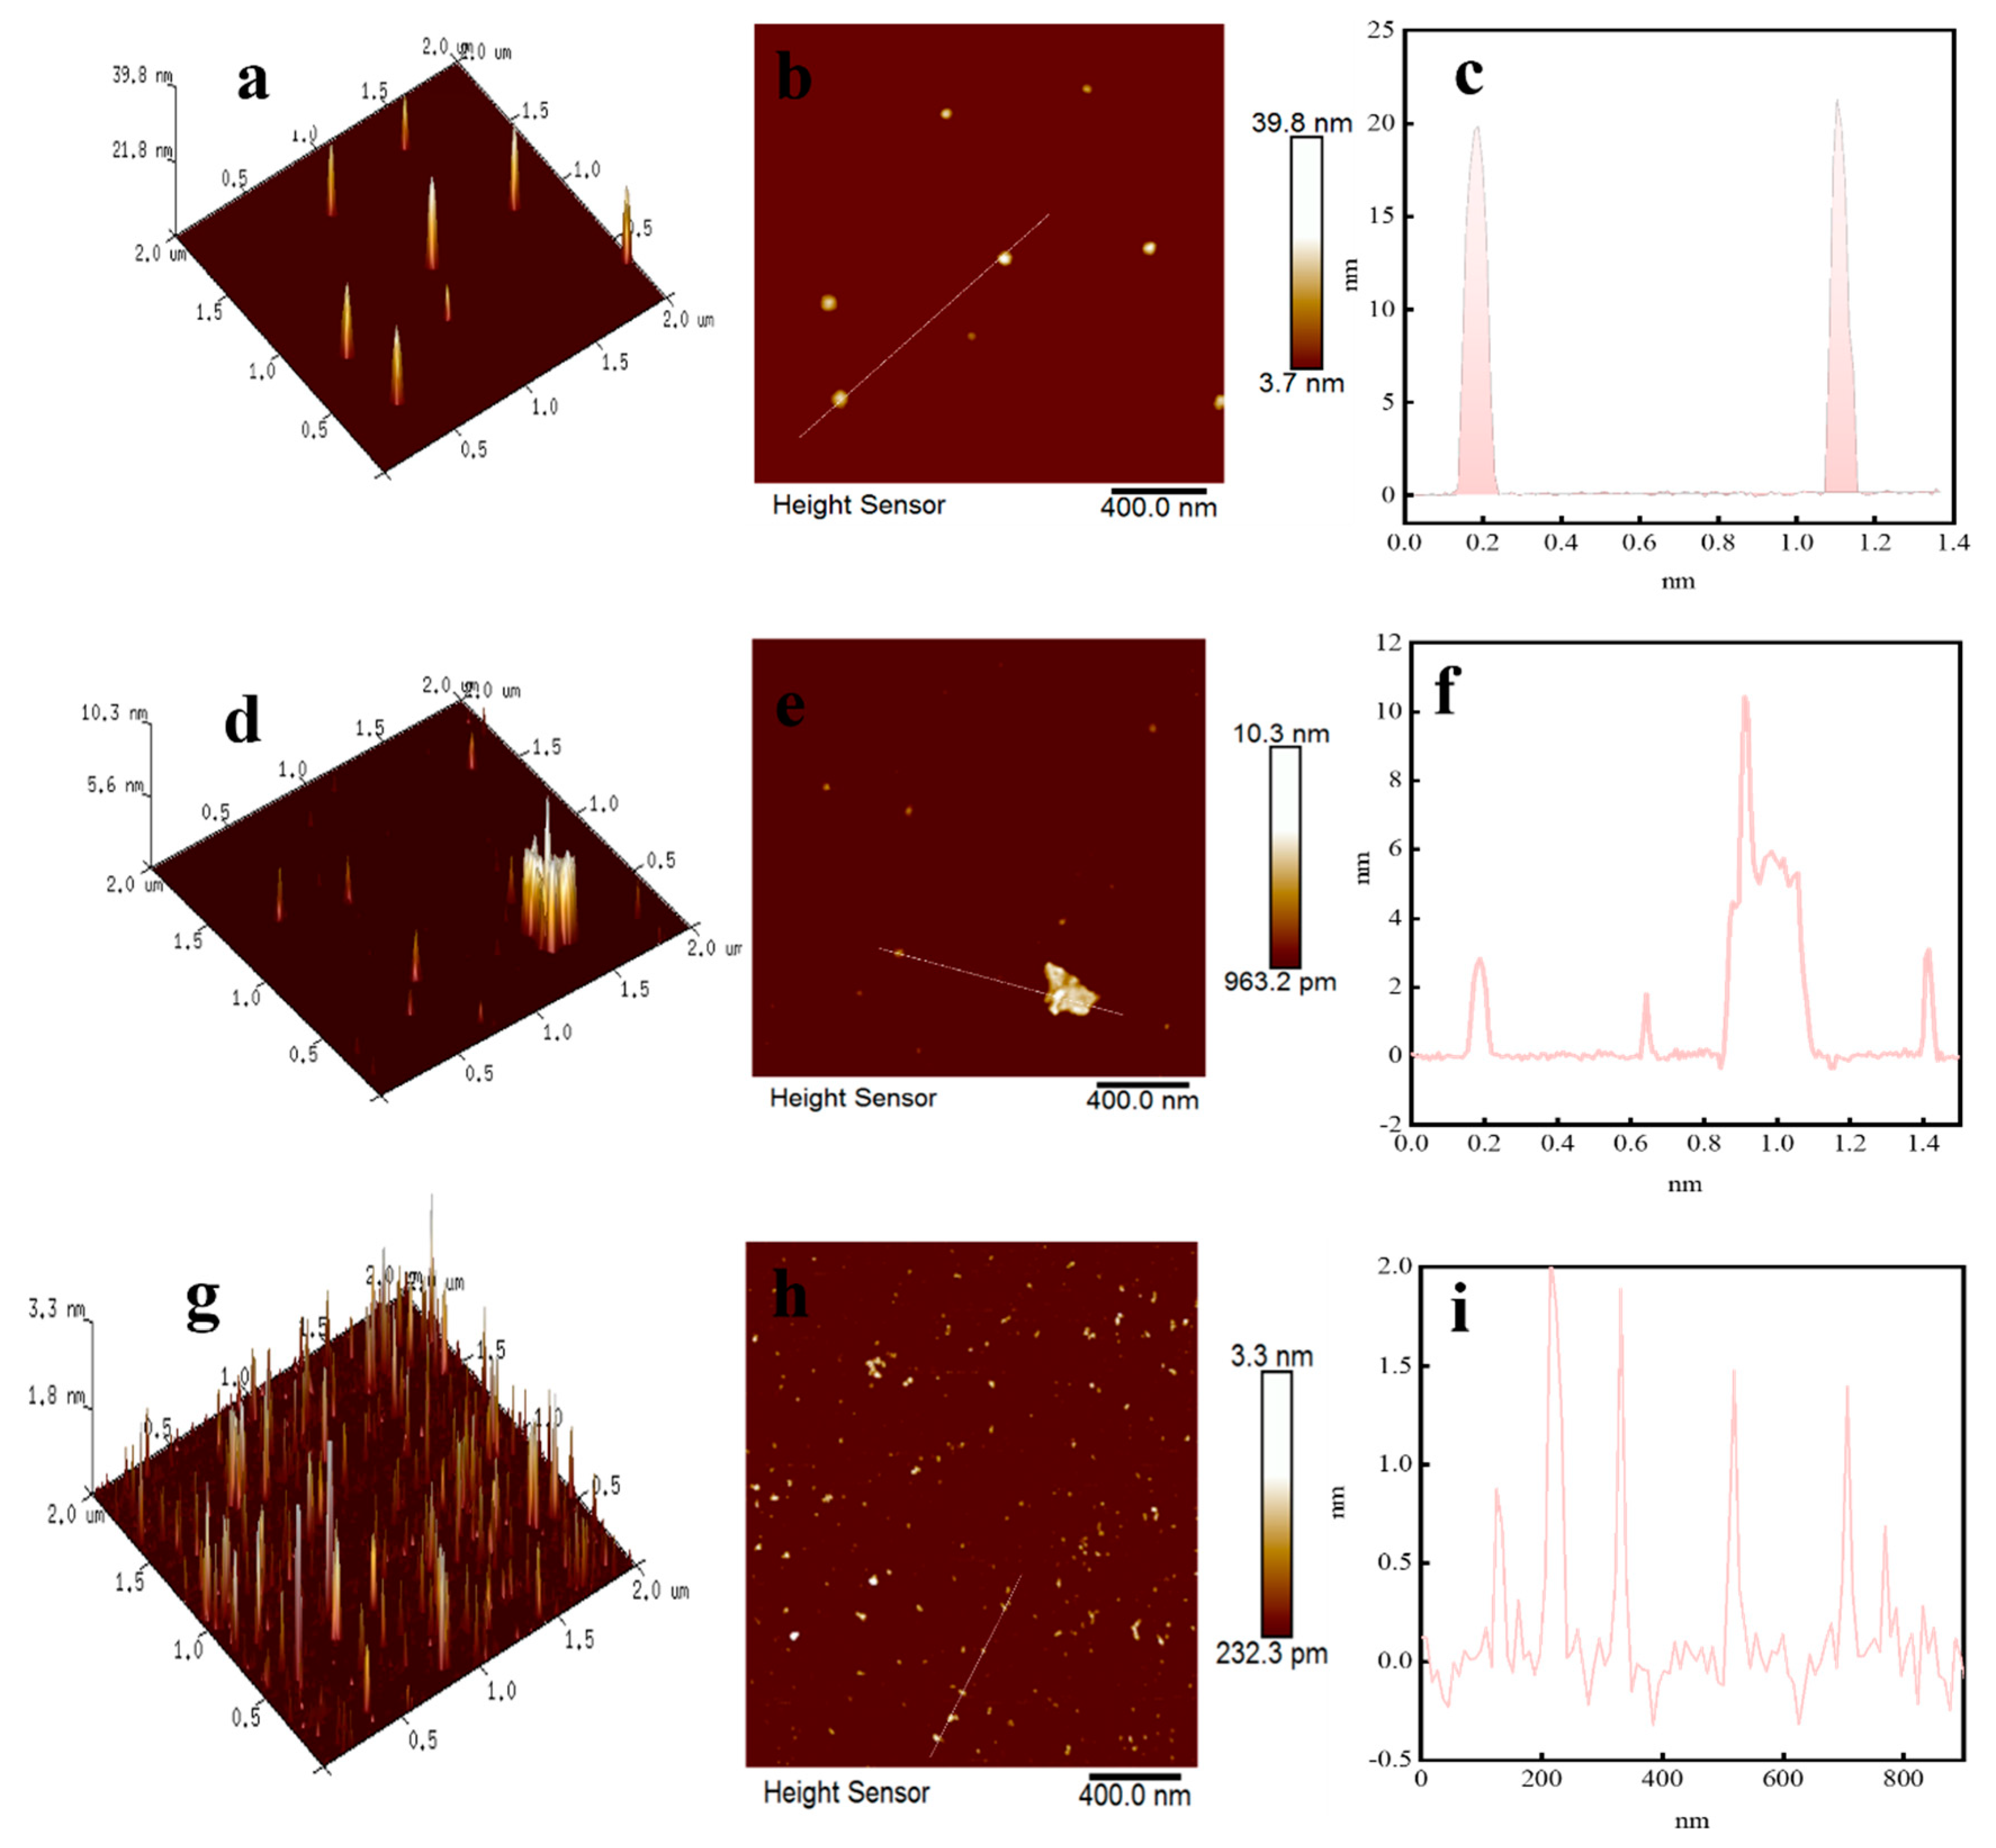
2.4. AFM Analysis
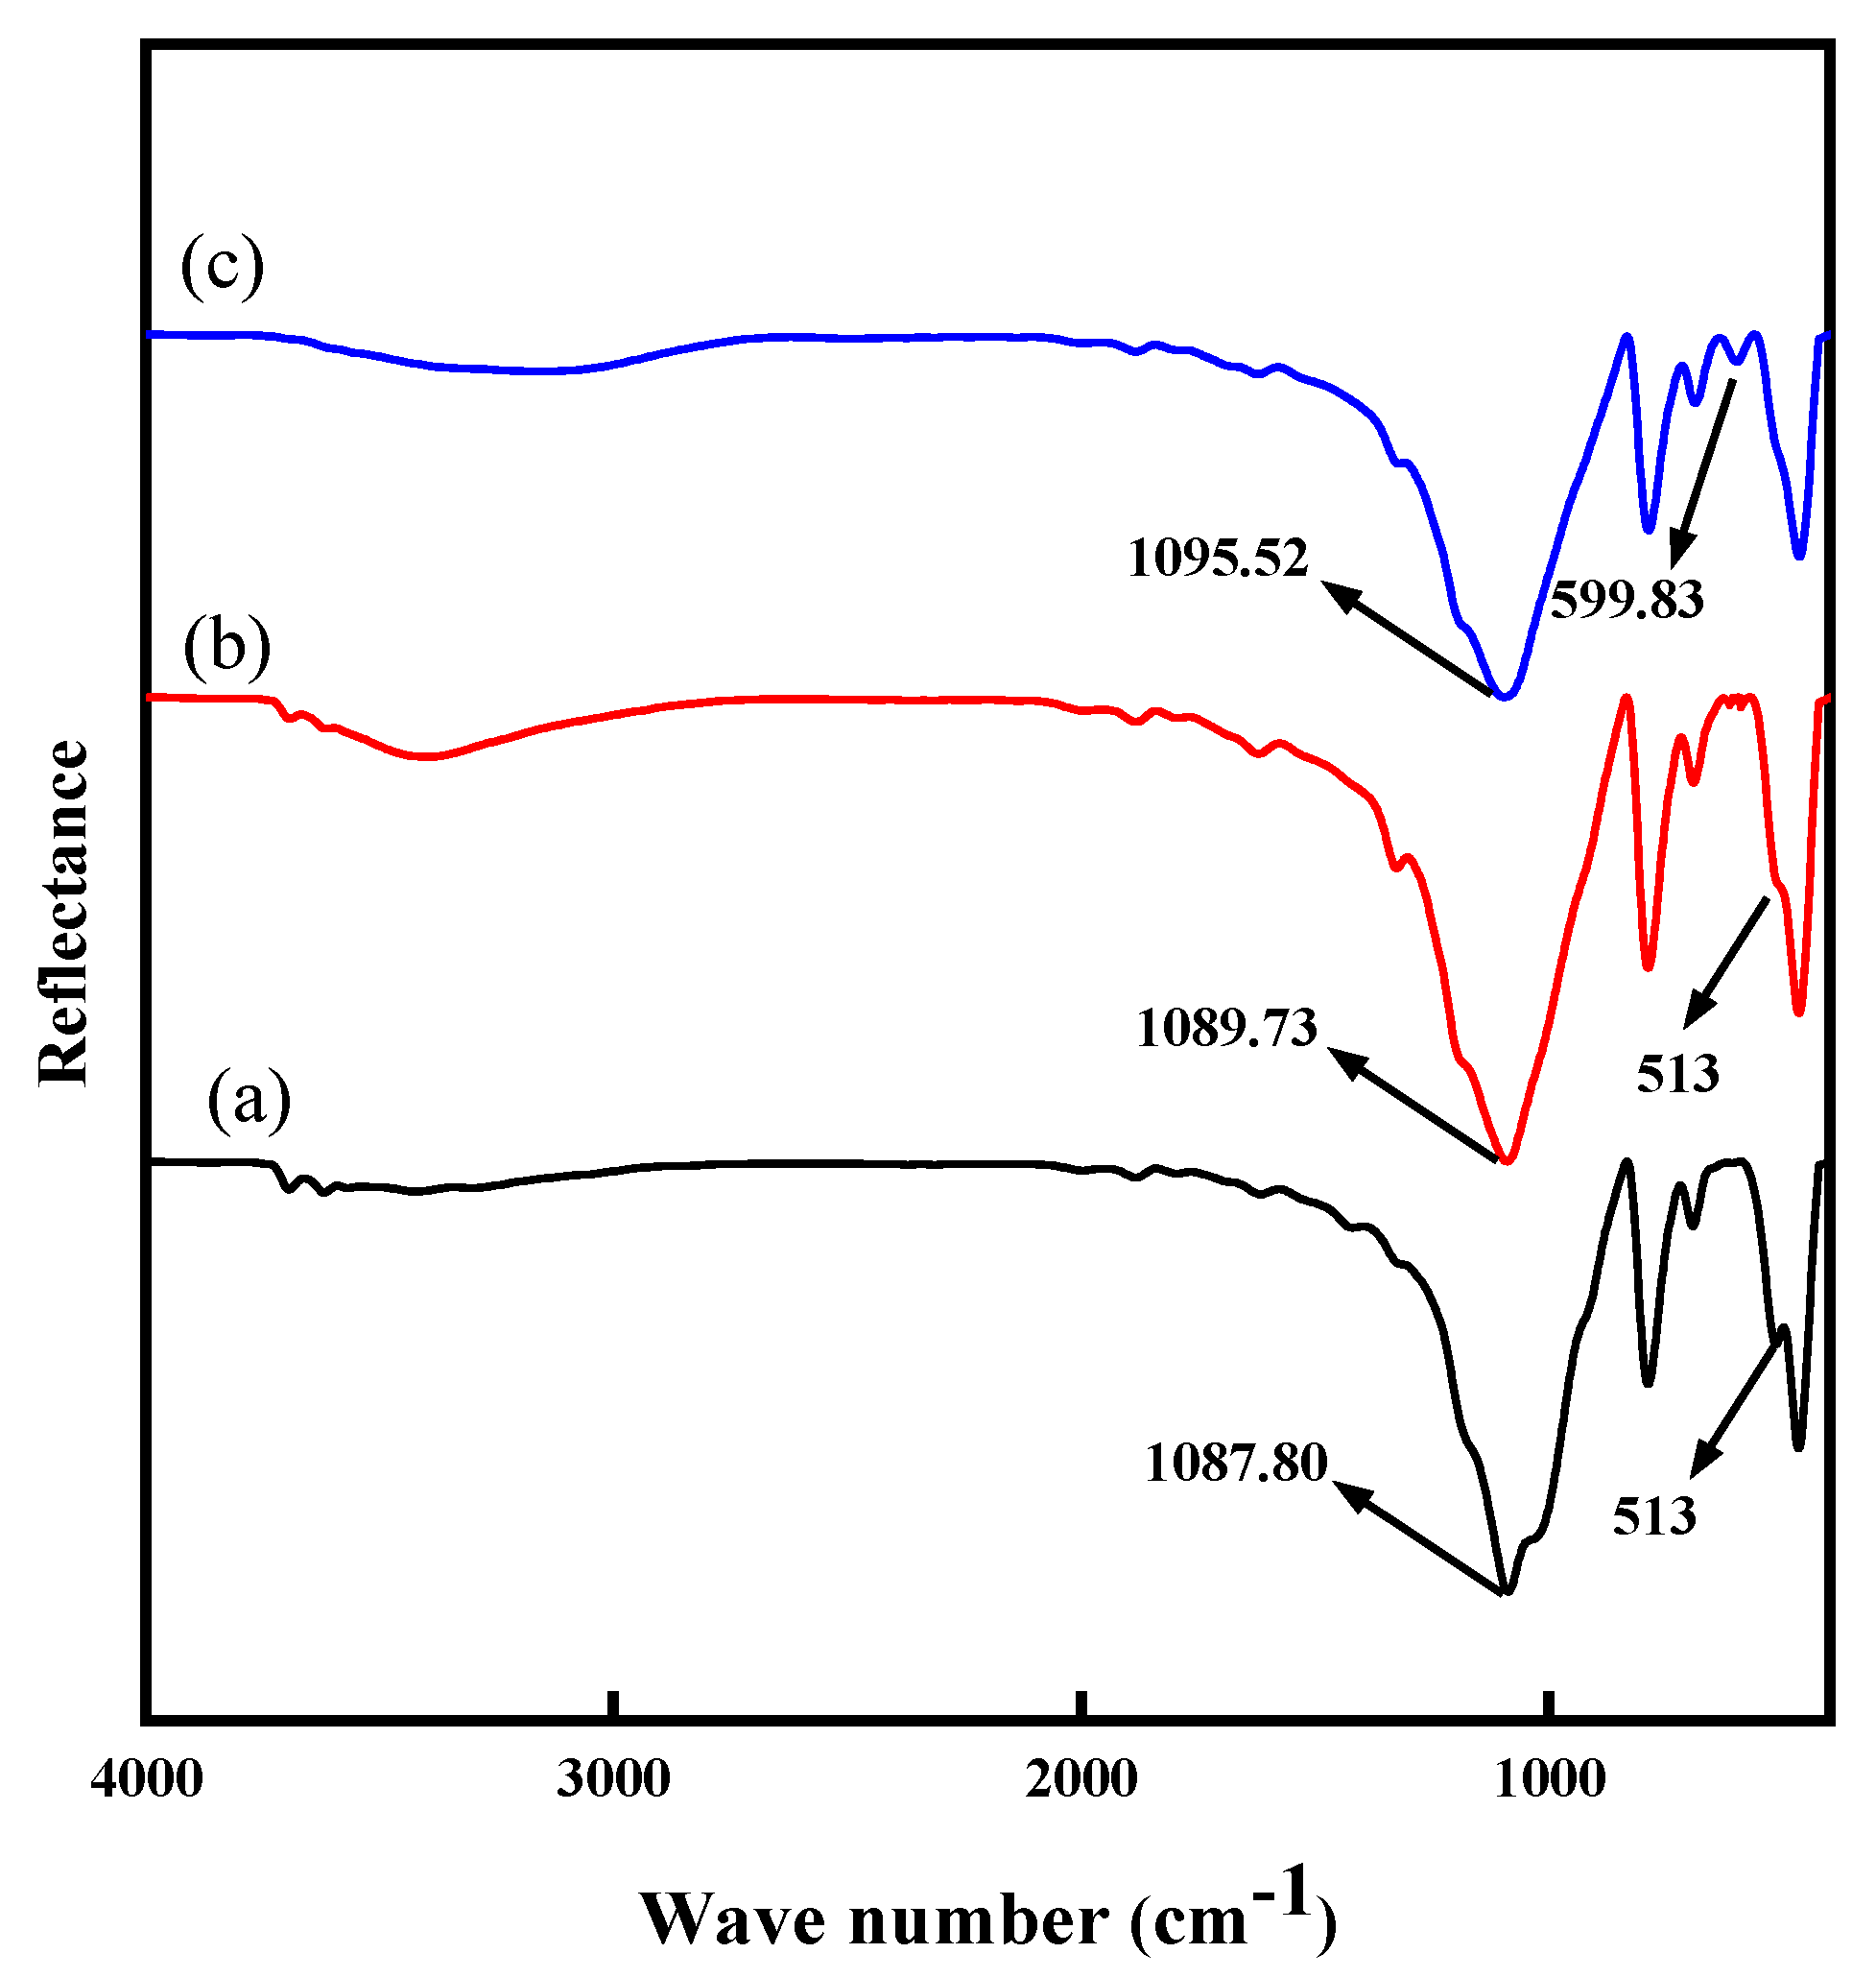
2.5. FT-IR Analysis
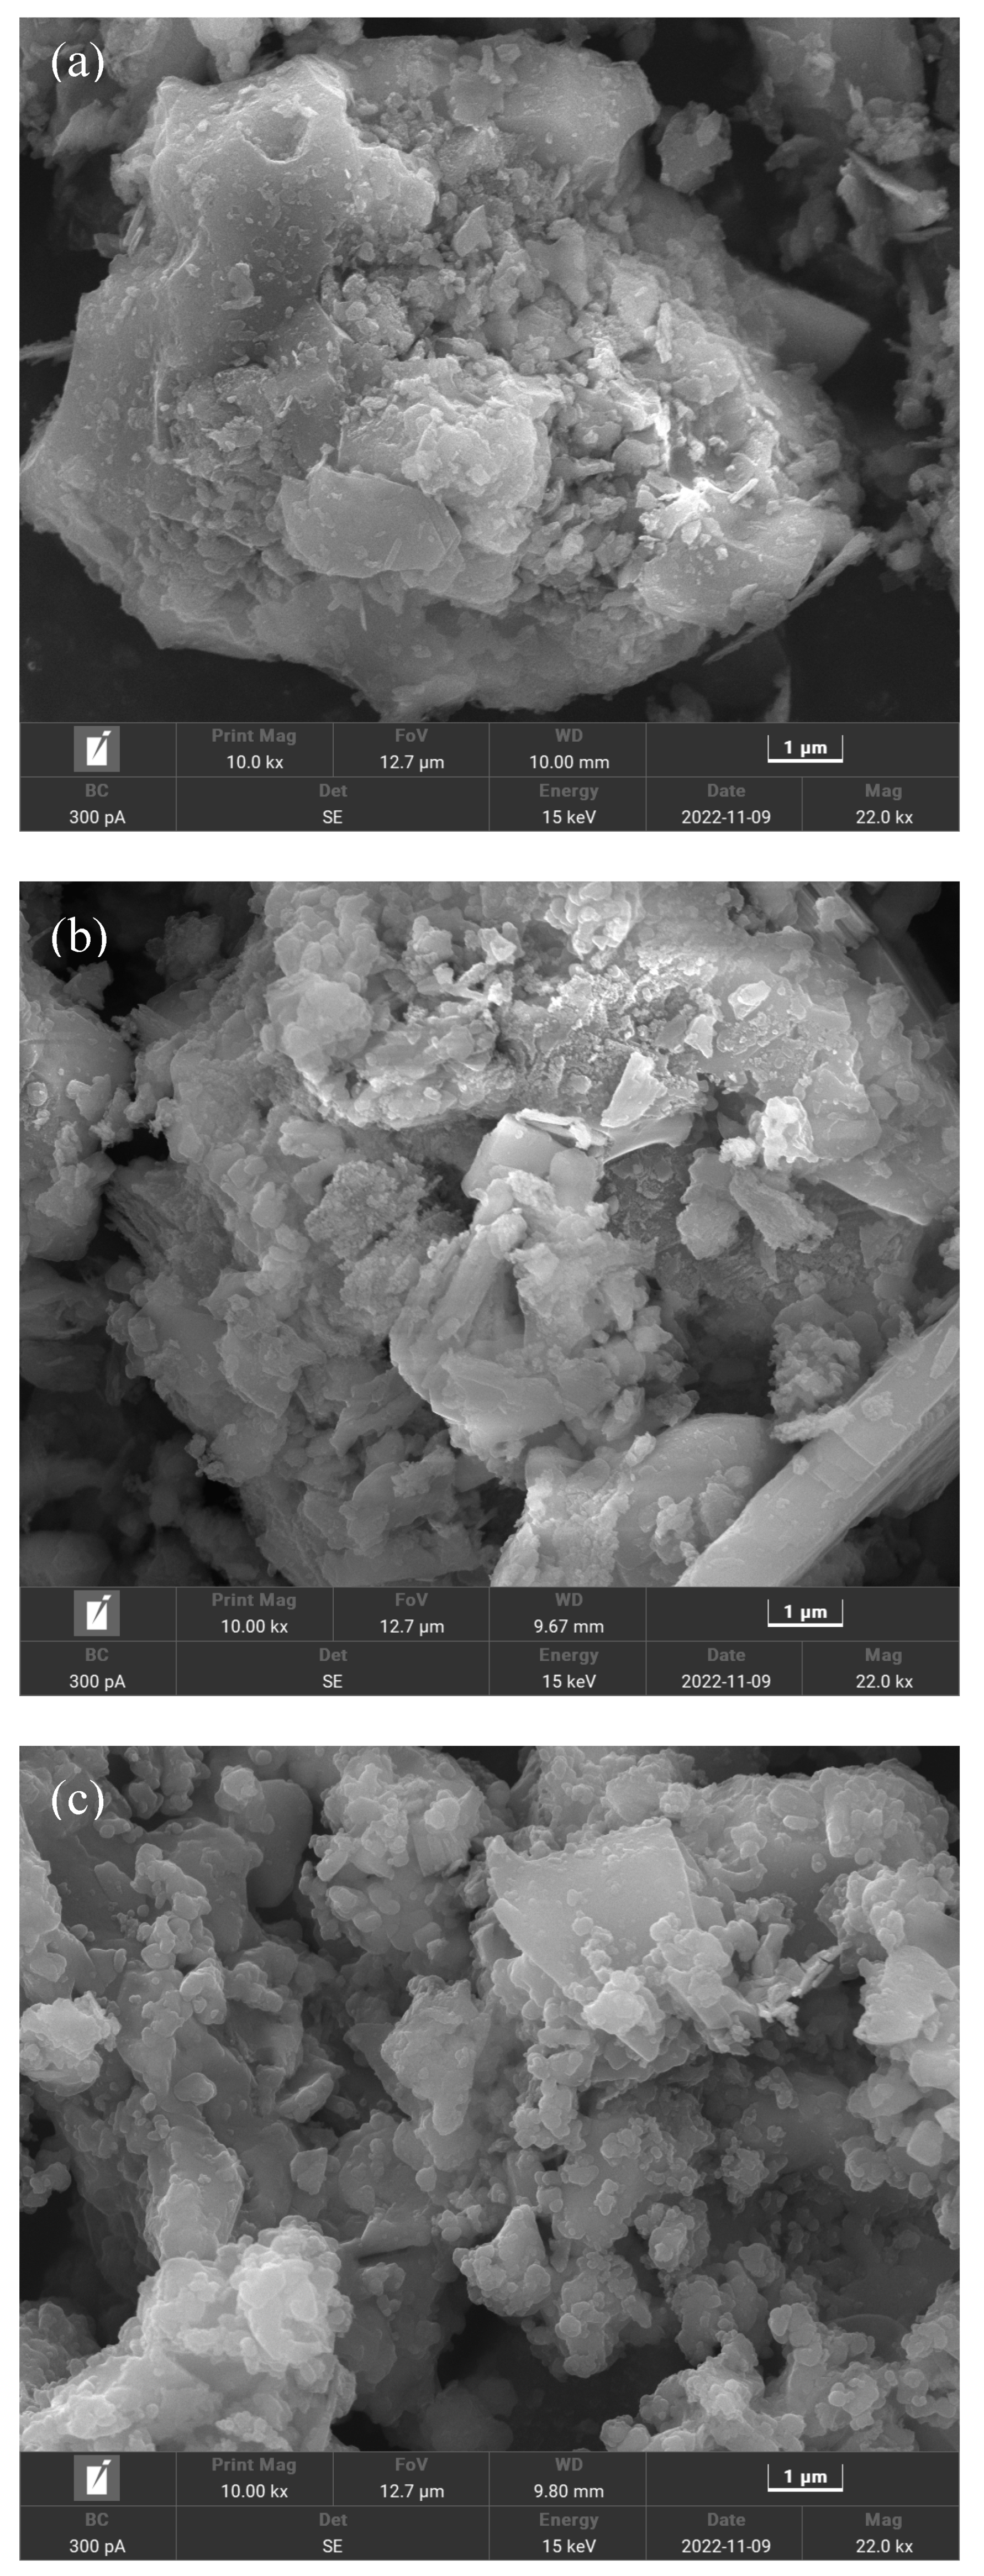
2.6. SEM Analysis
3. Experimental
3.1. Materials and Reagents
3.2. Thermodynamics
3.3. Leaching
3.4. XRD Analysis
3.5. AFM Analysis
3.6. FT-IR Analysis
3.7. SEM Analysis
4. Conclusions
Author Contributions
Funding
Institutional Review Board Statement
Informed Consent Statement
Data Availability Statement
Conflicts of Interest
References
- Schulz, K.J.; DeYoung, J.H.; Seal, R.R.; Bradley, D.C. Critical Mineral Resources of the United States-An Introduction; U.S. Geological Survey: Reston, VA, USA, 2017; p. 2-92017.
- Liu, Z.S.; Huang, J.; Zhang, Y.M.; Liu, T.; Hu, P.C.; Liu, H.; Zheng, Q.S. Separation and recovery of vanadium and iron from oxalic-acid-based shale leachate by coextraction and stepwise stripping. Sep. Purif. Technol. 2020, 244, 116532. [Google Scholar] [CrossRef]
- Tang, Y.; Ye, G.H.; Zhang, H.; Kang, X.X.; Zhu, S.Q.; Liang, X.Y. Solvent extraction of vanadium with D2EHPA from aqueous leachate of stone coal after low–temperature sulfation roasting. Colloids Surf. A Physicochem. Eng. Asp. 2022, 650, 129584. [Google Scholar] [CrossRef]
- Zhang, H.; Ye, G.H.; Chen, Z.Y.; Tang, Y.; Tao, Y.Y.; Hu, Y.J. Complexation and activation of fluoride ion and its acceleration for dissolution of cations on the surface of vanadium-containing biotite (0 0 2). Appl. Surf. Sci. 2022, 586, 152767. [Google Scholar] [CrossRef]
- Chen, Z.Y.; Ye, G.H.; Xiang, P.Z.; Tao, Y.Y.; Tang, Y.; Hu, Y.J. Effect of activator on kinetics of direct acid leaching of vanadium from clay vanadium ore. Sep. Purif. Technol. 2022, 281, 119937. [Google Scholar] [CrossRef]
- Dong, Y.B.; Lin, H.; Liu, Y.; Zhao, Y. Blank roasting and bioleaching of stone coal for vanadium recycling. J. Clean. Prod. 2020, 243, 118625. [Google Scholar] [CrossRef]
- Zhang, C.Q.; Sun, C.Y.; Li, H.; Yin, W.Z.; Zhou, J.J. Blank roasting kinetics of illite type vanadium bearing stone coal. J. Mater. Res. Technol. 2020, 9, 7363–7369. [Google Scholar] [CrossRef]
- Ye, P.H.; Wang, X.W.; Wang, M.Y.; Fan, Y.Y.; Xiang, X.Y. Recovery of vanadium from stone coal acid leaching solution by coprecipitation, alkaline roasting and water leaching. Hydrometallurgy 2012, 117–118, 108–115. [Google Scholar] [CrossRef]
- Song, W.C.; Li, H.; Zhu, F.X.; Li, K.; Zheng, Q. Extraction of vanadium from molten vanadium bearing slag by oxidation with pure oxygen in the presence of CaO. Trans. Nonferrous Met. Soc. China 2014, 24, 2687–2694. [Google Scholar] [CrossRef]
- Li, Q.; Huang, J.; Zhang, Y.M.; Zheng, Q.S. The effect of impurity ions on the pH adjustment for vanadium-bearing acid leaching solution by selective electrodialysis. J. Clean. Prod. 2022, 340, 130801. [Google Scholar] [CrossRef]
- Li, J.; Zhang, Y.M.; Liu, T.; Huang, J.; Bao, S.X. A methodology for assessing cleaner production in the vanadium extraction industry. J. Clean. Prod. 2014, 84, 598–605. [Google Scholar]
- Chen, B.; Bao, S.X.; Zhang, Y.M.; Li, S. A high-efficiency and sustainable leaching process of vanadium from shale in sulfuric acid systems enhanced by ultrasound. Sep. Purif. Technol. 2020, 240, 116624. [Google Scholar] [CrossRef]
- Yuan, Y.Z.; Zhang, Y.M.; Liu, T.; Hu, P.C.; Zheng, Q.S. Optimization of microwave roasting-acid leaching process for vanadium extraction from shale via response surface methodology. J. Clean. Prod. 2019, 234, 494–502. [Google Scholar] [CrossRef]
- Chen, B.; Bao, S.X.; Zhang, Y.M. Synergetic strengthening mechanism of ultrasound combined with calcium fluoride towards vanadium extraction from low-grade vanadium-bearing shale. Int. J. Min. Sci. Technol. 2021, 31, 1095–1106. [Google Scholar] [CrossRef]
- Xue, N.N.; Zhang, Y.M.; Huang, J.; Liu, T.; Wang, L.Y. Separation of impurities aluminum and iron during pressure acid leaching of vanadium from stone coal. J. Clean. Prod. 2017, 166, 1265–1273. [Google Scholar] [CrossRef]
- Peng, H. A literature review on leaching and recovery of vanadium. J. Environ. Chem. Eng. 2019, 7, 103313. [Google Scholar] [CrossRef]
- Wang, F.; Zhang, Y.M.; Liu, T.; Huang, J.; Zhao, J.; Zhang, G.B.; Liu, J. Comparison of direct acid leaching process and blank roasting acid leaching process in extracting vanadium from stone coal. Int. J. Miner. Process. 2014, 128, 40–47. [Google Scholar] [CrossRef]
- Zheng, Q.S.; Zhang, Y.M.; Liu, T.; Huang, J.; Xue, N.N. Vanadium extraction from black shale: Enhanced leaching due to fluoride addition. Hydrometallurgy 2019, 187, 141–148. [Google Scholar] [CrossRef]
- Chen, B.F.; Huang, S.; Liu, B.; Ge, Q.; Xie, S.S.; Wang, M.Y.; Wang, X.W. Thermodynamic analysis for separation of vanadium and chromium in V(VI)-Cr(III)-H2O system. Trans. Nonferrous Met. Soc. China 2018, 28, 567–573. [Google Scholar] [CrossRef]
- Li, M.; Liu, B.; Zheng, S.L.; Wang, S.N.; Du, H.; Dreisinger, D.B.; Zhang, Y. A cleaner vanadium extraction method featuring non-salt roasting and ammonium bicarbonate leaching. J. Clean. Prod. 2017, 149, 206–217. [Google Scholar] [CrossRef]
- Zhang, J.L.; Zhao, Z. Thermodynamic analysis for separation of tungsten and vanadium in W(VI)-V(V)-H2O system. Chin. J. Nonferrous Met. 2014, 24, 1656–1662. [Google Scholar]
- Hu, Y.B.; Zhang, Y.M.; Xue, N.N.; Hu, P.C.; Zhang, L.H. E-pH Diagrams and Kinetics of V2O3 Preparation by Solution-phase Hydrogen Reduction. Trans. Nonferrous Met. Soc. China 2022, 32, 1290–1300. [Google Scholar] [CrossRef]
- You, H.X.; Xu, H.B.; Zhang, Y.; Zheng, S.L.; Gao, Y.Y. Potential—pH diagrams of Cr-H2O system at elevated temperatures. Trans. Nonferrous Met. Soc. China 2010, 20, 26–31. [Google Scholar] [CrossRef]
- Zhu, X.B.; Zhang, Y.M.; Huang, J.; Liu, T.; Wang, Y. A kinetics study of multi-stage counter-current circulation acid leaching of vanadium from stone coal. Int. J. Miner. Process. 2012, 114–117, 1–6. [Google Scholar] [CrossRef]


| Electrochemical Reaction Equation | Eh-pH | Number |
|---|---|---|
| VOH2+ = VO+ + H+ | (5) | |
| V3+ + H2O = VOH2+ + H+ | (6) | |
| 2VO2+ + 3H2O = HV2O5− + 5H+ | (7) | |
| 2VO2+ + 3H2O = H3V2O7− + 3H+ | (8) | |
| H3V2O7− + H2O = 2H2VO4− + 2H+ | (9) | |
| H2VO4− = HVO42− + H+ | (10) | |
| HVO42− = VO33− + H+ | (11) | |
| V3+ + e− = V2+ | (12) | |
| VO+ = VO2+ + e− | (13) | |
| V2+ + H2O = VOH2+ + H+ + e− | (14) | |
| V2+ + H2O = VO+ + 2H+ + e− | (15) | |
| V3+ + H2O = VO2+ + 2H+ + e− | (16) | |
| VOH2+ = VO2+ + H+ + e− | (17) | |
| 2VO+ + 3H2O = HV2O5− + 5H+ + 2e− | (18) | |
| VO2+ + H2O = VO2+ + 2H+ + e− | (19) | |
| 2VO2+ + 5H2O = H3V2O7− + 7H+ + 2e− | (20) | |
| HV2O5− + 2H2O = H3V2O7− + 2H+ + 2e− | (21) | |
| HV2O5− + 3H2O = 2H2VO4− + 3H+ + 2e− | (22) | |
| HV2O5− + 3H2O = 2HVO42− + 5H+ + 2e− | (23) | |
| HV2O5− + 3H2O = 2VO43− + 7H+ + 2e− | (24) |
| Electrochemical Reaction Equation | Eh-pH | Number |
|---|---|---|
| Al3+ + 3e− = Al | E = −1.688 + 0.0197lg (Al3+) | (25) |
| Al(OH)3 + 3H+ = Al3+ + 3H2O | pH = 2.64 − 1/3lg (Al3+) | (26) |
| Al(OH)3 + 3H+ + 3e− = Al + 3H2O | E = −1.532 − 0.0591pH | (27) |
| Al(OH)3 + 3H2O = Al(OH)4− + 4H+ | pH = 12.239 + 1/4lg (Al(OH)4-) | (28) |
| Electrochemical Reaction Equation | Eh-pH | Number |
|---|---|---|
| O2 + 4H+ + 4e− = H2O | E = 1.228 − 0.0591pH | (44) |
| 2H+ + 2e− = H2 | E = −0.0591pH | (45) |
| Cr2+ + 2e− = Cr(s) | E = −0.913 + 0.0296lg (Cr2+) | (46) |
| Cr3+ + e− = Cr2+ | E = −0.42 + 0.0591 lg () | (47) |
| H2CrO4 + 6H+ + 3e− = Cr3+ + 4H2O | E = 1.32 − 0.0197lg (Cr3+) − 0.1182pH | (48) |
| HCrO4− + 7H+ + 3e− = Cr3+ + 4H2O | E = 1.35 + 0.0197lg () − 0.1379pH | (49) |
| CrO42− + 4H+ + 3e− = Cr(OH)4− | E = 0.915 + 0.0197lg () − 0.0788pH | (50) |
| H2CrO4 = HCrO4− + H+ | pH = 0.46 − lg (HCrO4−) | (51) |
| HCrO4− = CrO42− + H+ | pH = 6.52 + lg () | (52) |
| Component | V2O5 | SiO2 | Al2O3 | Fe | MgO | CaO |
|---|---|---|---|---|---|---|
| Content | 1.96 | 86.49 | 3.78 | 2.43 | 0.51 | 1.44 |
| Component | P2O5 | S | Cr | K2O | Fcad | TiO2 |
| Content | 0.68 | 0.13 | 0.062 | 0.56 | 0.90 | 0.034 |
| Project | Valence State | Total | ||
|---|---|---|---|---|
| V(III) | V(IV) | V(V) | ||
| Content/% | 0.82 | 0.25 | 0.030 | 1.1 (Equivalent V2O5 is 1.96) |
| Distribution rate/% | 74.55 | 22.73 | 2.72 | 100 |
| Mineral Phases | Vanadium-Bearing Muscovite | Garnet | Vanadium-Bearing Biotite | Vanadium-Bearing Iron Oxide | Vanadium-Bearing Chlorite |
|---|---|---|---|---|---|
| Distribution rate/% | 49.36 | 21.10 | 17.26 | 3.81 | 3.03 |
| Mineral phases | Vanadium-bearing ilmenite | Vanadium-bearing wollastonite | V2O5 | Other | Total |
| Distribution rate/% | 0.18 | 0.81 | 0.49 | 3.96 | 100.00 |
Disclaimer/Publisher’s Note: The statements, opinions and data contained in all publications are solely those of the individual author(s) and contributor(s) and not of MDPI and/or the editor(s). MDPI and/or the editor(s) disclaim responsibility for any injury to people or property resulting from any ideas, methods, instructions or products referred to in the content. |
© 2023 by the authors. Licensee MDPI, Basel, Switzerland. This article is an open access article distributed under the terms and conditions of the Creative Commons Attribution (CC BY) license (https://creativecommons.org/licenses/by/4.0/).
Share and Cite
Tang, Y.; Ye, G.; Zuo, Q. Vanadium Extraction from the Flotation Concentrate of Vanadium-Bearing Shale by Process of Non-Roasting Enhanced Acid Leaching and Thermodynamics. Molecules 2023, 28, 2706. https://doi.org/10.3390/molecules28062706
Tang Y, Ye G, Zuo Q. Vanadium Extraction from the Flotation Concentrate of Vanadium-Bearing Shale by Process of Non-Roasting Enhanced Acid Leaching and Thermodynamics. Molecules. 2023; 28(6):2706. https://doi.org/10.3390/molecules28062706
Chicago/Turabian StyleTang, Yue, Guohua Ye, and Qi Zuo. 2023. "Vanadium Extraction from the Flotation Concentrate of Vanadium-Bearing Shale by Process of Non-Roasting Enhanced Acid Leaching and Thermodynamics" Molecules 28, no. 6: 2706. https://doi.org/10.3390/molecules28062706
APA StyleTang, Y., Ye, G., & Zuo, Q. (2023). Vanadium Extraction from the Flotation Concentrate of Vanadium-Bearing Shale by Process of Non-Roasting Enhanced Acid Leaching and Thermodynamics. Molecules, 28(6), 2706. https://doi.org/10.3390/molecules28062706