


The Effect of Copper Sulfide Stoichiometric Coefficient and Morphology on Electrochemical Performance


Abstract
:1. Introduction
2. Results and Discussion
2.1. Energy Storage of Different Copper Sulfide Materials
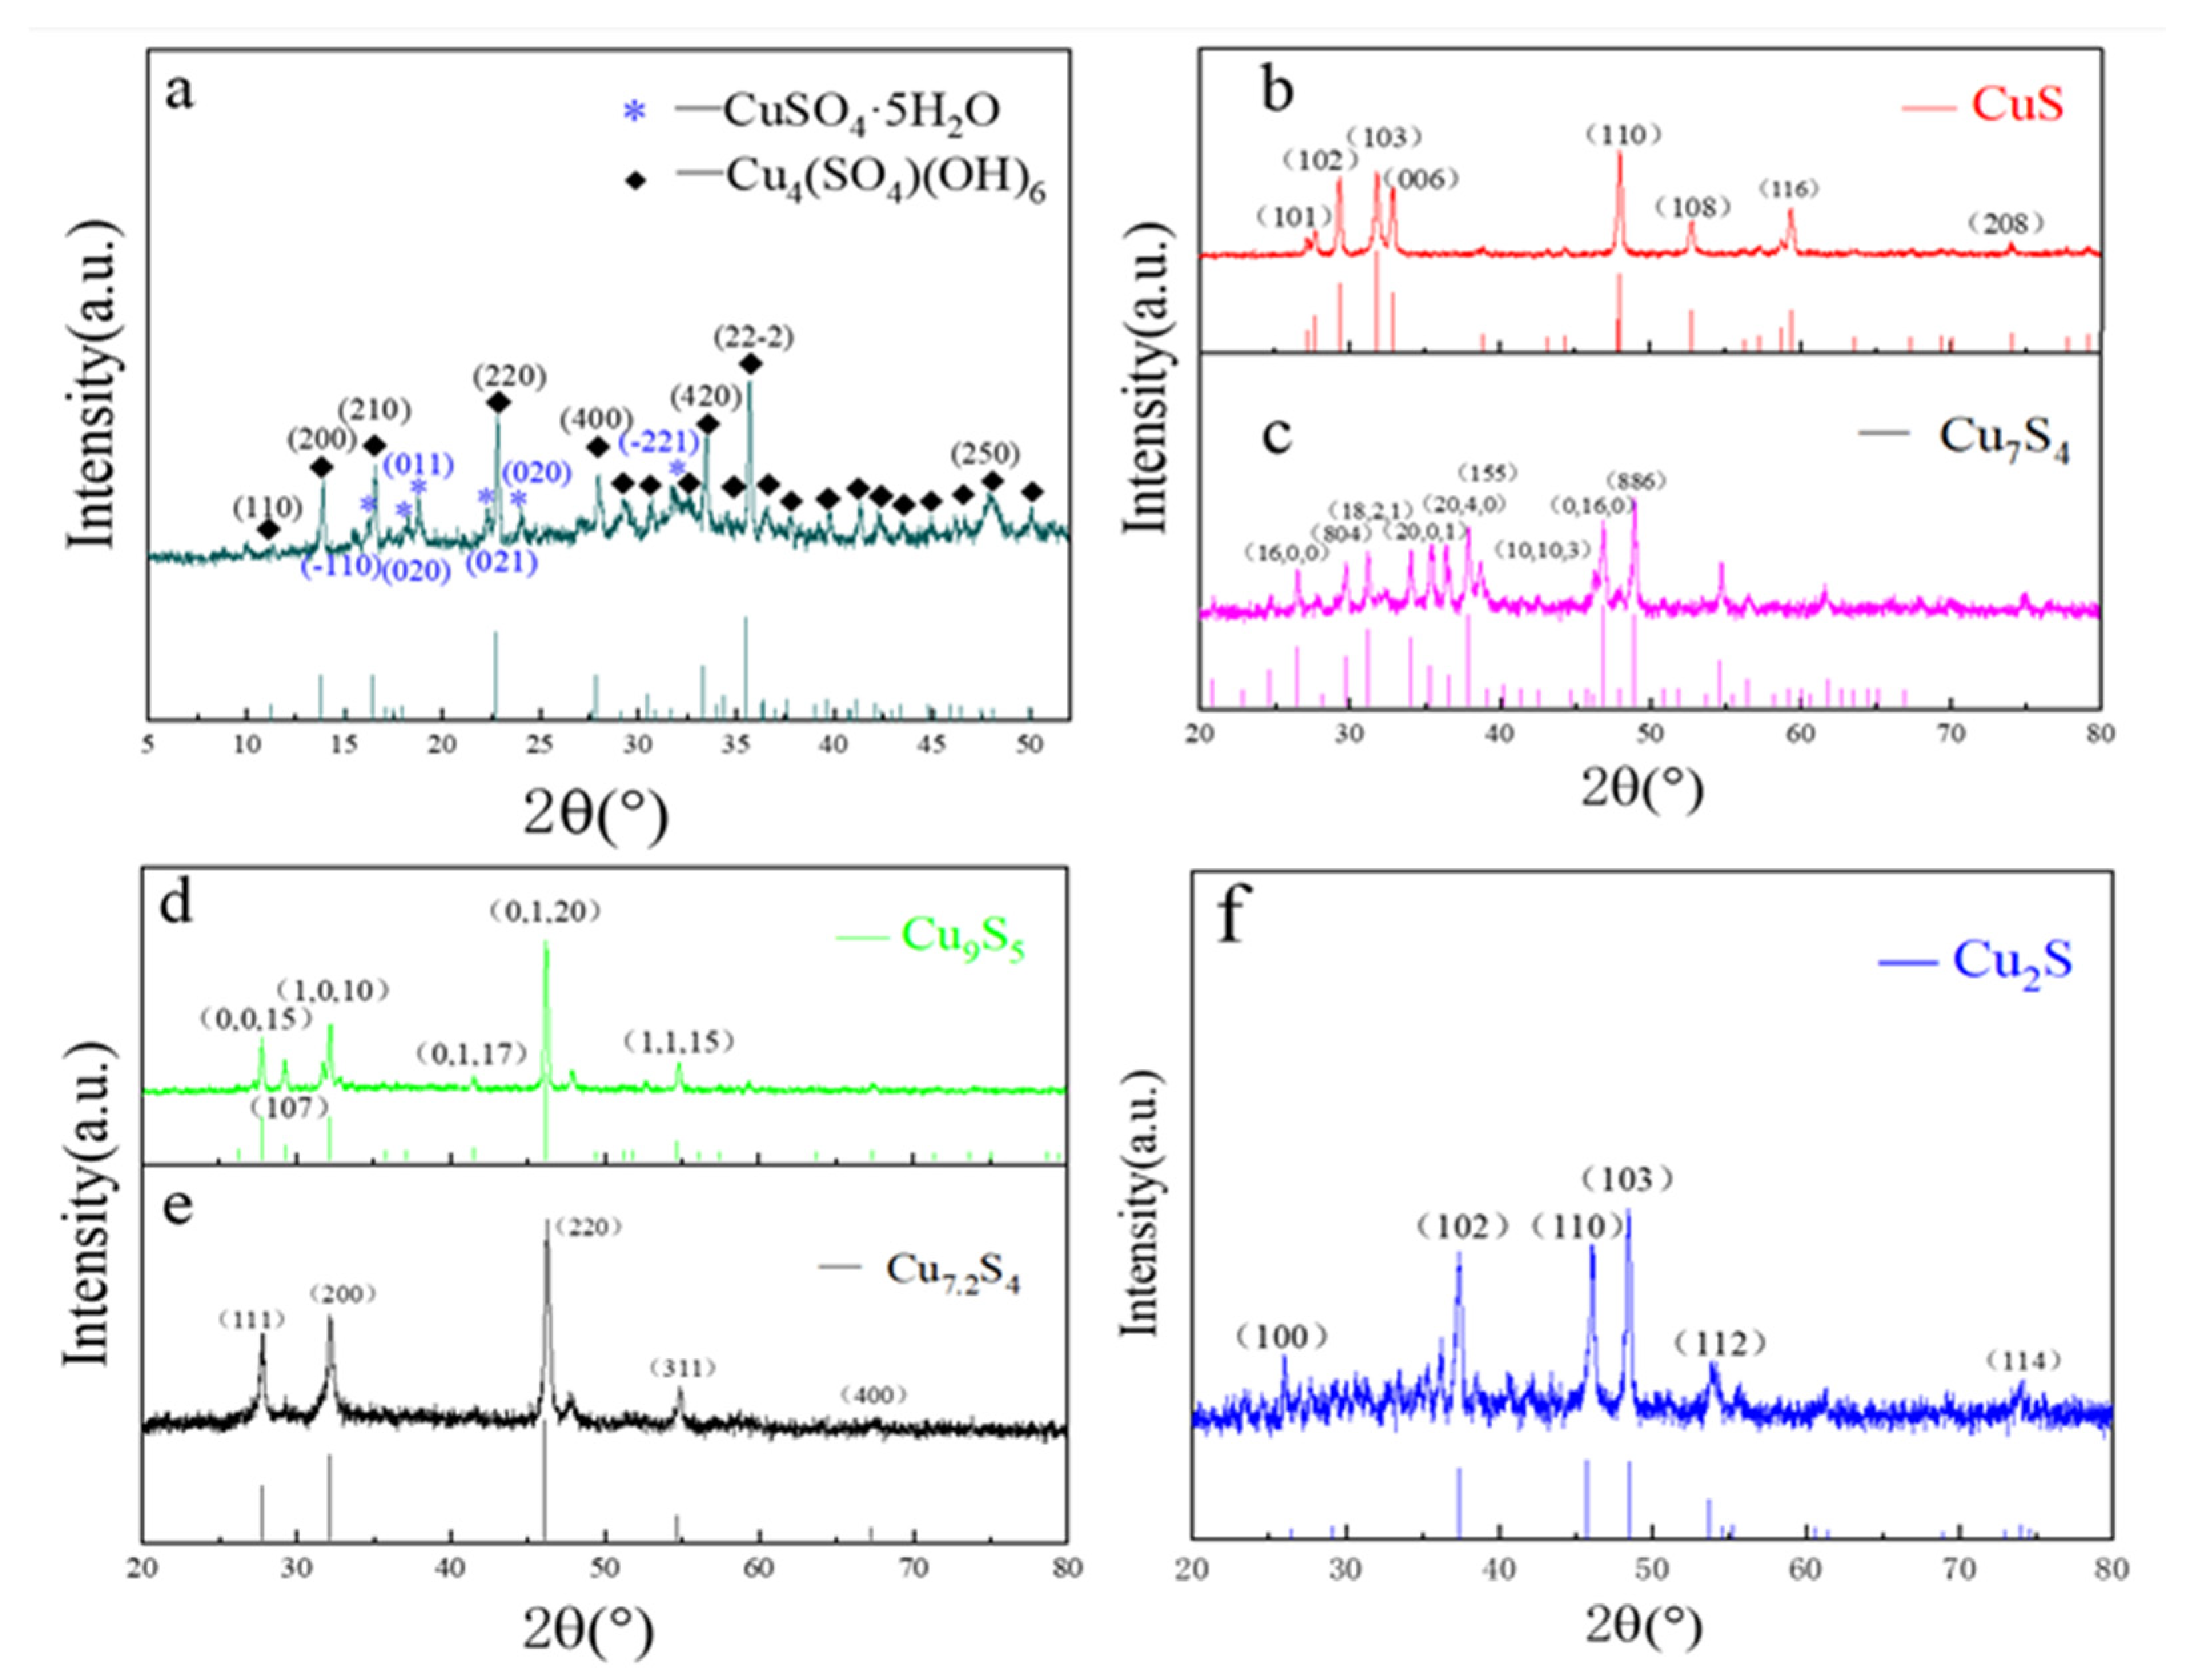
2.1.1. XRD Pattern Analysis
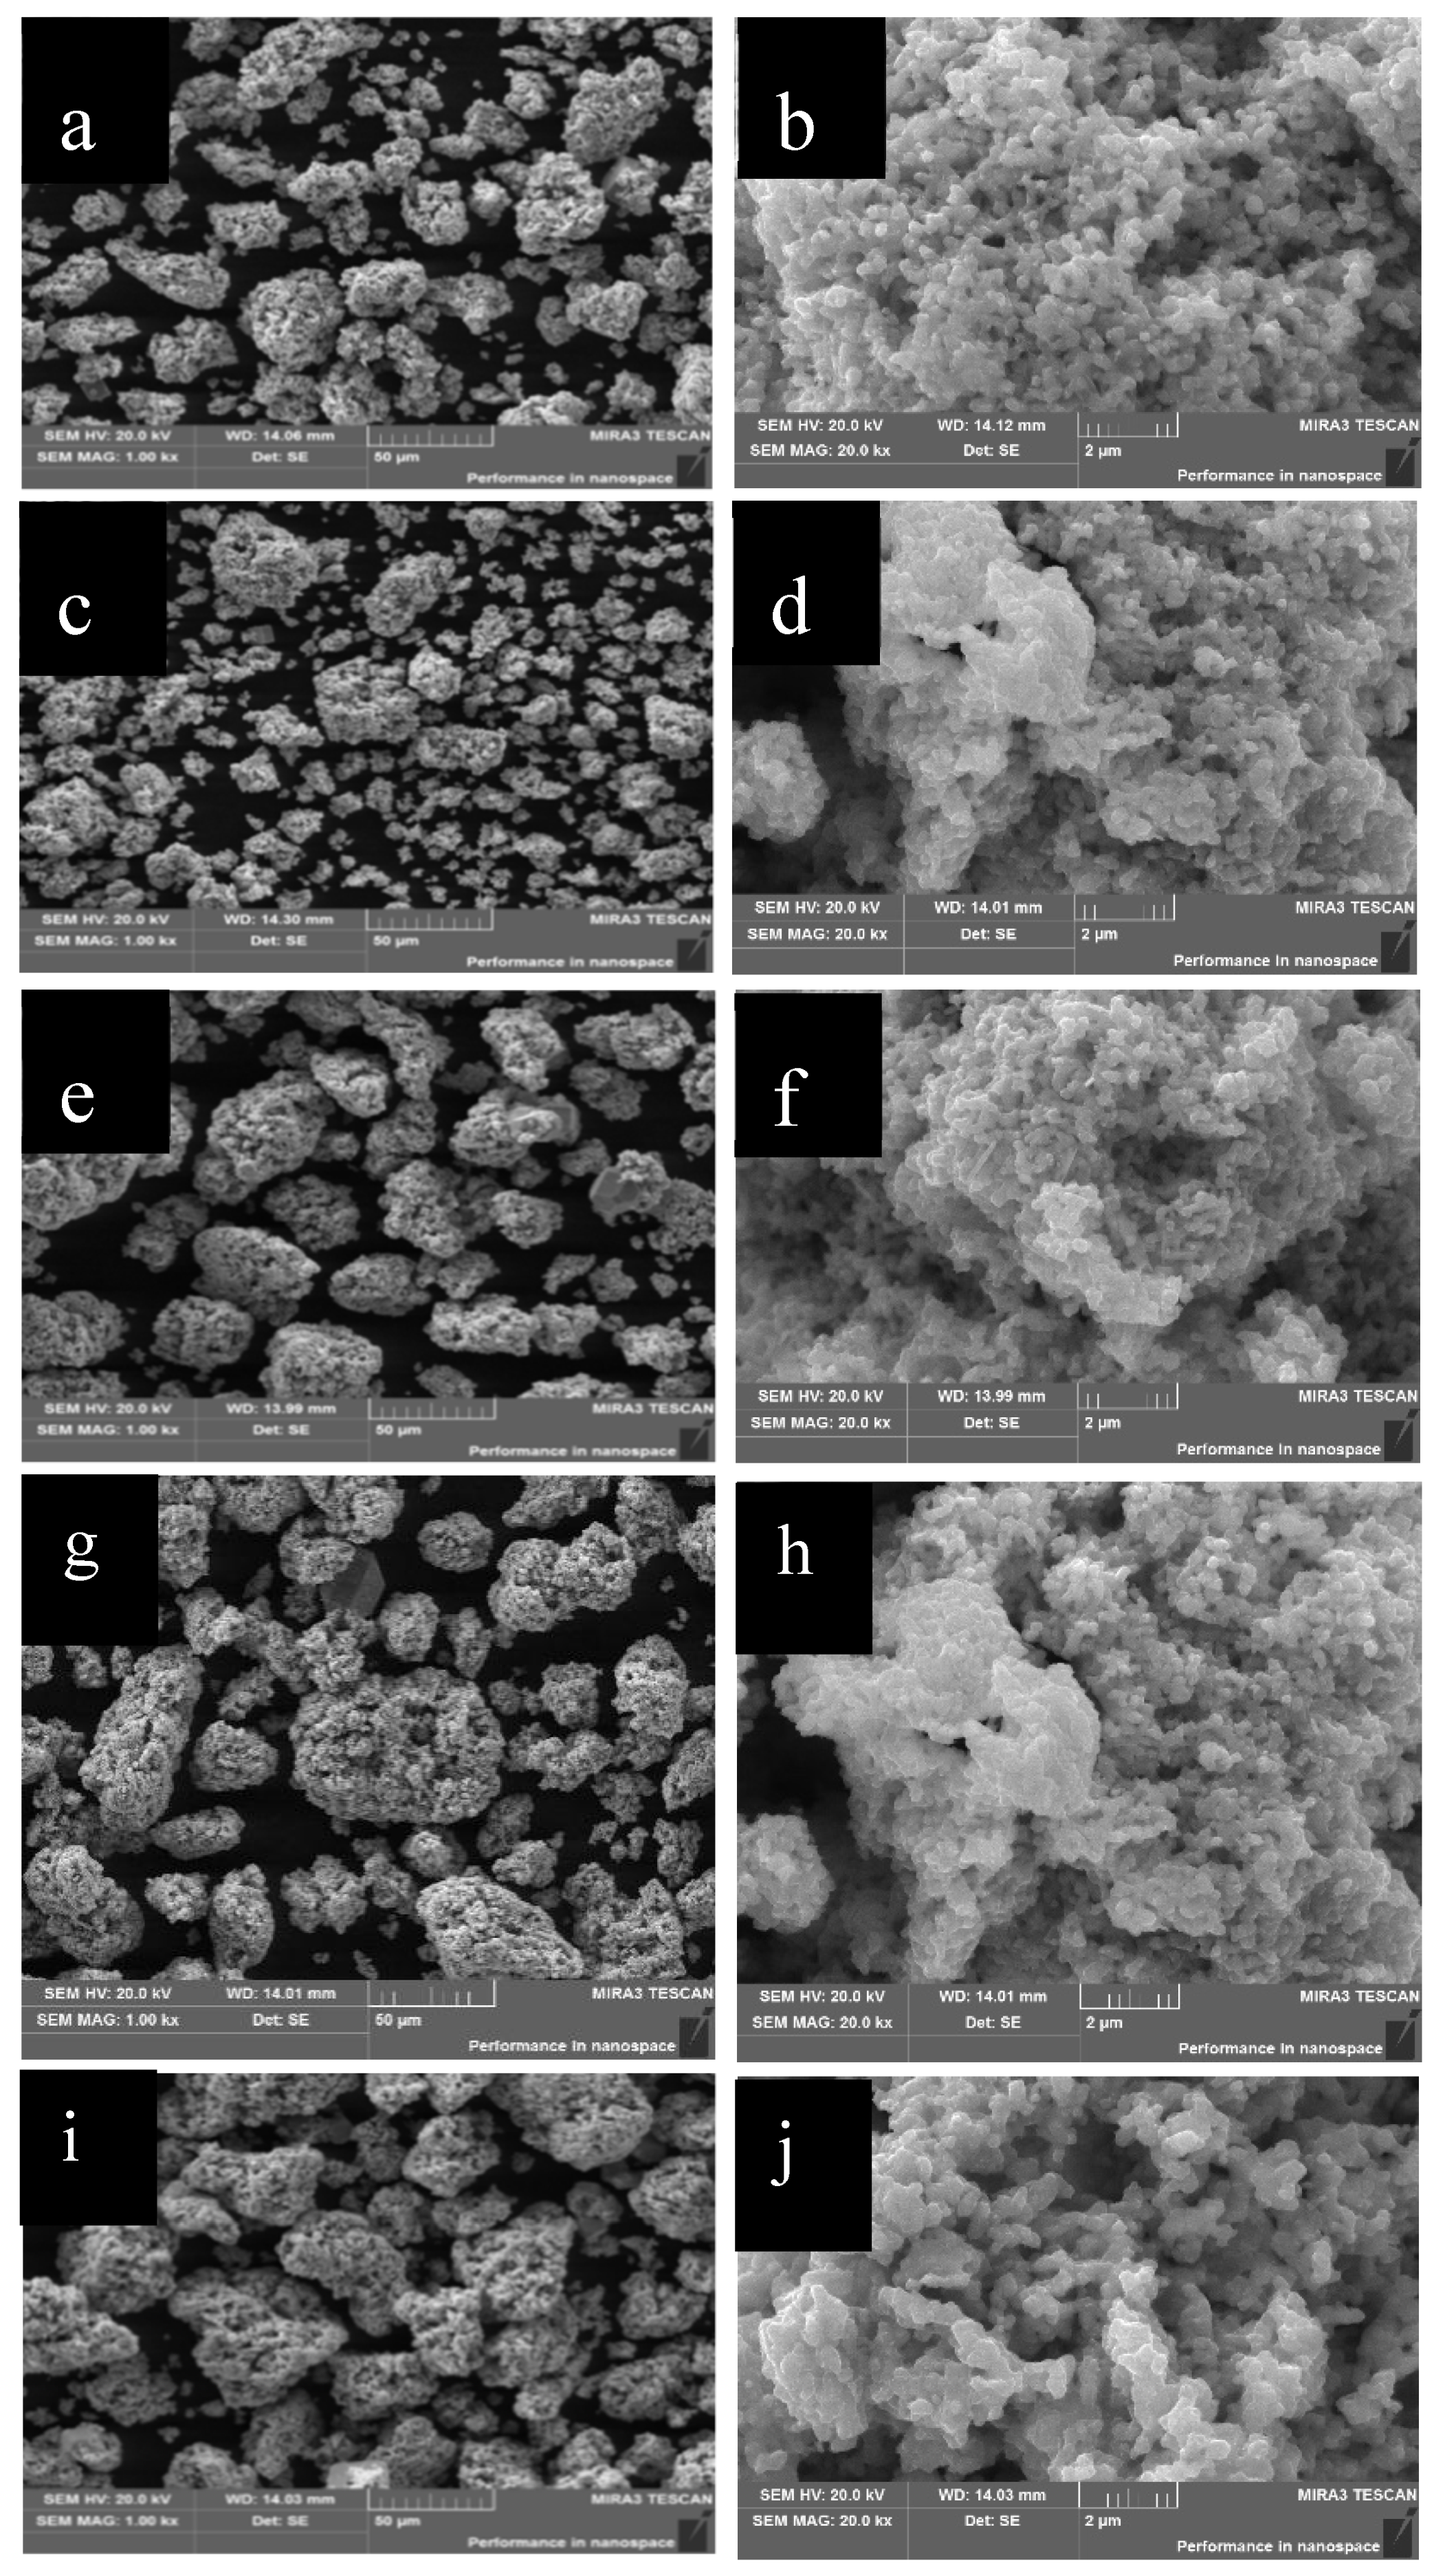
2.1.2. Morphological Analysis
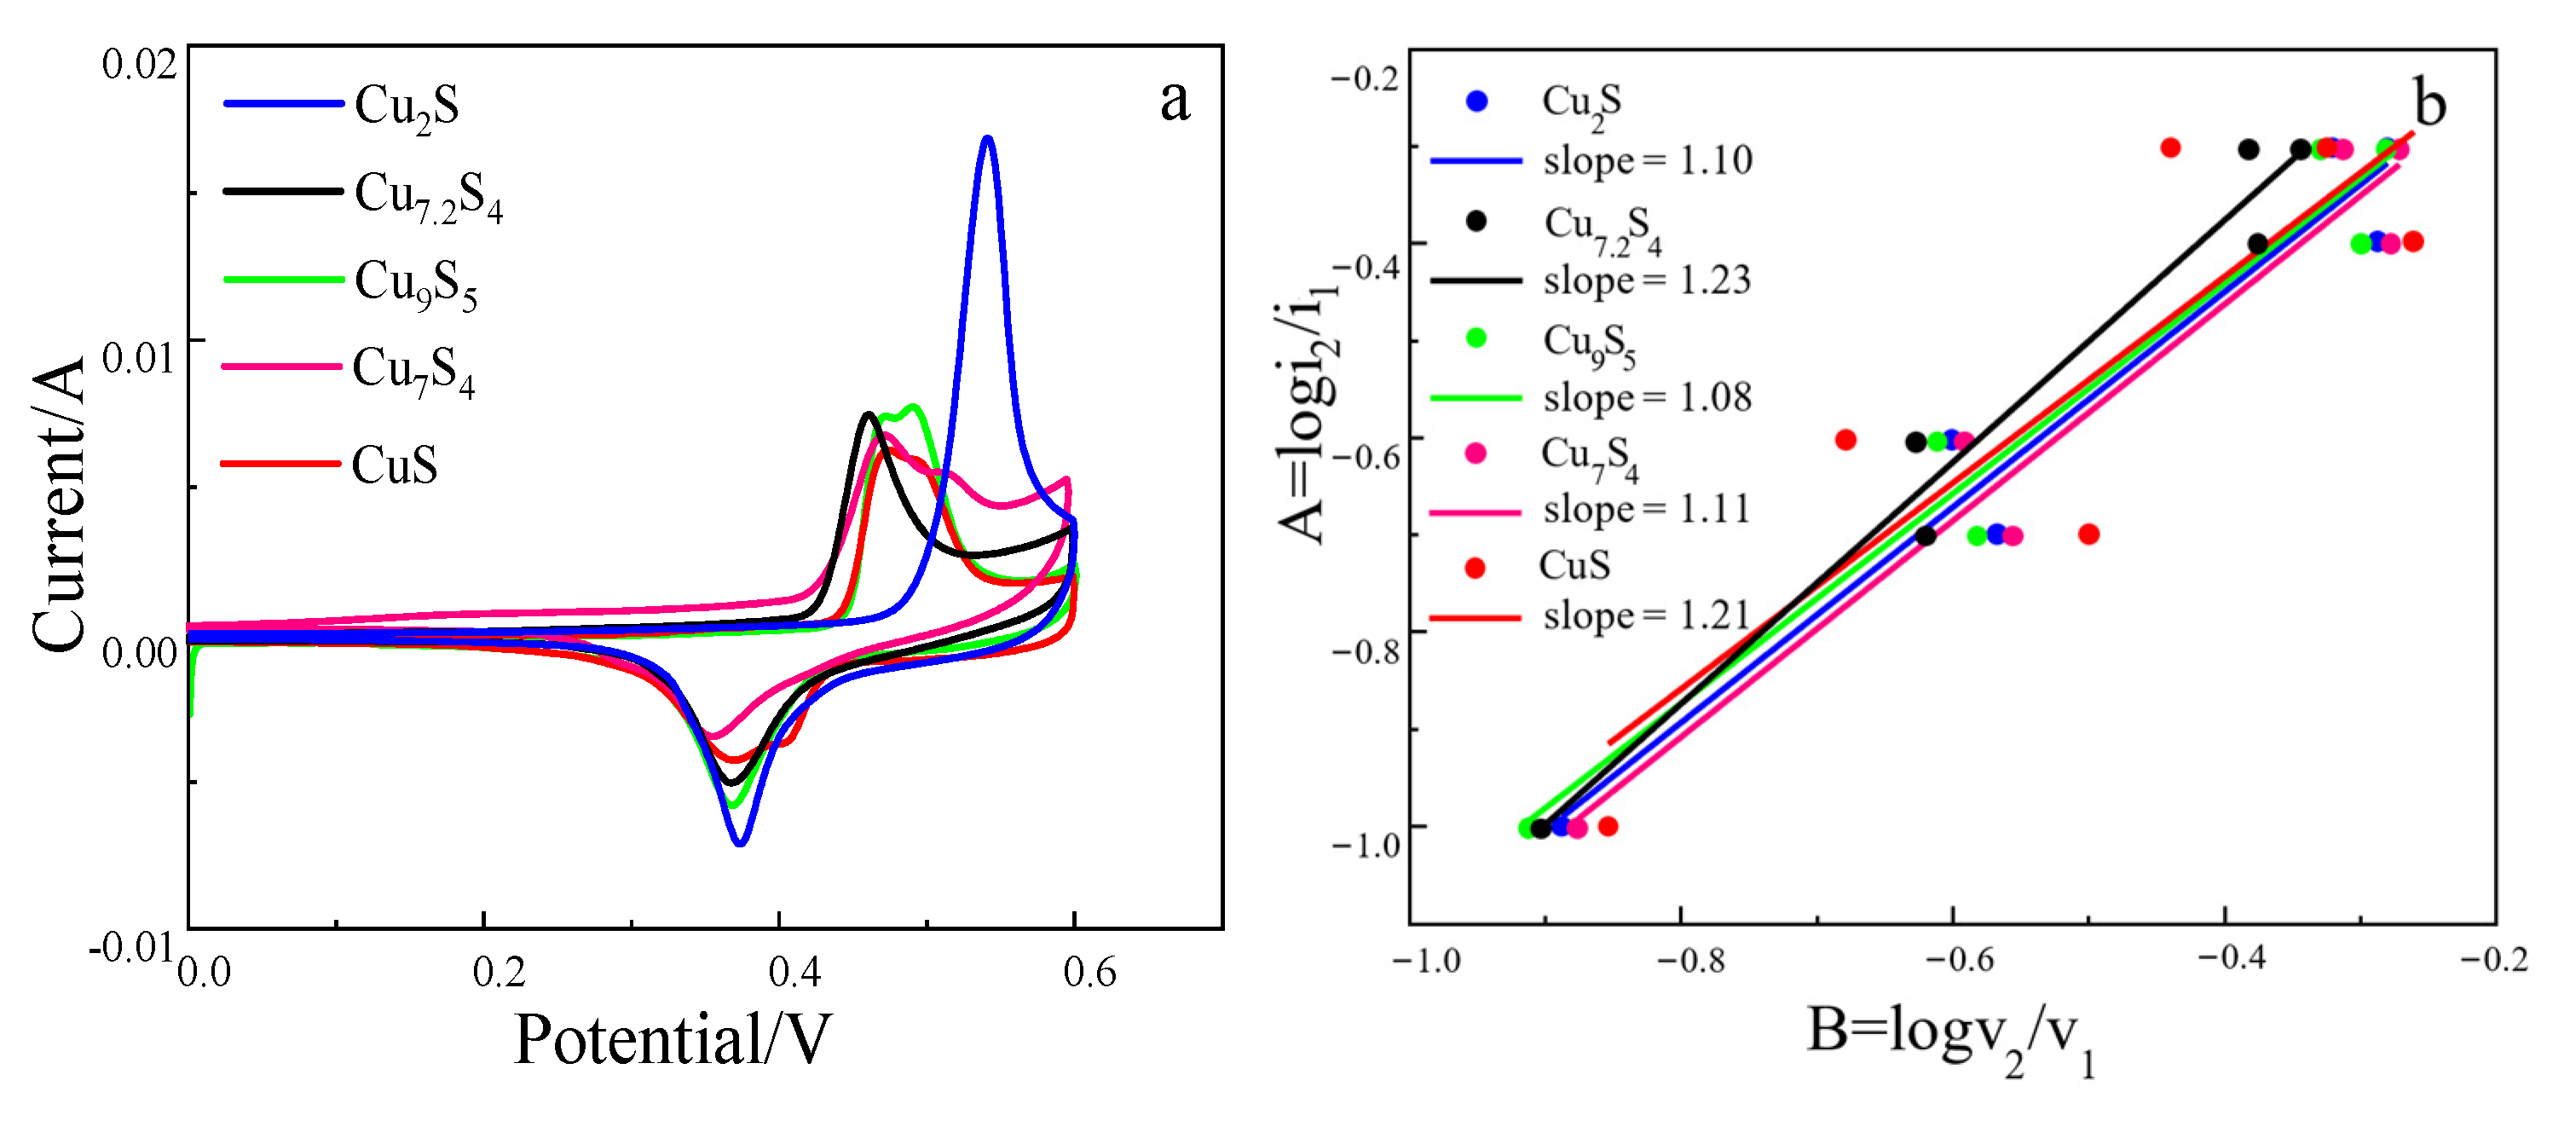
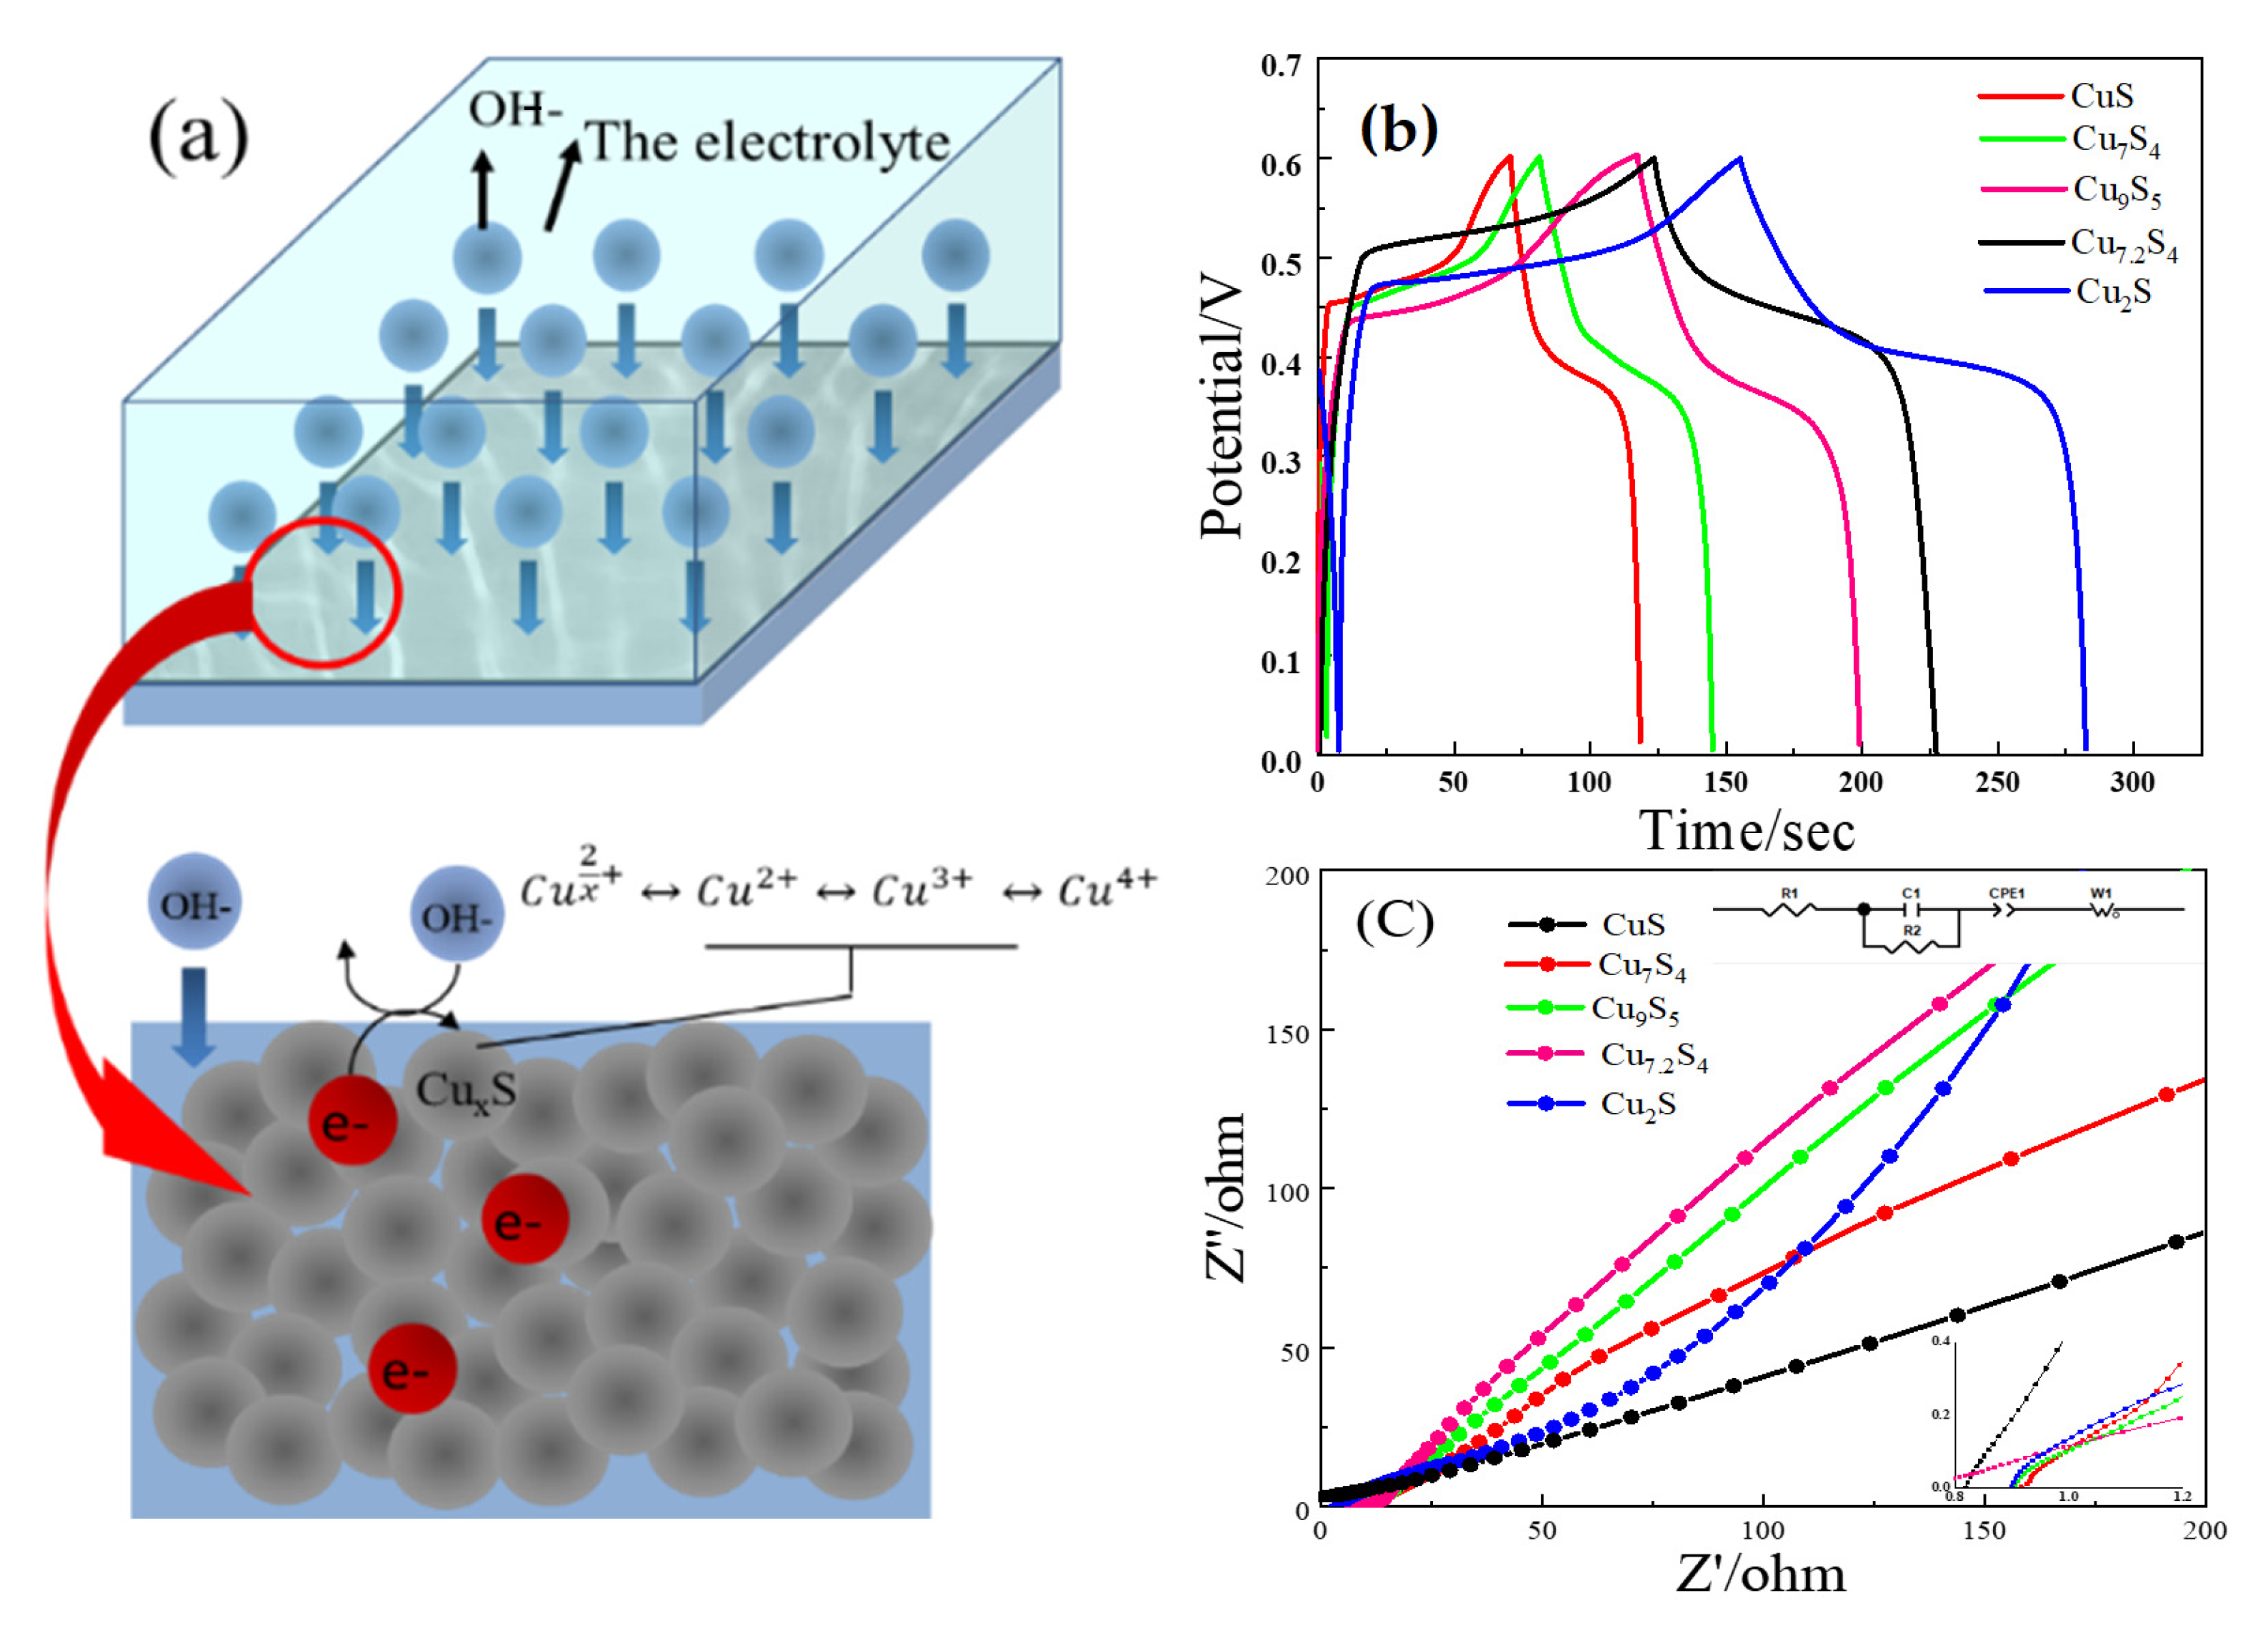
2.1.3. Electrochemical Test Analysis
2.2. Effect of Morphology of Cuprous Sulfide on Electrochemical Properties of Materials
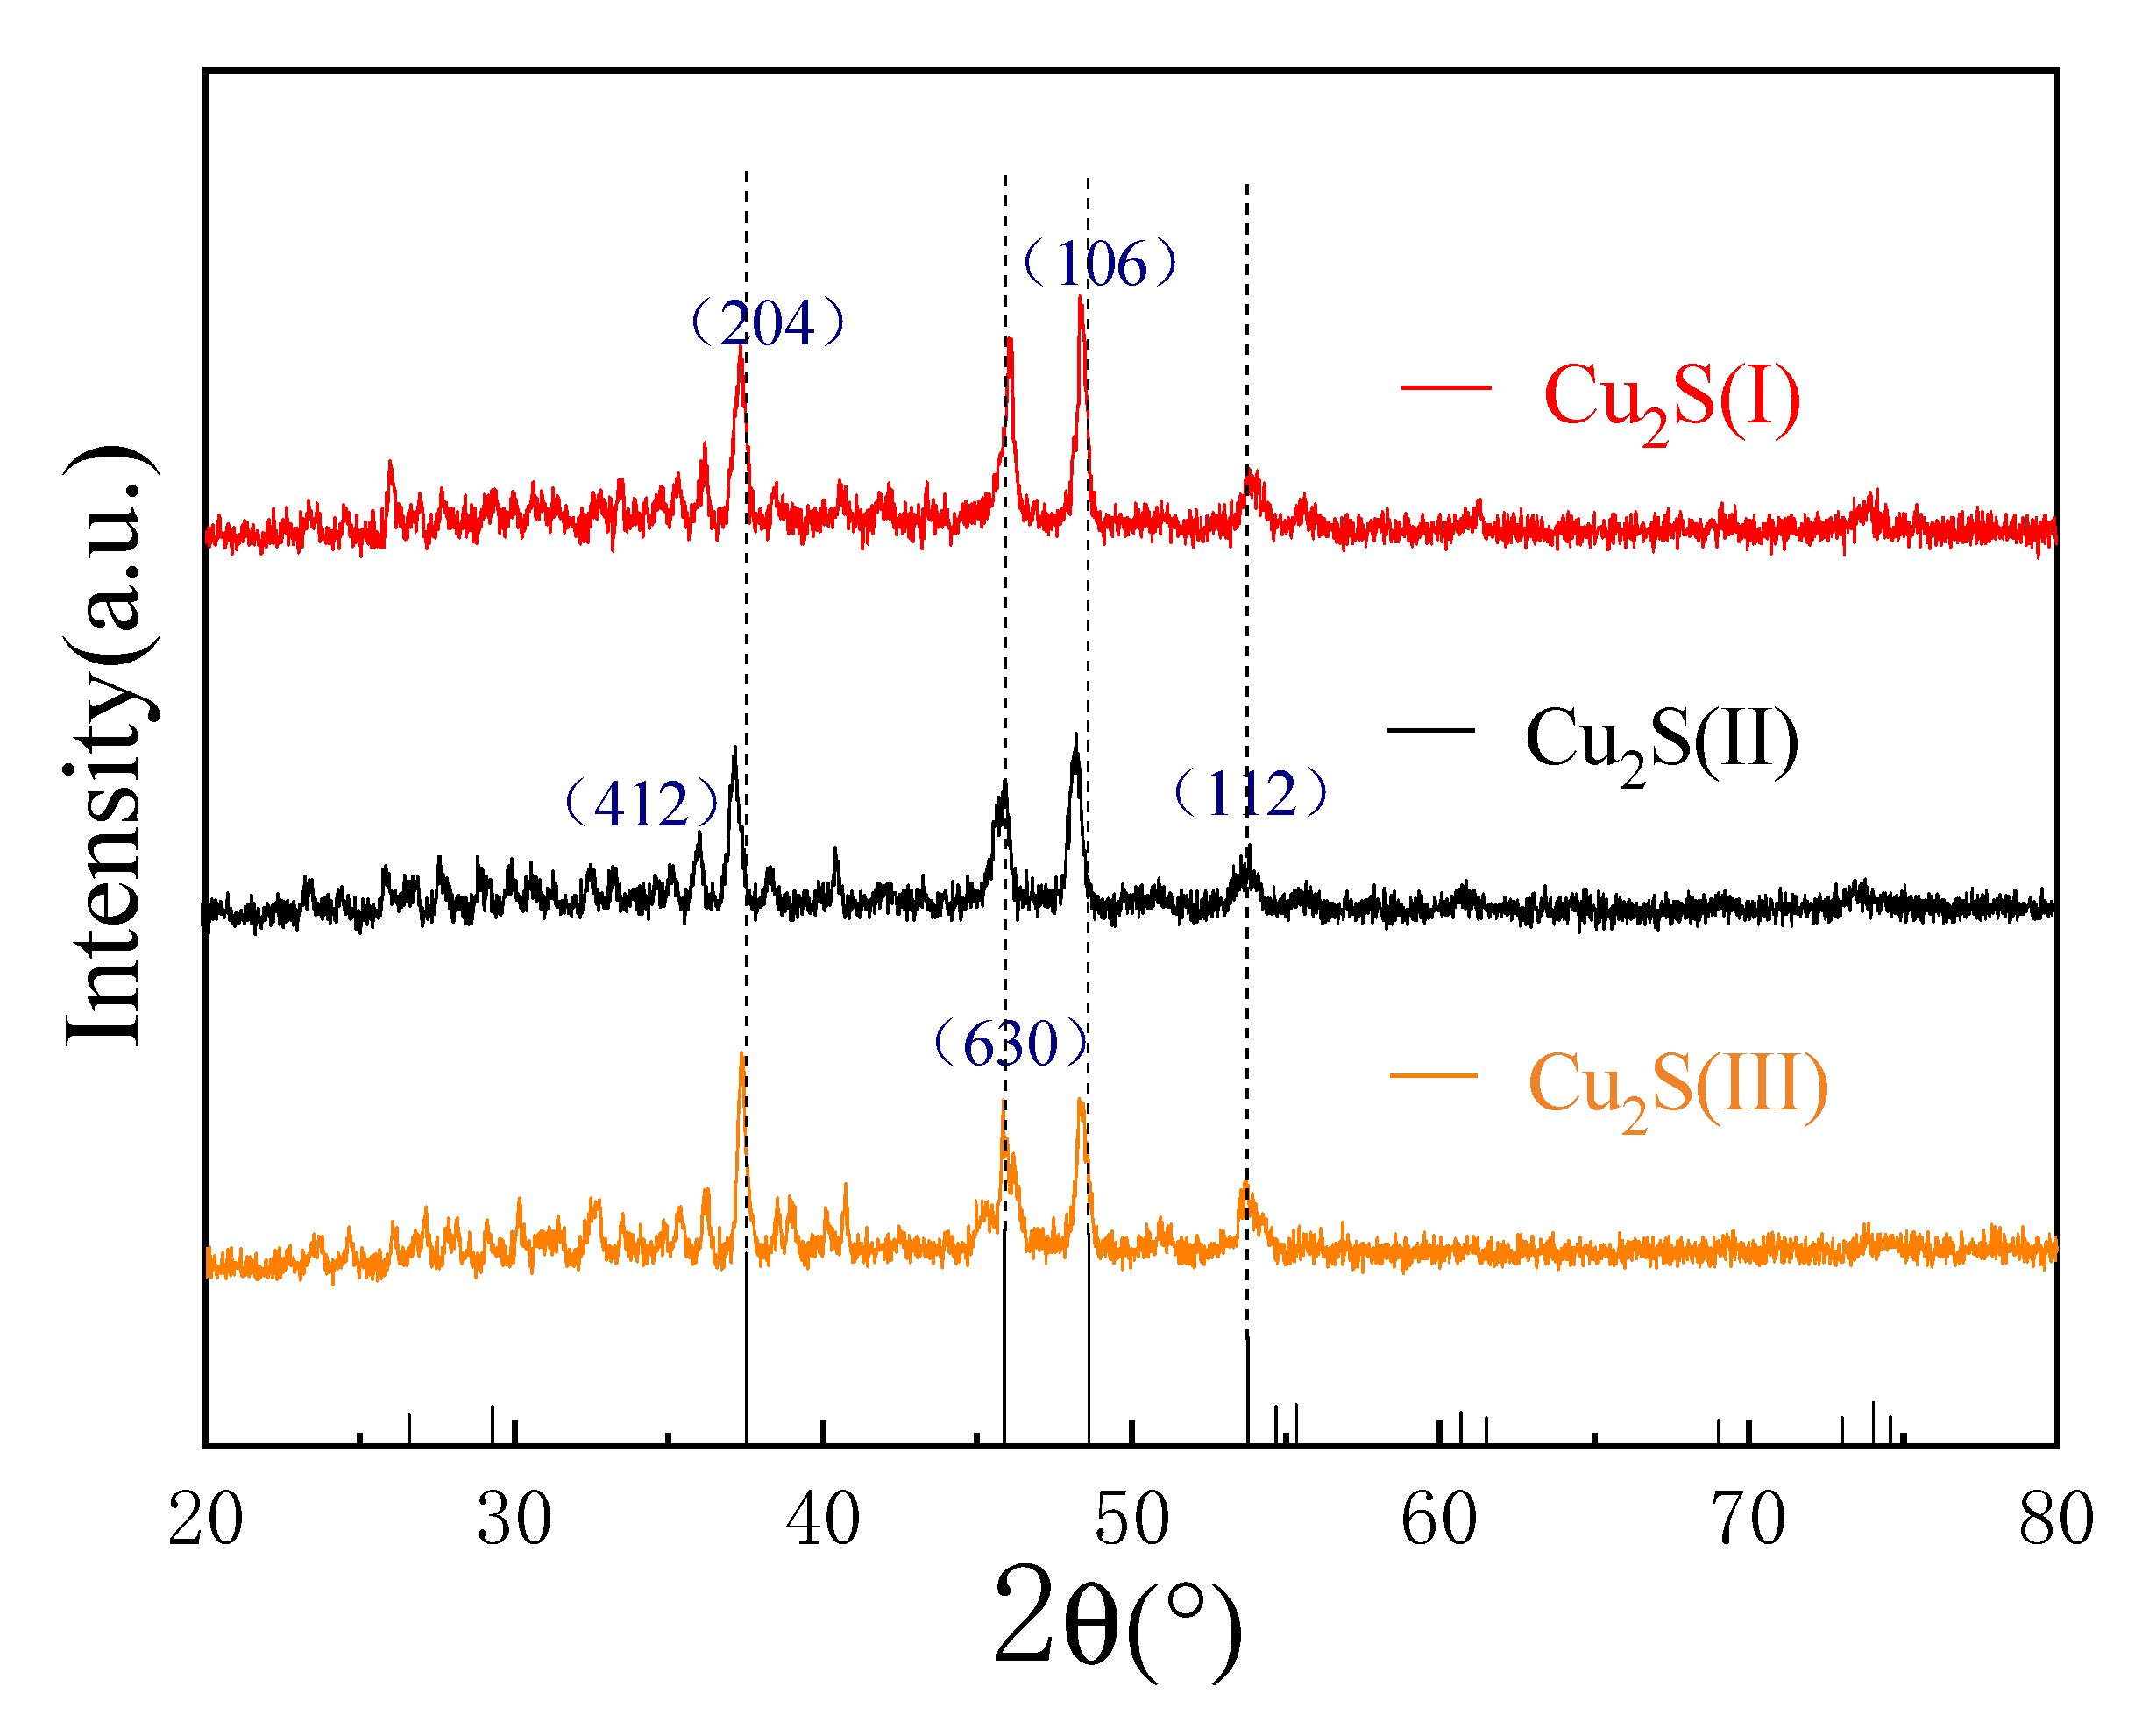
2.2.1. XRD Analysis
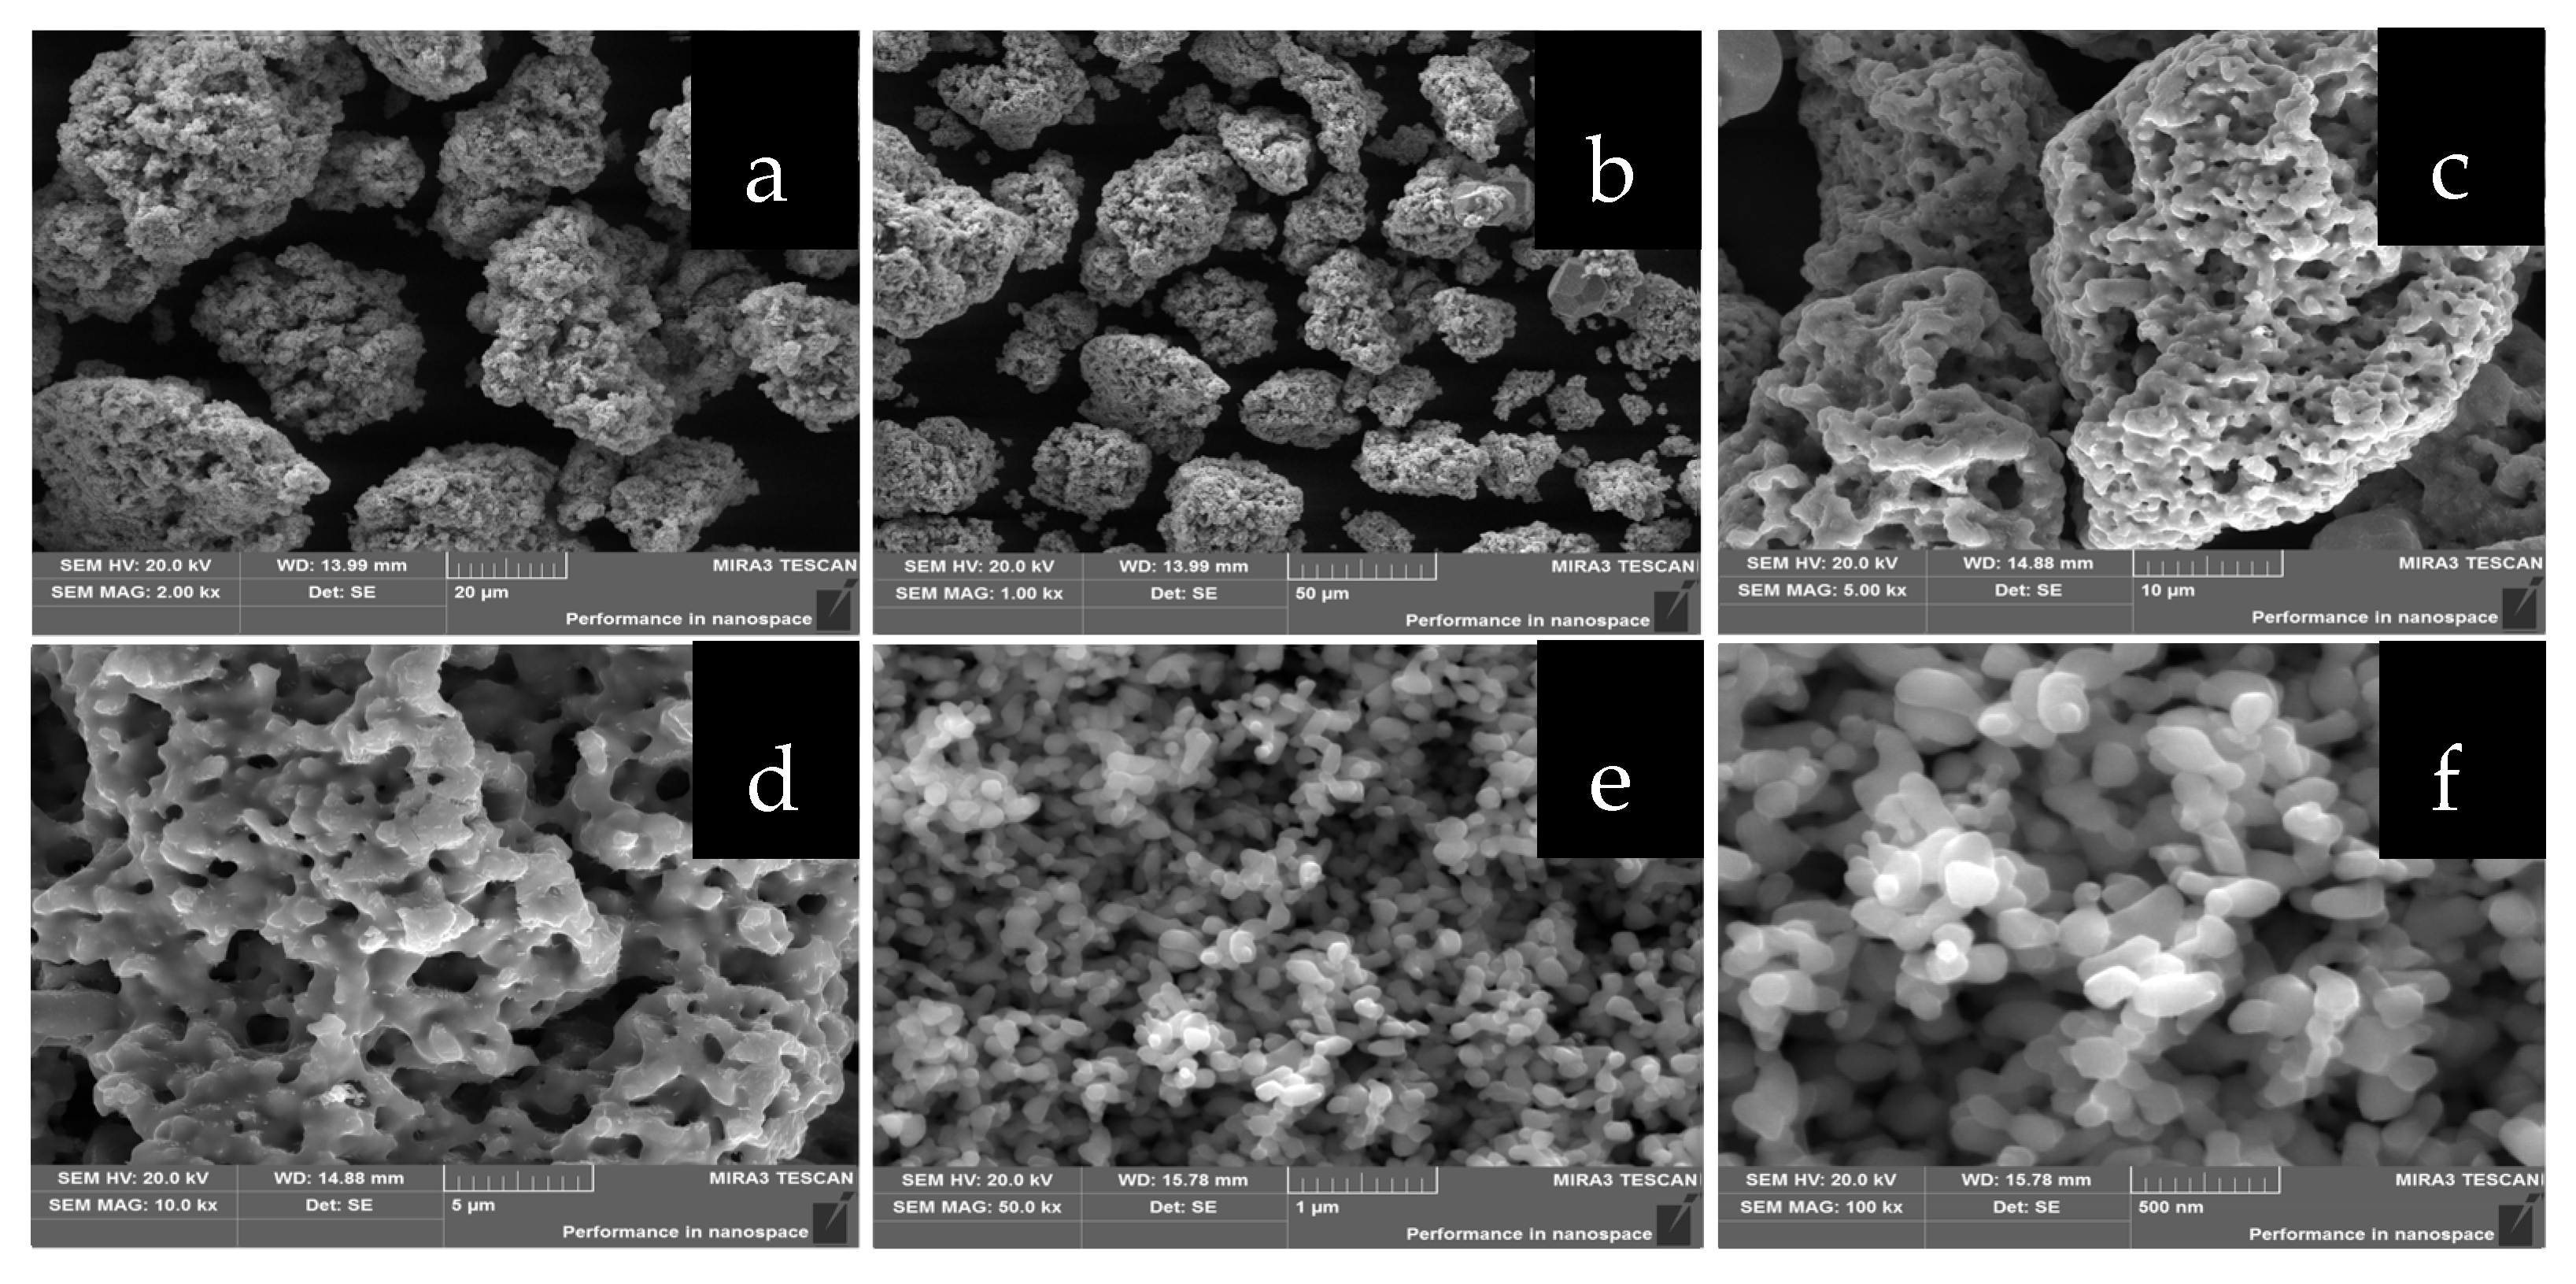
2.2.2. SEM Analysis
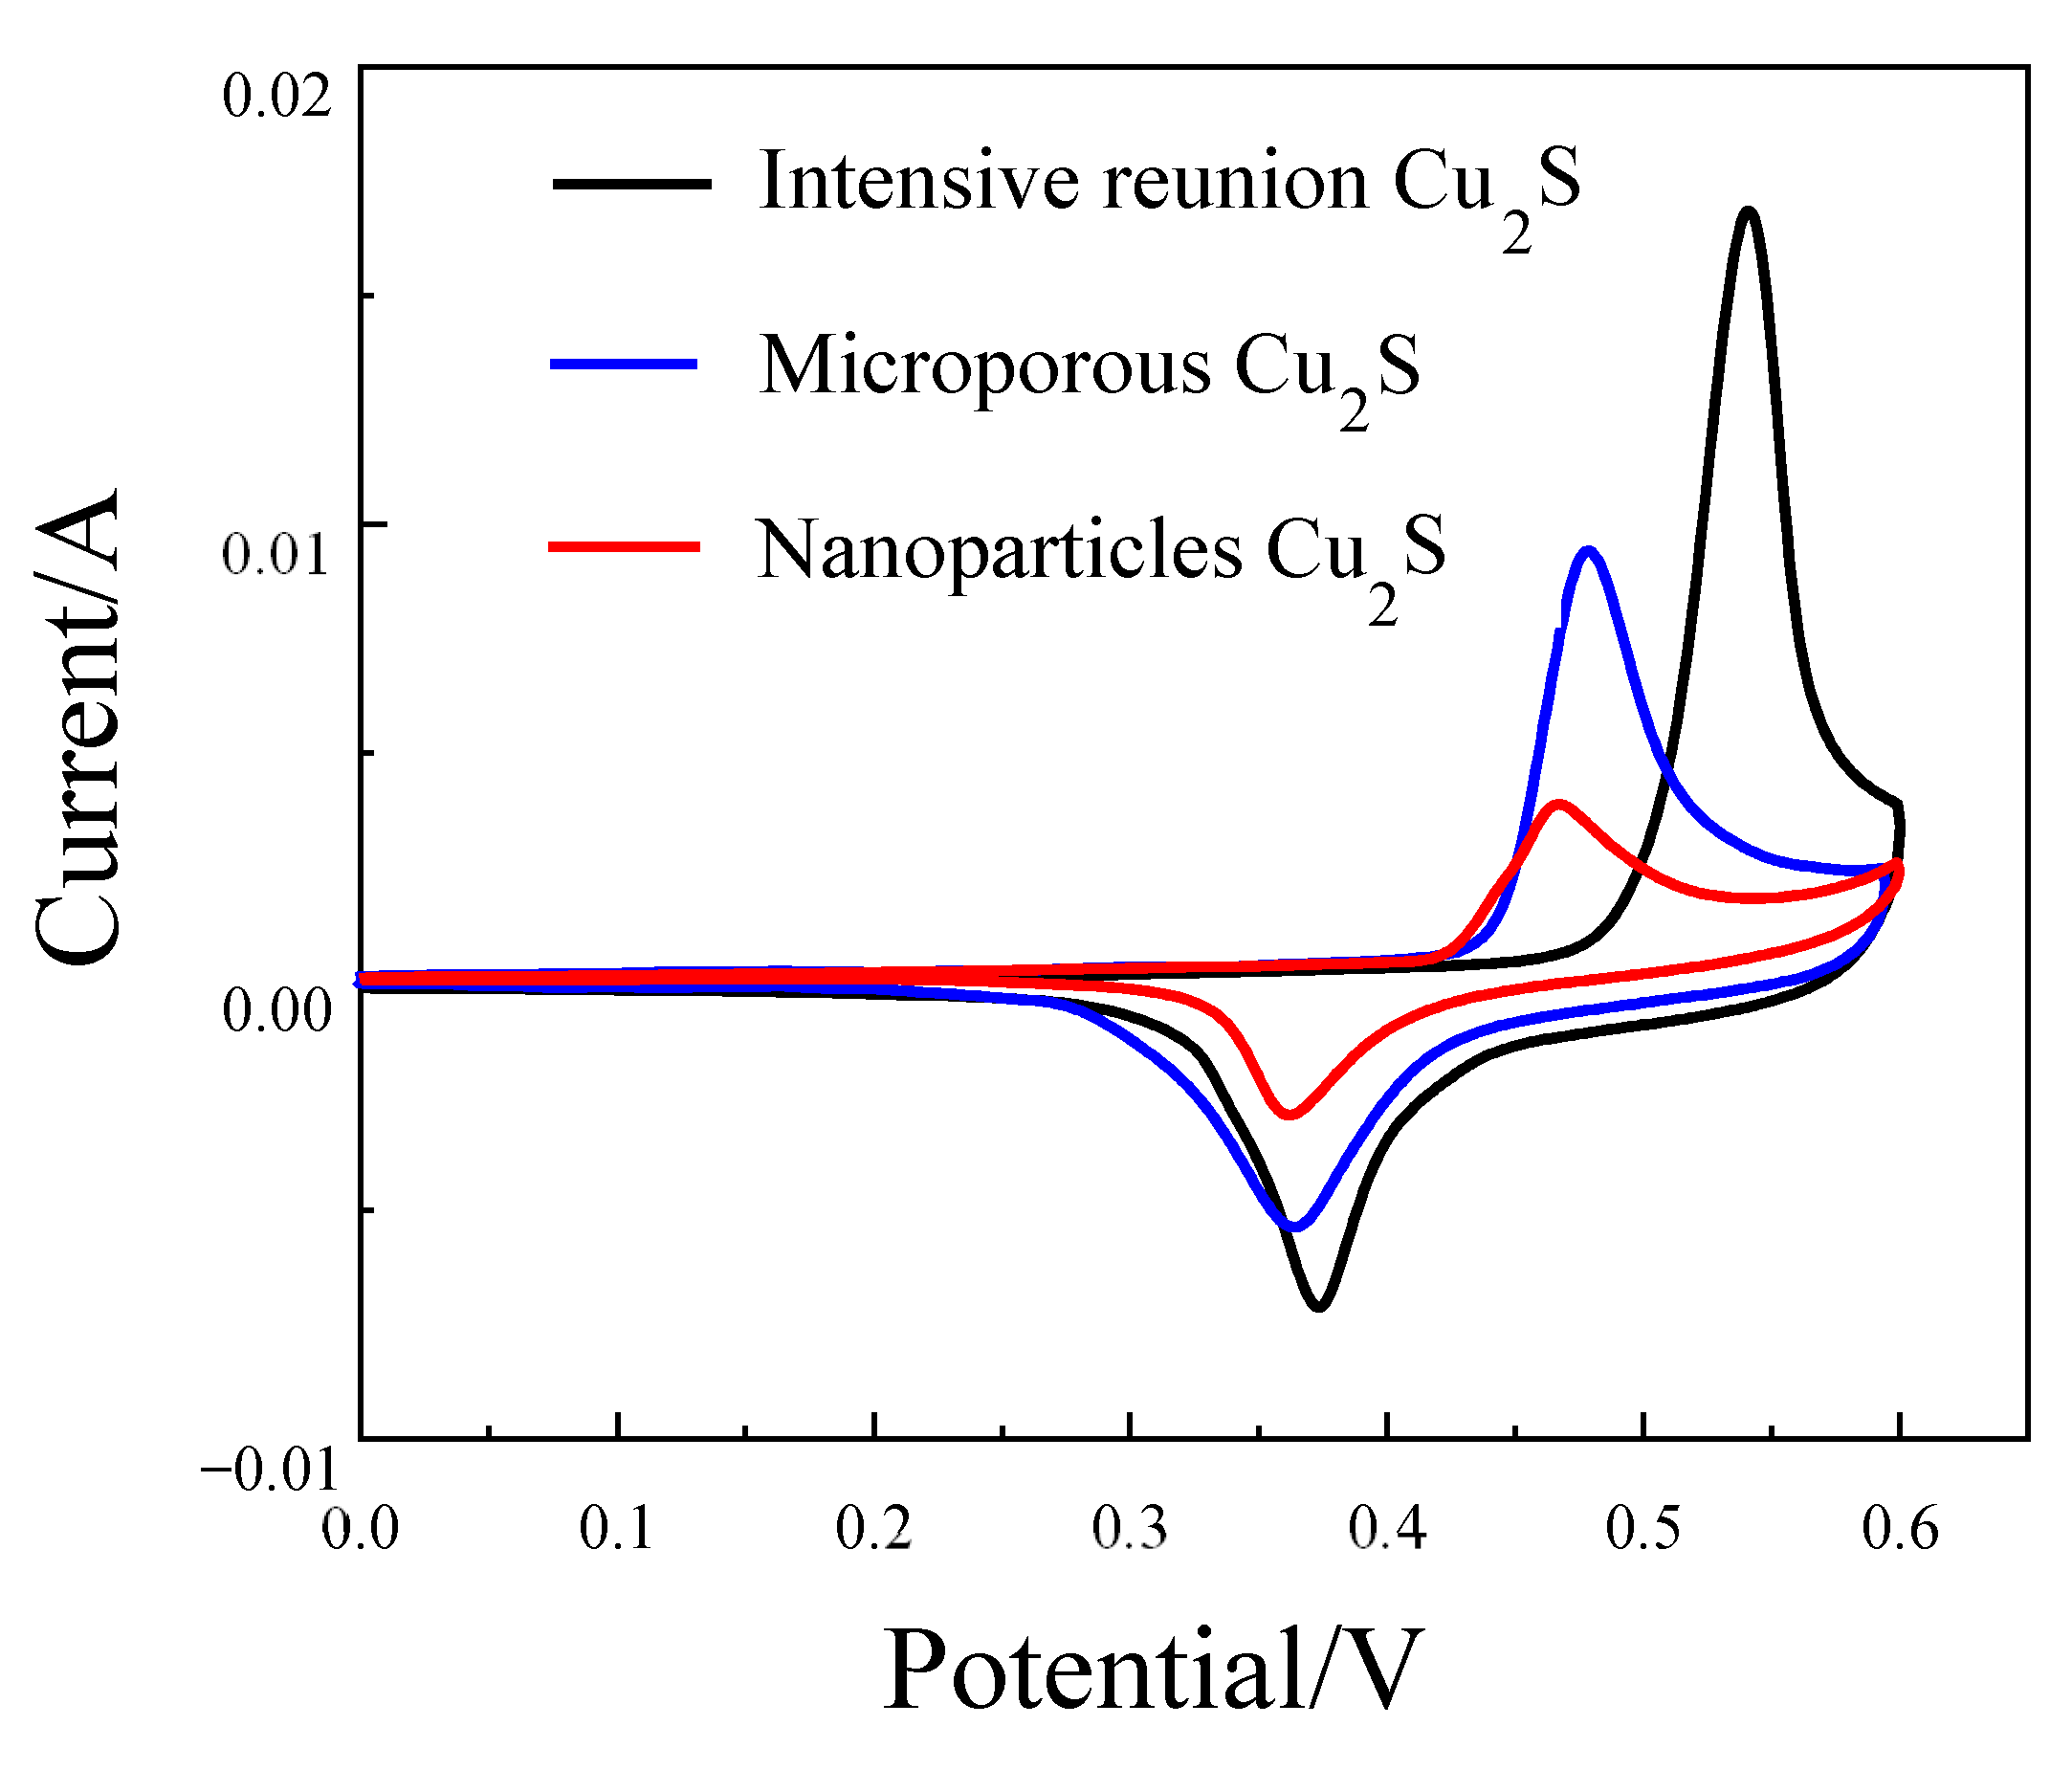
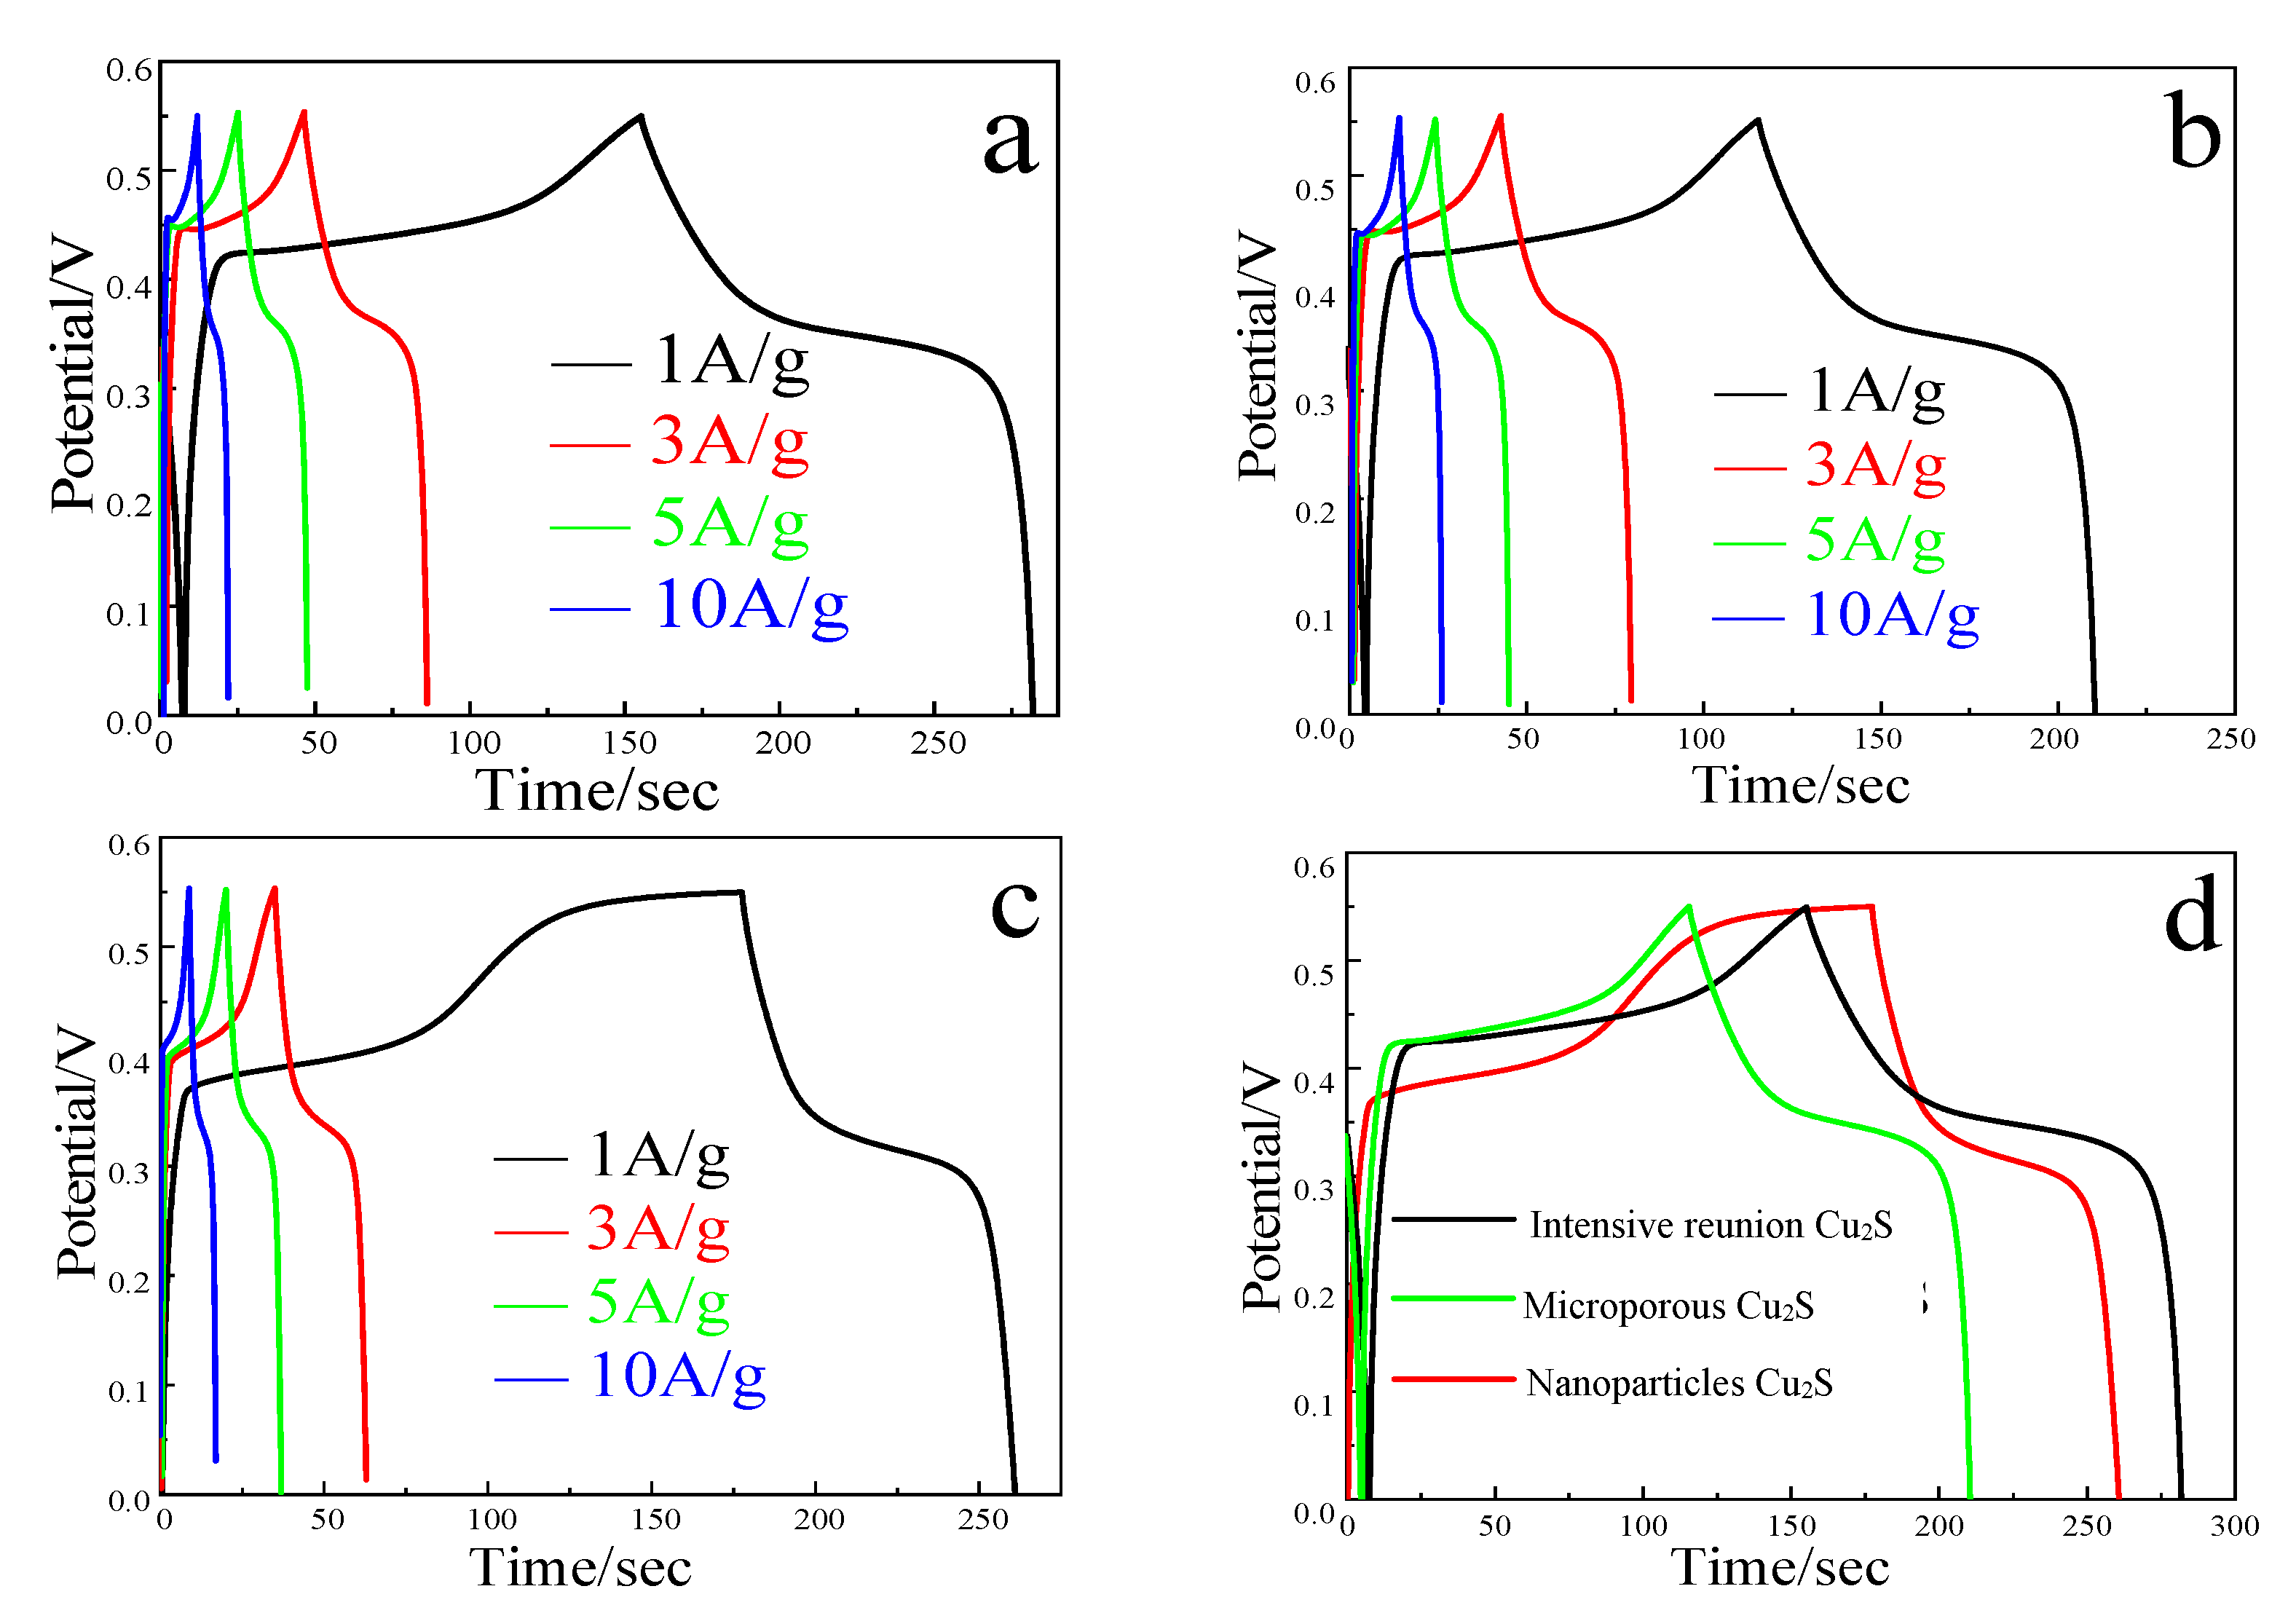
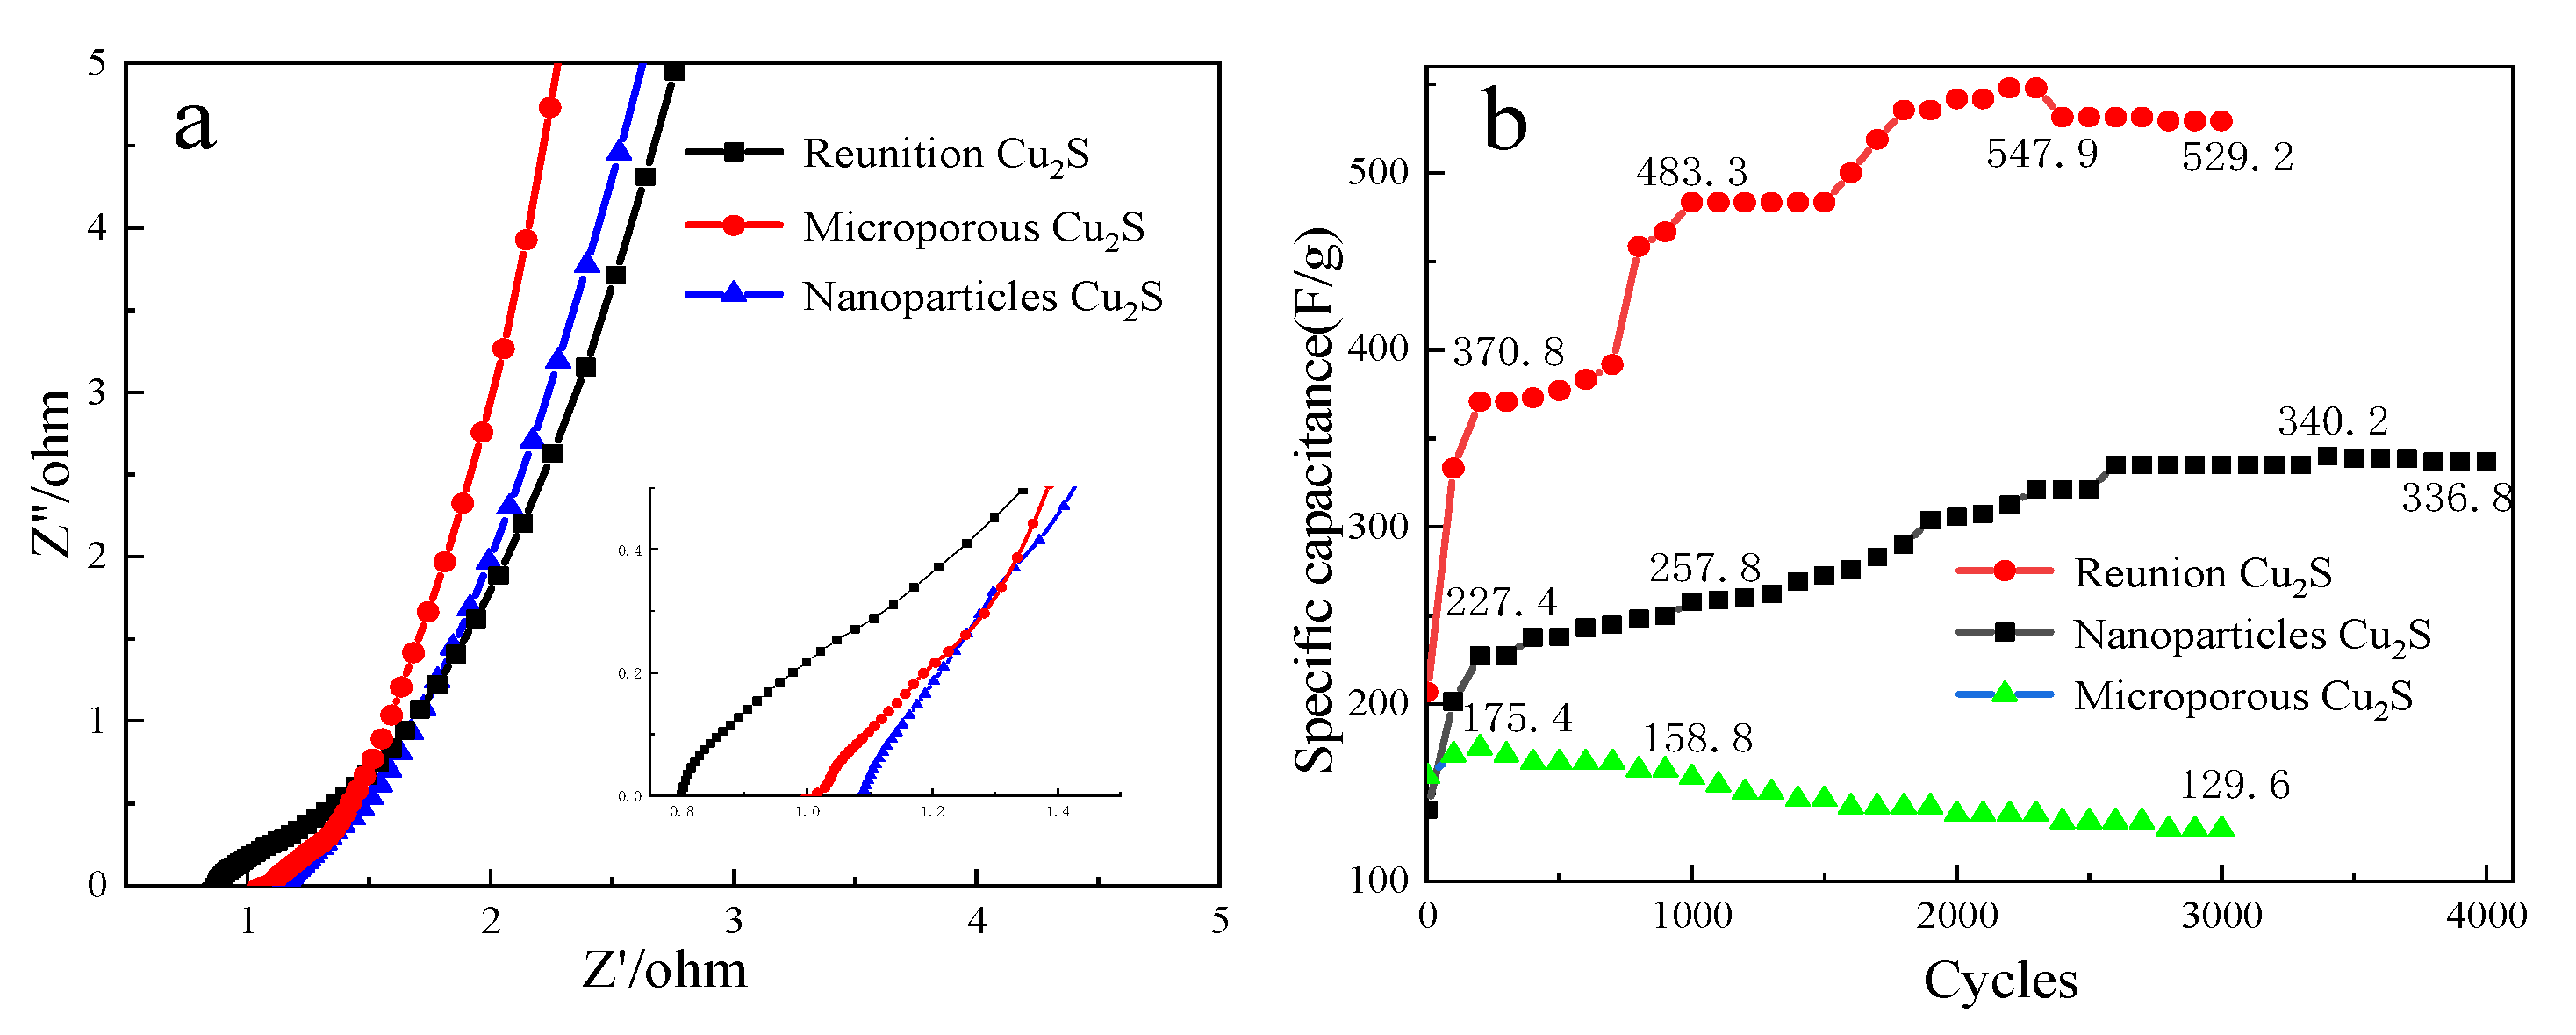
2.2.3. Electrochemical Test Analysis
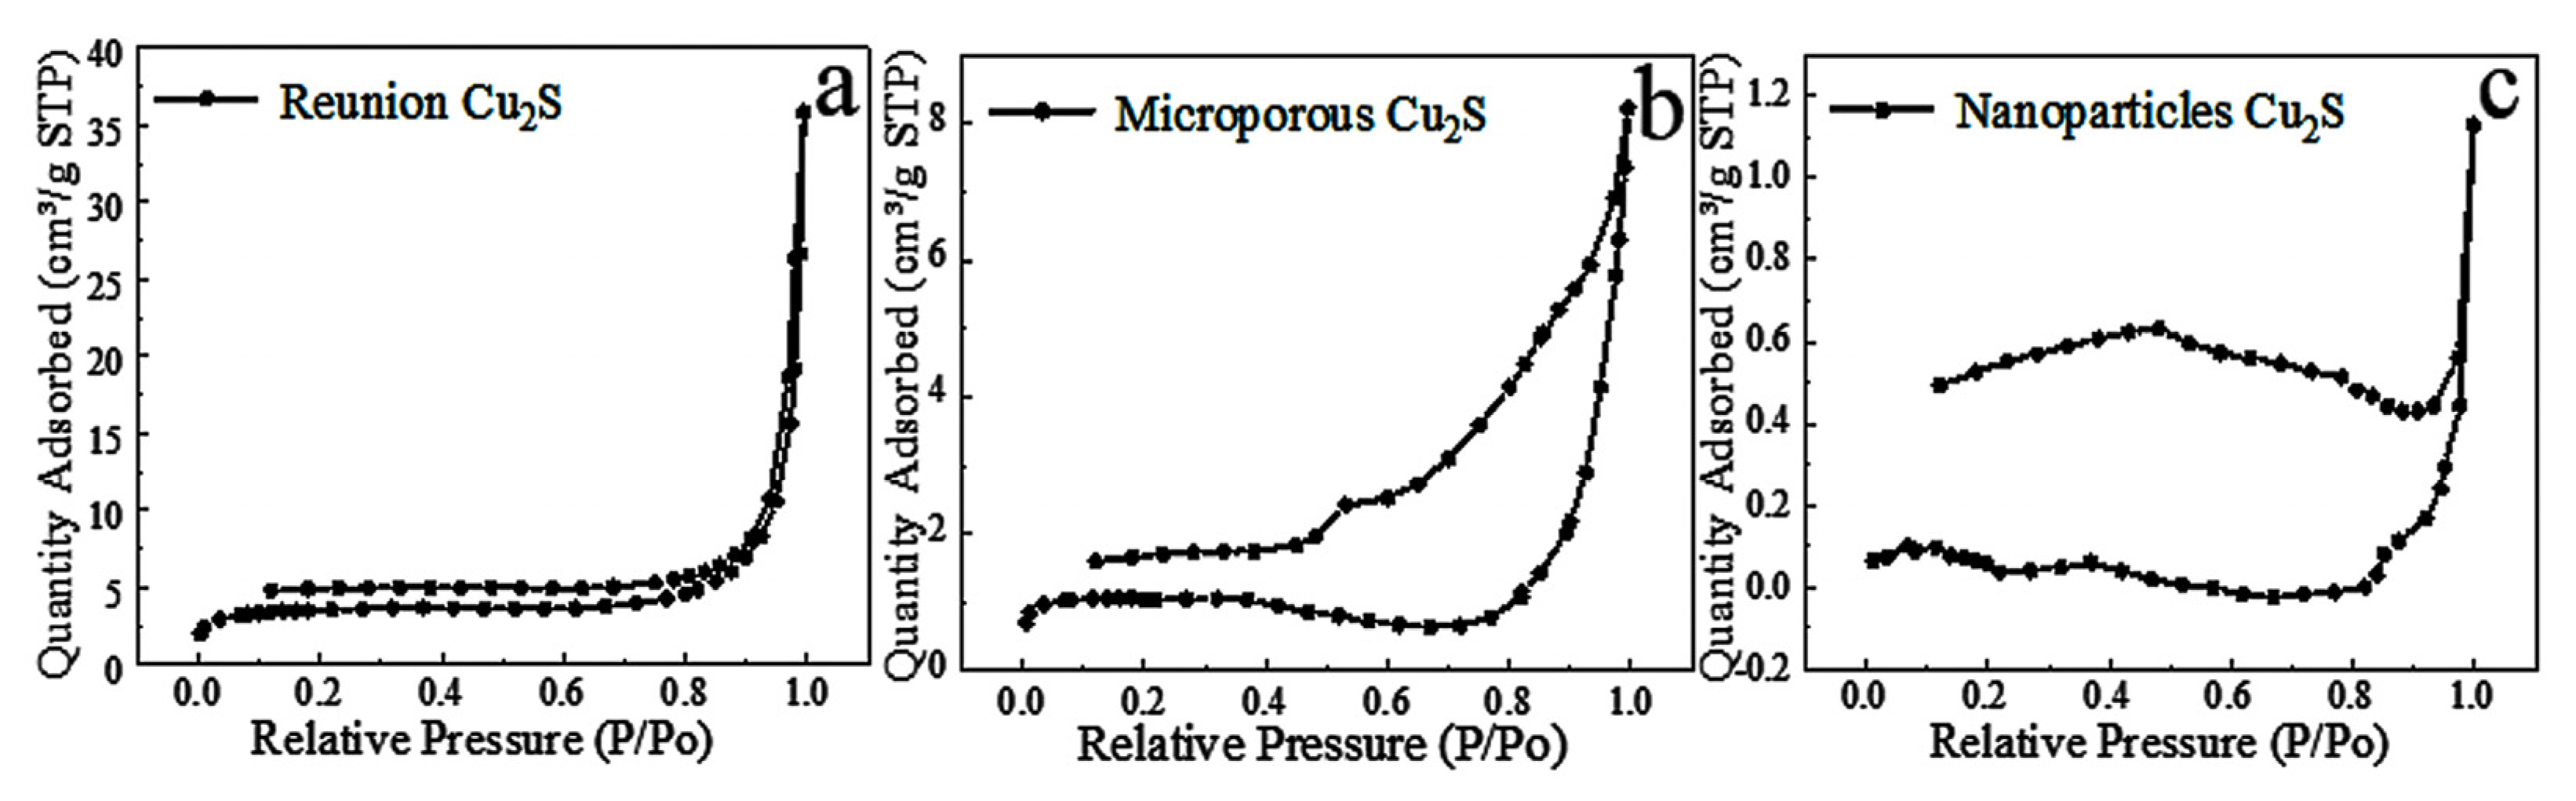
2.2.4. Specific Surface Analysis
3. Materials and Methods
3.1. Chemicals and Materials
3.2. Synthesis of Different Copper Sulfides
3.3. Morphology Control of Cuprous Sulfide
3.4. Preparation of Test Electrodes
4. Conclusions
Author Contributions
Funding
Institutional Review Board Statement
Informed Consent Statement
Data Availability Statement
Conflicts of Interest
Sample Availability
References
- Bhat, T.S.; Patil, P.S.; Rakhi, R.B. Recent trends in electrolytes for supercapacitors. J. Energy Storage 2022, 50, 104222. [Google Scholar] [CrossRef]
- Cao, X.J.; Zeng, H.Y.; Cao, X.; Xu, S.; Alain, G.B.F.C.; Zou, K.M.; Liu, L. 3D-hierarchical mesoporous CuCo2S4@NiCoAl hydrotalcite/Ni foam material for high-performance supercapacitors. Appl. Clay Sci. 2020, 199, 105864. [Google Scholar] [CrossRef]
- Li, M.; Yang, S.; Wang, M. NiCo2O4 and theirs composite materials for supercapacitors. Trans. Nonferrous Met. Soc. China 2017, 27, 2283–2292. [Google Scholar]
- Ma, R.; Peng, C.; Wang, R.; Wang, X.; Zhang, C.; Tan, S. Preparation of Cu−diamond composite coating by composite electroplating. Trans. Nonferrous Met. Soc. China 2015, 25, 3414–3421. [Google Scholar]
- Li, H.-B.; Xiao, G.-F.; Zeng, H.-Y.; Cao, X.-J.; Zou, K.-M.; Xu, S. Supercapacitor based on the CuCo2S4@NiCoAl hydrotalcite array on Ni foam with high-performance. Electrochim. Acta 2020, 352, 136500. [Google Scholar] [CrossRef]
- Howarth, A.J.; Wang, T.C.; Al-Juaid, S.S.; Aziz, S.G.; Hupp, J.T.; Farha, O.K. One-Pot Synthesis of ZnS Nanowires_Cu7S4 Nanoparticles_ Reduce Graphene Oxide Nanocompositites for Supercapacitor and Photocatalytic Applications. Dalton Trans. 2016, 45, 93–97. [Google Scholar] [CrossRef]
- Wang, X.; Chen, X.; Zhou, W.; Li, S. Cubic Nano Cu7S4 with Hollow Structures: Their Preparation and Electrochemical Capacitance Performance. J. Mater. Sci. Eng. 2017, 35, 542–547. [Google Scholar]
- Zhou, K.; Liang, J.; Liu, J.; Sun, P.; Bu, J.; Zhang, W.; Chen, G. Synthesis of porous Cu 7.2 S 4 sub-microspheres by an ion exchange method for high-performance supercapacitors. RSC Adv. 2016, 6, 16832–16837. [Google Scholar] [CrossRef]
- Bulakhe, R.N.; Sahoo, S.; Nguyen, T.T.; Lokhande, C.D.; Roh, C.; Lee, Y.R.; Shim, J.J. Chemical synthesis of 3D copper sulfide with different morphologies for high performance supercapacitors application. RSC Adv. 2016, 6, 14844–14851. [Google Scholar] [CrossRef]
- Zou, Y.; Jiang, L.; Zhai, T.; You, T.; Jing, X.; Liu, R.; Li, F.; Zhou, W.; Jin, S. Surface-enhanced Raman scattering by hierarchical CuS microflowers: Charge transfer and electromagnetic enhancement. J. Alloy. Compd. 2021, 865, 158919. [Google Scholar] [CrossRef]
- Zhu, C.; Liu, T.; Qian, F.; Han, T.Y.J.; Duoss, E.B.; Kuntz, J.D.; Spadaccini, C.M.; Worsley, M.A.; Li, Y. Supercapacitors Based on Three-Dimensional Hierarchical Graphene Aerogels with Periodic Macropores. Nano Lett. 2016, 16, 3448–3456. [Google Scholar] [CrossRef]
- Rajpurohit, A.S.; Punde, N.S.; Rawool, C.R.; Srivastava, A.K. Fabrication of high energy density symmetric supercapacitor based on cobalt-nickel bimetallic tungstate nanoparticles decorated phosphorus-sulphur co-doped graphene nanosheets with extended voltage. Chem. Eng. J. 2019, 371, 679–692. [Google Scholar] [CrossRef]
- Lu, Y.; Li, B.; Zheng, S.; Xu, Y.; Xue, H.; Pang, H. Syntheses and Energy Storage Applications of M xS y(M = Cu, Ag, Au) and Their Composites: Rechargeable Batteries and Supercapacitors. Adv. Funct. Mater. 2017, 27, 1703949. [Google Scholar] [CrossRef]
- Masarapu, C.; Zeng, H.F.; Hung, K.H.; Wei, B. Effect of Temperature on the Capacitance of Carbon Nanotube Supercapacitors. ACS Nano. 2009, 3, 2199–2206. [Google Scholar] [CrossRef]
- Cheng, L.; Li, D.; Yu, W.; Ma, Q.; Dong, X.; Wang, X.; Wang, J.; Liu, G. A Novel Strategy to Fabricate CuS, Cu7.2S4, and Cu2—xSe Nanofibers via Inheriting the Morphology of Electrospun CuO Nanofibers. Russ. J. Phys. Chem. 2019, 93, 730–735. [Google Scholar] [CrossRef]
- Gao, H.; Chen, Y.; Li, H.; Zhang, F.; Tian, G. Hierarchical Cu7S4-Cu9S8 heterostructure hollow cubes for photothermal aerobic oxidation of amines. Chem. Eng. J. 2019, 363, 247–258. [Google Scholar] [CrossRef]
- Jia, C.; Wang, W.; Wang, Y.; Cui, J. Preparation and supercapacitive performance of VO2/C-TiO2 nanotube composite arrays. Trans. Nonferrous Met. Soc. China 2017, 27, 1632–1642. [Google Scholar]
- Zhu, T.; Xia, B.; Zhou, L.; Lou, X.W.D. Arrays of ultrafine CuS nanoneedles supported on a CNT backbone for application in supercapacitors. J. Mater. Chem. 2012, 22, 7851. [Google Scholar] [CrossRef]
- Huang, K.-J.; Zhang, J.-Z.; Fan, Y. One-step solvothermal synthesis of different morphologies CuS nanosheets compared as supercapacitor electrode materials. J. Alloy. Compd. 2015, 625, 158–163. [Google Scholar] [CrossRef]
- Peng, H.; Ma, G.; Sun, K.; Mu, J.; Wang, H.; Lei, Z. High-performance supercapacitor based on multi-structural CuS@polypyrrole composites prepared by in situ oxidative polymerization. J. Mater. Chem. A. 2014, 2, 3303. [Google Scholar] [CrossRef]
- Li, C.; Zhang, X.; Wang, K.; Su, F.; Chen, C.M.; Liu, F.; Wu, Z.S.; Ma, Y. Recent advances in carbon nanostructures prepared from carbon dioxide for high-performance supercapacitors. J. Energy Chem. 2021, 54, 352–367. [Google Scholar] [CrossRef]
- Chen, Q.C.; Yan, G.J.; Luo, L.M.; Fei, C.H.E.N.; Xie, T.F.; Dai, S.C.; Yuan, M.L. Enhanced cycling stability of Mg–F co-modified LiNi 0.6 Co 0.2 Mn 0.2–y Mg y O 2–z F z for lithium-ion batteries. Trans. Nonferrous Met. Soc. China 2018, 28, 1397–1403. [Google Scholar] [CrossRef]
- Azami, M.; Jalil, A.; Hassan, N.; Hussain, I.; Fauzi, A.; Aziz, M. Green carbonaceous material–fibrous silica-titania composite photocatalysts for enhanced degradation of toxic 2-chlorophenol. J. Hazard. Mater. 2021, 414, 125524. [Google Scholar] [CrossRef] [PubMed]
- Hu, W.; Chen, R.; Xie, W.; Zou, L.; Qin, N.; Bao, D. CoNi2S4 Nanosheet Arrays Supported on Nickel Foams with Ultrahigh Capacitance for Aqueous Asymmetric Supercapacitor Applications. ACS Appl. Mater. Interfaces 2014, 6, 19318–19326. [Google Scholar] [CrossRef]
- Liu, L.; Annamalai, K.P.; Tao, Y. A hierarchically porous CuCo2S4/graphene composite as an electrode material for supercapacitors. New Carbon Mater. 2016, 31, 336–342. [Google Scholar] [CrossRef]
- Xu, K.; Merlet, C.; Lin, Z.; Shao, H.; Taberna, P.L.; Miao, L.; Jiang, J.; Zhu, J.; Simon, P. Effects of functional groups and anion size on the charging mechanisms in layered electrode materials. Energy Storage Mater. 2020, 33, 460–469. [Google Scholar] [CrossRef]
- Xia, X.; Zhu, C.; Luo, J.; Zeng, Z.; Guan, C.; Ng, C.F.; Zhang, H.; Fan, H.J. Synthesis of Free-Standing Metal Sulfide Nanoarrays via Anion Exchange Reaction and Their Electrochemical Energy Storage Application. Small 2014, 10, 766–773. [Google Scholar] [CrossRef]
- Wang, Z.; Peng, C.; Wang, R.; Wang, X.; Liu, B. Typical properties and research progress of Al-doped-ZnO. Trans. Nonferrous Met. Soc. China 2012, 22, 416–426. [Google Scholar]


| Material | Cu–S Ratio | C(1 A/g) | C(10 A/g) | Retention |
|---|---|---|---|---|
| CuS | 1:1 | 43.2 F/g | 27.4 F/g | 63.4% |
| Cu7S4 | 1.75:1 | 86.3 F/g | 83.1 F/g | 96.3% |
| Cu9S5 | 1.8:1 | 154 F/g | 151.7 F/g | 98.5% |
| Cu7.2S4 | 1.8:1 | 185.4 F/g | 148.9 F/g | 80.3% |
| Cu2S | 2:1 | 206.9 F/g | 193.8 F/g | 93.7% |
| Material | C(1 A/g) | C(10 A/g) | Retention |
|---|---|---|---|
| Intensive reunion Cu2S | 206.9 F/g | 193.8 F/g | 93.7% |
| Microporous Cu2S | 169.2 F/g | 159.2 F/g | 94.1% |
| Nanoparticles Cu2S | 147.2 F/g | 140.6 F/g | 97% |
Disclaimer/Publisher’s Note: The statements, opinions and data contained in all publications are solely those of the individual author(s) and contributor(s) and not of MDPI and/or the editor(s). MDPI and/or the editor(s) disclaim responsibility for any injury to people or property resulting from any ideas, methods, instructions or products referred to in the content. |
© 2023 by the authors. Licensee MDPI, Basel, Switzerland. This article is an open access article distributed under the terms and conditions of the Creative Commons Attribution (CC BY) license (https://creativecommons.org/licenses/by/4.0/).
Share and Cite
Ding, Y.; Lin, R.; Xiong, S.; Zhu, Y.; Yu, M.; Duan, X. The Effect of Copper Sulfide Stoichiometric Coefficient and Morphology on Electrochemical Performance. Molecules 2023, 28, 2487. https://doi.org/10.3390/molecules28062487
Ding Y, Lin R, Xiong S, Zhu Y, Yu M, Duan X. The Effect of Copper Sulfide Stoichiometric Coefficient and Morphology on Electrochemical Performance. Molecules. 2023; 28(6):2487. https://doi.org/10.3390/molecules28062487
Chicago/Turabian StyleDing, Yanhong, Rongpeng Lin, Shuicheng Xiong, Yirong Zhu, Meng Yu, and Xiaobo Duan. 2023. "The Effect of Copper Sulfide Stoichiometric Coefficient and Morphology on Electrochemical Performance" Molecules 28, no. 6: 2487. https://doi.org/10.3390/molecules28062487
APA StyleDing, Y., Lin, R., Xiong, S., Zhu, Y., Yu, M., & Duan, X. (2023). The Effect of Copper Sulfide Stoichiometric Coefficient and Morphology on Electrochemical Performance. Molecules, 28(6), 2487. https://doi.org/10.3390/molecules28062487