
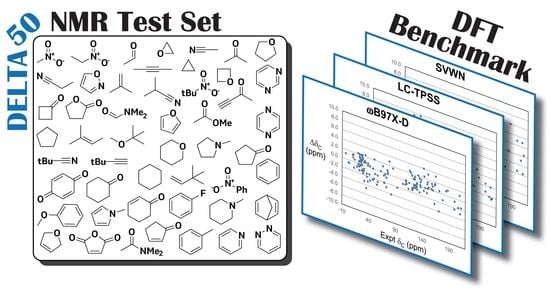
DELTA50: A Highly Accurate Database of Experimental 1H and 13C NMR Chemical Shifts Applied to DFT Benchmarking
 and
and
Abstract
1. Introduction

| Best δH Method a | Best δC Method a | Orig. b | Geom. Optimization | Solv./Model c | Conv. d | Benchmark Set | Ref. |
|---|---|---|---|---|---|---|---|
| mPW1LYP/6-311+G(2d,p) | WP04/DGTZVP | GIAO | B3LYP/6-311+G(2d,p) | CDCl3/SMD | linear | 104 small organics | [50] |
| BMK/6-311G(d) | BMK/6-31G(d) | GIAO | B3LYP/6-31+G(d,p) | toluene/none | linear | 37 small organics | [48] |
| B97-2/pcS-3 | B97-2/pcS-3 | GIAO | B3LYP-D3/def2-TZVP | water/CPCM | MOSS | 176 metabolites | [69] |
| B3LYP/6-31G(d,p) | B3LYP/6-31G(d,p) | GIAO | B3LYP/6-31G(d,p) | gas/none | linear | 28 small organics | [70] |
| B97-2/pcS-2 | B97-2/6-311G(d,p) | GIAO | CCSD(T)/cc-pVTZ | gas/none | TMS | 29 CCSD(T) calcs. | [71] |
| δH not evaluated | B3LYP/6-311+G(d) B3LYP/MIDI! | GIAO | B3LYP/MIDI! | gas/none CDCl3/none | linear | 15 gas cmpds. 37 solution cmpds. | [72] |
| not recommended e | LC-TPSS/cc-pVTZ | CSGT | LC-TPSS/def2-SVP | CDCl3/COSMO | linear | 39 small molecules | [55] |
| WP04/pcS-2 PBE0/6-31G(d) | PBE0/pcS-2 PBE0/6-31G(d) | GIAO | δH: B3LYP/6-31(d) δC: ωB97X-D/6-31G(d) | CDCl3/PCM | linear | 24 heterocycles | [51] |
| WP04/aug-cc-pVDZ | mPW1PW91/ 6-311+G(2d,p) | GIAO | B3LYP/6-31+G(d,p) | CDCl3/PCM | linear | 23 small organics | [73] |
| B3LYP/6-311++G(2df,p) | δC not evaluated | GIAO | B3LYP/6-31+G(d) | CDCl3/none | linear | 80 small organics | [1] |
| WP04/aug-cc-pVDZ | δC not evaluated | GIAO | B3LYP/6-31G(d) | CDCl3/PCM | linear | 80 small organics | [56] |
| B3LYP/cc-pVDZ | B3LYP/cc-pVDZ | GIAO | B3LYP/6-31G(d) | CDCl3/COSMO | linear | 312 small molecules | [74] |
| SSB-D/ET-pVQZ | SSB-D/ET-pVQZ | GIAO | SSB-D/ET-pVQZ | gas/none | TMS | 33 small molecules | [75] |
| PBE0/cc-pVTZ | PBE0/aug-cc-pVDZ | CSGT | B3LYP/6-311++G(d,p) | CDCl3/none | TMS | 25 small organics | [49] |
| B3LYP/6-311++G(d,p) | δC not evaluated | GIAO | B3LYP/6-31G(d,p) | CDCl3/none | C6H6 | 14 aromatics | [76] |
| δH not evaluated | B3LYP/cc-pVDZ | GIAO | B3LYP/6-311++G(2d,p) | DMSO/CPCM | linear | 51 organics | [77] |
| LH20t/pcSseg-4 | mPSTS/pcSseg-4 | curr. f | CCSD(T)/cc-pVTZ | gas/none | TMS | 23 small organics f | [78] |
| DSD-PBEP86/ps4 | DSD-PBEP86/ps4 | GIAO | CCSD(T)/cc-pVTZ | gas/none | CH4 | 15 gas cmpds. | [53] |
| mPW1PW91/6-311G(d) | same as δH method | GIAO | B3LYP/6-31G(d,p) | CDCl3/PCM | TMS | 25 organics | [79] |
| revTPSS/cc-pVTZ | δC not evaluated | GIAO | M06-2X/6-311+G(2d,p) | gas/none | TMS | 72 small organics | [54] |
| DSD-PBEP86/pcSseg-3 | MP2/pcSseg-3 | GIAO | CCSD(T)/cc-pVQZ | gas/none | N/A g | 117 gas cmpds. | [80] |

2. Results and Discussion
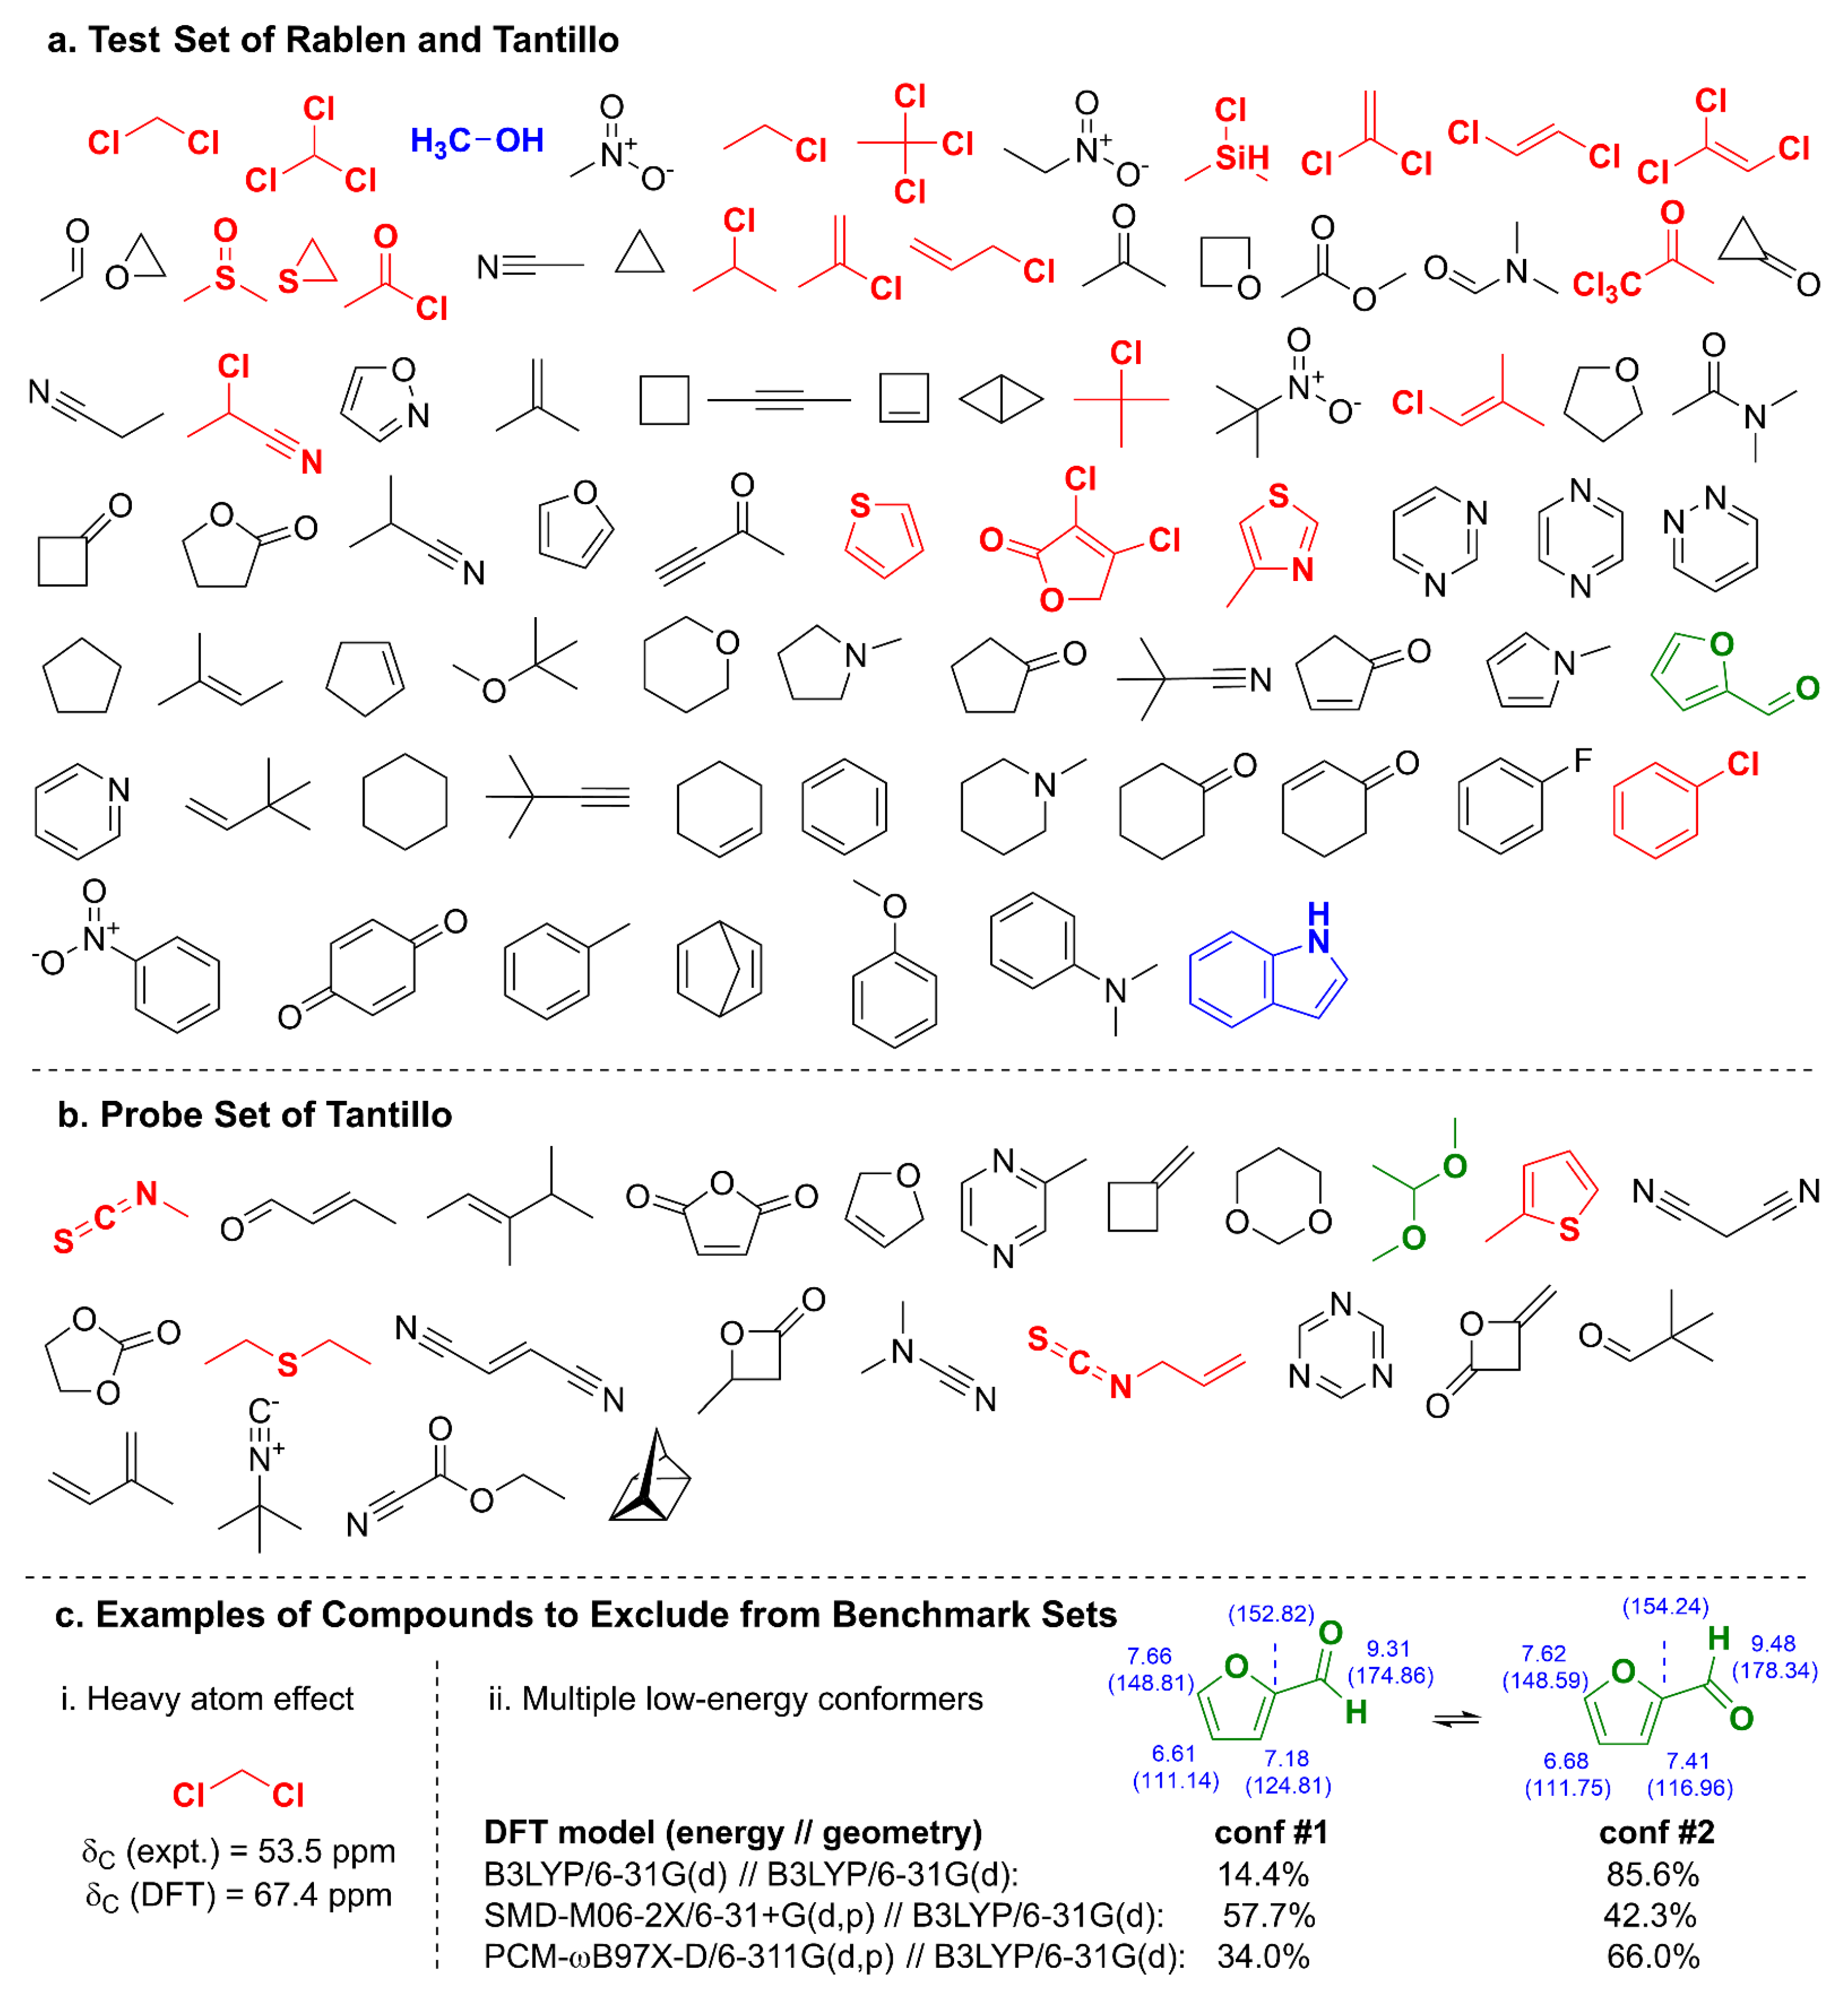
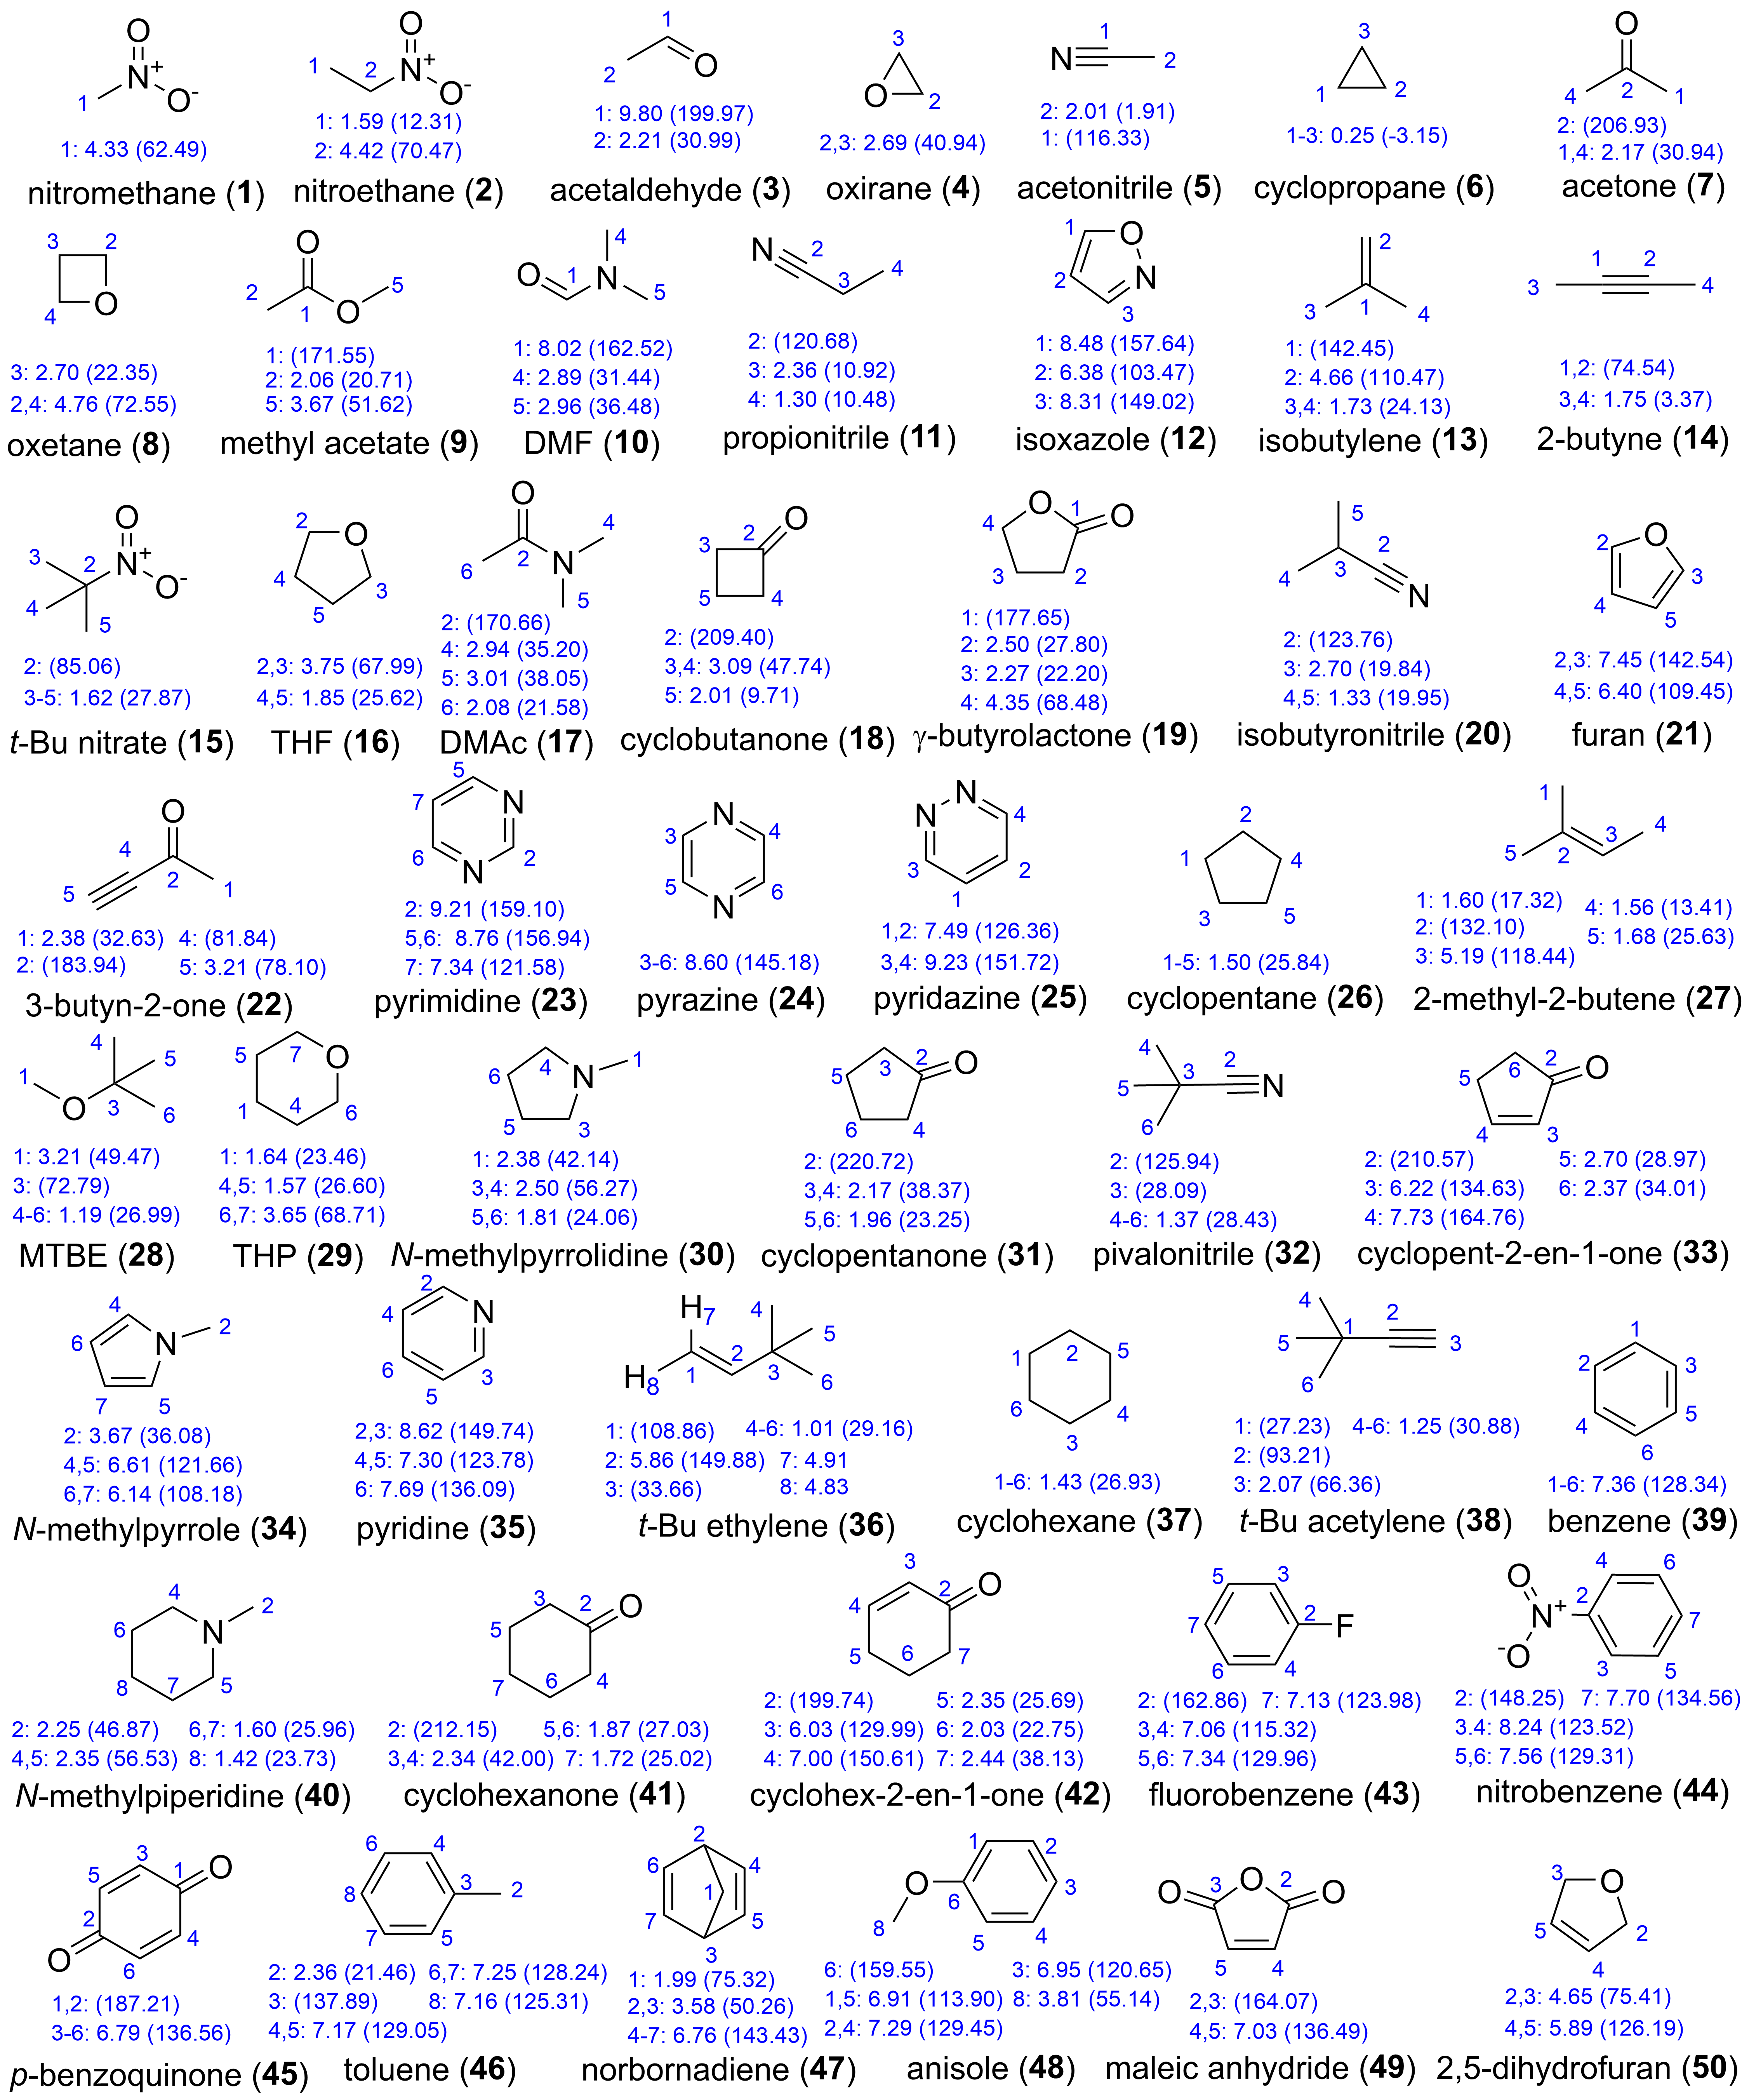
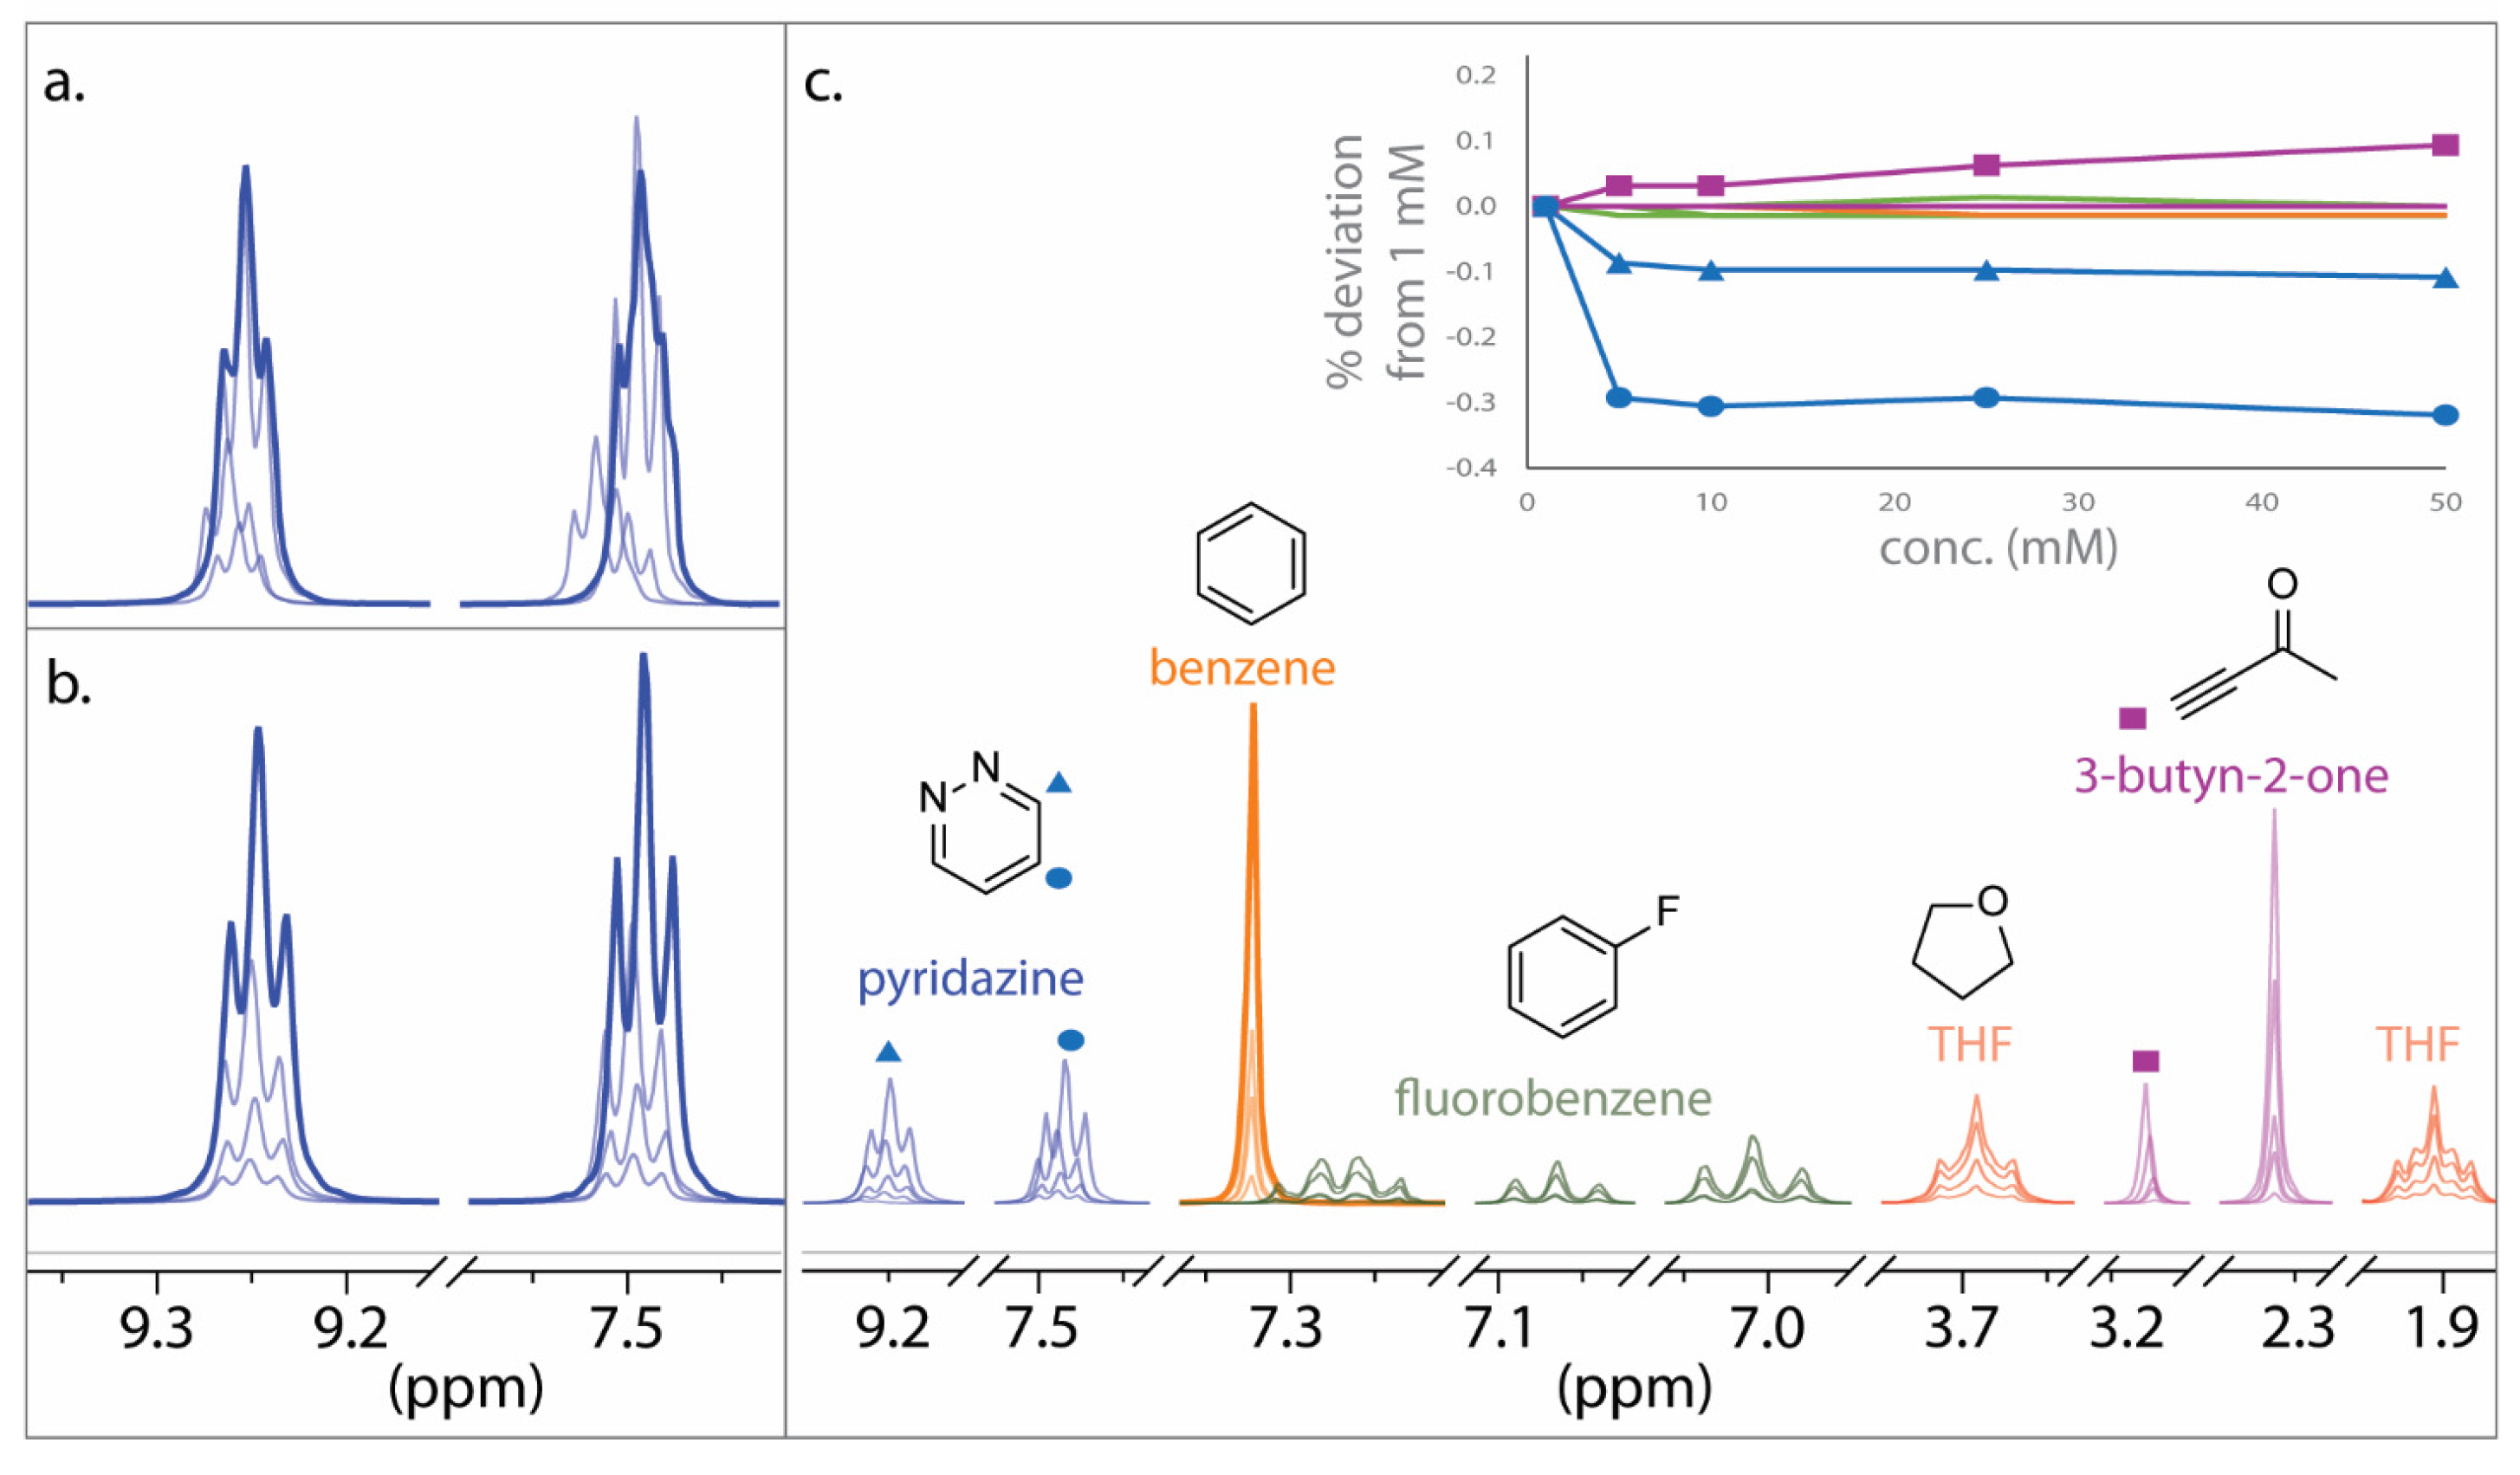
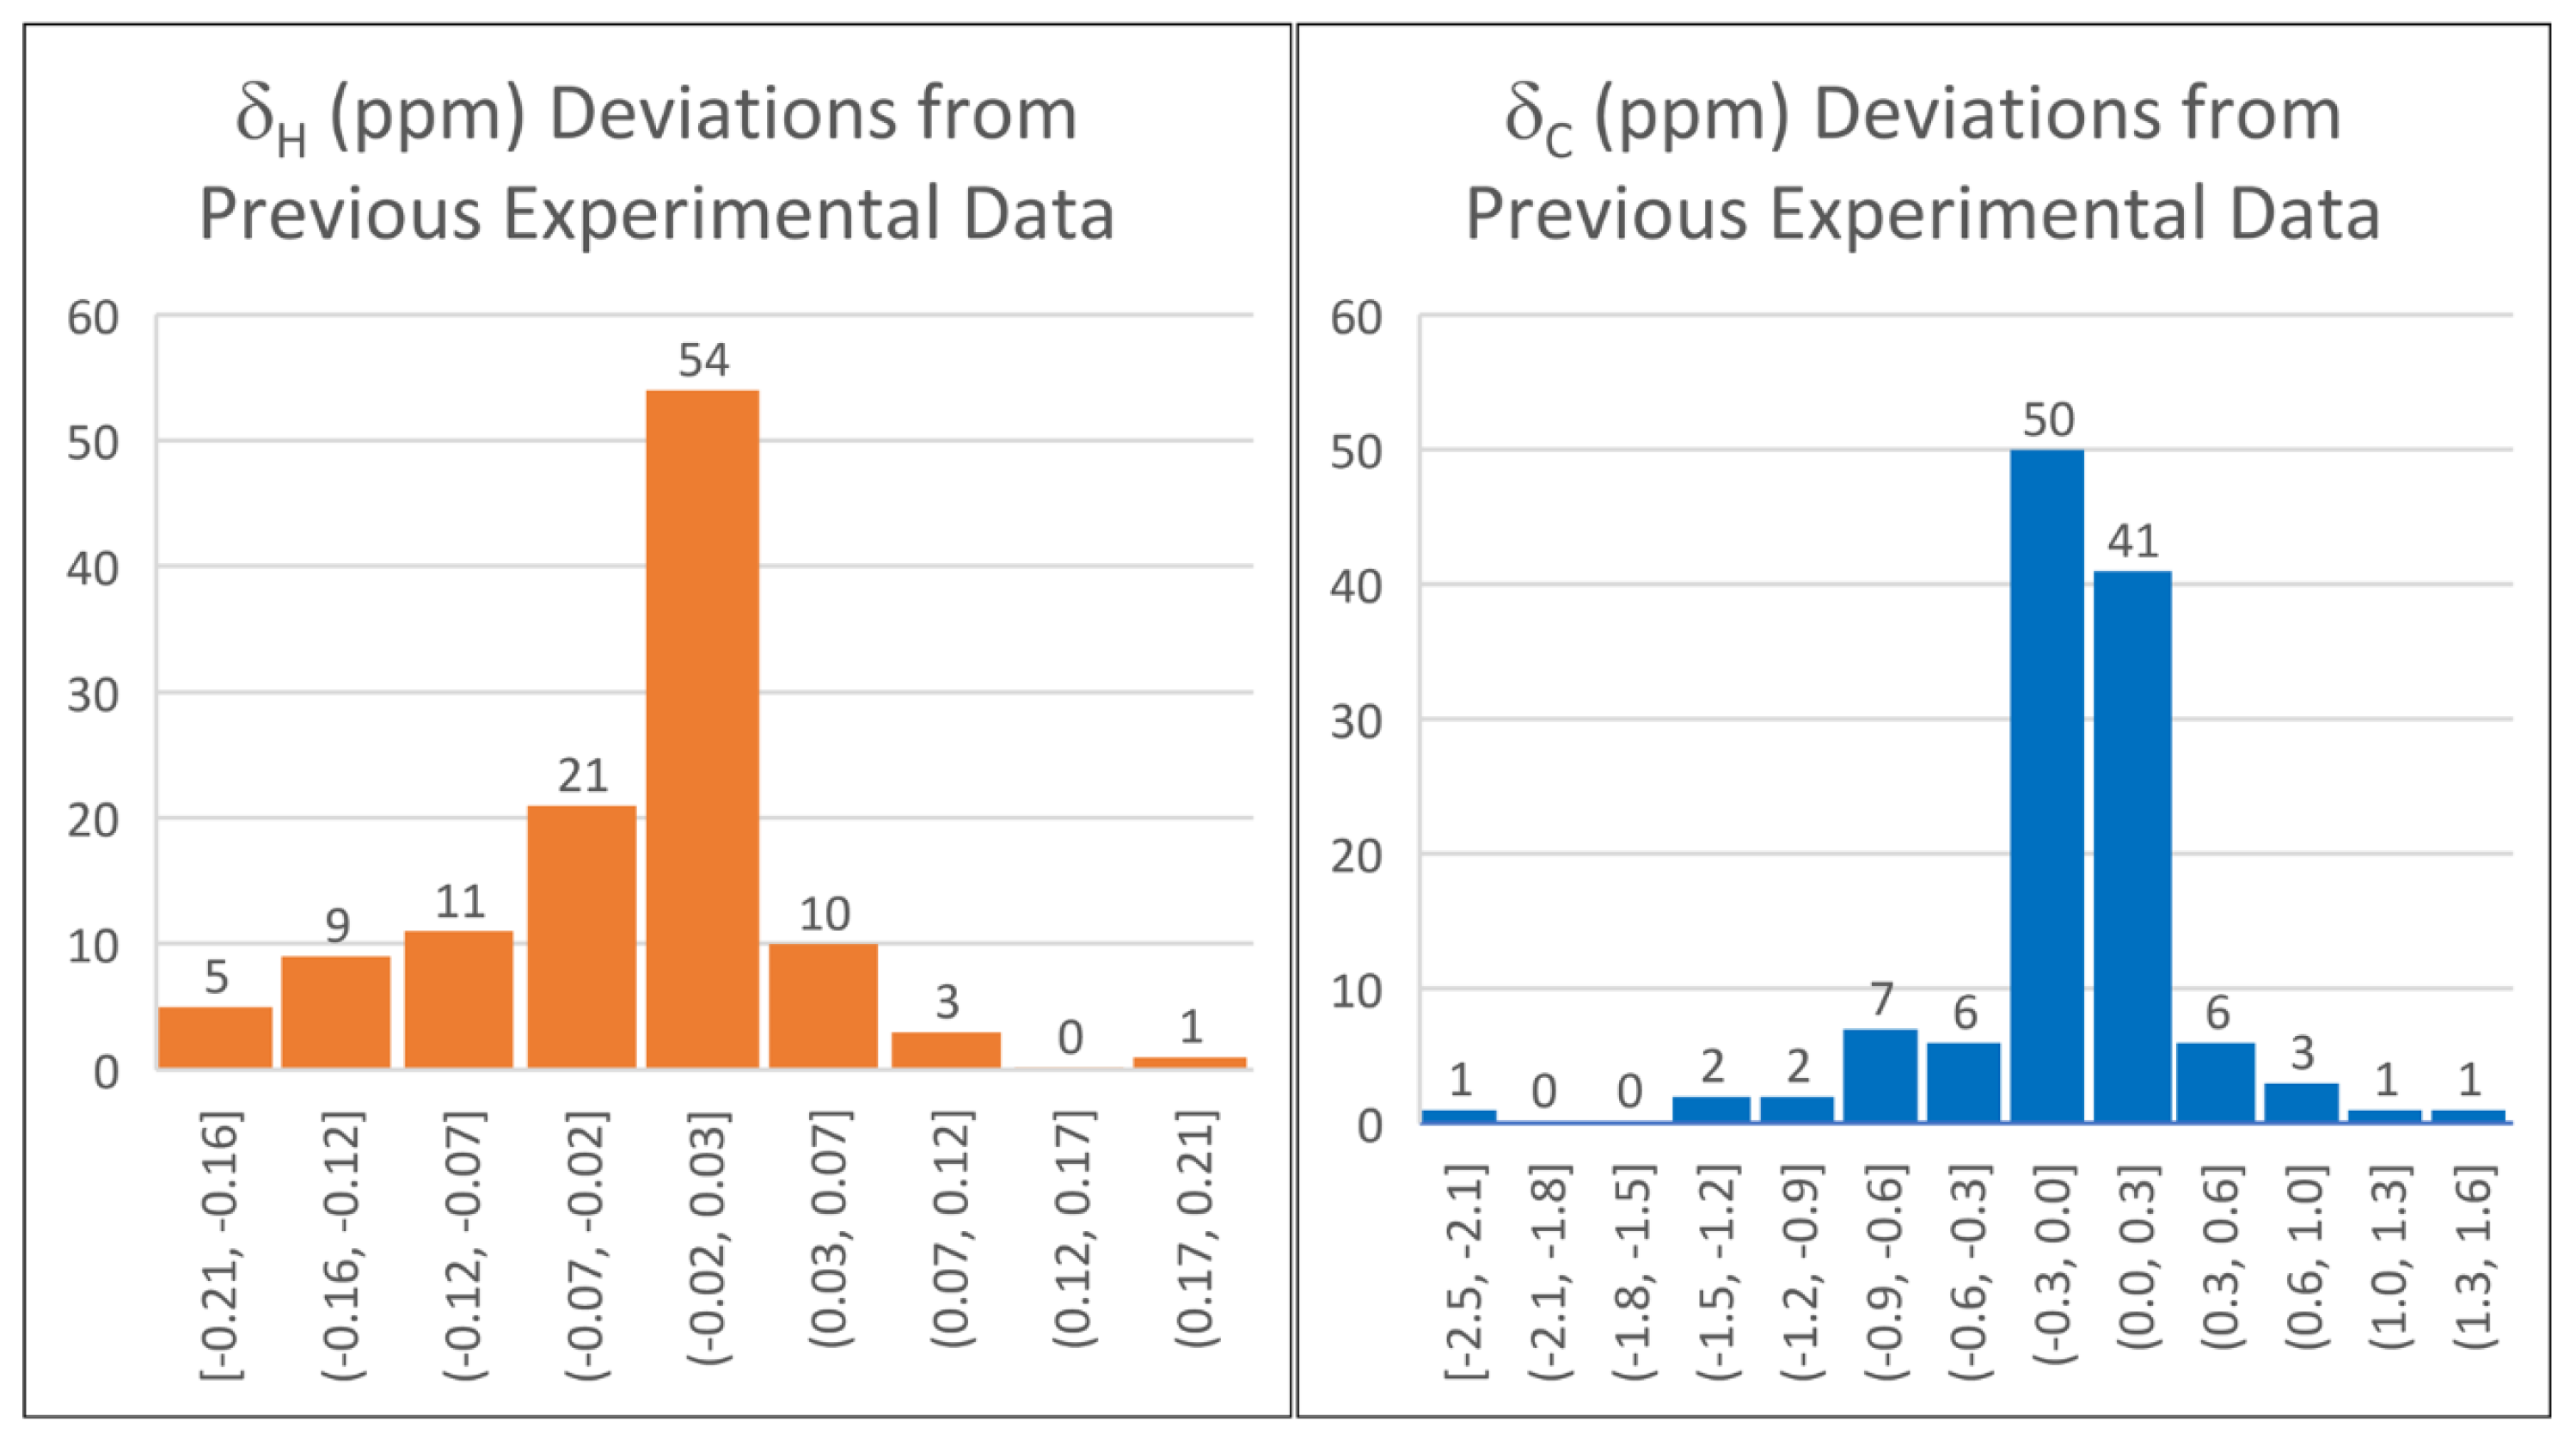
2.1. DELTA50 Compound Curation and Experimental Measurements
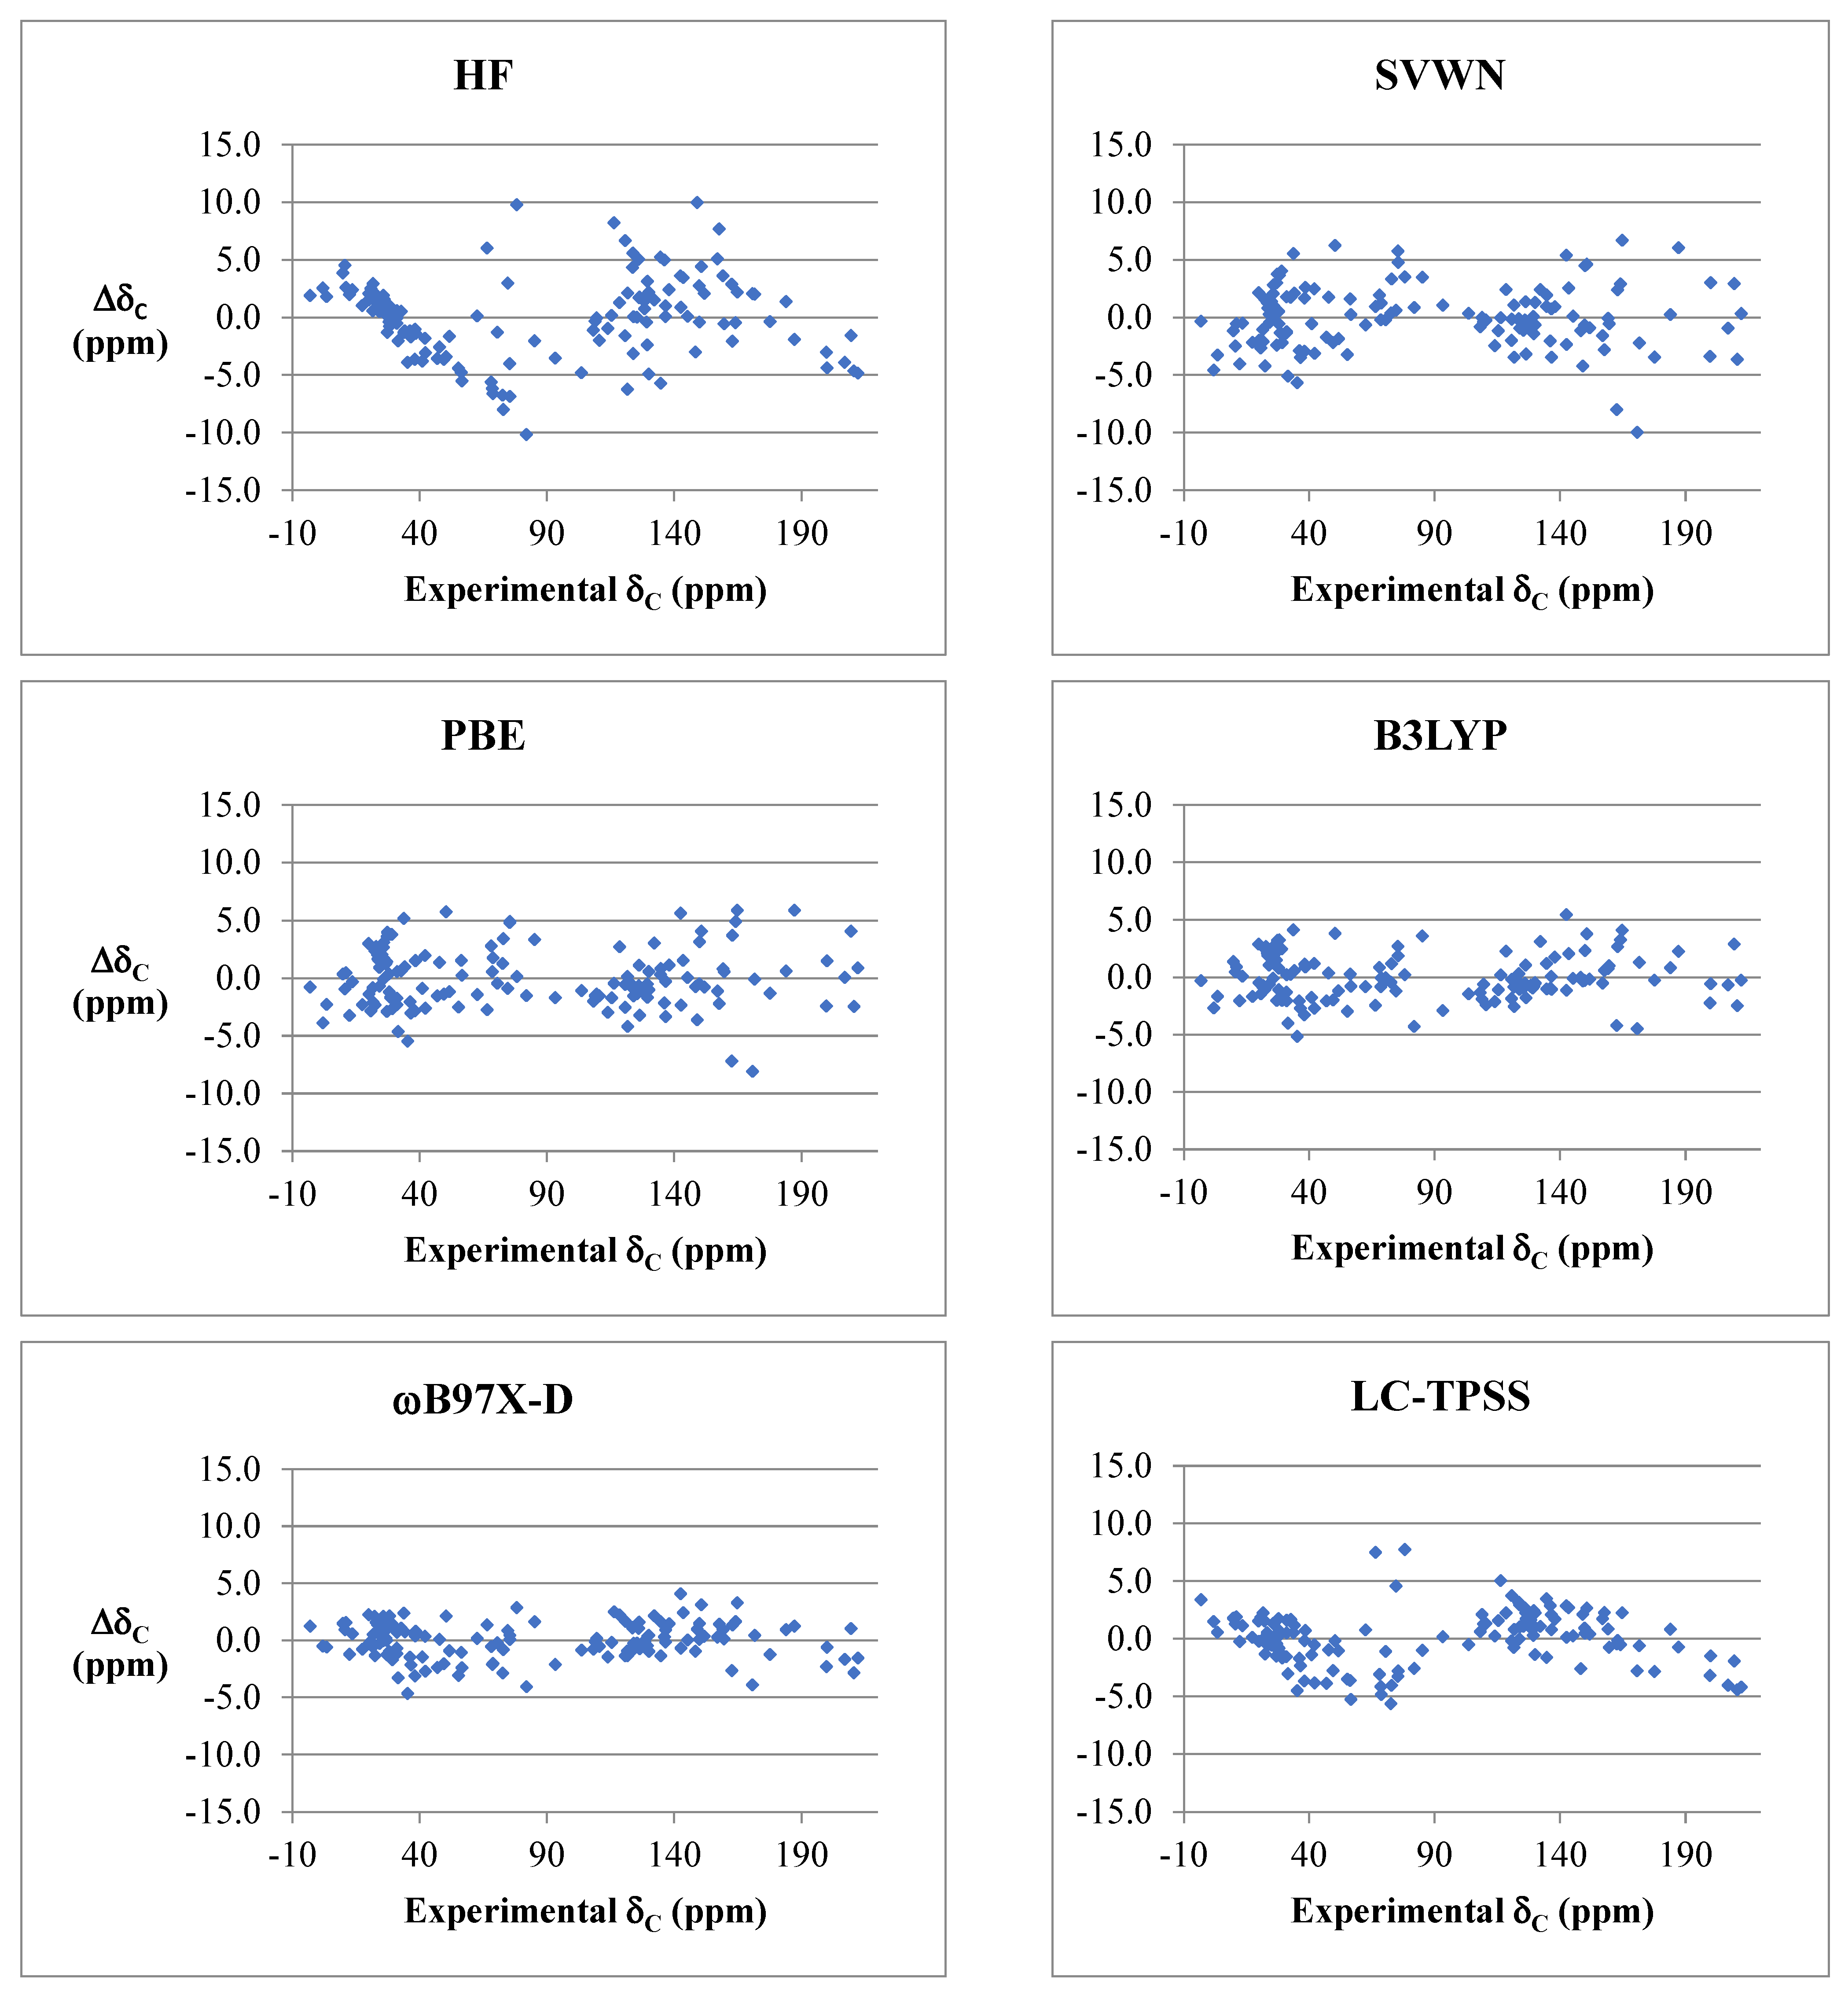
2.2. DFT Benchmark Study
| δH (ppm) | δC (ppm) | |||
|---|---|---|---|---|
| Solvent Model b | RMSD c | MD c | RMSD c | MD c |
| PCM | 0.079 | 0.21 | 1.50 | 4.61 |
| CPCM | 0.080 | 0.20 | 1.50 | 4.57 |
| SMD | 0.087 | 0.29 | 1.51 | 4.69 |
| none | 0.107 | 0.33 | 1.84 | 5.31 |
| Calculation Step | Method 1: Speed + Efficiency | Method 2: High Accuracy |
|---|---|---|
| Geometry Optimization | B3LYP/6-31G(d) a | PCM-B3LYP-D3/6-311G(d,p) |
| Energy Calculation | PCM-B3LYP-D3/6-31G(d) | PCM-B3LYP-D3/6-311G(d,p) |
| δH Calculation | GIAO-PCM-WP04/jul-cc-pVDZ | GIAO-PCM-WP04/6-311++G(2d,p) |
| δH Scaling Factors b | m = −1.0309, b = 31.8883 | m = −1.0311, b = 32.2654 |
| δC Calculation | GIAO-PCM-ωB97X-D/def2-SVP | GIAO-PCM-ωB97X-D/def2-SVP |
| δC Scaling Factors b | m = −1.0081, b = 195.6683 | m = −1.0065, b = 196.0386 |
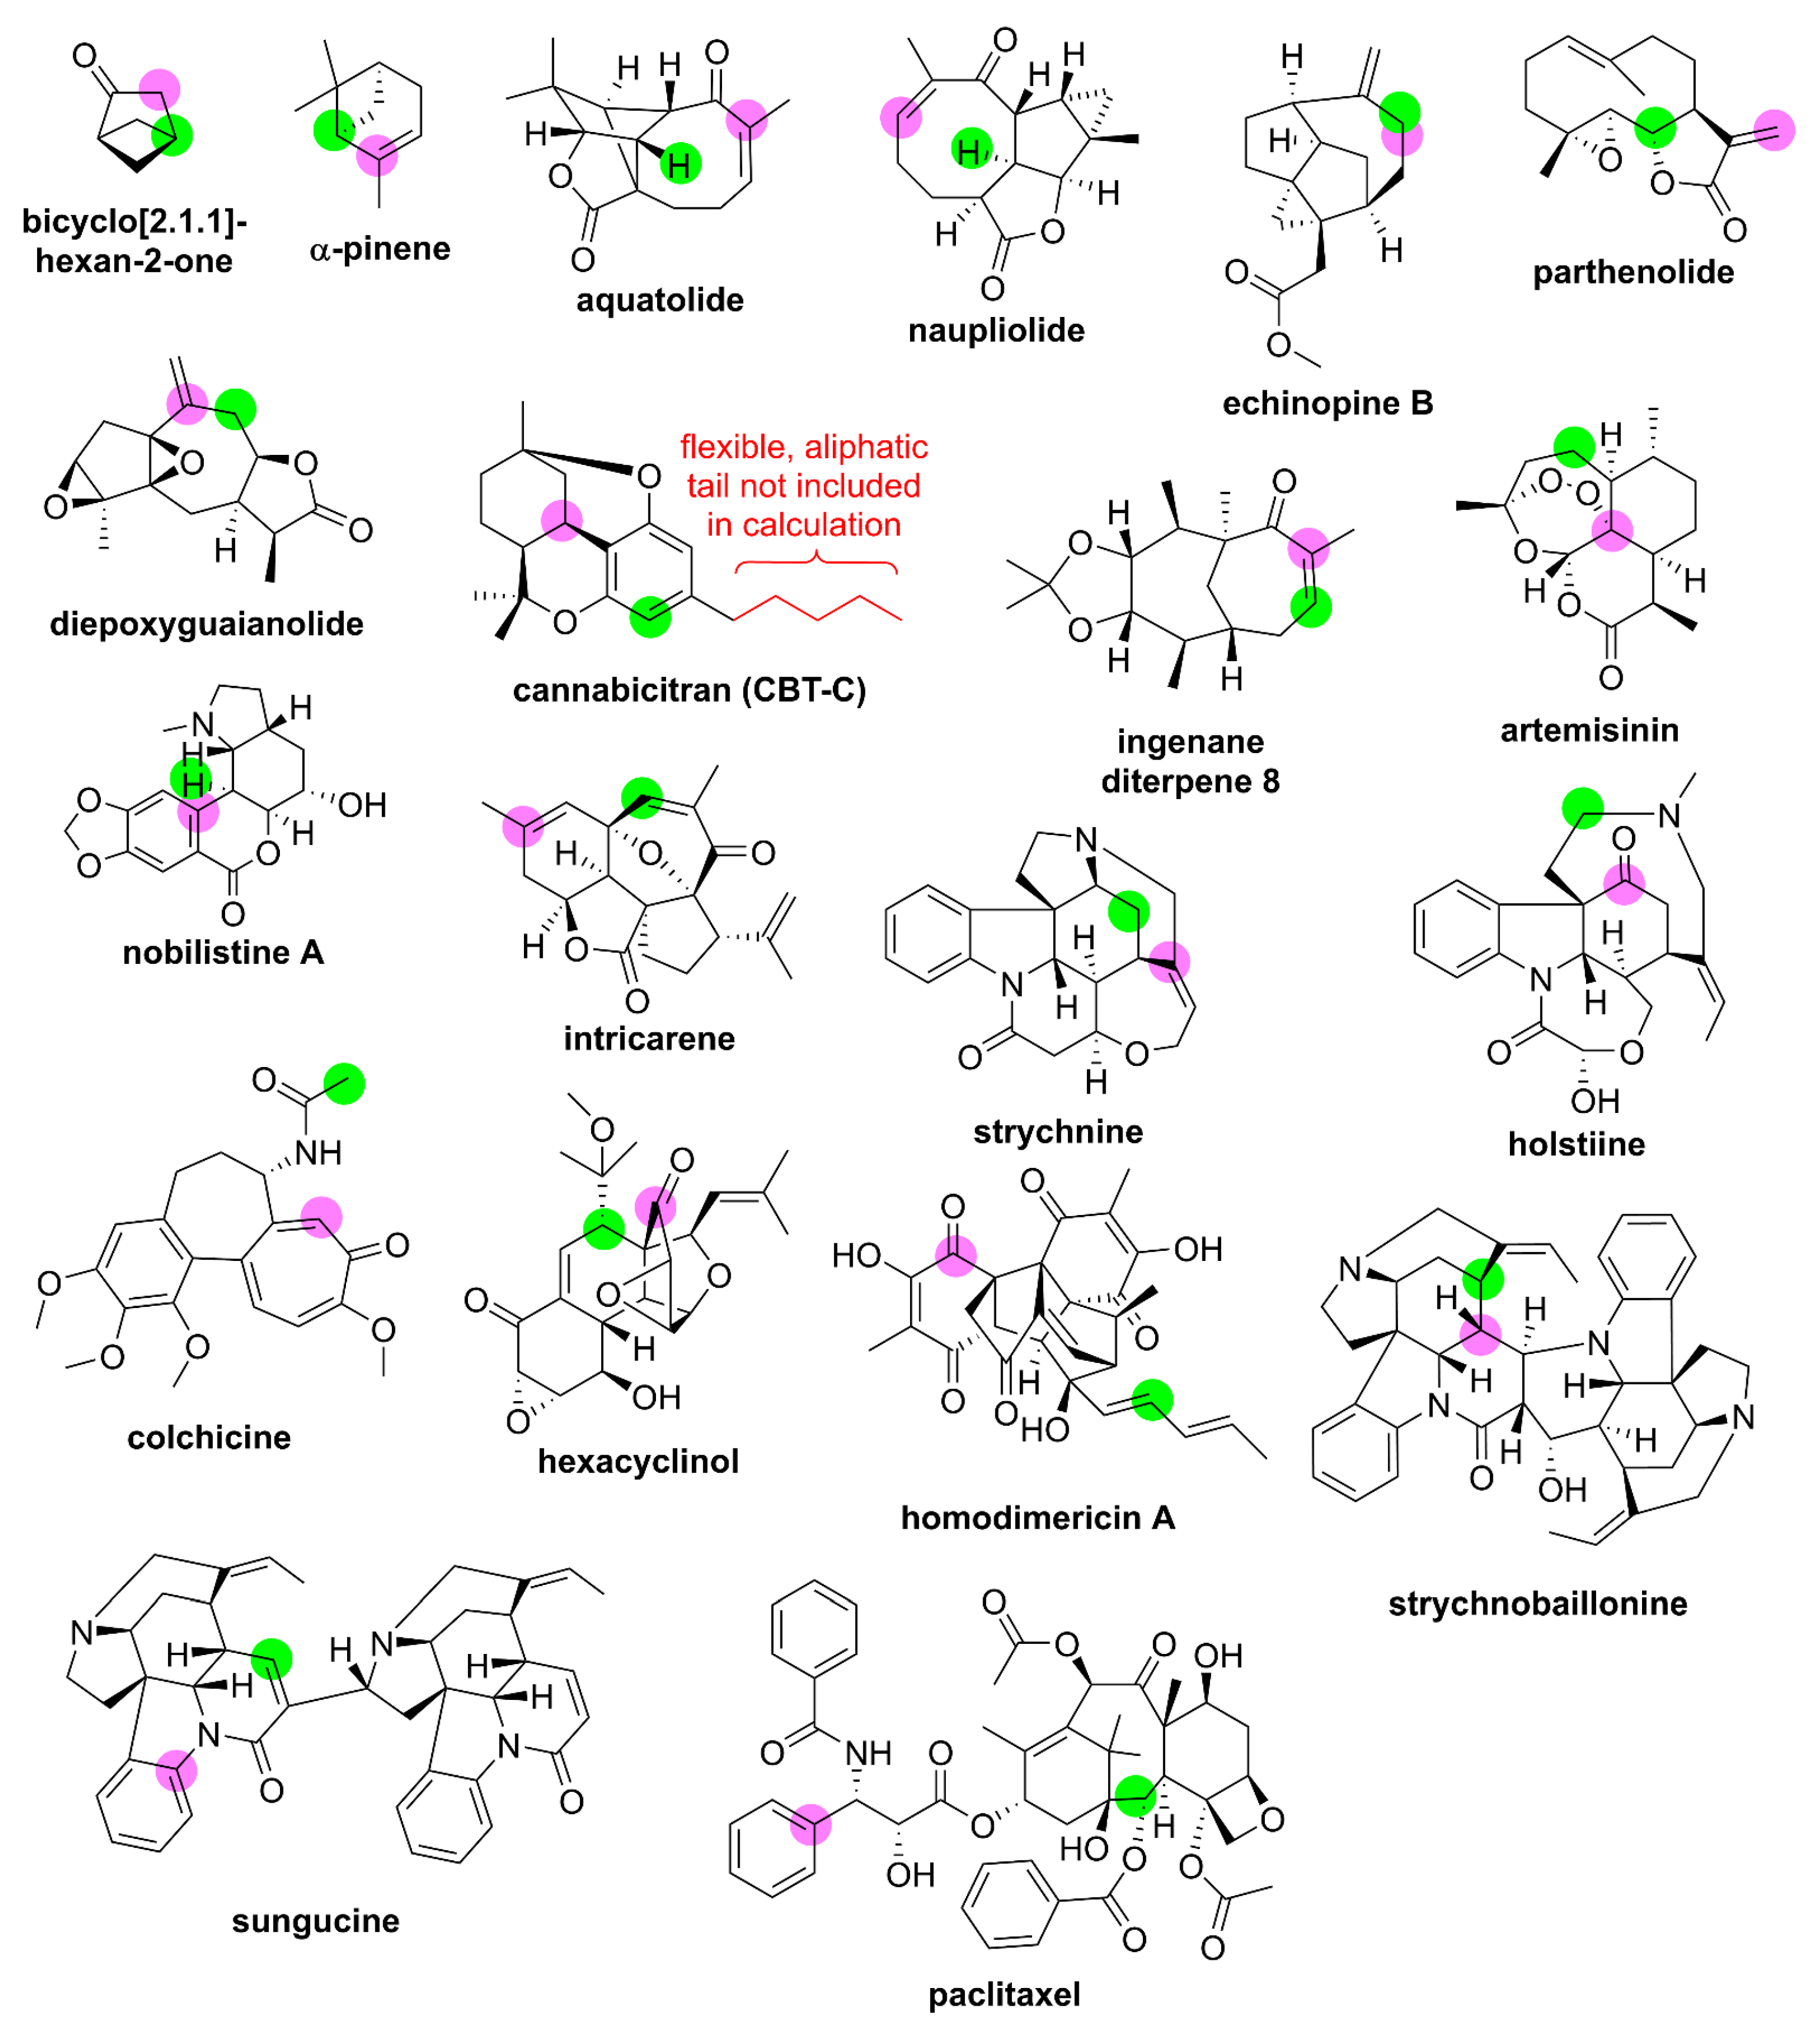
2.3. Probe Set Evaluation
| Compound | MW (g mol−1) | Confs c | δ (ppm) | This Study a | Previous DFT Studies | |||||
|---|---|---|---|---|---|---|---|---|---|---|
| Method 1 | Method 2 | |||||||||
| RMSD d | MD d | RMSD d | MD d | RMSD d | MD d | Ref. e | ||||
| bicyclo [2.1.1]-hexan-2-one | 96 | 1 | δH: δC: | 0.03 0.6 | 0.05 0.8 | 0.07 0.5 | 0.12 0.7 | 0.12 1.1 | 0.20 1.7 | [26] |
| α-pinene | 136 | 1 | δH: δC: | 0.08 1.6 | 0.19 3.5 | 0.08 1.5 | 0.15 3.6 | 0.63 3.6 | 1.14 7.4 | [115] |
| aquatolide | 246 | 3 | δH: δC: | 0.10 1.7 | 0.26 4.1 | 0.05 1.5 | 0.11 3.2 | 0.11 1.8 | 0.27 4.1 | [26] |
| naupliolide | 246 | 4 | δH: δC: | 0.14 2.3 | 0.33 5.5 | 0.10 1.9 | 0.20 5.6 | 0.23 3.0 | 0.58 7.8 | [26] |
| echinopine B | 246 | 9 | δH: δC: | 0.07 1.4 | 0.17 2.6 | 0.08 1.4 | 0.22 2.5 | 0.10 2.5 | 0.22 5.5 | [26] |
| parthenolide | 248 | 3 | δH: δC: | 0.08 1.5 | 0.14 3.0 | 0.02 1.4 | 0.04 2.8 | not available | ||
| diepoxy-guaianolide | 262 | 5 | δH: δC: | 0.12 1.7 | 0.21 4.1 | 0.05 1.8 | 0.12 4.1 | 0.18 1.3 | 0.44 2.6 | [116] |
| cannabicitran (CBT-C) | 258 b | 2 | δH: δC: | 0.11 0.9 | 0.17 2.2 | 0.07 1.0 | 0.17 2.2 | 0.12 1.1 | 0.31 2.0 | [117] |
| ingenane diterpene 8 | 278 | 2 | δH: δC: | 0.17 2.7 | 0.39 4.5 | 0.06 2.2 | 0.14 4.7 | 0.08 2.2 | 0.20 3.9 | [26] |
| artemisinin | 282 | 1 | δH: δC: | 0.10 1.1 | 0.25 2.1 | 0.12 1.1 | 0.24 2.3 | -- f 0.8g | -- f 1.4 g | [118] |
| nobilistine A | 317 | 20 | δH: δC: | 0.14 1.7 | 0.25 3.6 | 0.12 1.5 | 0.25 3.5 | 0.27 1.6 | 0.65 3.1 | [119] |
| intricarene | 326 | 2 | δH: δC: | 0.10 2.3 | 0.24 4.0 | 0.09 2.1 | 0.21 3.8 | 0.12 2.2 | 0.27 4.9 | [26] |
| strychnine | 334 | 3 | δH: δC: | 0.15 1.5 | 0.41 4.0 | 0.10 1.4 | 0.25 3.8 | 0.08 1.8 | 0.18 6.7 | [120] |
| holstiine | 382 | 4 | δH: δC: | 0.16 2.4 | 0.30 7.7 | 0.10 1.9 | 0.23 5.1 | 0.21 2.9 | 0.47 11.3 | [121] |
| colchicine | 399 | 81 | δH: δC: | 0.10 2.1 | 0.21 3.8 | 0.11 2.2 | 0.20 4.0 | 0.16 2.3 | 0.25 5.0 | [59] |
| hexacyclinol | 416 | 23 | δH: δC: | 0.15 2.4 | 0.38 7.0 | 0.13 2.1 | 0.30 5.9 | 0.29 4.6 | 0.62 9.0 | [122] |
| homodimericin A | 491 | 9 | δH: δC: | 0.10 3.4 | 0.21 7.7 | 0.10 2.9 | 0.19 6.5 | not available | ||
| strychnobaillonine | 613 | 12 | δH: δC: | 0.19 3.0 | 0.46 10.4 | 0.16 2.4 | 0.34 6.4 | 0.22 2.9 | 0.62 6.7 | [123] |
| sungucine | 635 | 11 | δH: δC: | 0.18 1.9 | 0.51 4.4 | 0.14 1.8 | 0.31 4.5 | 0.18 1.8 | 0.64 5.4 | [124] |
| paclitaxel | 854 | >157 | δH: δC: | 0.17 2.8 | 0.43 7.2 | 0.19 2.3 | 0.52 6.3 | -- f 3.7 | -- f 9.1 | [125] |
3. Materials and Methods
4. Conclusions
Supplementary Materials
Author Contributions
Funding
Institutional Review Board Statement
Informed Consent Statement
Data Availability Statement
Acknowledgments
Conflicts of Interest
References
- Rablen, P.R.; Pearlman, S.A.; Finkbiner, J. A Comparison of Density Functional Methods for the Estimation of Proton Chemical Shifts with Chemical Accuracy. J. Phys. Chem. A 1999, 103, 7357–7363. [Google Scholar] [CrossRef]
- Bagno, A.; Rastrelli, F.; Saielli, G. Toward the Complete Prediction of the 1H and 13C NMR Spectra of Complex Organic Molecules by DFT Methods: Application to Natural Substances. Chem. A Eur. J. 2006, 12, 5514–5525. [Google Scholar] [CrossRef] [PubMed]
- Lodewyk, M.W.; Siebert, M.R.; Tantillo, D.J. Computational Prediction of 1H and 13C Chemical Shifts: A Useful Tool for Natural Product, Mechanistic, and Synthetic Organic Chemistry. Chem. Rev. 2012, 112, 1839–1862. [Google Scholar] [CrossRef] [PubMed]
- Willoughby, P.H.; Jansma, M.J.; Hoye, T.R. A Guide to Small-Molecule Structure Assignment through Computation of (1H and 13C) NMR Chemical Shifts. Nat. Protoc. 2014, 9, 643–660. [Google Scholar] [CrossRef] [PubMed]
- Grimblat, N.; Sarotti, A.M. Computational Chemistry to the Rescue: Modern Toolboxes for the Assignment of Complex Molecules by GIAO NMR Calculations. Chem. Eur. J. 2016, 22, 12246–12261. [Google Scholar] [CrossRef] [PubMed]
- Hehre, W.; Klunzinger, P.; Deppmeier, B.; Driessen, A.; Uchida, N.; Hashimoto, M.; Fukushi, E.; Takata, Y. Efficient Protocol for Accurately Calculating 13C Chemical Shifts of Conformationally Flexible Natural Products: Scope, Assessment, and Limitations. J. Nat. Prod. 2019, 82, 2299–2306. [Google Scholar] [CrossRef]
- Marcarino, M.O.; Zanardi, M.M.; Cicetti, S.; Sarotti, A.M. NMR Calculations with Quantum Methods: Development of New Tools for Structural Elucidation and Beyond. Acc. Chem. Res. 2020, 53, 1922–1932. [Google Scholar] [CrossRef]
- Costa, F.L.; de Albuquerque, A.C.; Fiorot, R.G.; Lião, L.M.; Martorano, L.H.; Mota, G.V.; Valverde, A.L.; Carneiro, J.W.; dos Santos Junior, F.M. Structural Characterisation of Natural Products by Means of Quantum Chemical Calculations of NMR Parameters: New Insights. Org. Chem. Front. 2021, 8, 2019–2058. [Google Scholar] [CrossRef]
- Castro, A.C.; Balcells, D.; Repisky, M.; Helgaker, T.; Cascella, M. First-Principles Calculation of 1H NMR Chemical Shifts of Complex Metal Polyhydrides: The Essential Inclusion of Relativity and Dynamics. Inorg. Chem. 2020, 59, 17509–17518. [Google Scholar] [CrossRef]
- Chierotti, M.R.; Garlaschelli, L.; Gobetto, R.; Nervi, C.; Peli, G.; Sironi, A.; Della Pergola, R. An Unusual Carbonyl Chemical Shift in a Carbonylhexairidium Cluster: A Combined Solid-State NMR and DFT Approach. Eur. J. Inorg. Chem. 2007, 3477–3483. [Google Scholar] [CrossRef]
- Cohen, R.D.; Wang, X.; Sherer, E.C.; Martin, G.E. Application of 1,1-ADEQUATE and DFT to Correct 13C Misassignments of Carbonyl Chemical Shifts for Carbapenem Antibiotics. Magn. Reson. Chem. 2022, 60, 963–969. [Google Scholar] [CrossRef]
- Losacco, G.L.; Cohen, R.D.; DaSilva, J.O.; Haidar Ahmad, I.A.; Sherer, E.C.; Mangion, I.; Regalado, E.L. Deuterated Modifiers in Sub/Supercritical Fluid Chromatography for Streamlined NMR Structure Elucidation. Anal. Chem. 2022, 94, 12176–12184. [Google Scholar] [CrossRef]
- Basu, K.; Lehnherr, D.; Martin, G.E.; Desmond, R.A.; Lam, Y.-H.; Peng, F.; Chung, J.Y.; Arvary, R.A.; Zompa, M.A.; Zhang, S.-W.; et al. Development of a Green and Sustainable Manufacturing Process for Gefapixant Citrate (MK-7264) Part 3: Development of a One-Pot Formylation-Cyclization Sequence to the Diaminopyrimidine Core. Org. Process Res. Dev. 2020, 24, 2462–2477. [Google Scholar] [CrossRef]
- Meanwell, M.; Silverman, S.M.; Lehmann, J.; Adluri, B.; Wang, Y.; Cohen, R.; Campeau, L.-C.; Britton, R. A Short de novo Synthesis of Nucleoside Analogs. Science 2020, 369, 725–730. [Google Scholar] [CrossRef]
- Song, Z.J.; Zhou, G.; Cohen, R.; Tan, L. Preparation of ABNO on Scale and Analysis by Quantitative Paramagnetic NMR. Org. Process Res. Dev. 2018, 22, 1257–1261. [Google Scholar] [CrossRef]
- Vankova, N.; Heine, T.; Kortz, U. NMR Chemical Shifts of Metal Centres in Polyoxometalates: Relativistic DFT Predictions. Eur. J. Inorg. Chem. 2009, 5102–5108. [Google Scholar] [CrossRef]
- Martel, L.; Capelli, E.; Body, M.; Klipfel, M.; Beneš, O.; Maksoud, L.; Raison, P.E.; Suard, E.; Visscher, L.; Bessada, C. Insight into the Crystalline Structure of ThF4 with the Combined use of Neutron Diffraction, 19F Magic-Angle Spinning-NMR, and Density Functional Theory Calculations. Inorg. Chem. 2018, 57, 15350–15360. [Google Scholar] [CrossRef]
- Novotný, J.; Sojka, M.; Komorovsky, S.; Nečas, M.; Marek, R. Interpreting the Paramagnetic NMR Spectra of Potential Ru(III) Metallodrugs: Synergy Between Experiment and Relativistic DFT Calculations. J. Am. Chem. Soc. 2016, 138, 8432–8445. [Google Scholar] [CrossRef]
- Vícha, J.; Novotný, J.; Straka, M.; Repisky, M.; Ruud, K.; Komorovsky, S.; Marek, R. Structure, Solvent, and Relativistic Effects on the NMR Chemical Shifts in Square-Planar Transition-Metal Complexes: Assessment of DFT Approaches. Phys. Chem. Chem. Phys. 2015, 17, 24944–24955. [Google Scholar] [CrossRef]
- Sim, Y.E.; Nwajiobi, O.; Mahesh, S.; Cohen, R.D.; Reibarkh, M.Y.; Raj, M. Secondary Amine Selective Petasis (SASP) Bioconjugation. Chem. Sci. 2020, 11, 53–61. [Google Scholar] [CrossRef]
- Joyce, L.A.; Nawrat, C.C.; Sherer, E.C.; Biba, M.; Brunskill, A.; Martin, G.E.; Cohen, R.D.; Davies, I.W. Beyond Optical Rotation: What’s Left is not Always Right in Total Synthesis. Chem. Sci. 2018, 9, 415–424. [Google Scholar] [CrossRef] [PubMed]
- Cohen, R.D.; Saurí, J.; Huff, C.A.; Krska, S.W.; Martin, G.E. Additional pitfalls of using 1,1-ADEQUATE for structure elucidation. Magn. Reson. Chem. 2016, 54, 897–900. [Google Scholar] [CrossRef]
- Rivera, N.R.; Cohen, R.D.; Zhang, S.-W.; Dance, Z.E.; Halsey, H.M.; Song, S.; Bu, X.; Reibarkh, M.; Ren, H.; Lee, A.Y. Gefapixant Citrate (MK-7264) Sulfonamide Step Speciation Study: Investigation into Precipitation-Dissolution Events during Addition of Chlorosulfonic Acid. Org. Process Res. Dev. 2023, 27, 286–294. [Google Scholar] [CrossRef]
- Koch, K.R.; Burger, M.; Kramer, J.; Westra, A. 195Pt NMR and DFT Computational Methods as Tools Towards the Understanding of Speciation and Hydration/Solvation of [PtX6]2− (X = Cl−, Br−) Anions in Solution. Dalton Trans. 2006, 37, 3277–3284. [Google Scholar] [CrossRef] [PubMed]
- Gordon, L.W.; Wang, J.; Messinger, R.J. Revealing Impacts of Electrolyte Speciation on Ionic Charge Storage in Aluminum-Quinone Batteries by NMR Spectroscopy. J. Magn. Reson. 2023, 348, 107374. [Google Scholar] [CrossRef]
- Lodewyk, M.W.; Soldi, C.; Jones, P.B.; Olmstead, M.M.; Rita, J.; Shaw, J.T.; Tantillo, D.J. The Correct Structure of Aquatolide—Experimental Validation of a Theoretically-Predicted Structural Revision. J. Am. Chem. Soc. 2012, 134, 18550–18553. [Google Scholar] [CrossRef]
- Saielli, G.; Nicolaou, K.C.; Ortiz, A.; Zhang, H.; Bagno, A. Addressing the Stereochemistry of Complex Organic Molecules by Density Functional Theory-NMR: Vannusal B in Retrospective. J. Am. Chem. Soc. 2011, 133, 6072–6077. [Google Scholar] [CrossRef]
- Li, Y. Structural Revision of Glabramycins B and C, Antibiotics from the Fungus Neosartorya glabra by DFT Calculations of NMR Chemical Shifts and Coupling Constants. RSC Adv. 2015, 5, 36858–36864. [Google Scholar] [CrossRef]
- Rychnovsky, S.D. Predicting NMR Spectra by Computational Methods: Structure Revision of Hexacyclinol. Org. Lett. 2006, 8, 2895–2898. [Google Scholar] [CrossRef]
- Buevich, A.V.; Elyashberg, M.E. Synergistic Combination of CASE Algorithms and DFT Chemical Shift Predictions: A Powerful Approach for Structure Elucidation, Verification, and Revision. J. Nat. Prod. 2016, 79, 3105–3116. [Google Scholar] [CrossRef]
- Buevich, A.V.; Elyashberg, M.E. Towards Unbiased and More Versatile NMR-Based Structure Elucidation: A Powerful Combination of CASE Algorithms and DFT Calculations. Magn. Reson. Chem. 2018, 56, 493–504. [Google Scholar] [CrossRef]
- Buevich, A.V.; Elyashberg, M.E. Enhancing Computer-Assisted Structure Elucidation with DFT Analysis of J-Couplings. Magn. Reson. Chem. 2020, 58, 594–606. [Google Scholar] [CrossRef]
- Zaretsky, S.; Hickey, J.L.; Denis, M.A.S.; Scully, C.C.; Roughton, A.L.; Tantillo, D.J.; Lodewyk, M.W.; Yudin, A.K. Predicting Cyclic Peptide Chemical Shifts using Quantum Mechanical Calculations. Tetrahedron 2014, 70, 7655–7663. [Google Scholar] [CrossRef]
- Nguyen, Q.N.N.; Schwochert, J.; Tantillo, D.J.; Lokey, R.S. Using 1H and 13C NMR Chemical Shifts to Determine Cyclic Peptide Conformations: A Combined Molecular Dynamics and Quantum Mechanics Approach. Phys. Chem. Chem. Phys. 2018, 20, 14003–14012. [Google Scholar] [CrossRef]
- Fonville, J.M.; Swart, M.; Vokáčová, Z.; Sychrovský, V.; Šponer, J.E.; Šponer, J.; Hilbers, C.W.; Bickelhaupt, F.M.; Wijmenga, S.S. Chemical Shifts in Nucleic Acids Studied by Density Functional Theory Calculations and Comparison with Experiment. Chem. Eur. J. 2012, 18, 12372–12387. [Google Scholar] [CrossRef]
- Victora, A.; Möller, H.M.; Exner, T.E. Accurate Ab Initio Prediction of NMR Chemical Shifts of Nucleic Acids and Nucleic Acids/Protein Complexes. Nucleic Acids Res. 2014, 42, e173. [Google Scholar] [CrossRef]
- Jin, X.; Zhu, T.; Zhang, J.Z.; He, X. A Systematic Study on RNA NMR Chemical Shift Calculation Based on the Automated Fragmentation QM/MM Approach. RSC Adv. 2016, 6, 108590–108602. [Google Scholar] [CrossRef]
- Taubert, S.; Konschin, H.; Sundholm, D. Computational Studies of 13C NMR Chemical Shifts of Saccharides. Phys. Chem. Chem. Phys. 2005, 7, 2561–2569. [Google Scholar] [CrossRef]
- Toukach, F.V.; Ananikov, V.P. Recent Advances in Computational Predictions of NMR Parameters for the Structure Elucidation of Carbohydrates: Methods and Limitations. Chem. Soc. Rev. 2013, 42, 8376–8415. [Google Scholar] [CrossRef]
- Palivec, V.; Pohl, R.; Kaminský, J.; Martinez-Seara, H. Efficiently Computing NMR 1H and 13C Chemical Shifts of Saccharides in Aqueous Environment. J. Chem. Theory Comput. 2022, 18, 4373–4386. [Google Scholar] [CrossRef]
- Larsen, A.S.; Bratholm, L.A.; Christensen, A.S.; Channir, M.; Jensen, J.H. ProCS15: A DFT-Based Chemical Shift Predictor for Backbone and Cβ Atoms in Proteins. PeerJ 2015, 3, e1344. [Google Scholar] [CrossRef] [PubMed]
- Bratholm, L.A.; Jensen, J.H. Protein Structure Refinement Using a Quantum Mechanics-Based Chemical Shielding Predictor. Chem. Sci. 2017, 8, 2061–2072. [Google Scholar] [CrossRef] [PubMed]
- Přecechtělová, J.P.; Mladek, A.; Zapletal, V.; Hritz, J. Quantum Chemical Calculations of NMR Chemical Shifts in Phosphorylated Intrinsically Disordered Proteins. J. Chem. Theory Comput. 2019, 15, 5642–5658. [Google Scholar] [CrossRef] [PubMed]
- Mueller, L.J.; Dunn, M.F. NMR Crystallography of Enzyme Active Sites: Probing Chemically Detailed, Three-Dimensional Structure in Tryptophan Synthase. Acc. Chem. Res. 2013, 46, 2008–2017. [Google Scholar] [CrossRef]
- Hodgkinson, P. NMR Crystallography of Molecular Organics. Prog. Nucl. Magn. Reson. Spectrosc. 2020, 118, 10–53. [Google Scholar] [CrossRef]
- Ashbrook, S.E.; McKay, D. Combining Solid-State NMR Spectroscopy with First-Principles Calculations—A Guide to NMR Crystallography. Chem. Commun. 2016, 52, 7186–7204. [Google Scholar] [CrossRef]
- Mardirossian, N.; Head-Gordon, M. Thirty Years of Density Functional Theory in Computational Chemistry: An Overview and Extensive Assessment of 200 Density Functionals. Mol. Phys. 2017, 115, 2315–2372. [Google Scholar] [CrossRef]
- Konstantinov, I.A.; Broadbelt, L.J. Regression Formulas for Density Functional Theory Calculated 1H and 13C NMR Chemical Shifts in Toluene-d8. J. Phys. Chem. A 2011, 115, 12364–12372. [Google Scholar] [CrossRef]
- Toomsalu, E.; Burk, P. Critical Test of Some Computational Methods for Prediction of NMR 1H and 13C Chemical Shifts. J. Mol. Model. 2015, 21, 244. [Google Scholar] [CrossRef]
- Benassi, E. Benchmarking of Density Functionals for a Soft but Accurate Prediction and Assignment of 1H and 13C NMR Chemical Shifts in Organic and Biological Molecules. J. Comput. Chem. 2017, 38, 87–92. [Google Scholar] [CrossRef]
- Buß, A.; Koch, R. Simulation of NMR Chemical Shifts in Heterocycles: A Method Evaluation. J. Mol. Model. 2017, 23, 9. [Google Scholar] [CrossRef]
- Wiitala, K.W.; Hoye, T.R.; Cramer, C.J. Hybrid Density Functional Methods Empirically Optimized for the Computation of 13C and 1H Chemical Shifts in Chloroform Solution. J. Chem. Theory Comput. 2006, 2, 1085–1092. [Google Scholar] [CrossRef]
- Stoychev, G.L.; Auer, A.A.; Neese, F. Efficient and Accurate Prediction of Nuclear Magnetic Resonance Shielding Tensors with Double-Hybrid Density Functional Theory. J. Chem. Theory Comput. 2018, 14, 4756–4771. [Google Scholar] [CrossRef]
- De Oliveira, M.T.; Alves, J.M.A.; Braga, A.A.C.; Wilson, D.J.D.; Barboza, C.A. Do Double-Hybrid Exchange–Correlation Functionals Provide Accurate Chemical Shifts? A Benchmark Assessment for Proton NMR. J. Chem. Theory Comput. 2021, 17, 6876–6885. [Google Scholar] [CrossRef]
- Iron, M.A. Evaluation of the Factors Impacting the Accuracy of 13C NMR Chemical Shift Predictions using Density Functional Theory—The Advantage of Long-Range Corrected Functionals. J. Chem. Theory Comput. 2017, 13, 5798–5819. [Google Scholar] [CrossRef]
- Jain, R.; Bally, T.; Rablen, P.R. Calculating Accurate Proton Chemical Shifts of Organic Molecules with Density Functional Methods and Modest Basis Sets. J. Org. Chem. 2009, 74, 4017–4023. [Google Scholar] [CrossRef]
- Kaupp, M. Relativistic Effects on NMR Chemical Shifts. In Relativistic Electronic Structure Theory, Part 2: Applications; Schwerdtfeger, P., Ed.; Elsevier B.V.: Amsterdam, The Netherlands, 2004; Volume 14, pp. 552–597. [Google Scholar]
- Mitra, A.; Seaton, P.J.; Assarpour, R.A.; Williamson, T. Unprecedented Concentration Dependent Chemical Shift Variation in 1H-NMR Studies: A Caveat in the Investigations of Molecular Recognition and Structure Elucidation. Tetrahedron 1998, 54, 15489–15498. [Google Scholar] [CrossRef]
- Pierens, G.K.; Venkatachalam, T.; Reutens, D.C. NMR and DFT Investigations of Structure of Colchicine in Various Solvents Including Density Functional Theory Calculations. Sci. Rep. 2017, 7, 5605. [Google Scholar] [CrossRef]
- Stadelmann, T.; Balmer, C.; Riniker, S.; Ebert, M.-O. Impact of Solvent Interactions on 1H and 13C Chemical Shifts Investigated Using DFT and a Reference Dataset Recorded in CDCl3 and CCl4. Phys. Chem. Chem. Phys. 2022, 24, 23551–23560. [Google Scholar] [CrossRef]
- Wiberg, K.B.; Lavanish, J.M. Formation and Thermal Decomposition of Bicyclo[1.1.0]butane-2-exo-d11. J. Am. Chem. Soc. 1966, 88, 5272–5275. [Google Scholar] [CrossRef]
- Collins, S.W.; Alger, T.D.; Grant, D.M.; Kuhlmann, K.F.; Smith, J.C. Carbon-13 Spin Relaxation and Methyl Rotation Barriers in the Methylethylenes. J. Phys. Chem. 1975, 79, 2031–2037. [Google Scholar] [CrossRef]
- Simons, W.W. The Sadtler Handbook of Proton NMR Spectra; Sadtler: Philadelphia, PA, USA, 1978. [Google Scholar]
- Silverstein, R.M.; Bassler, G.C.; Morrill, T.C. Spectrometric Identification of Organic Compounds; John Wiley and Sons: New York, NY, USA, 1991. [Google Scholar]
- Properties of Organic Compounds Database, version 5.0; CRC Press: Boca Raton, FL, USA, 1996.
- Bos, R.; Barnett, N.W.; Dyson, G.A.; Lim, K.F.; Russell, R.A.; Watson, S.P. Studies on the Mechanism of the Peroxyoxalate Chemiluminescence Reaction: Part 1. Confirmation of 1,2-Dioxetanedione as an Intermediate using 13C Nuclear Magnetic Resonance Spectroscopy. Anal. Chim. Acta 2004, 502, 141–147. [Google Scholar] [CrossRef]
- Spectral Database for Organic Compounds, SDBS. National Institute of Advanced Industrial Science and Technology (AIST): Japan. Available online: https://sdbs.db.aist.go.jp (accessed on 7 December 2022).
- Bellina, F.; Rossi, R. An Efficient and Inexpensive Multigram Synthesis of 3,4-Dibromo- and 3,4-Dichlorofuran-2(5H)-one. Synthesis 2007, 1887–1889. [Google Scholar] [CrossRef]
- Hoffmann, F.; Li, D.-W.; Sebastiani, D.; Brüschweiler, R. Improved Quantum Chemical NMR Chemical Shift Prediction of Metabolites in Aqueous Solution Toward the Validation of Unknowns. J. Phys. Chem. A 2017, 121, 3071–3078. [Google Scholar] [CrossRef] [PubMed]
- Ebrahimi, H.P.; Shaghaghi, H.; Tafazzoli, M. Gauge Invariant Atomic Orbital-Density Functional Theory Prediction of Accurate Gas Phase 1H and 13C NMR Chemical Shifts. Concepts Magn. Reson. Part A 2011, 38, 269–279. [Google Scholar] [CrossRef]
- Flaig, D.; Maurer, M.; Hanni, M.; Braunger, K.; Kick, L.; Thubauville, M.; Ochsenfeld, C. Benchmarking Hydrogen and Carbon NMR Chemical Shifts at HF, DFT, and MP2 Levels. J. Chem. Theory Comput. 2014, 10, 572–578. [Google Scholar] [CrossRef]
- Giesen, D.J.; Zumbulyadis, N. A Hybrid Quantum Mechanical and Empirical Model for the Prediction of Isotropic 13C Shielding Constants of Organic Molecules. Phys. Chem. Chem. Phys. 2002, 4, 5498–5507. [Google Scholar] [CrossRef]
- Pierens, G.K. 1H and 13C NMR Scaling Factors for the Calculation of Chemical Shifts in Commonly Used Solvents Using Density Functional Theory. J. Comput. Chem. 2014, 35, 1388–1394. [Google Scholar] [CrossRef]
- Yesiltepe, Y.; Nuñez, J.R.; Colby, S.M.; Thomas, D.G.; Borkum, M.I.; Reardon, P.N.; Washton, N.M.; Metz, T.O.; Teeguarden, J.G.; Govind, N. An Automated Framework for NMR Chemical Shift Calculations of Small Organic Molecules. J. Cheminform. 2018, 10, 52. [Google Scholar] [CrossRef]
- Armangue, L.; Solà, M.; Swart, M. Nuclear Shieldings with the SSB-D Functional. J. Phys. Chem. A 2011, 115, 1250–1256. [Google Scholar] [CrossRef]
- Wang, B.; Fleischer, U.; Hinton, J.F.; Pulay, P. Accurate Prediction of Proton Chemical Shifts. I. Substituted Aromatic Hydrocarbons. J. Comput. Chem. 2001, 22, 1887–1895. [Google Scholar] [CrossRef]
- Xin, D.; Sader, C.A.; Chaudhary, O.; Jones, P.-J.; Wagner, K.; Tautermann, C.S.; Yang, Z.; Busacca, C.A.; Saraceno, R.A.; Fandrick, K.R. Development of a 13C NMR Chemical Shift Prediction Procedure Using B3LYP/cc-pVDZ and Empirically Derived Systematic Error Correction Terms: A Computational Small Molecule Structure Elucidation Method. J. Org. Chem. 2017, 82, 5135–5145. [Google Scholar] [CrossRef]
- Holzer, C.; Franzke, Y.J.; Kehry, M. Assessing the Accuracy of Local Hybrid Density Functional Approximations for Molecular Response Properties. J. Chem. Theory Comput. 2021, 17, 2928–2947. [Google Scholar] [CrossRef]
- Ermanis, K.; Parkes, K.E.B.; Agback, T.; Goodman, J.M. The Optimal DFT Approach in DP4 NMR Structure Analysis-Pushing the Limits of Relative Configuration Elucidation. Org. Biomol. Chem. 2019, 17, 5886–5890. [Google Scholar] [CrossRef]
- Schattenberg, C.J.; Kaupp, M. Extended Benchmark Set of Main-Group Nuclear Shielding Constants and NMR Chemical Shifts and Its Use to Evaluate Modern DFT Methods. J. Chem. Theory Comput. 2021, 17, 7602–7621. [Google Scholar] [CrossRef]
- Bates, J.E.; Furche, F. Harnessing the Meta-Generalized Gradient Approximation for Time-Dependent Density Functional Theory. J. Chem. Phys. 2012, 137, 164105. [Google Scholar] [CrossRef]
- Grimblat, N.; Zanardi, M.M.; Sarotti, A.M. Beyond DP4: An Improved Probability for the Stereochemical Assignment of Isomeric Compounds Using Quantum Chemical Calculations of NMR Shifts. J. Org. Chem. 2015, 80, 12526–12534. [Google Scholar] [CrossRef]
- Baldridge, K.K.; Siegel, J.S. Correlation of Empirical δ(TMS) and Absolute NMR Chemical Shifts Predicted by ab initio Computations. J. Phys. Chem. A 1999, 103, 4038–4042. [Google Scholar] [CrossRef]
- Schuler, R.H.; Albarran, G.; Zajicek, J.; George, M.; Fessenden, R.W.; Carmichael, I. On the Addition of •OH Radicals to the Ipso Positions of Alkyl-Substituted Aromatics: Production of 4-Hydroxy-4-methyl-2, 5-cyclohexadien-1-one in the Radiolytic Oxidation of p-Cresol. J. Phys. Chem. A 2002, 106, 12178–12183. [Google Scholar] [CrossRef]
- Wipf, P.; Kerekes, A.D. Structure Reassignment of the Fungal Metabolite TAEMC161 as the Phytotoxin Viridiol. J. Nat. Prod. 2003, 66, 716–718. [Google Scholar] [CrossRef]
- Timmons, C.; Wipf, P. Density Functional Theory Calculation of 13C NMR Shifts of Diazaphenanthrene Alkaloids: Reinvestigation of the Structure of Samoquasine A. J. Org. Chem. 2008, 73, 9168–9170. [Google Scholar] [CrossRef] [PubMed]
- Sarotti, A.M.; Pellegrinet, S.C. A Multi-standard Approach for GIAO 13C NMR Calculations. J. Org. Chem. 2009, 74, 7254–7260. [Google Scholar] [CrossRef] [PubMed]
- Frisch, M.J.; Trucks, G.W.; Schlegel, H.B.; Scuseria, G.E.; Robb, M.A.; Cheeseman, J.R.; Scalmani, G.; Barone, V.; Petersson, G.A.; Nakatsuji, H.; et al. Gaussian 16 Rev. C.01; Gaussian, Inc.: Wallingford, CT, USA, 2016. [Google Scholar]
- Lu, C.; Wu, C.; Ghoreishi, D.; Chen, W.; Wang, L.; Damm, W.; Ross, G.A.; Dahlgren, M.K.; Russell, E.; Von Bargen, C.D. OPLS4: Improving Force Field Accuracy on Challenging Regimes of Chemical Space. J. Chem. Theory Comput. 2021, 17, 4291–4300. [Google Scholar] [CrossRef] [PubMed]
- MacroModel, Schrödinger Release 2021-1; MacroModel, Schrödinger, LLC: New York, NY, USA, 2021.
- Walker, M.; Harvey, A.J.; Sen, A.; Dessent, C.E. Performance of M06, M06-2X, and M06-HF Density Functionals for Conformationally Flexible Anionic Clusters: M06 Functionals Perform Better than B3LYP for a Model System with Dispersion and Ionic Hydrogen-Bonding Interactions. J. Phys. Chem. A 2013, 117, 12590–12600. [Google Scholar] [CrossRef]
- Kang, Y.K.; Park, H.S. Conformational Preferences of Cationic β-Peptide in Water Studied by CCSD(T), MP2, and DFT Methods. Heliyon 2020, 6, e04721. [Google Scholar] [CrossRef]
- Zhao, Y.; Truhlar, D.G. Density Functionals with Broad Applicability in Chemistry. Acc. Chem. Res. 2008, 41, 157–167. [Google Scholar] [CrossRef]
- Marenich, A.V.; Cramer, C.J.; Truhlar, D.G. Performance of SM6, SM8, and SMD on the SAMPL1 Test Set for the Prediction of Small-Molecule Solvation Free Energies. J. Phys. Chem. B 2009, 113, 4538–4543. [Google Scholar] [CrossRef]
- Brémond, É.; Pérez-Jiménez, Á.J.; Sancho-García, J.C.; Adamo, C. Range-Separated Hybrid Density Functionals Made Simple. J. Chem. Phys. 2019, 150, 201102. [Google Scholar] [CrossRef]
- Jensen, F. How Large is the Elephant in the Density Functional Theory Room? J. Phys. Chem. A 2017, 121, 6104–6107. [Google Scholar] [CrossRef]
- Feller, D.; Dixon, D.A. Density Functional Theory and the Basis Set Truncation Problem with Correlation Consistent Basis Sets: Elephant in the Room or Mouse in the Closet? J. Phys. Chem. A 2018, 122, 2598–2603. [Google Scholar] [CrossRef]
- Jensen, F. Method Calibration or Data Fitting? J. Chem. Theory Comput. 2018, 14, 4651–4661. [Google Scholar] [CrossRef]
- Mevers, E.; Saurí, J.; Liu, Y.; Moser, A.; Ramadhar, T.R.; Varlan, M.; Williamson, R.T.; Martin, G.E.; Clardy, J. Homodimericin A: A Complex Hexacyclic Fungal Metabolite. J. Am. Chem. Soc. 2016, 138, 12324–12327. [Google Scholar] [CrossRef]
- Facelli, J.C. Calculations of Chemical Shieldings: Theory and Applications. Concepts Magn. Reson. Part A 2004, 20, 42–69. [Google Scholar] [CrossRef]
- London, F. Théorie Quantique des Courants Interatomiques dans les Combinaisons Aromatiques (Quantum Theory of Interatomic Currents in Aromatic Compounds). J. Phys. Radium 1937, 8, 397–409. [Google Scholar] [CrossRef]
- McWeeny, R. Perturbation Theory for the Fock-Dirac Density Matrix. Phys. Rev. 1962, 126, 1028. [Google Scholar] [CrossRef]
- Ditchfield, R. Self-Consistent Perturbation Theory of Diamagnetism: I. A Gauge-Invariant LCAO Method for NMR Chemical Shifts. Mol. Phys. 1974, 27, 789–807. [Google Scholar] [CrossRef]
- Wolinski, K.; Hinton, J.F.; Pulay, P. Efficient Implementation of the Gauge-Independent Atomic Orbital Method for NMR Chemical Shift Calculations. J. Am. Chem. Soc. 1990, 112, 8251–8260. [Google Scholar] [CrossRef]
- Cheeseman, J.R.; Trucks, G.W.; Keith, T.A.; Frisch, M.J. A Comparison of Models for Calculating Nuclear Magnetic Resonance Shielding Tensors. J. Chem. Phys. 1996, 104, 5497–5509. [Google Scholar] [CrossRef]
- Keith, T.; Bader, R. Calculation of Magnetic Response Properties Using Atoms in Molecules. Chem. Phys. Lett. 1992, 194, 1–8. [Google Scholar] [CrossRef]
- Keith, T.A.; Bader, R.F. Calculation of Magnetic Response Properties Using a Continuous Set of Gauge Transformations. Chem. Phys. Lett. 1993, 210, 223–231. [Google Scholar] [CrossRef]
- Tomasi, J.; Mennucci, B.; Cammi, R. Quantum Mechanical Continuum Solvation Models. Chem. Rev. 2005, 105, 2999–3094. [Google Scholar] [CrossRef] [PubMed]
- Marenich, A.V.; Cramer, C.J.; Truhlar, D.G. Universal Solvation Model Based on Solute Electron Density and on a Continuum Model of the Solvent Defined by the Bulk Dielectric Constant and Atomic Surface Tensions. J. Phys. Chem. B 2009, 113, 6378–6396. [Google Scholar] [CrossRef]
- Barone, V.; Cossi, M. Quantum Calculation of Molecular Energies and Energy Gradients in Solution by a Conductor Solvent Model. J. Phys. Chem. A 1998, 102, 1995–2001. [Google Scholar] [CrossRef]
- Cossi, M.; Rega, N.; Scalmani, G.; Barone, V. Energies, Structures, and Electronic Properties of Molecules in Solution with the C-PCM Solvation Model. J. Comput. Chem. 2003, 24, 669–681. [Google Scholar] [CrossRef] [PubMed]
- Wheeler, S.E.; Houk, K. Integration Grid Errors for Meta-GGA-Predicted Reaction Energies: Origin of Grid Errors for the M06 Suite of Functionals. J. Chem. Theory Comput. 2010, 6, 395–404. [Google Scholar] [CrossRef]
- Böhm, M.C.; Schulte, J.; Ramírez, R. On the Influence of Nuclear Fluctuations on Calculated NMR Shieldings of Benzene and Ethylene: A Feynman Path Integral—Ab initio Investigation. Int. J. Quantum Chem. 2002, 86, 280–296. [Google Scholar] [CrossRef]
- Adamo, C.; Barone, V. Toward Chemical Accuracy in the Computation of NMR Shieldings: The PBE0 Model. Chem. Phys. Lett. 1998, 298, 113–119. [Google Scholar] [CrossRef]
- Deng, Q.; Jiang, L.; Yu, Y.; Yang, Y. Theoretical Exploration of the Mechanism of α-Pinene Hydrogenation. J. Organomet. Chem. 2022, 980–981, 122513. [Google Scholar] [CrossRef]
- Kutateladze, A.G.; Kuznetsov, D.M.; Beloglazkina, A.A.; Holt, T. Addressing the Challenges of Structure Elucidation in Natural Products Possessing the Oxirane Moiety. J. Org. Chem. 2018, 83, 8341–8352. [Google Scholar] [CrossRef]
- Wood, J.S.; Gordon, W.H.; Morgan, J.B.; Williamson, R.T. Calculated and Experimental 1H and 13C NMR Assignments for Cannabicitran. Magn. Reson. Chem. 2022, 60, 196–202. [Google Scholar] [CrossRef]
- Galasso, V.; Kovač, B.; Modelli, A. A Theoretical and Experimental Study on the Molecular and Electronic Structures of Artemisinin and Related Drug Molecules. Chem. Phys. 2007, 335, 141–154. [Google Scholar] [CrossRef]
- Lodewyk, M.W.; Tantillo, D.J. Prediction of the Structure of Nobilisitine A Using Computed NMR Chemical Shifts. J. Nat. Prod. 2011, 74, 1339–1343. [Google Scholar] [CrossRef]
- Semenov, V.A.; Krivdin, L.B. DFT Computational Schemes for 1H and 13C NMR Chemical Shifts of Natural Products, Exemplified by Strychnine. Magn. Reson. Chem. 2020, 58, 56–64. [Google Scholar] [CrossRef]
- Semenov, V.A.; Samultsev, D.O.; Krivdin, L.B. 1H and 13C NMR Spectra of Strychnos Alkaloids: Selected NMR Updates. Int. J. Quantum Chem. 2020, 120, e26348. [Google Scholar] [CrossRef]
- Saielli, G.; Bagno, A. Can Two Molecules have the same NMR Spectrum? Hexacyclinol Revisited. Org. Lett. 2009, 11, 1409–1412. [Google Scholar] [CrossRef]
- Semenov, V.A.; Krivdin, L.B. Computational 1H and 13C NMR of Strychnobaillonine: On the Way to Larger Molecules Calculated at Lower Computational Costs. Magn. Reson. Chem. 2021, 59, 108–116. [Google Scholar] [CrossRef]
- Semenov, V.A.; Krivdin, L.B. Simple and Versatile Scheme for the Stereochemical Identification of Natural Products and Diverse Organic Compounds with Multiple Asymmetric Centers. J. Phys. Chem. A 2021, 125, 10359–10372. [Google Scholar] [CrossRef]
- Aliev, A.E.; Courtier-Murias, D.; Zhou, S. Scaling Factors for Carbon NMR Chemical Shifts Obtained from DFT B3LYP Calculations. J. Mol. Struct. THEOCHEM 2009, 893, 1–5. [Google Scholar] [CrossRef]
- Kelly, D.P.; Giansiracusa, J.J.; Leslie, D.R.; McKern, I.D.; Sinclair, G.C. 13C-1H Coupling Constants in Carbocations. 5.1 Trishomocyclopropenium Cations Generated from Bicyclo [3.1.0]hex-3-yl, Tricyclo [3.2.1.02,4]oct-8-yl, and Pentacyclo [4.3.0.02,4.03,8.05,7]non-9-yl Precursors. J. Org. Chem. 1988, 53, 2497–2504. [Google Scholar] [CrossRef]
- Guan, Y.; Sowndarya, S.S.; Gallegos, L.C.; St. John, P.C.; Paton, R.S. Real-Time Prediction of 1H and 13C Chemical Shifts with DFT Accuracy Using a 3D Graph Neural Network. Chem. Sci. 2021, 12, 12012–12026. [Google Scholar] [CrossRef]
- Lee, S.G. α-Pinene and Myrtenol: Complete 1H NMR Assignment. Magn. Reson. Chem. 2002, 40, 311–312. [Google Scholar] [CrossRef]
- Akssira, M.; Mellouki, F.; Salhi, A.; Alilou, H.; Saouf, A.; El Hanbali, F.; Arteaga, J.F.; Barrero, A.F. Naupliolide, a Sesquiterpene Lactone with a Novel Tetracyclic Skeleton from Nauplius graveolens Subsp. odorus. Tet. Lett. 2006, 47, 6719–6721. [Google Scholar] [CrossRef]
- Dong, M.; Cong, B.; Yu, S.-H.; Sauriol, F.; Huo, C.-H.; Shi, Q.-W.; Gu, Y.-C.; Zamir, L.O.; Kiyota, H. Echinopines A and B: Sesquiterpenoids Possessing an Unprecedented Skeleton from Echinops spinosus. Org. Lett. 2008, 10, 701–704. [Google Scholar] [CrossRef] [PubMed]
- Tiuman, T.S.; Ueda-Nakamura, T.; Garcia Cortez, D.A.; Dias Filho, B.P.; Morgado-Díaz, J.A.; de Souza, W.; Nakamura, C.V. Antileishmanial Activity of Parthenolide, a Sesquiterpene Lactone Isolated from Tanacetum parthenium. Antimicrob. Agents Chemother. 2005, 49, 176–182. [Google Scholar] [CrossRef]
- Kutateladze, A.G.; Reddy, D.S. High-Throughput in silico Structure Validation and Revision of Halogenated Natural Products is Enabled by Parametric Corrections to DFT-Computed 13C NMR Chemical Shifts and Spin–Spin Coupling Constants. J. Org. Chem. 2017, 82, 3368–3381. [Google Scholar] [CrossRef]
- Valdez-Calderón, A.; Torres-Valencia, J.M.; Manríquez-Torres, J.J.; Velázquez-Jiménez, R.; Román-Marín, L.U.; Hernández-Hernández, J.D.; Cerda-García-Rojas, C.M.; Joseph-Nathan, P. An Unusual Diepoxyguaianolide from Stevia Tomentosa. Tet. Lett. 2013, 54, 3286–3289. [Google Scholar] [CrossRef]
- Rigby, J.H.; de Sainte Claire, V.; Cuisiat, S.V.; Heeg, M.J. Synthetic Studies on the Ingenane Diterpenes. Direct Conversion of the out,out-Bicyclo [4.4.1]undecane System into a Highly Strained In,out Stereoisomer. J. Org. Chem. 1996, 61, 7992–7993. [Google Scholar] [CrossRef]
- Zhongshan, W.; Nakashima, T.T.; Kopecky, K.R.; Molina, J. Qinghaosu: 1H and 13C Nuclear Magnetic Resonance Spectral Assignments and Luminescence. Can. J. Chem. 1985, 63, 3070–3074. [Google Scholar] [CrossRef]
- Evidente, A.; Abou-Donia, A.H.; Darwish, F.A.; Amer, M.E.; Kassem, F.F.; Hammoda, H.A.; Motta, A. Nobilisitine A and B, Two Masanane-Type Alkaloids from Clivia nobilis. Phytochemistry 1999, 51, 1151–1155. [Google Scholar] [CrossRef]
- Marrero, J.; Rodríguez, A.D.; Barnes, C.L. Intricarene, an Unprecedented Trispiropentacyclic Diterpene from the Caribbean Sea Plume Pseudopterogorgia kallos. Org. Lett. 2005, 7, 1877–1880. [Google Scholar] [CrossRef]
- Martin, G.E.; Hadden, C.E.; Crouch, R.C.; Krishnamurthy, V. ACCORD-HMBC: Advantages and Disadvantages of Static Versus Accordion Excitation. Magn. Reson. Chem. 1999, 37, 517–528. [Google Scholar] [CrossRef]
- Cherif, A.; Martin, G.E.; Soltero, L.R.; Massiot, G. Configuration and Total Assignment of the 1H- and 13C-NMR Spectra of the Alkaloid Holstiine. J. Nat. Prod. 1990, 53, 793–802. [Google Scholar] [CrossRef]
- Williams, A.; Elyashberg, M.; Blinov, K.; Lankin, D.; Martin, G.; Reynolds, W.; Porco Jr, J.; Singleton, C.; Su, S. Applying Computer-Assisted Structure Elucidation Algorithms for the Purpose of Structure Validation: Revisiting the NMR Assignments of Hexacyclinol. J. Nat. Prod. 2008, 71, 581–588. [Google Scholar] [CrossRef]
- Tchinda, A.T.; Jansen, O.; Nyemb, J.-N.; Tits, M.; Dive, G.; Angenot, L.; Frederich, M. Strychnobaillonine, an Unsymmetrical Bisindole Alkaloid with an Unprecedented Skeleton from Strychnos icaja Roots. J. Nat. Prod. 2014, 77, 1078–1082. [Google Scholar] [CrossRef]
- Frederich, M.; De Pauw, M.-C.; Llabres, G.; Tits, M.; Hayette, M.-P.; Brandt, V.; Penelle, J.; De Mol, P.; Angenot, L. New Antimalarial and Cytotoxic Sungucine Derivatives from Strychnos icaja Roots. Planta Med. 2000, 66, 262–269. [Google Scholar] [CrossRef]
- Lamotte, J.; Dupont, L.; Dideberg, O.; Kambu, K.; Angenot, L. Isolation and Structure of Sungucine: A New Type of Bisindoline Alkaloid. Tet. Lett. 1979, 20, 4227–4228. [Google Scholar] [CrossRef]
- Chmurny, G.N.; Hilton, B.D.; Brobst, S.; Look, S.A.; Witherup, K.M.; Beutler, J.A. 1H- and 13C-NMR Assignments for Taxol, 7-epi-Taxol, and Cephalomannine. J. Nat. Prod. 1992, 55, 414–423. [Google Scholar] [CrossRef]
- Hohenberg, P.; Kohn, W. Inhomogeneous Electron Gas. Phys. Rev. 1964, 136, B864–B871. [Google Scholar] [CrossRef]
- Kohn, W.; Sham, L.J. Self-Consistent Equations Including Exchange and Correlation Effects. Phys. Rev. 1965, 140, A1133–A1138. [Google Scholar] [CrossRef]
- Slater, J.C. Quantum Theory of Molecules and Solids Vol. 4: The Self-Consistent Field for Molecules and Solids; McGraw-Hill: New York, NY, USA, 1974. [Google Scholar]
- Becke, A.D. Density-Functional Exchange-Energy Approximation with Correct Asymptotic Behavior. Phys. Rev. A 1988, 38, 3098–3100. [Google Scholar] [CrossRef]
- Perdew, J.P. Electronic Structure of Solids ’91; Ziesche, P., Eschrig, H., Eds.; Akademie Verlag: Berlin, Germany, 1991; p. 11. [Google Scholar]
- Perdew, J.P.; Chevary, J.A.; Vosko, S.H.; Jackson, K.A.; Pederson, M.R.; Singh, D.J.; Fiolhais, C. Atoms, Molecules, Solids, and Surfaces: Applications of the Generalized Gradient Approximation for Exchange and Correlation. Phys. Rev. B 1992, 46, 6671–6687, Erratum in Phys. Rev. B 1993, 48, 4978. [Google Scholar] [CrossRef] [PubMed]
- Perdew, J.P.; Burke, K.; Wang, Y. Generalized Gradient Approximation for the Exchange-Correlation Hole of a Many-Electron System. Phys. Rev. B 1996, 54, 16533. [Google Scholar] [CrossRef]
- Adamo, C.; Barone, V. Exchange Functionals with Improved Long-Range Behavior and Adiabatic Connection Methods without Adjustable Parameters: The mPW and mPW1PW Models. J. Chem. Phys. 1998, 108, 664–675. [Google Scholar] [CrossRef]
- Perdew, J.P.; Burke, K.; Ernzerhof, M. Generalized Gradient Approximation Made Simple. Phys. Rev. Lett. 1996, 77, 3865–3868, Erratum in Phys. Rev. Lett. 1997, 78, 1396. [Google Scholar] [CrossRef] [PubMed]
- Gill, P.M. A New Gradient-Corrected Exchange Functional. Mol. Phys. 1996, 89, 433–445. [Google Scholar] [CrossRef]
- Adamo, C.; Barone, V. Implementation and Validation of the Lacks-Gordon Exchange Functional in Conventional Density Functional and Adiabatic Connection Methods. J. Comput. Chem. 1998, 19, 418–429. [Google Scholar] [CrossRef]
- Tao, J.; Perdew, J.P.; Staroverov, V.N.; Scuseria, G.E. Climbing the Density Functional Ladder: Nonempirical Meta-Generalized Gradient Approximation Designed for Molecules and Solids. Phys. Rev. Lett. 2003, 91, 146401. [Google Scholar] [CrossRef]
- Perdew, J.P.; Ruzsinszky, A.; Csonka, G.I.; Constantin, L.A.; Sun, J. Workhorse Semilocal Density Functional for Condensed Matter Physics and Quantum Chemistry. Phys. Rev. Lett. 2009, 103, 026403, Erratum in Phys. Rev. Lett. 2011, 106, 179902. [Google Scholar] [CrossRef]
- Perdew, J.P.; Kurth, S.; Zupan, A.; Blaha, P. Accurate Density Functional with Correct Formal Properties: A Step Beyond the Generalized Gradient Approximation. Phys. Rev. Lett. 1999, 82, 2544. [Google Scholar] [CrossRef]
- Becke, A.D.; Roussel, M.R. Exchange Holes in Inhomogeneous Systems: A Coordinate-Space Model. Phys. Rev. A 1989, 39, 3761–3767. [Google Scholar] [CrossRef]
- Vosko, S.H.; Wilk, L.; Nusair, M. Accurate Spin-Dependent Electron Liquid Correlation Energies for Local Spin Density Calculations: A Critical Analysis. Can. J. Phys. 1980, 58, 1200–1211. [Google Scholar] [CrossRef]
- Perdew, J.P.; Zunger, A. Self-Interaction Correction to Density-Functional Approximations for Many-Electron Systems. Phys. Rev. B 1981, 23, 5048–5079. [Google Scholar] [CrossRef]
- Lee, C.; Yang, W.; Parr, R.G. Development of the Colle-Salvetti Correlation-Energy Formula into a Functional of the Electron Density. Phys. Rev. B 1988, 37, 785–789. [Google Scholar] [CrossRef]
- Miehlich, B.; Savin, A.; Stoll, H.; Preuss, H. Results Obtained with the Correlation Energy Density Functionals of Becke and Lee, Yang and Parr. Chem. Phys. Lett. 1989, 157, 200–206. [Google Scholar] [CrossRef]
- Perdew, J.P. Density-Functional Approximation for the Correlation Energy of the Inhomogeneous Electron Gas. Phys. Rev. B 1986, 33, 8822–8824. [Google Scholar] [CrossRef]
- Peverati, R.; Zhao, Y.; Truhlar, D.G. Generalized Gradient Approximation that Recovers the Second-Order Density-Gradient Expansion with Optimized Across-the-Board Performance. J. Phys. Chem. Lett. 2011, 2, 1991–1997. [Google Scholar] [CrossRef]
- Hamprecht, F.A.; Cohen, A.J.; Tozer, D.J.; Handy, N.C. Development and Assessment of New Exchange-Correlation Functionals. J. Chem. Phys. 1998, 109, 6264–6271. [Google Scholar] [CrossRef]
- Boese, A.D.; Doltsinis, N.L.; Handy, N.C.; Sprik, M. New Generalized Gradient Approximation Functionals. J. Chem. Phys. 2000, 112, 1670–1678. [Google Scholar] [CrossRef]
- Boese, A.D.; Handy, N.C. A New Parametrization of Exchange-Correlation Generalized Gradient Approximation Functionals. J. Chem. Phys. 2001, 114, 5497–5503. [Google Scholar] [CrossRef]
- Peverati, R.; Truhlar, D.G. Exchange-Correlation Functional with Good Accuracy for Both Structural and Energetic Properties While Depending Only on the Density and its Gradient. J. Chem. Theory Comput. 2012, 8, 2310–2319. [Google Scholar] [CrossRef]
- Becke, A.D. Density-Functional Thermochemistry. III. The Role of Exact Exchange. J. Chem. Phys. 1993, 98, 5648–5652. [Google Scholar] [CrossRef]
- Adamo, C.; Barone, V. Toward Reliable Adiabatic Connection Models Free from Adjustable Parameters. Chem. Phys. Lett. 1997, 274, 242–250. [Google Scholar] [CrossRef]
- Cohen, A.J.; Handy, N.C. Dynamic Correlation. Mol. Phys. 2001, 99, 607–615. [Google Scholar] [CrossRef]
- Xu, X.; Goddard III, W.A. The X3LYP Extended Density Functional for Accurate Descriptions of Nonbond Interactions, Spin States, and Thermochemical Properties. Proc. Natl. Acad. Sci. USA 2004, 101, 2673–2677. [Google Scholar] [CrossRef] [PubMed]
- Adamo, C.; Barone, V. Toward Reliable Density Functional Methods without Adjustable Parameters: The PBE0 Model. J. Chem. Phys. 1999, 110, 6158–6170. [Google Scholar] [CrossRef]
- Ernzerhof, M.; Scuseria, G.E. Assessment of the Perdew-Burke-Ernzerhof Exchange-Correlation Functional. J. Chem. Phys. 1999, 110, 5029–5036. [Google Scholar] [CrossRef]
- Austin, A.; Petersson, G.A.; Frisch, M.J.; Dobek, F.J.; Scalmani, G.; Throssell, K. A Density Functional with Spherical Atom Dispersion Terms. J. Chem. Theory Comput. 2012, 8, 4989–5007. [Google Scholar] [CrossRef]
- Peverati, R.; Truhlar, D.G. Communication: A Global Hybrid Generalized Gradient Approximation to the Exchange-Correlation Functional that Satisfies the Second-Order Density-Gradient Constraint and has Broad Applicability in Chemistry. J. Chem. Phys. 2011, 135, 191102. [Google Scholar] [CrossRef]
- Wilson, P.J.; Bradley, T.J.; Tozer, D.J. Hybrid Exchange-Correlation Functional Determined from Thermochemical Data and ab initio Potentials. J. Chem. Phys. 2001, 115, 9233–9242. [Google Scholar] [CrossRef]
- Grimme, S. Semiempirical GGA-Type Density Functional Constructed with a Long-Range Dispersion Correction. J. Comput. Chem. 2006, 27, 1787–1799. [Google Scholar] [CrossRef]
- Becke, A.D. Density-Functional Thermochemistry. V. Systematic Optimization of Exchange-Correlation Functionals. J. Chem. Phys. 1997, 107, 8554–8560. [Google Scholar] [CrossRef]
- Schmider, H.L.; Becke, A.D. Optimized Density Functionals from the Extended G2 Test Set. J. Chem. Phys. 1998, 108, 9624–9631. [Google Scholar] [CrossRef]
- Van Voorhis, T.; Scuseria, G.E. A Novel Form for the Exchange-Correlation Energy Functional. J. Chem. Phys. 1998, 109, 400–410. [Google Scholar] [CrossRef]
- Boese, A.D.; Handy, N.C. New Exchange-Correlation Density Functionals: The Role of the Kinetic-Energy Density. J. Chem. Phys. 2002, 116, 9559–9569. [Google Scholar] [CrossRef]
- Zhao, Y.; Truhlar, D.G. A New Local Density Functional for Main-Group Thermochemistry, Transition Metal Bonding, Thermochemical Kinetics, and Noncovalent Interactions. J. Chem. Phys. 2006, 125, 194101. [Google Scholar] [CrossRef]
- Peverati, R.; Truhlar, D.G. M11-L: A Local Density Functional that Provides Improved Accuracy for Electronic Structure Calculations in Chemistry and Physics. J. Phys. Chem. Lett. 2012, 3, 117–124. [Google Scholar] [CrossRef]
- Peverati, R.; Truhlar, D.G. An Improved and Broadly Accurate Local Approximation to the Exchange-Correlation Density Functional: The MN12-L Functional for Electronic Structure Calculations in Chemistry and Physics. Phys. Chem. Chem. Phys. 2012, 14, 13171–13174. [Google Scholar] [CrossRef]
- Yu, H.S.; He, X.; Truhlar, D.G. MN15-L: A New Local Exchange-Correlation Functional for Kohn-Sham Density Functional Theory with Broad Accuracy for Atoms, Molecules, and Solids. J. Chem. Theory Comput. 2016, 12, 1280–1293. [Google Scholar] [CrossRef]
- Yanai, T.; Tew, D.P.; Handy, N.C. A New Hybrid Exchange-Correlation Functional Using the Coulomb-Attenuating Method (CAM-B3LYP). Chem. Phys. Lett. 2004, 393, 51–57. [Google Scholar] [CrossRef]
- Vydrov, O.A.; Scuseria, G.E. Assessment of a Long-Range Corrected Hybrid Functional. J. Chem. Phys. 2006, 125, 234109. [Google Scholar] [CrossRef]
- Vydrov, O.A.; Heyd, J.; Krukau, A.V.; Scuseria, G.E. Importance of Short-Range Versus Long-Range Hartree-Fock Exchange for the Performance of Hybrid Density Functionals. J. Chem. Phys. 2006, 125, 074106. [Google Scholar] [CrossRef]
- Vydrov, O.A.; Scuseria, G.E.; Perdew, J.P. Tests of Functionals for Systems with Fractional Electron Number. J. Chem. Phys. 2007, 126, 154109. [Google Scholar] [CrossRef] [PubMed]
- Henderson, T.M.; Izmaylov, A.F.; Scalmani, G.; Scuseria, G.E. Can Short-Range Hybrids Describe Long-Range-Dependent Properties? J. Chem. Phys. 2009, 131, 044108. [Google Scholar] [CrossRef] [PubMed]
- Chai, J.-D.; Head-Gordon, M. Long-Range Corrected Hybrid Density Functionals with Damped Atom-Atom Dispersion Corrections. Phys. Chem. Chem. Phys. 2008, 10, 6615–6620. [Google Scholar] [CrossRef] [PubMed]
- Chai, J.-D.; Head-Gordon, M. Long-Range Corrected Double-Hybrid Density Functionals. J. Chem. Phys. 2009, 131, 174105. [Google Scholar] [CrossRef]
- Henderson, T.M.; Izmaylov, A.F.; Scuseria, G.E.; Savin, A. Assessment of a Middle-Range Hybrid Functional. J. Chem. Theory Comput. 2008, 4, 1254–1262. [Google Scholar] [CrossRef]
- Heyd, J.; Scuseria, G.E. Assessment and Validation of a Screened Coulomb Hybrid Density Functional. J. Chem. Phys. 2004, 120, 7274–7280. [Google Scholar] [CrossRef]
- Heyd, J.; Scuseria, G.E. Efficient Hybrid Density Functional Calculations in Solids: Assessment of the Heyd-Scuseria-Ernzerhof Screened Coulomb Hybrid Functional. J. Chem. Phys. 2004, 121, 1187–1192. [Google Scholar] [CrossRef]
- Heyd, J.; Peralta, J.E.; Scuseria, G.E.; Martin, R.L. Energy Band Gaps and Lattice Parameters Evaluated with the Heyd-Scuseria-Ernzerhof Screened Hybrid Functional. J. Chem. Phys. 2005, 123, 174101. [Google Scholar] [CrossRef]
- Heyd, J.; Scuseria, G.E.; Ernzerhof, M. Erratum: "Hybrid Functionals Based on a Screened Coulomb Potential". J. Chem. Phys. 2006, 124, 219906. [Google Scholar] [CrossRef]
- Izmaylov, A.F.; Scuseria, G.E.; Frisch, M.J. Efficient Evaluation of Short-Range Hartree-Fock Exchange in Large Molecules and Periodic Systems. J. Chem. Phys. 2006, 125, 104103. [Google Scholar] [CrossRef]
- Krukau, A.V.; Vydrov, O.A.; Izmaylov, A.F.; Scuseria, G.E. Influence of the Exchange Screening Parameter on the Performance of Screened Hybrid Functionals. J. Chem. Phys. 2006, 125, 224106. [Google Scholar] [CrossRef]
- Peverati, R.; Truhlar, D.G. Screened-Exchange Density Functionals with Broad Accuracy for Chemistry and Solid-State Physics. Phys. Chem. Chem. Phys. 2012, 14, 16187–16191. [Google Scholar] [CrossRef]
- Becke, A.D. Density-Functional Thermochemistry. IV. A New Dynamical Correlation Functional and Implications for Exact-Exchange Mixing. J. Chem. Phys. 1996, 104, 1040–1046. [Google Scholar] [CrossRef]
- Staroverov, V.N.; Scuseria, G.E.; Tao, J.; Perdew, J.P. Comparative Assessment of a New Nonempirical Density Functional: Molecules and Hydrogen-Bonded Complexes. J. Chem. Phys. 2003, 119, 12129–12137. [Google Scholar] [CrossRef]
- Zhao, Y.; Truhlar, D.G. Design of Density Functionals that are Broadly Accurate for Thermochemistry, Thermochemical Kinetics, and Nonbonded Interactions. J. Phys. Chem. A 2005, 109, 5656–5667. [Google Scholar] [CrossRef]
- Zhao, Y.; Schultz, N.E.; Truhlar, D.G. Exchange-Correlation Functional with Broad Accuracy for Metallic and Nonmetallic Compounds, Kinetics, and Noncovalent Interactions. J. Chem. Phys. 2005, 123, 161103. [Google Scholar] [CrossRef]
- Zhao, Y.; Schultz, N.E.; Truhlar, D.G. Design of Density Functionals by Combining the Method of Constraint Satisfaction with Parametrization for Thermochemistry, Thermochemical Kinetics, and Noncovalent Interactions. J. Chem. Theory Comput. 2006, 2, 364–382. [Google Scholar] [CrossRef]
- Zhao, Y.; Truhlar, D.G. The M06 Suite of Density Functionals for Main Group Thermochemistry, Thermochemical Kinetics, Noncovalent Interactions, Excited States, and Transition Elements: Two New Functionals and Systematic Testing of Four M06-Class Functionals and 12 Other Functionals. Theor. Chem. Acc. 2008, 120, 215–241. [Google Scholar]
- Zhao, Y.; Truhlar, D.G. Density Functional for Spectroscopy: No Long-Range Self-Interaction Error, Good Performance for Rydberg and Charge-Transfer States, and Better Performance on Average than B3LYP for Ground States. J. Phys. Chem. A 2006, 110, 13126–13130. [Google Scholar] [CrossRef]
- Zhao, Y.; Truhlar, D.G. Comparative DFT Study of van der Waals Complexes: Rare-Gas Dimers, Alkaline-Earth Dimers, Zinc Dimer, and Zinc-Rare-Gas Dimers. J. Phys. Chem. A 2006, 110, 5121–5129. [Google Scholar] [CrossRef] [PubMed]
- Zhao, Y.; Truhlar, D.G. Exploring the Limit of Accuracy of the Global Hybrid Meta Density Functional for Main-Group Thermochemistry, Kinetics, and Noncovalent Interactions. J. Chem. Theory Comput. 2008, 4, 1849–1868. [Google Scholar] [CrossRef] [PubMed]
- Haoyu, S.Y.; He, X.; Li, S.L.; Truhlar, D.G. MN15: A Kohn-Sham Global-Hybrid Exchange-Correlation Density Functional with Broad Accuracy for Multi-Reference and Single-Reference Systems and Noncovalent Interactions. Chem. Sci. 2016, 7, 5032–5051. [Google Scholar]
- Peverati, R.; Truhlar, D.G. Improving the Accuracy of Hybrid Meta-GGA Density Functionals by Range Separation. J. Phys. Chem. Lett. 2011, 2, 2810–2817. [Google Scholar] [CrossRef]
- Ditchfield, R.; Hehre, W.J.; Pople, J.A. Self-Consistent Molecular-Orbital Methods. IX. An Extended Gaussian-Type Basis for Molecular-Orbital Studies of Organic Molecules. J. Chem. Phys. 1971, 54, 724–728. [Google Scholar] [CrossRef]
- Dobbs, K.; Hehre, W. Molecular Orbital Theory of the Properties of Inorganic and Organometallic Compounds 4. Extended Basis Sets for Third- and Fourth-Row, Main-Group Elements. J. Comput. Chem. 1986, 7, 359–378. [Google Scholar] [CrossRef]
- Gordon, M.S.; Binkley, J.S.; Pople, J.A.; Pietro, W.J.; Hehre, W.J. Self-Consistent Molecular-Orbital Methods. 22. Small Split-Valence Basis Sets for Second-Row Elements. J. Am. Chem. Soc. 1982, 104, 2797–2803. [Google Scholar] [CrossRef]
- Hariharan, P.C.; Pople, J.A. The Influence of Polarization Functions on Molecular Orbital Hydrogenation Energies. Theor. Chim. Acta 1973, 28, 213–222. [Google Scholar] [CrossRef]
- Hehre, W.J.; Ditchfield, R.; Pople, J.A. Self-Consistent Molecular Orbital Methods. XII. Further Extensions of Gaussian-Type Basis Sets for use in Molecular Orbital Studies of Organic Molecules. J. Chem. Phys. 1972, 56, 2257–2261. [Google Scholar] [CrossRef]
- McLean, A.; Chandler, G. Contracted Gaussian Basis Sets for Molecular Calculations. I. Second Row Atoms, Z = 11–18. J. Chem. Phys. 1980, 72, 5639–5648. [Google Scholar] [CrossRef]
- Pietro, W.J.; Francl, M.M.; Hehre, W.J.; DeFrees, D.J.; Pople, J.A.; Binkley, J.S. Self-Consistent Molecular Orbital Methods. 24. Supplemented Small Split-Valence Basis Sets for Second-Row Elements. J. Am. Chem. Soc. 1982, 104, 5039–5048. [Google Scholar] [CrossRef]
- Binkley, J.S.; Pople, J.A.; Hehre, W.J. Self-Consistent Molecular Orbital Methods. 21. Small Split-Valence Basis Sets for First-Row Elements. J. Am. Chem. Soc. 1980, 102, 939–947. [Google Scholar] [CrossRef]
- Clark, T.; Chandrasekhar, J.; Spitznagel, G.W.; Schleyer, P.V.R. Efficient Diffuse Function-Augmented Basis Sets for Anion Calculations. III. The 3-21+G Basis Set for First-Row Elements, Li-F. J. Comput. Chem. 1983, 4, 294–301. [Google Scholar] [CrossRef]
- Frisch, M.J.; Pople, J.A.; Binkley, J.S. Self-Consistent Molecular Orbital Methods 25. Supplementary Functions for Gaussian Basis Sets. J. Chem. Phys. 1984, 80, 3265–3269. [Google Scholar] [CrossRef]
- Dunning, T.H., Jr. Gaussian Basis Sets for use in Correlated Molecular Calculations. I. The Atoms Boron Through Neon and Hydrogen. J. Chem. Phys. 1989, 90, 1007–1023. [Google Scholar] [CrossRef]
- Kendall, R.A.; Dunning, T.H., Jr.; Harrison, R.J. Electron Affinities of the First-Row Atoms Revisited. Systematic Basis Sets and Wave Functions. J. Chem. Phys. 1992, 96, 6796–6806. [Google Scholar] [CrossRef]
- Papajak, E.; Zheng, J.; Xu, X.; Leverentz, H.R.; Truhlar, D.G. Perspectives on Basis Sets Beautiful: Seasonal Plantings of Diffuse Basis Functions. J. Chem. Theory Comput. 2011, 7, 3027–3034. [Google Scholar] [CrossRef]
- Schäfer, A.; Horn, H.; Ahlrichs, R. Fully Optimized Contracted Gaussian Basis Sets for Atoms Li to Kr. J. Chem. Phys. 1992, 97, 2571–2577. [Google Scholar] [CrossRef]
- Schäfer, A.; Huber, C.; Ahlrichs, R. Fully Optimized Contracted Gaussian Basis Sets of Triple Zeta Valence Quality for Atoms Li to Kr. J. Chem. Phys. 1994, 100, 5829–5835. [Google Scholar] [CrossRef]
- Weigend, F.; Ahlrichs, R. Balanced Basis Sets of Split Valence, Triple Zeta Valence and Quadruple Zeta Valence Quality for H to Rn: Design and Assessment of Accuracy. Phys. Chem. Chem. Phys. 2005, 7, 3297–3305. [Google Scholar] [CrossRef]
- Weigend, F. Accurate Coulomb-Fitting Basis Sets for H to Rn. Phys. Chem. Chem. Phys. 2006, 8, 1057–1065. [Google Scholar] [CrossRef] [PubMed]
- Barone, V. Structure, Magnetic Properties and Reactivities of Open-Shell Species from Density Functional and Self-Consistent Hybrid Methods. In Recent Advances in Density Functional Methods, Part I; Chong, D.P., Ed.; World Scientific Publishing Co.: Singapore, 1996. [Google Scholar]
- Easton, R.E.; Giesen, D.J.; Welch, A.; Cramer, C.J.; Truhlar, D.G. The MIDI! Basis Set for Quantum Mechanical Calculations of Molecular Geometries and Partial Charges. Theor. Chim. Acta 1996, 93, 281–301. [Google Scholar] [CrossRef]
- Dunning, T.H.; Hay, P.J. Gaussian Basis Sets for Molecular Calculations. In Methods of Electronic Structure Theory. Modern Theoretical Chemistry; Schaefer, H.F., Ed.; Springer: Boston, MA, USA, 1977; Volume 3. [Google Scholar]


| δH (ppm) | δC (ppm) | δH (ppm) | δC (ppm) | ||||||
|---|---|---|---|---|---|---|---|---|---|
| Functional a,b | RMSD c | MD c | RMSD c | MD c | Functional a,b | RMSD c | MD c | RMSD c | MD c |
| HF | 0.190 | 0.74 | 3.44 | 10.15 | TPSS | 0.107 | 0.26 | 2.38 | 6.62 |
| Xα | 0.152 | 0.43 | 2.85 | 10.03 | revTPSS | 0.108 | 0.26 | 2.32 | 7.13 |
| SVWN | 0.144 | 0.44 | 2.68 | 9.95 | PKZB | 0.129 | 0.31 | 2.65 | 6.49 |
| BLYP | 0.127 | 0.42 | 2.86 | 7.12 | BRxBRc | 0.130 | 0.36 | 2.78 | 6.61 |
| BP86 | 0.126 | 0.37 | 2.51 | 7.64 | VSXC | 0.124 | 0.35 | 3.44 | 10.52 |
| BVP86 | 0.125 | 0.37 | 2.51 | 7.61 | τ-HCTH | 0.114 | 0.37 | 2.43 | 5.99 |
| BPW91 | 0.124 | 0.39 | 2.43 | 7.61 | M06-L | 0.094 | 0.24 | 2.24 | 6.54 |
| mPWPW91 | 0.126 | 0.39 | 2.51 | 7.71 | M11-L | 0.134 | 0.43 | 3.63 | 10.06 |
| PBE | 0.132 | 0.40 | 2.55 | 8.06 | MN12-L | 0.116 | 0.38 | 3.04 | 8.46 |
| SOGGA11 | 0.169 | 0.54 | 4.10 | 9.43 | MN15-L | 0.118 | 0.30 | 3.10 | 9.19 |
| SOGGA11X | 0.111 | 0.31 | 1.67 | 5.16 | LC-TPSS | 0.147 | 0.52 | 2.33 | 7.75 |
| BPL | 0.115 | 0.42 | 2.81 | 7.25 | LC-revTPSS | 0.145 | 0.50 | 2.26 | 7.55 |
| G96LYP | 0.118 | 0.40 | 2.63 | 6.91 | LC-M06-L | 0.142 | 0.55 | 2.16 | 6.89 |
| B97-D | 0.117 | 0.36 | 2.66 | 6.19 | CAM-B3LYP | 0.102 | 0.25 | 1.66 | 5.02 |
| B97-D3 | 0.117 | 0.36 | 2.66 | 6.19 | LC-ωPBE | 0.139 | 0.40 | 1.99 | 5.65 |
| HCTH | 0.127 | 0.44 | 2.74 | 7.05 | LC-ωHPBE | 0.139 | 0.40 | 1.99 | 5.65 |
| HCTH/93 | 0.119 | 0.39 | 2.57 | 6.98 | ωB97 | 0.130 | 0.37 | 1.78 | 4.46 |
| HCTH/147 | 0.121 | 0.39 | 2.66 | 6.84 | ωB97X | 0.119 | 0.32 | 1.62 | 4.57 |
| N12 | 0.112 | 0.39 | 2.47 | 6.33 | ωB97X-D | 0.109 | 0.29 | 1.57 | 4.64 |
| LC-BP86 | 0.148 | 0.49 | 2.40 | 8.18 | HISS | 0.126 | 0.40 | 1.99 | 6.38 |
| LC-BPW91 | 0.152 | 0.51 | 2.47 | 8.34 | HSE06 | 0.109 | 0.26 | 1.77 | 4.89 |
| LC-N12 | 0.153 | 0.56 | 2.52 | 7.98 | N12-SX | 0.110 | 0.28 | 1.78 | 4.80 |
| B3LYP | 0.098 | 0.26 | 1.97 | 5.49 | B1B95 | 0.113 | 0.32 | 1.77 | 5.22 |
| B3PW91 | 0.105 | 0.25 | 1.77 | 5.03 | TPSSh | 0.097 | 0.22 | 1.99 | 5.42 |
| B1LYP | 0.096 | 0.24 | 1.90 | 5.45 | τ-HCTHhyb | 0.101 | 0.25 | 1.96 | 5.24 |
| O3LYP | 0.109 | 0.31 | 2.20 | 5.61 | M05 | 0.131 | 0.34 | 2.72 | 10.79 |
| X3LYP | 0.098 | 0.24 | 1.96 | 5.54 | M05-2X | 0.166 | 0.60 | 2.72 | 8.17 |
| mPW1PW91 | 0.107 | 0.27 | 1.72 | 4.81 | M06-2X | 0.161 | 0.57 | 2.70 | 7.19 |
| mPW1PBE | 0.108 | 0.27 | 1.72 | 4.80 | M06-HF | 0.295 | 1.06 | 6.30 | 17.26 |
| mPW1LYP | 0.097 | 0.24 | 1.96 | 5.61 | M08-HX | 0.165 | 0.58 | 3.28 | 9.16 |
| mPW3PBE | 0.106 | 0.25 | 1.80 | 5.17 | MN15 | 0.142 | 0.41 | 2.26 | 5.93 |
| PBE0 | 0.109 | 0.27 | 1.74 | 4.85 | PW6B95 | 0.108 | 0.29 | 1.80 | 5.03 |
| PBEh1PBE | 0.109 | 0.27 | 1.74 | 4.88 | PW6B95-D3 | 0.108 | 0.29 | 1.80 | 5.03 |
| WP04 | 0.086 | 0.32 | 2.73 | 10.21 | M11 | 0.180 | 0.62 | 3.27 | 10.21 |
| WC04 | 0.150 | 0.42 | 2.99 | 8.00 | MN12-SX | 0.110 | 0.29 | 2.44 | 8.02 |
| B97-1 | 0.101 | 0.24 | 1.85 | 5.20 | APF | 0.108 | 0.26 | 1.74 | 4.88 |
| B97-2 | 0.103 | 0.23 | 1.78 | 4.70 | B98 | 0.099 | 0.24 | 1.84 | 5.21 |
| Functional: | WP04 | ωB97X-D | Functional: | WP04 | ωB97X-D | ||||||
|---|---|---|---|---|---|---|---|---|---|---|---|
| δH (ppm) | δC (ppm) | δH (ppm) | δC (ppm) | ||||||||
| Basis Set b | Time c | RMSD d | MD d | RMSD d | MD d | Basis Set b | Time c | RMSD d | MD d | RMSD d | MD d |
| SV | 0.11 | 0.171 | 0.48 | 2.04 | 5.90 | 6-31G(d,p) | 0.25 | 0.098 | 0.37 | 1.51 | 5.91 |
| SVP | 0.22 | 0.119 | 0.45 | 1.50 | 4.61 | 6-31+G(d,p) | 0.31 | 0.086 | 0.24 | 1.59 | 4.77 |
| TZV | 0.18 | 0.162 | 0.80 | 2.53 | 8.01 | 6-311G(d,p) | 0.31 | 0.095 | 0.33 | 1.80 | 5.08 |
| TZVP | 0.36 | 0.096 | 0.32 | 1.65 | 4.46 | 6-311+G(d,p) | 0.40 | 0.086 | 0.37 | 1.69 | 4.54 |
| def2-SV | 0.20 | 0.148 | 0.47 | 1.68 | 5.93 | 6-311++G(d,p) | 0.44 | 0.086 | 0.35 | 1.71 | 4.60 |
| def2-SVP | 0.24 | 0.119 | 0.45 | 1.50 | 4.61 | 6-311++G(2d,p) | 0.59 | 0.077 | 0.30 | 1.68 | 4.66 |
| def2-TZV | 0.18 | 0.162 | 0.80 | 2.53 | 8.01 | 6-311++G(2df,p) | 3.76 | 0.075 | 0.27 | 1.54 | 4.35 |
| def2-TZVP | 2.93 | 0.080 | 0.25 | 1.63 | 4.81 | 6-311++G(2df,2p) | 4.05 | 0.078 | 0.29 | 1.53 | 4.43 |
| def2-TZVPP | 3.63 | 0.084 | 0.28 | 1.61 | 4.53 | apr-cc-pVDZ | 0.36 | 0.096 | 0.30 | 1.77 | 5.18 |
| def2-QZV | 0.33 | 0.147 | 0.62 | 2.23 | 6.11 | may-cc-pVDZ | 0.36 | 0.096 | 0.30 | 1.77 | 5.18 |
| EPR-II | 0.35 | 0.122 | 0.34 | 2.17 | 11.34 | jun-cc-pVDZ | 0.36 | 0.096 | 0.30 | 1.77 | 5.18 |
| EPR-III | 4.52 | 0.079 | 0.30 | 1.60 | 4.75 | jul-cc-pVDZ | 0.50 | 0.079 | 0.21 | 2.07 | 6.99 |
| D95 | 0.14 | 0.163 | 0.49 | 2.93 | 13.71 | aug-cc-pVDZ | 0.70 | 0.080 | 0.29 | 2.12 | 6.29 |
| D95V | 0.13 | 0.165 | 0.49 | 2.97 | 13.76 | apr-cc-pVTZ | 4.14 | 0.082 | 0.34 | 1.57 | 4.66 |
| MIDI! | 0.14 | 0.183 | 0.68 | 2.41 | 6.09 | may-cc-pVTZ | 4.14 | 0.082 | 0.34 | 1.57 | 4.66 |
| 3-21G | 0.09 | 0.215 | 0.76 | 2.19 | 6.28 | jun-cc-pVTZ | 5.24 | 0.082 | 0.31 | 1.63 | 4.89 |
| 4-31G | 0.11 | 0.172 | 0.61 | 2.28 | 6.07 | jul-cc-pVTZ | 8.33 | 0.081 | 0.30 | 1.62 | 4.85 |
| 6-21G | 0.11 | 0.208 | 0.63 | 2.19 | 6.08 | aug-cc-pVTZ | 12.86 | 0.081 | 0.28 | 1.66 | 5.12 |
| 6-31G | 0.11 | 0.162 | 0.59 | 2.08 | 5.55 | cc-pVDZ | 0.27 | 0.109 | 0.35 | 1.71 | 4.96 |
| 6-31G(d) | 0.20 | 0.115 | 0.47 | 1.62 | 7.25 | cc-pVTZ | 3.66 | 0.086 | 0.32 | 1.57 | 4.64 |
| Gauge Method b | Functional: | WP04 | ωB97X-D | |||
|---|---|---|---|---|---|---|
| δH (ppm) | δC (ppm) | |||||
| Basis Set | Time c | RMSD d | MD d | RMSD d | MD d | |
| def2-SVP | GIAO | 0.24 | 0.119 | 0.45 | 1.50 | 4.61 |
| def2-TZVP | GIAO | 2.93 | 0.080 | 0.25 | 1.63 | 4.81 |
| def2-TZVPP | GIAO | 3.63 | 0.084 | 0.28 | 1.61 | 4.53 |
| 6-31G(d,p) | GIAO | 0.25 | 0.098 | 0.37 | 1.51 | 5.91 |
| 6-31+G(d,p) | GIAO | 0.31 | 0.086 | 0.24 | 1.59 | 4.77 |
| 6-311+G(d,p) | GIAO | 0.40 | 0.086 | 0.37 | 1.69 | 4.54 |
| 6-311++G(d,p) | GIAO | 0.44 | 0.086 | 0.35 | 1.71 | 4.60 |
| 6-311++G(2d,p) | GIAO | 0.59 | 0.077 | 0.30 | 1.68 | 4.66 |
| 6-311++G(2df,p) | GIAO | 3.76 | 0.075 | 0.27 | 1.54 | 4.35 |
| 6-311++G(2df,2p) | GIAO | 4.05 | 0.078 | 0.29 | 1.53 | 4.43 |
| jul-cc-pVDZ | GIAO | 0.50 | 0.079 | 0.21 | 2.07 | 6.99 |
| aug-cc-pVDZ | GIAO | 0.70 | 0.080 | 0.29 | 2.12 | 6.29 |
| jul-cc-pVTZ | GIAO | 8.33 | 0.081 | 0.30 | 1.62 | 4.85 |
| aug-cc-pVTZ | GIAO | 12.86 | 0.081 | 0.28 | 1.66 | 5.12 |
| def2-SVP | CSGT | 0.23 | 0.321 | 1.62 | 2.96 | 10.20 |
| def2-TZVP | CSGT | 2.78 | 0.100 | 0.41 | 2.05 | 6.20 |
| def2-TZVPP | CSGT | 3.26 | 0.088 | 0.34 | 1.83 | 5.84 |
| 6-31G(d,p) | CSGT | 0.24 | 0.385 | 2.29 | 2.26 | 7.90 |
| 6-31+G(d,p) | CSGT | 0.29 | 0.313 | 1.89 | 1.70 | 5.79 |
| 6-311+G(d,p) | CSGT | 0.36 | 0.194 | 0.92 | 2.16 | 6.73 |
| 6-311++G(d,p) | CSGT | 0.39 | 0.188 | 0.88 | 2.17 | 6.90 |
| 6-311++G(2d,p) | CSGT | 0.48 | 0.087 | 0.23 | 1.76 | 5.03 |
| 6-311++G(2df,p) | CSGT | 3.47 | 0.092 | 0.44 | 1.78 | 5.31 |
| 6-311++G(2df,2p) | CSGT | 3.68 | 0.082 | 0.41 | 1.76 | 5.35 |
| jul-cc-pVDZ | CSGT | 0.41 | 0.121 | 0.53 | 2.06 | 8.22 |
| aug-cc-pVDZ | CSGT | 0.54 | 0.114 | 0.51 | 2.04 | 8.50 |
| jul-cc-pVTZ | CSGT | 6.73 | 0.080 | 0.36 | 1.58 | 4.54 |
| aug-cc-pVTZ | CSGT | 9.63 | 0.081 | 0.36 | 1.56 | 4.45 |
| def2-SVP | IGAIM | 0.23 | 0.321 | 1.63 | 2.96 | 10.22 |
| def2-TZVP | IGAIM | 2.78 | 0.100 | 0.41 | 2.05 | 6.21 |
| def2-TZVPP | IGAIM | 3.18 | 0.087 | 0.34 | 1.83 | 5.85 |
| 6-31G(d,p) | IGAIM | 0.24 | 0.386 | 2.31 | 2.26 | 7.90 |
| 6-31+G(d,p) | IGAIM | 0.29 | 0.314 | 1.91 | 1.69 | 5.76 |
| 6-311+G(d,p) | IGAIM | 0.36 | 0.194 | 0.93 | 2.17 | 6.73 |
| 6-311++G(d,p) | IGAIM | 0.39 | 0.188 | 0.89 | 2.18 | 6.90 |
| 6-311++G(2d,p) | IGAIM | 0.48 | 0.087 | 0.23 | 1.76 | 5.03 |
| 6-311++G(2df,p) | IGAIM | 3.47 | 0.092 | 0.44 | 1.78 | 5.31 |
| 6-311++G(2df,2p) | IGAIM | 3.68 | 0.082 | 0.41 | 1.76 | 5.36 |
| jul-cc-pVDZ | IGAIM | 0.39 | 0.121 | 0.53 | 2.06 | 8.21 |
| aug-cc-pVDZ | IGAIM | 0.54 | 0.114 | 0.51 | 2.04 | 8.50 |
| jul-cc-pVTZ | IGAIM | 6.55 | 0.080 | 0.36 | 1.58 | 4.54 |
| aug-cc-pVTZ | IGAIM | 9.66 | 0.081 | 0.36 | 1.56 | 4.45 |
| NMR Method | PCM-ωB97X-D/def2-SVP | PCM-WP04/6-311++G(2d,p) | |||
|---|---|---|---|---|---|
| Time c (h) | δH (ppm) | δC (ppm) | |||
| Geometry Optimization Method b | RMSD d | MD d | RMSD d | MD d | |
| AM1 | 0.001 | 0.217 | 1.24 | 2.96 | 9.11 |
| PM7 | 0.005 | 0.260 | 1.61 | 2.32 | 8.56 |
| HF/MIDI! | 0.105 | 0.094 | 0.41 | 1.65 | 5.51 |
| HF/6-31G(d) | 0.149 | 0.103 | 0.38 | 1.94 | 5.77 |
| BLYP/6-31G(d) | 0.286 | 0.080 | 0.29 | 1.76 | 7.26 |
| PBE/6-31G(d) | 0.295 | 0.080 | 0.23 | 1.61 | 5.37 |
| B3LYP/3-21G | 0.152 | 0.104 | 0.48 | 2.35 | 6.97 |
| B3LYP/MIDI! | 0.208 | 0.086 | 0.37 | 1.83 | 5.56 |
| B3LYP/6-31G(d) | 0.284 | 0.078 | 0.30 | 1.50 | 4.61 |
| B3LYP/6-31G(d,p) | 0.368 | 0.077 | 0.30 | 1.49 | 4.55 |
| B3LYP/6-311G(d,p) | 0.624 | 0.079 | 0.37 | 1.49 | 4.31 |
| B3LYP/6-31+G(d,p) | 0.876 | 0.077 | 0.28 | 1.50 | 4.53 |
| B3LYP/6-311+G(d,p) | 1.390 | 0.079 | 0.36 | 1.50 | 4.32 |
| B3LYP-D3/6-311G(d,p) | 0.612 | 0.079 | 0.37 | 1.49 | 4.28 |
| PCM-B3LYP-D3/6-31G(d) | 0.369 | 0.078 | 0.27 | 1.50 | 4.79 |
| PCM-B3LYP-D3/6-31G(d,p) | 0.466 | 0.077 | 0.27 | 1.49 | 4.70 |
| PCM-B3LYP-D3/6-311G(d,p) | 0.834 | 0.078 | 0.33 | 1.45 | 4.16 |
| PCM-B3LYP-D3/6-31+G(d,p) | 0.965 | 0.079 | 0.25 | 1.55 | 4.79 |
| PCM-B3LYP-D3/6-311+G(d,p) | 1.570 | 0.078 | 0.32 | 1.49 | 4.27 |
| ωB97X-D/6-31G(d) | 0.414 | 0.078 | 0.28 | 1.52 | 5.04 |
| ωB97X-D/6-31G(d,p) | 0.537 | 0.080 | 0.31 | 1.52 | 5.00 |
| ωB97X-D/6-311G(d,p) | 0.914 | 0.080 | 0.35 | 1.51 | 4.75 |
| ωB97X-D/6-31+G(d,p) | 1.180 | 0.077 | 0.25 | 1.51 | 4.99 |
| ωB97X-D/6-311+G(d,p) | 2.010 | 0.080 | 0.34 | 1.50 | 4.73 |
| M06-2X/6-31G(d) | 0.413 | 0.079 | 0.27 | 1.52 | 5.13 |
| M06-2X/6-31G(d,p) | 0.493 | 0.078 | 0.27 | 1.51 | 5.09 |
| M06-2X/6-311G(d,p) | 0.763 | 0.081 | 0.30 | 1.54 | 4.91 |
| M06-2X/6-31+G(d,p) | 1.095 | 0.078 | 0.26 | 1.51 | 5.08 |
| M06-2X/6-311+G(d,p) | 1.640 | 0.081 | 0.30 | 1.53 | 4.96 |
| SMD-M06-2X/6-31G(d) | 0.685 | 0.079 | 0.25 | 1.52 | 5.01 |
| SMD-M06-2X/6-31G(d,p) | 0.882 | 0.077 | 0.26 | 1.49 | 4.97 |
| SMD-M06-2X/6-311G(d,p) | 1.230 | 0.079 | 0.23 | 1.50 | 4.80 |
| SMD-M06-2X/6-31+G(d,p) | 2.770 | 0.079 | 0.25 | 1.52 | 4.73 |
| SMD-M06-2X/6-311+G(d,p) | 3.600 | 0.079 | 0.23 | 1.50 | 4.82 |
Disclaimer/Publisher’s Note: The statements, opinions and data contained in all publications are solely those of the individual author(s) and contributor(s) and not of MDPI and/or the editor(s). MDPI and/or the editor(s) disclaim responsibility for any injury to people or property resulting from any ideas, methods, instructions or products referred to in the content. |
© 2023 by the authors. Licensee MDPI, Basel, Switzerland. This article is an open access article distributed under the terms and conditions of the Creative Commons Attribution (CC BY) license (https://creativecommons.org/licenses/by/4.0/).
Share and Cite
Cohen, R.D.; Wood, J.S.; Lam, Y.-H.; Buevich, A.V.; Sherer, E.C.; Reibarkh, M.; Williamson, R.T.; Martin, G.E. DELTA50: A Highly Accurate Database of Experimental 1H and 13C NMR Chemical Shifts Applied to DFT Benchmarking. Molecules 2023, 28, 2449. https://doi.org/10.3390/molecules28062449
Cohen RD, Wood JS, Lam Y-H, Buevich AV, Sherer EC, Reibarkh M, Williamson RT, Martin GE. DELTA50: A Highly Accurate Database of Experimental 1H and 13C NMR Chemical Shifts Applied to DFT Benchmarking. Molecules. 2023; 28(6):2449. https://doi.org/10.3390/molecules28062449
Chicago/Turabian StyleCohen, Ryan D., Jared S. Wood, Yu-Hong Lam, Alexei V. Buevich, Edward C. Sherer, Mikhail Reibarkh, R. Thomas Williamson, and Gary E. Martin. 2023. "DELTA50: A Highly Accurate Database of Experimental 1H and 13C NMR Chemical Shifts Applied to DFT Benchmarking" Molecules 28, no. 6: 2449. https://doi.org/10.3390/molecules28062449
APA StyleCohen, R. D., Wood, J. S., Lam, Y.-H., Buevich, A. V., Sherer, E. C., Reibarkh, M., Williamson, R. T., & Martin, G. E. (2023). DELTA50: A Highly Accurate Database of Experimental 1H and 13C NMR Chemical Shifts Applied to DFT Benchmarking. Molecules, 28(6), 2449. https://doi.org/10.3390/molecules28062449