

BF2-Azadipyrromethene Fluorophores for Intraoperative Vital Structure Identification

 , , , ,
  ,
,  ,
,  and
and
Abstract
1. Introduction
2. Results and Discussion
2.1. Synthesis
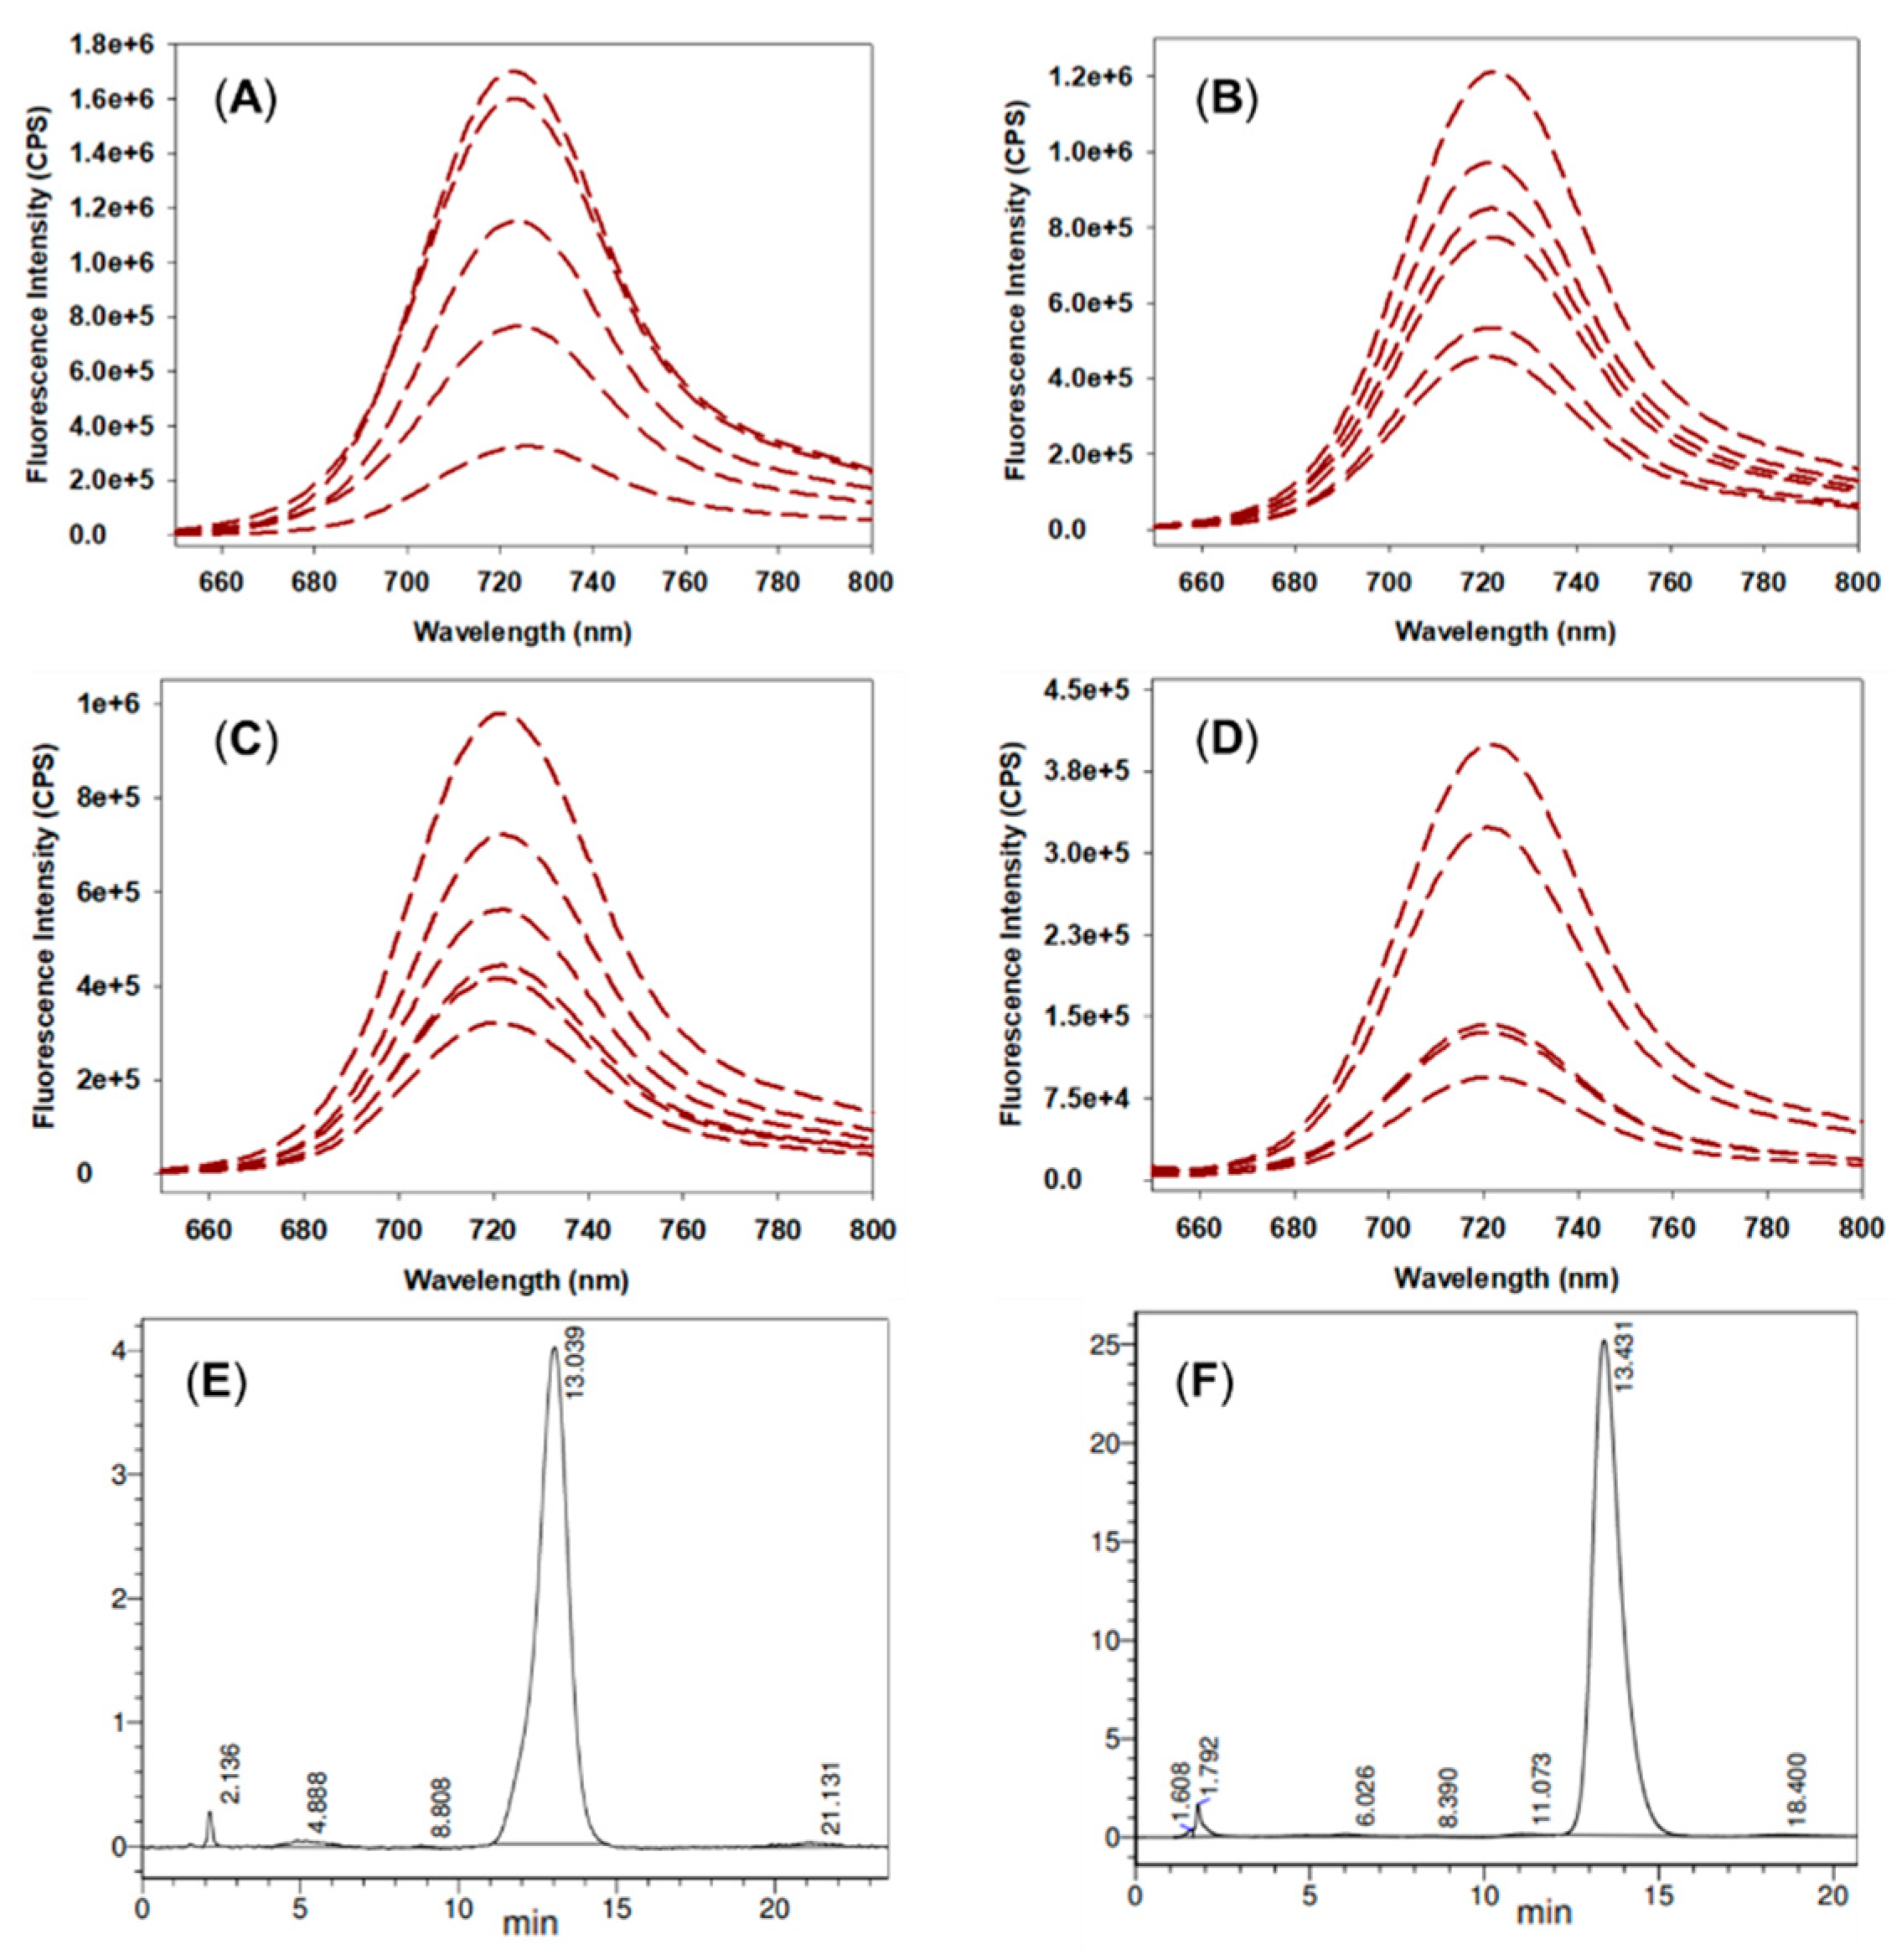
2.2. Photophysical Properties of 7–12
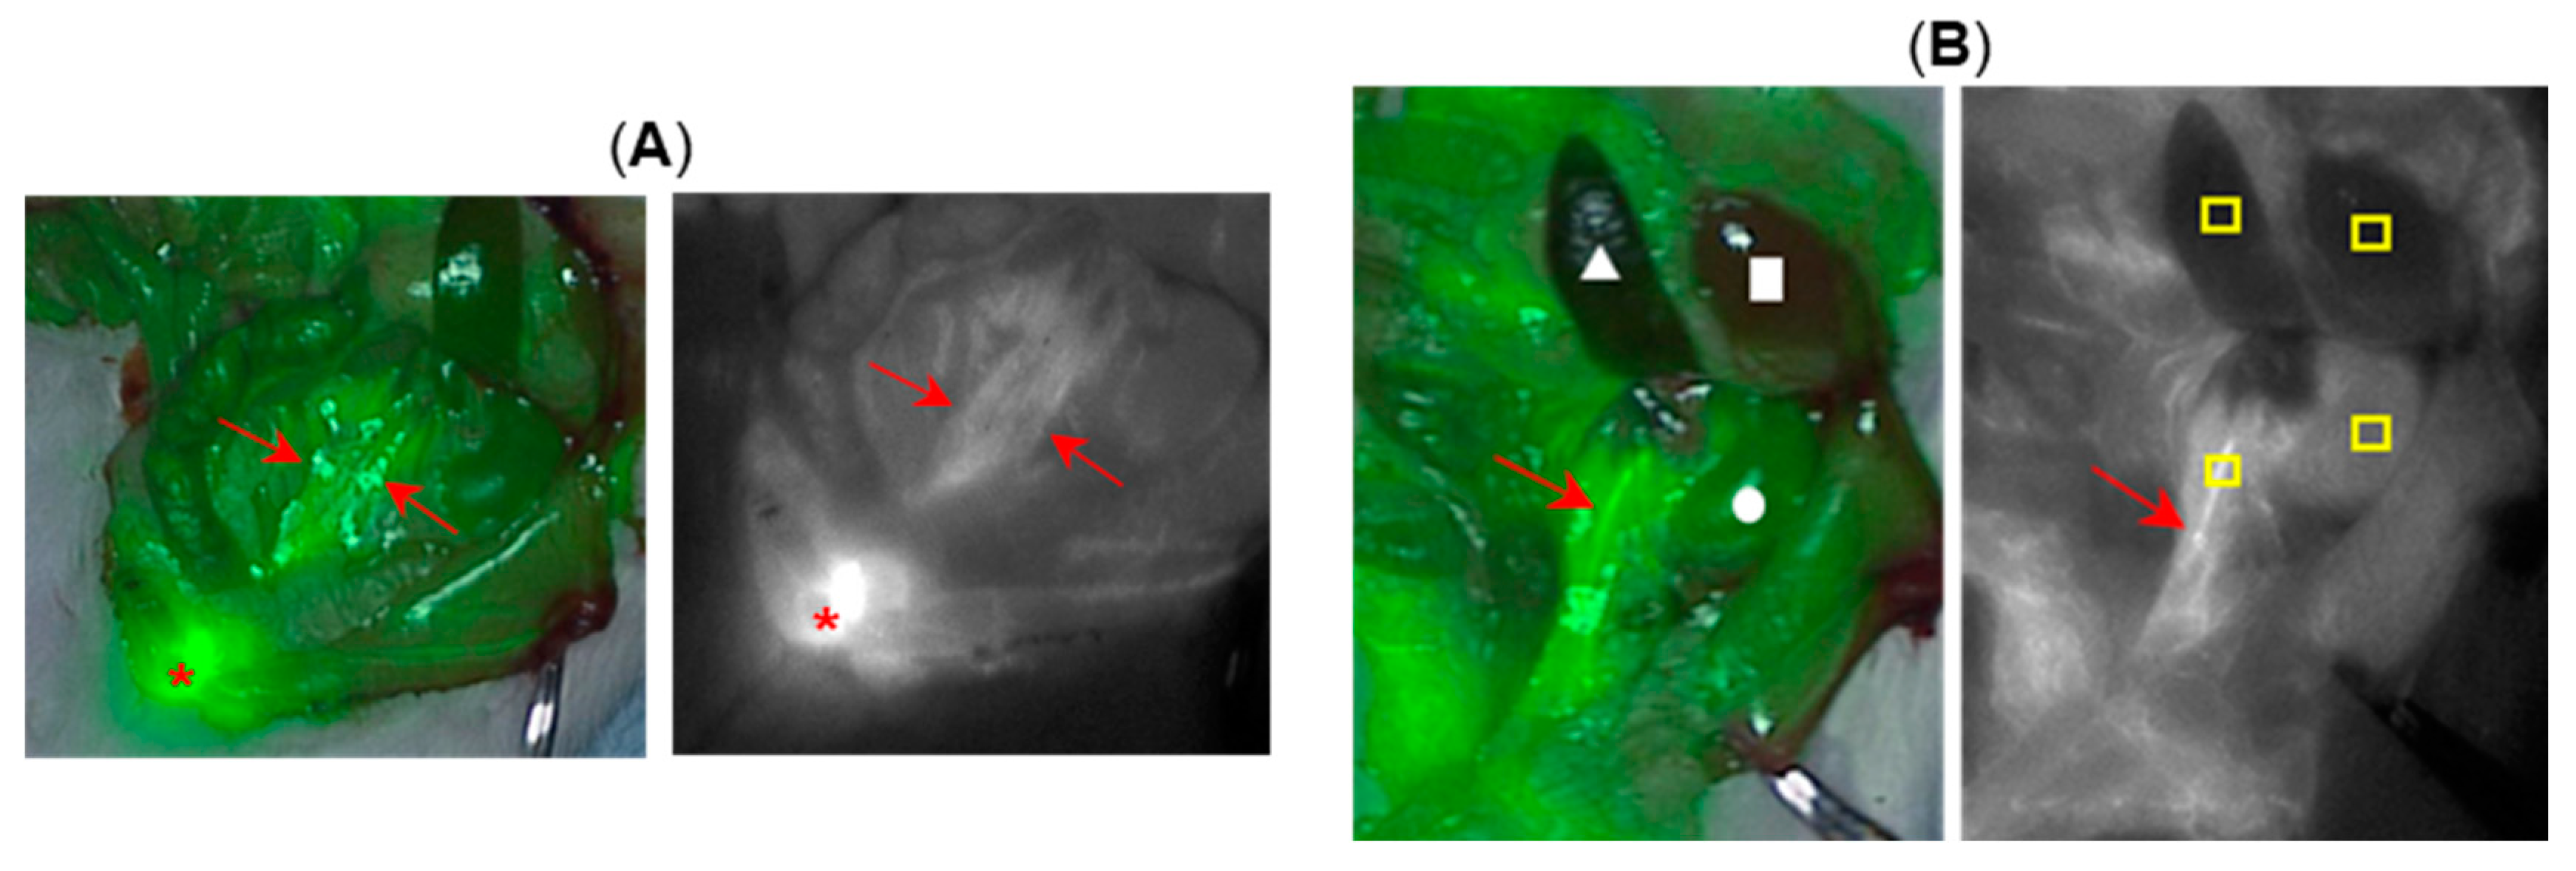
2.3. Ureter Identification in Rodent Model
2.4. Toxicity Study of 12
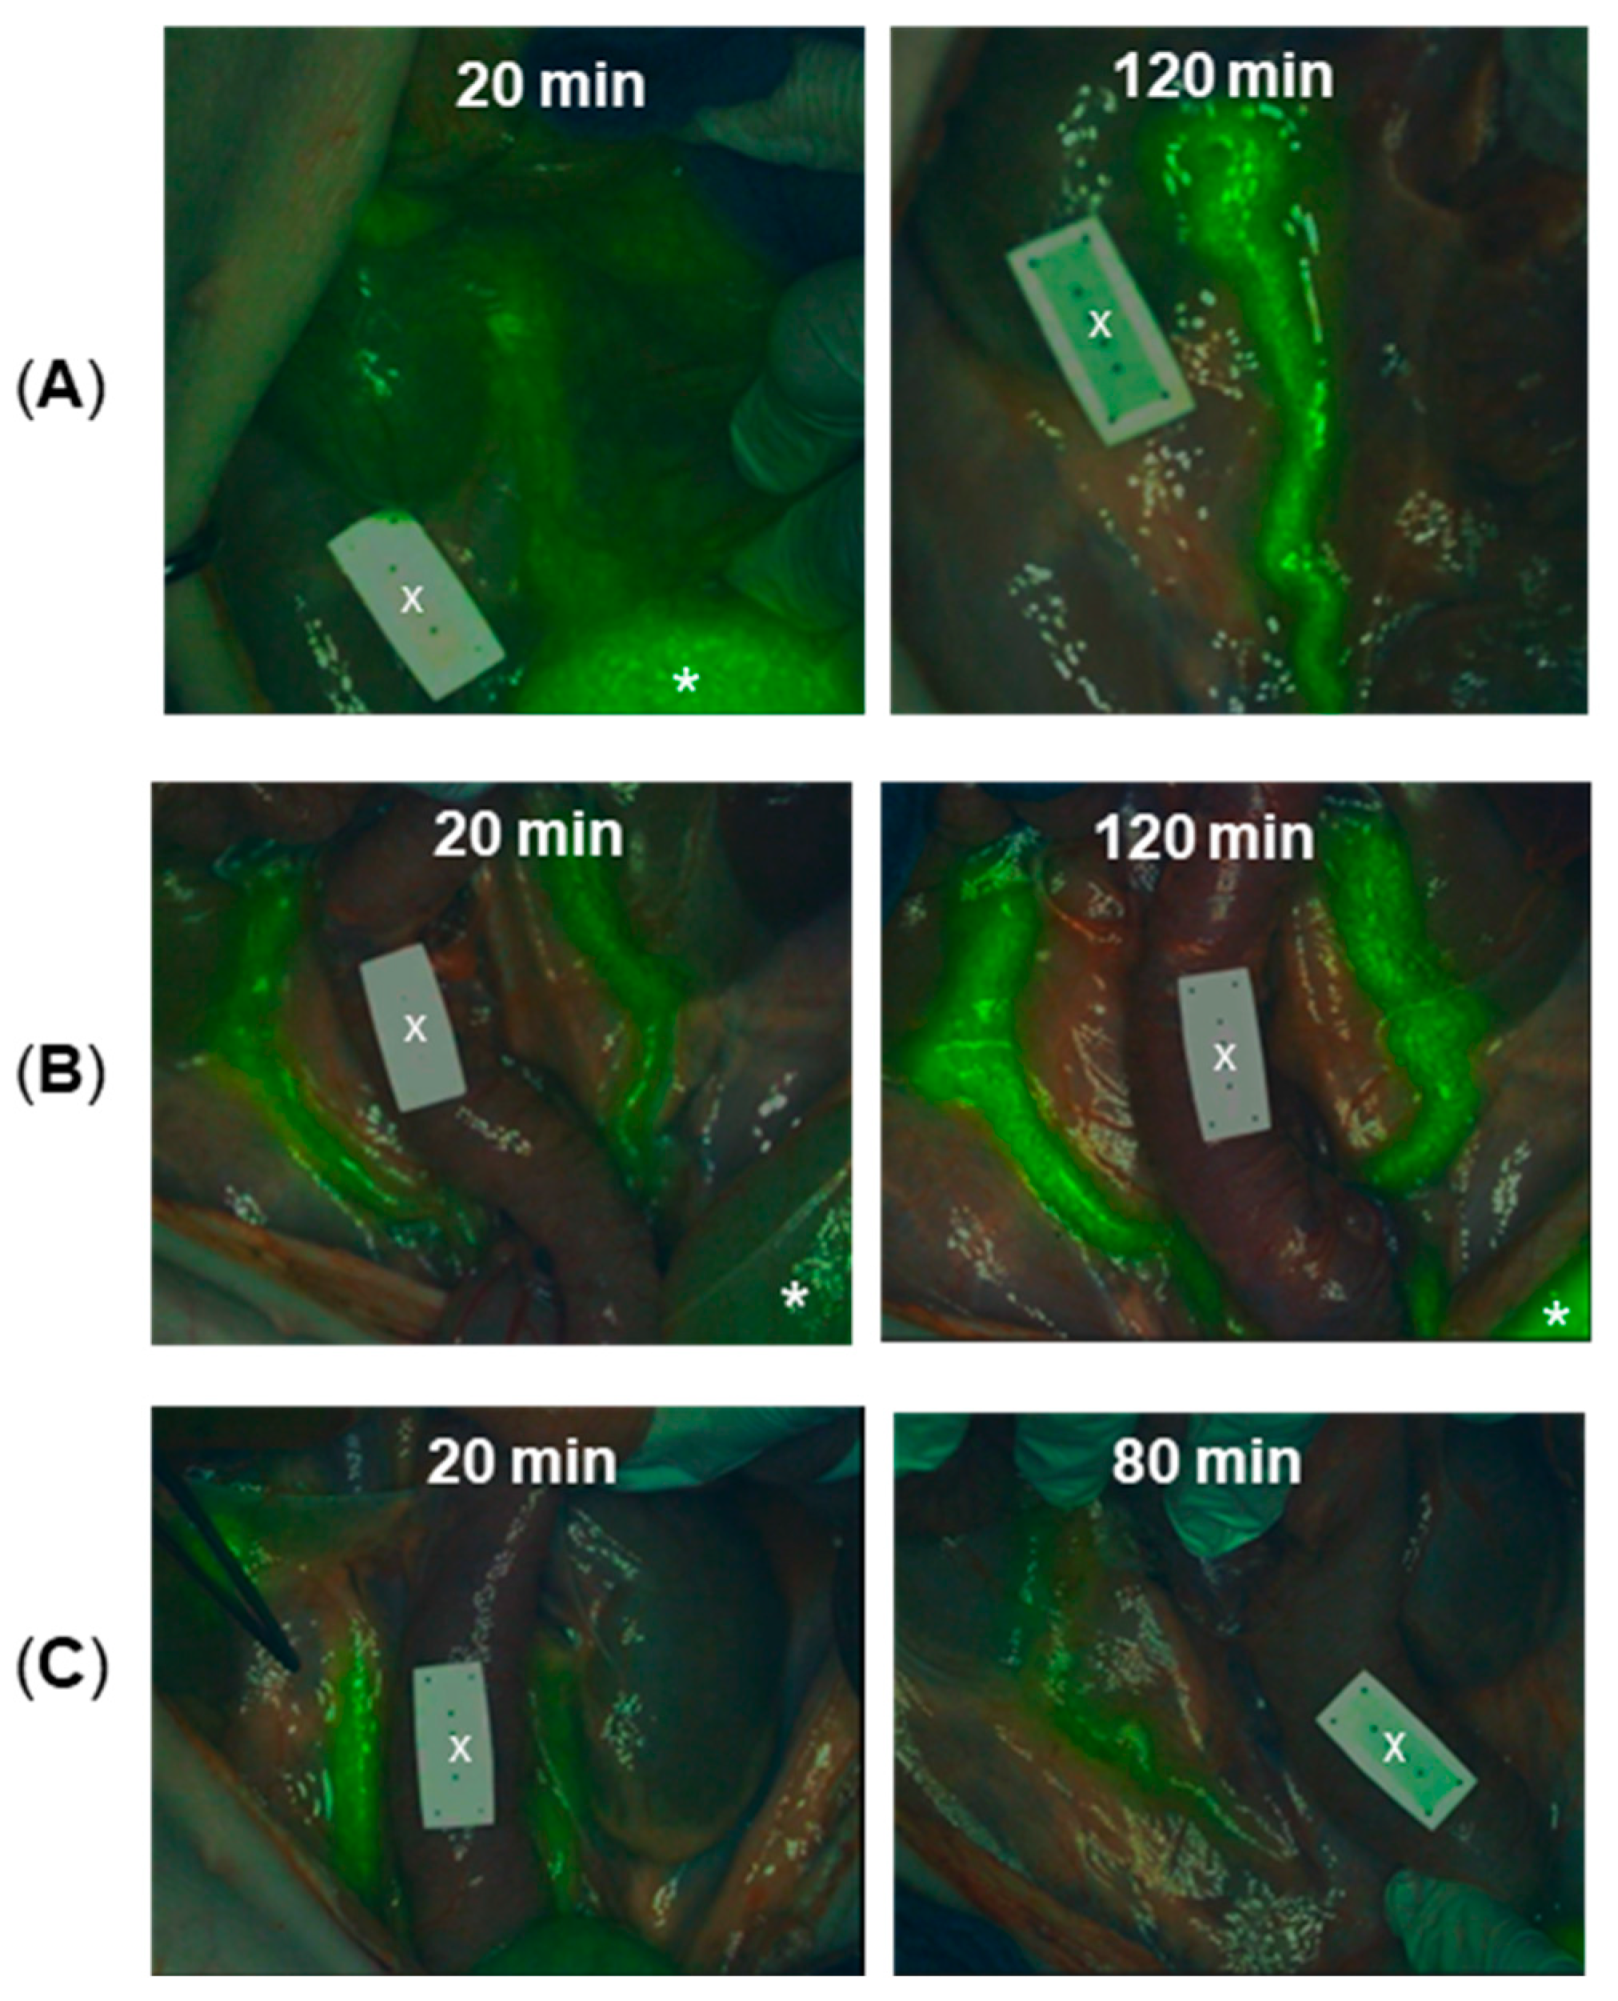
2.5. Porcine Ureter Imaging
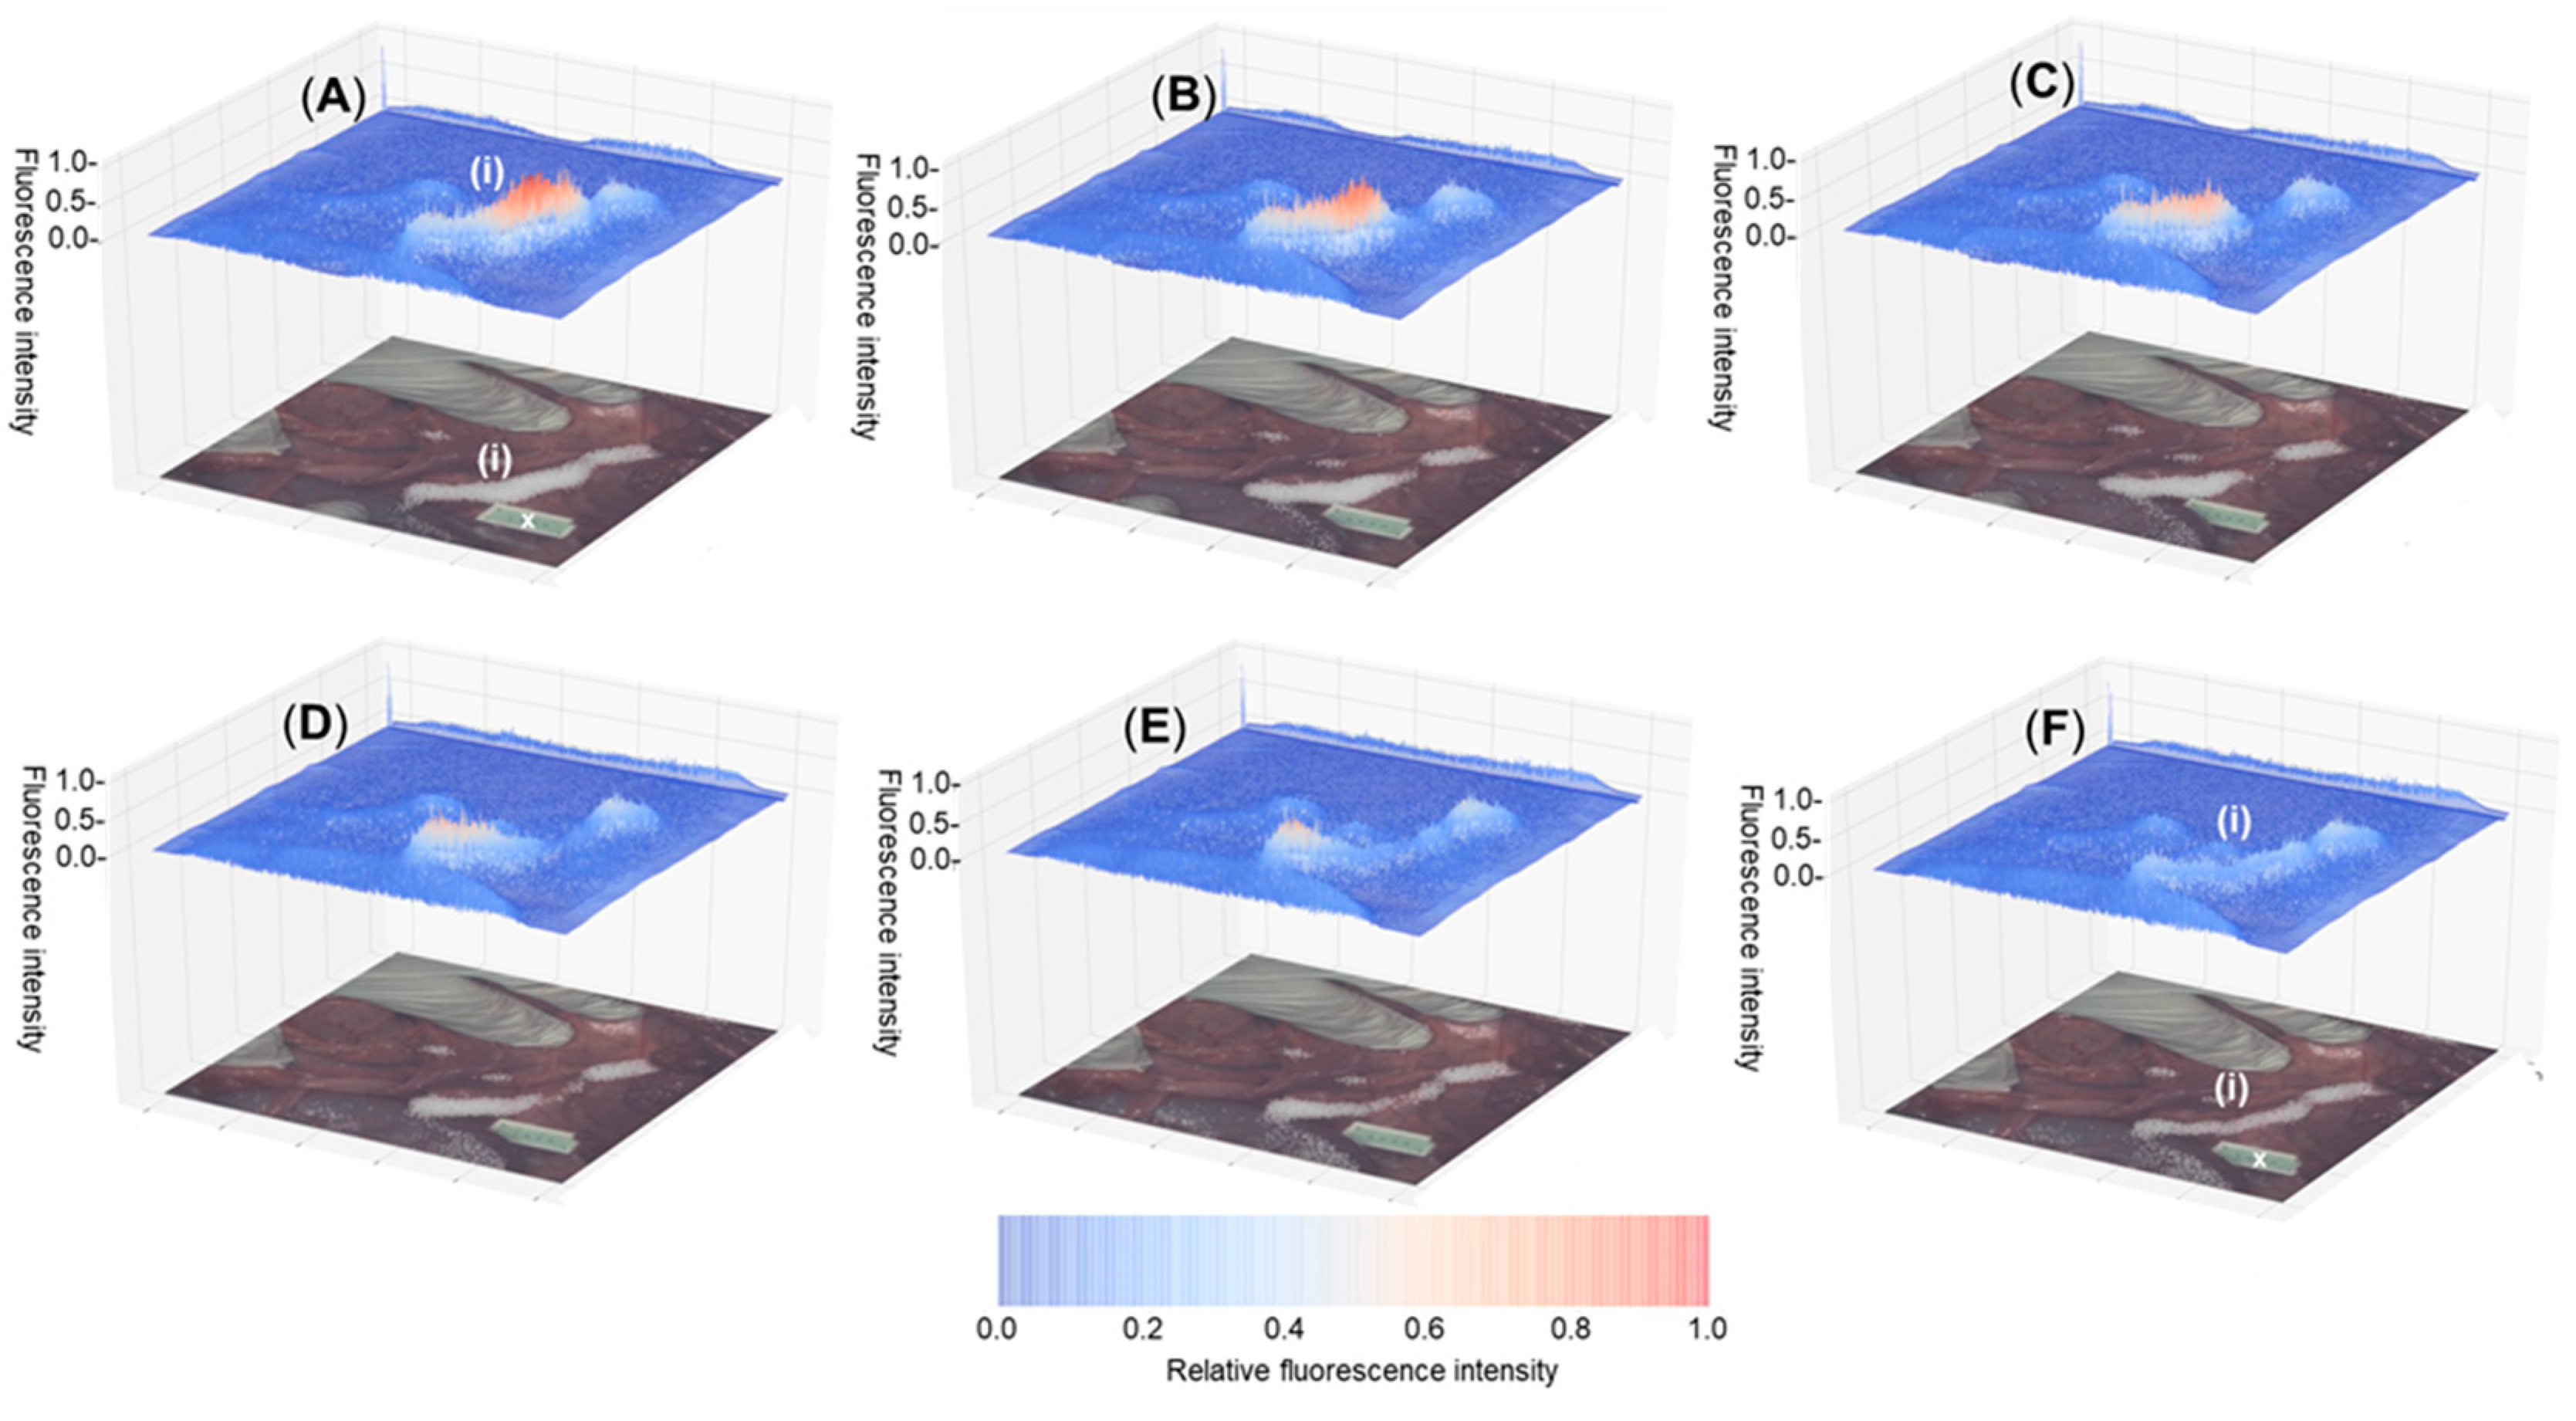
2.6. 3D Fluorescence Intensity Heat Map
3. Experimental Section
3.1. General
3.2. Synthesis and Characterization
3.3. Quantum yield Determination of Fluorophores (7)–(12)
3.4. Rodent Imaging Study
3.5. In Vivo Rodent Screening of Fluorophores 8, 9, 11, 12
3.6. Dose De-Escalation Study for Fluorophore 12
3.7. Ureter Identification in Rodent Model Using 12
3.8. Toxicity Study of 12 in Rodents
3.9. Porcine Imaging Study
4. Conclusions
Supplementary Materials
Author Contributions
Funding
Institutional Review Board Statement
Informed Consent Statement
Data Availability Statement
Conflicts of Interest
References
- Mieog, J.S.D.; Achterberg, F.B.; Zlitni, A.; Hutteman, M.; Burggraaf, J.; Swijnenburg, R.-J.; Gioux, S.; Vahrmeijer, A.L. Fundamentals and developments in fluorescence-guided cancer surgery. Nat. Rev. Clin. Oncol. 2022, 19, 9–22. [Google Scholar] [CrossRef]
- Stewart, H.L.; Birch, D.J.S. Fluorescence-guided surgery. Methods Appl. Fluoresc. 2021, 9, 042002. [Google Scholar] [CrossRef]
- Van Keulen, S.; Hom, M.; White, H.; Rosenthal, E.L.; Baik, F.M. The evolution of fluorescence-guided surgery. Mol. Imaging Biol. 2022. [Google Scholar] [CrossRef] [PubMed]
- Nagaya, T.; Nakamura, Y.A.; Choyke, P.L.; Kobayashi, H. Fluorescence-guided surgery. Front. Oncol. 2017, 7, 314. [Google Scholar] [CrossRef] [PubMed]
- Refaat, A.; Yap, M.L.; Pietersz, G.; Walsh, A.P.G.; Zeller, J.; del Rosal, B.; Wang, X.; Peter, K.J. In vivo fluorescence imaging: Success in preclinical imaging paves the way for clinical applications. J. Nanobiotechnol. 2022, 20, 450. [Google Scholar] [CrossRef] [PubMed]
- Ade-Ojo, I.P.; Tijani, O. A review on the etiology, prevention, and management of ureteral injuries during obstetric and gynecologic surgeries. Int. J. Womens Health 2021, 13, 895–902. [Google Scholar] [CrossRef]
- Burks, F.N.; Santucci, R.A. Management of iatrogenic ureteral injury. Ther. Adv. Urol. 2014, 6, 114–124. [Google Scholar] [CrossRef] [PubMed]
- Jacob, G.P.; Vilos, G.A.; Al Turki, F.; Bhangav, G.; Abu-Rafea, B.; Vilos, A.G.; Ternamian, A. Ureteric injury during gynaecological surgery—Lessons from 20 cases in Canada. Facts Views Vis. Obgyn. 2020, 12, 31–42. [Google Scholar]
- Blackwell, R.H.; Kirshenbaum, E.J.; Shah, A.S.; Kuo, P.C.; Gupta, G.N.; Turk, T.M.T. Complications of recognized and unrecognized iatrogenic ureteral injury at time of hysterectomy: A population based analysis. J. Urol. 2018, 199, 1540–1545. [Google Scholar] [CrossRef]
- Lenihan, J.P. Robotic surgery in gynecology: Ndications, advantages, avoiding complications. In Handbook of Gynecology; Shoupe, D., Ed.; Springer: Cham, Switzerland, 2017; pp. 665–678. [Google Scholar]
- Sposito, C.; Maspero, M.; Belotti, P.; Simonotti, N.; Altomare, M.; Ciana, P.; Mazzaferro, V. Indocyanine green fluorescence-guided surgery for gastrointestinal tumors: A systematic review. Ann. Surg. Open. 2022, 3, e190. [Google Scholar] [CrossRef]
- Peltrini, R.; Podda, M.; Castiglioni, S.; Di Nuzzo, M.M.; D’Ambra, M.; Lionetti, R.; Sodo, M.; Luglio, G.; Mucilli, F.; Di Saverio, S.; et al. Intraoperative use of indocyanine green fluorescence imaging in rectal cancer surgery: The state of the art. World J. Gastroenterol. 2021, 27, 6374–6386. [Google Scholar] [CrossRef] [PubMed]
- Blanco-Colino, R.; Espin-Basany, E. Intraoperative use of ICG fluorescence imaging to reduce the risk of anastomotic leakage in colorectal surgery: A systematic review and meta-analysis. Tech. Coloproctol. 2018, 22, 15–23. [Google Scholar] [CrossRef] [PubMed]
- Faybik, P.; Hetz, H. Plasma disappearance rate of indocyanine green in liver dysfunction. Transplant. Proc. 2006, 38, 801–802. [Google Scholar] [CrossRef] [PubMed]
- Cherrick, G.R.; Stein, S.W.; Leevy, C.M.; Davidson, C.S. Indocyanine green: Observations on its physical properties, plasma decay and hepatic extraction. J. Clin. Investig. 1960, 39, 592–600. [Google Scholar] [CrossRef] [PubMed]
- Faber, R.A.; Verbeek, F.P.R.; de Valk, K.S.; Burggraaf, J.; Vahrmeijer, A.L.; Mieog, J.S.D. A systematic review of clinically available and experimental dyes for intraoperative near-infrared fluorescence imaging of the ureters during laparoscopic surgery. Laparosc. Surg. 2021, 5, 4. [Google Scholar] [CrossRef]
- Zhang, X.; Li, S.; Ma, H.; Wang, H.; Zhang, R.; Zhang, X.-D. Activatable NIR-II organic fluorescent probes for bioimaging. Theranostics 2022, 12, 3345–3371. [Google Scholar] [CrossRef]
- Al-Taher, M.; Diana, M.D. The use of IRDye 800BK for intraoperative ureteral visualization: The future of the ureter is bright! J. Laparoendosc. Adv. Surg. Tech. 2020, 30, 987–988. [Google Scholar] [CrossRef] [PubMed]
- Mahalingam, S.M.; Putt, K.S.; Srinivasarao, M.; Low, P.S. Design of a near infrared fluorescent ureter imaging agent for prevention of ureter damage during abdominal surgeries. Molecules. 2021, 26, 3739. [Google Scholar] [CrossRef]
- Shi, Z.; Han, X.; Hu, W.; Bai, H.; Peng, B.; Ji, L.; Fan, Q.; Li, L.; Huang, W. Bio applications of small molecule Aza-BODIPY: From rational structural design to in vivo investigations. Chem. Soc. Rev. 2020, 49, 7533–7567. [Google Scholar] [CrossRef] [PubMed]
- Curtin, N.; Garre, M.; Bodin, J.-B.; Solem, N.; Méallet-Renault, R.; O’Shea, D.F. Exploiting directed self-assembly and disassembly for off-to-on fluorescence responsive live cell imaging. RSC Adv. 2022, 12, 35655–35665. [Google Scholar] [CrossRef]
- Veronese, F.M.; Mero, A. The impact of PEGylation on biological therapies. Biodrugs 2008, 22, 315–329. [Google Scholar] [CrossRef]
- Daly, H.C.; Sampedro, G.; Bon, C.; Wu, D.; Ismail, G.; Cahill, R.A.; O’Shea, D.F. BF2-azadipyrromethene NIR-emissive fluorophores with research and clinical potential. Eur. J. Med. Chem. 2017, 135, 392–400. [Google Scholar] [CrossRef]
- Wu, D.; Duran-Sampredo, G.; O’Shea, D.F. Synthesis and properties of water-soluble 1,9-dialkyl-substituted BF2 azadipyrromethene fluorophores. Front. Chem. Sci. Eng. 2020, 14, 97–104. [Google Scholar] [CrossRef]
- Daly, H.C.; Conroy, E.; Todor, M.; Wu, D.; Gallagher, W.M.; O’Shea, D.F. An EPR strategy for bio-responsive fluorescence guided surgery with simulation of the benefit for imaging. Theranostics 2020, 10, 3064–3082. [Google Scholar] [CrossRef] [PubMed]
- Inagaki, F.F.; Fujimura, D.; Ansteatt, S.; Okada, R.; Furusawa, A.; Choyke, P.L.; Ptaszek, M.; Kobayashi, H. Effect of short PEG on near-infrared BODIPY-based activatable optical probes. ACS Omega 2020, 5, 15657–15665. [Google Scholar] [CrossRef]
- Ogata, F.; Nagaya, T.; Maruoka, Y.; Akhigbe, J.; Meares, A.; Lucero, M.; Satraitis, A.; Fujimura, D.; Okada, R.; Inagaki, F.; et al. Activatable near-infrared fluorescence imaging using PEGylated bacteriochlorin-based chlroin and BODIPY-dyads as probes for detecting cancer. Bioconjug. Chem. 2019, 30, 169–183. [Google Scholar] [CrossRef] [PubMed]
- Batat, P.; Cantuel, M.; Jonusauskas, G.; Scarpantonio, L.; Palma, A.; O’Shea, D.F.; McClenaghan, N.D. BF2-azadipyrromethenes: Probing the excited-state dynamics of a NIR fluorophore and photodynamic therapy agent. J. Phys. Chem. A 2011, 115, 14034–14039. [Google Scholar] [CrossRef] [PubMed]
- Murtagh, J.; Frimannsson, D.O.; O’Shea, D.F. Azide conjugatable and pH responsive near-infrared fluorescent imaging probes. Org. Lett. 2009, 11, 5386–5389. [Google Scholar] [CrossRef]
- Wu, D.; O’Shea, D.F. Comparative triad of routes to an alkyne-BF2 azadipyrromethene near-infrared fluorochrome. Tet. Lett. 2017, 58, 4468–4472. [Google Scholar] [CrossRef]
- Wu, D.; Daly, H.C.; Conroy, E.; Li, B.; Gallagher, W.M.; Cahill, R.A.; O’Shea, D.F. PEGylated BF2-azadipyrromethene (NIR-AZA) fluorophores, for intraoperative imaging. Eur. J. Med. Chem. 2019, 161, 343–353. [Google Scholar] [CrossRef]
- Du Le, V.N.; Nie, Z.; Hayward, J.E.; Farrell, T.J.; Fang, Q. Measurements of extrinsic fluorescence in intralipid and polystyrene microspheres. Biomed. Opt. Express. 2014, 5, 2726–2735. [Google Scholar] [CrossRef] [PubMed]
- DSouza, A.V.; Lin, H.; Henderson, E.R.; Samkoe, K.S.; Pogue, B.W. Review of fluorescence guided surgery systems: Identification of key performance capabilities beyond indocyanine green imaging. J. Biomed. Opt. 2016, 21, 080901. [Google Scholar] [CrossRef]
- Behrooz, A.; Waterman, P.; Vasquez, K.O.; Meganck, J.; Peterson, J.D.; Faqir, I.; Kempner, J. Multispectral open-air intraoperative fluorescence imaging. Opt. Lett. 2017, 42, 2964–2967. [Google Scholar] [CrossRef] [PubMed]
- Barberio, M.; Al-Taher, M.; Felli, E.; Ashoka, A.H.; Marescaux, J.; Klymchenko, A.; Diana, M. Intraoperative ureter identification with a novel fluorescent catheter. Sci. Rep. 2021, 11, 4501. [Google Scholar] [CrossRef] [PubMed]
- Curtin, N.; Wu, D.; Cahill, R.; Sarkar, A.; Aonghusa, P.M.; Zhuk, S.; Barberio, M.; Al-Taher, M.; Marescaux, J.; Diana, M.; et al. Dual color imaging from a single BF2-azadipyrromethene fluorophore demonstrated in vivo for lymph node identification. Int. J. Med. Sci. 2021, 18, 1541–1553. [Google Scholar] [CrossRef] [PubMed]
- Python Programs Used, Together with Supporting Data, Are Available for Download at Github. Available online: https://github.com/pol-maca/icg-imaging (accessed on 24 February 2023).
- Kilkenny, C.; Browne, W.; Cuthill, I.C.; Emerson, M.; Altman, D.G. Animal research: Reporting in vivo experiments: The ARRIVE guidelines. J. Gene Med. 2010, 12, 561–563. [Google Scholar] [CrossRef]


| Entry | mol wt (kDa) | λabs (nm) a | Fwhm (nm) a | λflu (nm) b | ɸflu c | |
|---|---|---|---|---|---|---|
| 1 | 7 | 1.1 | 680 (684) | 65 (104) | 712 (722) | 0.32 (<0.001) |
| 2 | 8 | 5.2 | 678 (684) | 64 (109) | 712 (725) | 0.32 (0.04) |
| 3 | 9 | 9.5 | 676 (683) | 93 (114) | 717 (724) | 0.26 (0.03) |
| 4 | 10 | 1.7 | 678 (688) | 86 (106) | 717 (725) | 0.30 (0.015) |
| 5 | 11 | 6.4 | 670 (683) | 85 (94) | 712 (721) | 0.31 (0.11) |
| 6 | 12 | 9.8 | 676 (683) | 75 (93) | 711 (721) | 0.31 (0.12) |
| Group | White Blood Cells | Neutrophils | Lymphocytes | Monocytes | Platelets |
|---|---|---|---|---|---|
| Control (PBS) | 13.85 (2.0) | 0.90 (0.1) | 12.37 (1.9) | 0.31 (0.2) | 1139 (43.9) |
| 12 (14 mg/kg) | 11.0 (2.3) | 0.99 (0.2) | 9.5 (2.0) | 0.25 (0.09) | 1219 (256) |
| 12 (10 mg/kg) | 13.86 (2.4) | 0.99 (0.1) | 12.2 (2.4) | 0.34 (0.07) | 1304 (18.1) |
Disclaimer/Publisher’s Note: The statements, opinions and data contained in all publications are solely those of the individual author(s) and contributor(s) and not of MDPI and/or the editor(s). MDPI and/or the editor(s) disclaim responsibility for any injury to people or property resulting from any ideas, methods, instructions or products referred to in the content. |
© 2023 by the authors. Licensee MDPI, Basel, Switzerland. This article is an open access article distributed under the terms and conditions of the Creative Commons Attribution (CC BY) license (https://creativecommons.org/licenses/by/4.0/).
Share and Cite
Caulfield, C.; Wu, D.; Miller, I.S.; Byrne, A.T.; Mac Aonghusa, P.; Zhuk, S.; Cinelli, L.; Bannone, E.; Marescaux, J.; Gioux, S.; et al. BF2-Azadipyrromethene Fluorophores for Intraoperative Vital Structure Identification. Molecules 2023, 28, 2167. https://doi.org/10.3390/molecules28052167
Caulfield C, Wu D, Miller IS, Byrne AT, Mac Aonghusa P, Zhuk S, Cinelli L, Bannone E, Marescaux J, Gioux S, et al. BF2-Azadipyrromethene Fluorophores for Intraoperative Vital Structure Identification. Molecules. 2023; 28(5):2167. https://doi.org/10.3390/molecules28052167
Chicago/Turabian StyleCaulfield, Cathal, Dan Wu, Ian S. Miller, Annette T. Byrne, Pól Mac Aonghusa, Sergiy Zhuk, Lorenzo Cinelli, Elisa Bannone, Jacques Marescaux, Sylvain Gioux, and et al. 2023. "BF2-Azadipyrromethene Fluorophores for Intraoperative Vital Structure Identification" Molecules 28, no. 5: 2167. https://doi.org/10.3390/molecules28052167
APA StyleCaulfield, C., Wu, D., Miller, I. S., Byrne, A. T., Mac Aonghusa, P., Zhuk, S., Cinelli, L., Bannone, E., Marescaux, J., Gioux, S., Diana, M., March, T. L., Vahrmeijer, A. L., Cahill, R., & O’Shea, D. F. (2023). BF2-Azadipyrromethene Fluorophores for Intraoperative Vital Structure Identification. Molecules, 28(5), 2167. https://doi.org/10.3390/molecules28052167