Abstract
Global waste production is significantly rising with the increase in population. Efforts are being made to utilize waste in meaningful ways and increase its economic value. This research makes one such effort by utilizing gas-to-liquid (GTL)-derived biosolids, a significant waste produced from the wastewater treatment process. To understand the surface properties, the biosolid waste (BS) that is activated directly using potassium carbonate, labelled as KBS, has been characterized using scanning electron microscopy and energy dispersive X-ray spectroscopy (SEM-EDS), X-ray photoelectron spectroscopy (XPS), X-ray powder diffraction (XRD), and Brunauer–Emmett–Teller (BET). The characterization shows that the surface area of BS increased from 0.010 to 156 m2/g upon activation. The EDS and XPS results show an increase in the metal content after activation (especially iron); additionally, XRD revealed the presence of magnetite and potassium iron oxide upon activation. Furthermore, the magnetic field was recorded to be 0.1 mT using a tesla meter. The magnetic properties present in the activated carbon show potential for pollutant removal. Adsorption studies of methylene blue using KBS show a maximum adsorption capacity of 59.27 mg/g; the adsorption process is rapid and reaches equilibrium after 9 h. Modelling using seven different isotherm and kinetic models reveals the best fit for the Langmuir-Freundlich and Diffusion-chemisorptionmodels, respectively. Additional thermodynamic calculations conclude the adsorption system to be exothermic, spontaneous, and favoring physisorption.
1. Introduction
The global population is ever-growing, recently surpassing 8 billion people, and wastewater production is also on the rise and projected to increase by 51% by the year 2030 from the 2020 levels of 380 billion m3 [1]. Water pollution associated with high amounts of aromatic pollutants with dark colors and weakly biodegradable, complex components generated from the dyeing industry is known to be problematic [2]. For the longest time, the wastewater produced from the dyeing industry was considered the ‘hot spot’ of wastewater treatment research. The common treatment methods included chemical oxidation, membrane treatment, photo-degradation, biological treatment, micellar solubilization, adsorption, and others [3,4,5]. Adsorption, the process by which the substances present in liquids or gases adhere onto the surfaces of solid adsorbents [6], is generally applied for water purification to remove impurities. It is known to be one of the most preferable treatment technologies for dye removal as it is inexpensive, simple, and highly efficient [7]. The commercial production of activated carbon (AC) is expensive; therefore, ongoing research on biomass and wastes for adsorption is being carried out extensively.
Population growth also leads to an exponential rise in the waste produced, causing ecological and social burdens along with environmental ramifications. The management techniques are mostly based on incineration, open dumping, and landfilling, which are associated with environmental risks because of the associated greenhouse gas emissions [8]. Resource utilization or producing value-added products from waste and biomass is being widely studied to reduce the total amount of waste produced [9,10,11]. Among several kinds of waste, the inevitable wastes produced from biological wastewater treatment plants (biosolids/sewage sludge) are significant [12]. The waste is upgraded by activation through physical or thermal (air, carbon dioxide, or steam) and chemical (acid, alkali, neutral) means. The process is known to improve the surface properties of the feed in a single-stage activation system and biochar in a two-stage activation system [13]. In addition to the surface properties, certain elements and bonds are also known to improve the adsorption process. Generally, sludge samples are known to have high iron content based on the treatment method and chemicals used during treatment [14]. Research has branched out to adding nano-valent iron to the sludge-based biochar for increased magnetism [15,16]. There is also increased interest in magnetic iron oxide nanoparticles (MNPs) as an adsorbent and catalyst for pyrolysis studies [17].
For this study, AC is produced from GTL-derived treated sewage sludge (biosolids). Around 6000 tons of biosolids are generated annually in the world’s largest GTL plant in Qatar [18]. Since sludge/biosolid-derived AC is rich in functional groups with improved surface area and pore volume, it can be considered beneficial for removing pollutants from water [19]. The targeted pollutant for this work is methylene blue (MB): an aromatic organic compound and cationic dye known to be highly carcinogenic in nature [19] and frequently regarded as a standard for adsorbent testing. The objectives of this study are the following: Initially, to activate GTL-derived biosolids (BS) using potassium carbonate (KBS). Then, the biosolid pristine and activated samples were characterized in order to understand the effects on the contents and composition of the samples. Furthermore, the effects of varying concentrations, contact time, pH, and temperature on the adsorption of MB using KBS were investigated. Using the generated adsorption data, isotherm and kinetical modelling was carried out to evaluate best-fit models. Finally, thermodynamic calculations from the isotherm data are performed to understand the adsorption system better for future applications and equilibrium reaction boundary limits.
2. Results and Discussion
2.1. Characterization of Samples
The impregnation ratios 1:1 and 1:2 (sample:activating ratios) generated ACs with low surface area and porosity, which seems unfit to be used for water treatment (Table S1). Table 1 reveals the common characteristics of pristine biosolid (BS) and activated BS samples (KBS) prepared by 1:3 (sample:activating agent) ratio. The biosolid (pristine and activated) samples are alkaline and negatively charged. The yield calculated for KBS is 33.25%, which is better than the reported literature on single-stage ACs from biosolids [20]. There is a significant improvement in the surface area, increasing from 0.010 to 156.56 m2/g, and pore volume, from 0.021 to 0.235 cm3/g, upon activation (Figure S1), better than some reported studies [21].

Table 1.
Characteristics of biosolids before and after activation.
The SEM images reveal the lack of porosity and surface area in the pristine raw material sample and show increased fragmentation and surface area in the activated sample (Figure 1). Elemental microanalysis (Table 2) in the pristine biosolid sample shows a high content of metals such as iron, calcium, magnesium, and potassium—the natural presence of these metals improves pore development due to the sintering process [22].
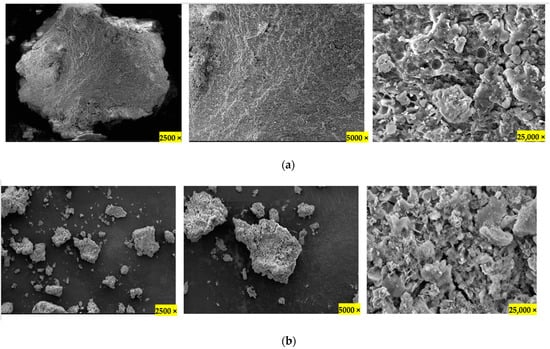
Figure 1.
SEM images of Biosolids; (a) pristine (BS), (b) activated samples (KBS) in different magnifications.
Table 2.
EDS microanalysis of elements on the surface of BS and KBS.
Further EDS analysis of the sample before and after activation, shown in Table 2, reveals that an increase in temperature concentrates elements, mainly phosphorous, calcium, and iron, present in the sample. The iron content in terms of mass percentage increased from 6.53% to 31%, showing a good improvement in magnetic properties; this is also evident from the brown color of the sample after activation (Figure S1). Due to the presence of the oxygen-containing activating agent potassium carbonate, there is an increase in the potassium and oxygen recorded upon activation. Since it is a relative percentage, the carbon and nitrogen seem to have reduced with activation. XPS results, shown in Table 3 and Figure 2, further confirm the reduction of carbon, nitrogen, and sulfur. Furthermore, C1s-related chemical state analysis shows the presence of the peaks C-C/C-H at 284.8 eV, C-O/C-N at 286.2 eV, C=O at 287.8 eV, and -CO3/O-C=O at 289.2 eV for the BS sample. While for KBS, C1s-related chemical state analysis shows the presence of the peaks C-C/C-H at 284.8 eV, C-O/C-N at 286.3 eV, C=O at 287.7 eV, and -CO3/O-C=O at 289.3 eV, as well as K2p3/2 and K2p1/2 at 292.6 eV and 295.4 eV, respectively, as shown in Figure 2b.
Table 3.
XPS survey results on the surface of BS and KBS.
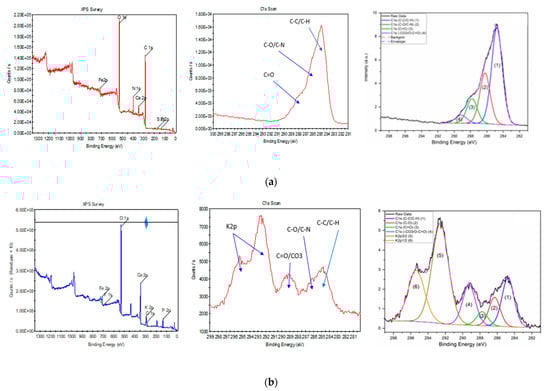
Figure 2.
XPS results of Biosolids; (a) pristine (BS) and (b) activated samples (KBS).
The deconvolution method is detailed in previous reports [23,24,25]. The XPS results show the presence of C mainly as C-C/C-H for the BS sample with a smaller presence of C-O/C-N and with a minor presence of C=O and -CO3/O-C=O. However, KBS shows the presence of mainly C-C/C-H as well as a smaller presence of C-O and a minor presence of C=O. After the activation, the -CO3/O-C=O peak relative area has increased compared to C-C/C-H, which is related to the presence of carbonates (-CO3) at the surface. This activation has also kept some K at the surface. The increased presence of metals and specific carbon bonds may prove beneficial for pollutant removal studies [13].
The XRD analysis of KBS shows the prominent presence of magnetite and potassium iron oxide (K2Fe4O7, KFeO2), while calcite was seen to be the only ‘major’ deposit detected on the pristine sample (Figure 3). The diffraction peaks at 35.2° matched well with the PDF spectrum of Fe3O4, showing the presence of magnetic properties after activation [26]. Further analysis of KBS using a tesla meter revealed a magnetic field of 0.1 mT, confirming the sample is weakly magnetic.

Figure 3.
XRD results of of bothpristine (BS) and aactivated samples (KBS).
2.2. Adsorption Experiments
The adsorption experiments using KBS revealed that the maximum adsorption capacity of methylene blue is 59.27 mg/g at 40 °C and pH 7 (Figure 4). The effect of pH is seen to be significant as the adsorption capacity increased from 9.89 mg/g at pH 2 to reach the maximum at pH 7, with little change in further alkaline conditions (Figure S3). This could be due to increased electrostatic interaction between negatively charged KBS and cationic MB at higher pH due to the lack of competition by H+ ions in water for vacant sites on the AC. The adsorption capacities are comparable to some waste adsorbents reported in the literature (Table 4). More recently, potassium-carbonate-activated samples have been shown to have better properties compared to other alkali methods. One such study reported to have a better yield, surface area, and pore volume compared to potassium hydroxide, thus enabling a higher adsorption capacity for larger molecules such as methylene blue [27].
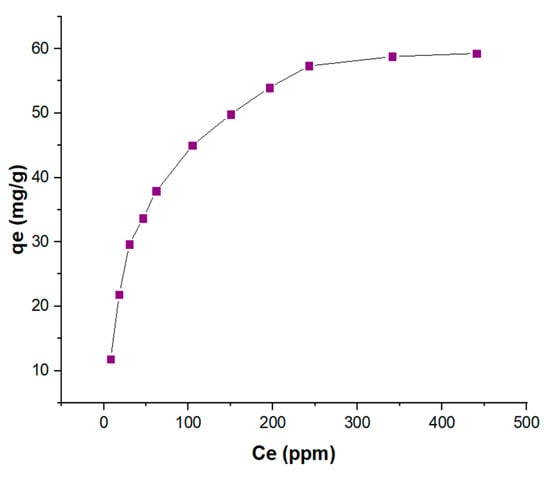
Figure 4.
Maximum MB adsorption capacity (mg/g) of KBS at 40 °C and pH 7.
Table 4.
Adsorption capacities of waste adsorbents reported in literature.
2.3. Isotherm Modelling
The adsorption isotherm shows the distribution of adsorbed molecules between MB and KBS at an equilibrium state. The adsorption data were fitted to seven different models described in Table S2. The two best-fit models, based on the least sum of squares error (SSE), are the Langmuir–Freundlich (LF) model followed by the Langmuir model (Table 5, Figure 5). The LF model is a modification of the Langmuir and Freundlich models used to predict a heterogenous system, also circumventing the limitations related to increased adsorbate concentrations of the Freundlich model. Based on the assumptions of the LF model (Table S2), the adsorption system localizes without adsorbate–adsorbate interaction. Additionally, the second best-fit model the Langmuir model suggests the adsorption took place on a monolayer which is also an assumption of the LF model. The results from this section prove that there is a high availability of vacant sites on the surface for adsorption.
Table 5.
Best-fit isotherm models.
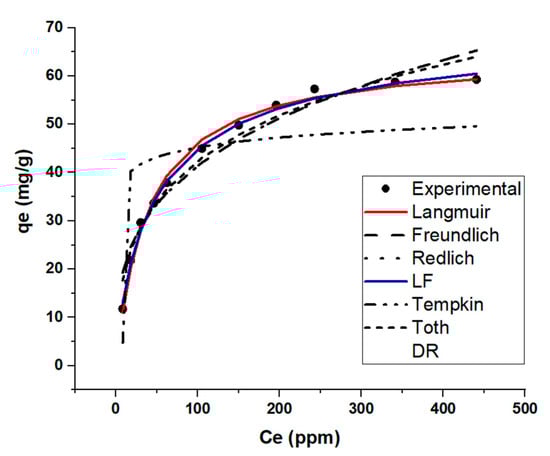
Figure 5.
Isotherm modelling results of KBS: MB adsorption capacity at equilibrium (qe) Vs. final concentration.
2.4. Contact Time Study and Kinetic Modelling
This study also concludes that contact time plays an essential part in MB adsorption. The influence of time from 0 to 1440 min (12 h) is recorded and plotted in Figure 6a. Most of the adsorption process took place rapidly in the first 2 h with high removal efficiencies. Furthermore, when 500 ppm MB concentration was used for adsorption, the adsorption reached a plateau after 9 h, reaching a removal efficiency of 11.8%. Kinetic modelling of the adsorption data using the contact time data (Co = 500 ppm) using the seven models described in Table S3 revealed that the diffusion–chemisorption, pseudo-first order (PFO),and pseudo-second order (PSO) models have the better fits based on the least SSE error values (Table 6, Figure 6b). The model that correlates best with the data is the Diffusion-chemisorption (DF) model. The DF model reveals that much like the isotherm modelling results, the adsorption system favors the sorption of adsorbate onto a heterogeneous surface and that the rate of change of concentration in solid phase correlates to the rate of mass of transfer of pollutant in fluid phase during adsorption (Table S3).
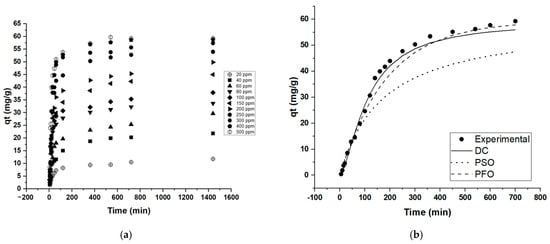
Figure 6.
MB adsorption capacity (qt) Vs. time; (a) contact time trend, (b) best-fit kinetic models.
Table 6.
Best-fit kinetic models.
2.5. Effect of Temperature and Thermodynamic Calculations
The isotherm curves of the sample were plotted by data obtained at 20, 30, and 40 °C (Figure 7a). The results show that adsorption trends were the same for all conditions. The data from the final point at 500 ppm (Ce and qe) for all three temperatures were used for the calculation of ∆G°. Figure 7b shows the data plot of KBS (1/T Vs. lnKd); the plot showed excellent correlation (R2 > 0.998); it is evident the ∆H °value is negative, and ∆S ° is positive (Table 7). The negative ∆H ° value shows that the reaction is exothermic, and the positive ∆S ° reveals the randomness of the solid-liquid interface of the adsorption system, and a good attraction is observed between MB and the ACs.
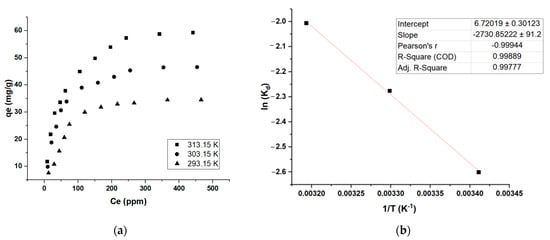
Figure 7.
Thermodynamic calculations; (a) effect of temperature on MB adsorption, (b) Arrhenius plot showing ln (Kd) Vs. 1/T using isotherm data generated at C0 = 500 ppm (maximum MB removal).
Table 7.
Thermodynamic parameters for the adsorption of MB by KBS.
The isotherm curves of the sample were plotted by data obtained at 293.15, 303.15, and 313.15 K (Figure 7a). The results show that the adsorption trends were the same for all conditions. The data from the final point at 500 ppm (Ce and qe) for all three temperatures were used for the calculation of ∆G°. Figure 7b shows the data plot of KBS (1/T vs. lnKd) and the detailed calculations are shown in Table S4; the plot showed excellent correlations (R2 > 0.998) and it is evident the ∆H °values are negative, and ∆S ° is positive (Table 7). The negative ∆H ° values show that the reaction is exothermic, and the positive ∆S ° reveals the randomness of the solid–liquid interface of the adsorption system, and a good attraction is observed between MB and the ACs. Furthermore, the ∆G ° calculated is negative, showing that the adsorption system was spontaneous, suggesting a physisorption process (as the value is in between −20 KJ/mol and 0 KJ/mol) [34]. This is also supported by the ∆H value showing lesser than 80 KJ/mol, indicating a physisorption system (Table 7). There are several such adsorption systems reported in the literature [35,36]. The slight ∆G ° decrease with an increase in temperature shows that this MB adsorption study favors higher temperatures. Furthermore, the activation energy Ea measurement from the slope between lnKd and 1/T shows a value of 22.7 KJ/mol, indicating the reaction is quick as it is below 40 KJ/mol [37].
The negative surface charge of the samples (Table 1) attracts the positively charged cationic colored dye ion of methylene blue. Given the experimental conditions, it is possible that electrostatic interactions played a key role in the adsorption mechanism—this is supported by another study on a K2CO3-activated grass waste sample used for MB removal [38].
3. Materials and Methods
3.1. Activation
The biosolid sample was obtained from the Pearl Shell GTL plant in Qatar in the dried form. Potassium carbonate (1M) was added to the sample at an impregnation ratio of 1:1, 1:2, and 1:3 (sample:activating agent) and mixed at 100 rpm for 24 h in an auto shaker. The samples were then dried at 105 °C for 8 h. The powdered samples were then activated in a muffled furnace at a heating rate of 10 °C/min until 700 °C for 2 h with a constant flow of nitrogen. The treated samples were washed, and the pH adjusted to neutral using 1M hydrochloric acid. The samples were dried before further use. The sample was activated using a 1:3 (sample:activating agent) ratio, labelled KBS, and was used for characterization and further adsorption experiments.
The yield was calculated as follows (Equation (1)):
Yield (%) = Weight of biochar (g) /Weight of oven-dried wastes (g) × 100
3.2. Characterization
3.2.1. pH
The pH of the samples was determined using a modified ASTM standard method D3838-99 (ASTM, 217 2005). About 1 g of dried sample was put into a beaker containing 10 mL of boiling de-ionized water. The solution mixture was heated and allowed to boil for about 15 min in a sealed tube. Then, the solution was filtered employing a pre-moistened filter paper (Whatman No. 2, 110 mm diameter).
3.2.2. Zeta Potential
A zeta potential analyzer (Zetasizer Nano-ZS, Malvern P analytical, Malvern, UK) was used to analyze the charge of the char. Before using the instrument, 0.1 g of the char sample was added to 200 mL of distilled water to make a suspension of 0.5 ppm; further shaking at 150 rpm was performed for 12 h to ensure adequate mixing.
3.2.3. BET
The surface area was characterized by BET (Brunauer–Emmett–Teller) nitrogen sorption at 77 K temperature with a relative pressure between 0.05 to 0.35 using a Nova 2200e surface area analyzer (Tristar3200, Micromeritics, Norcross, GA, USA). The degassing was carried out at 105 °C for 24 h. The pore volume was also analyzed by BET and estimated by the liquid adsorbate volume of nitrogen at a relative pressure of 0.99.
3.2.4. SEM-EDS
Scanning electron microscopy (SEM) and energy dispersive X-ray spectroscopy (EDS) were carried out to understand the morphology and the elemental microanalysis of the surface of the samples. The powdered samples were sprinkled onto adhesive carbon tape, and any excess was blown away using compressed air. The sample was then coated with 5nm of gold (using Quoram Q150 sputter, East Sussex, UK) to make it electrically conductive for SEM analysis.
Imaging was performed at 5 KV using an ETD secondary electron detector and a Quanta650FEG FEI SEM (Hillsboro, OR, USA). The elemental microanalysis was performed at 15 KV using a Bruker Quantax EDS detector (Billerica, MA, USA). Gold was deconvoluted to zero to obtain a semi-quantitative result.
3.2.5. XPS
Both pristine and activated BS samples (KBS) were characterized using surface analysis technique, namely, X-ray photoelectron spectroscopy (XPS) (ESCALAB250Xi, Thermo Fisher Scientific, East Grinstead, UK). Pass energy for high resolution scans is 20 eV and for survey scans is 100 eV. XPS was calibrated using triple high purity standards of Au, Ag, and Cu. All samples were referenced using C1s (C-C/C-H) at 284.8 eV.
3.2.6. XRD
For this study, a Bruker D8 Advance X-ray diffractometer with Cu Kα radiation (ʎ = 1.5418 Å) was used at instrument settings of 40 kV and 40 mA. The scan range was set from 3° to 90°. The step size was set at 0.020°.
3.2.7. Tesla Meter
The magnetic field of the sample is measured using a tesla meter (PHYWE Systeme GmbH & Co. KG, Göttingen, Germany). After zeroing the instrument of the earth’s magnetic field, the sample is measured using a hall probe under constant alternating current, setting the adjustable meter range at 0–20 mT with an accuracy of 0.01 mT.
3.3. Adsorption Experiments
To study the effect of varying concentrations, the adsorption studies were carried out using initial concentrations of 20, 40, 60, 80, 100, 150, 200, 250, 300, 400, and 500 ppm of MB. About 0.1 g of AC (1:3 sample:activating agent) is added to 0.1 L of MB solution in each case and stirred for 24 h at 200 rpm at 40 °C. For the temperature effect, adsorption was carried out at 20, 30, and 40 °C under the isotherm conditions mentioned previously. Similarly, to understand the effect of pH, studies were conducted at 40 °C at pH 2, 4, 6, 7, and 10. For the contact time studies, the adsorption study using 500 ppm MB solution is studied; here, samples were collected at various intervals between 0 and 1440 min.
The samples’ initial and final MB concentrations were measured using UV-VIS spectrophotometry (Shimadzu UV-3600 Plus spectrophotometer, Kyoto, Japan) by measuring the absorbance spectra at steady-state conditions using the calibration curve shown in Figure S4. After adsorption, all solutions were filtered, and then the supernatant concentration was measured. The maximum methylene blue adsorption is observed at a wavelength of 664 nm (λmax) as per previous publication [39] (refer Figure S5); therefore, all measurements for this study were taken at this wavelength. The adsorption capacity (qe) is calculated using Equation (2):
where Co is the initial concentration in ppm; Ce is the final equilibrium concentration in ppm; V is the solution volume in L; and m is the mass of the KBS in g.
3.4. Adsorption Isotherms and Kinetics
To better understand the adsorption data obtained from different initial MB concentrations, equilibrium adsorption isotherm modelling is conducted. This helps to better understand the adsorption mechanism. There are seven isotherm model studies in this important paper: Langmuir, Freundlich, Redlich–Peterson, Langmuir–Freundlich, Toth, Temkin, and Dublin–Radushkevich—the equations and descriptions are shown in Table S2. To understand pollutant uptake rate, kinetic modelling using seven kinetic models were studied—the models are described in Table S3. The best-fit models in both cases are selected based on the least SSE (sum of squares of errors) method.
3.5. Thermodynamic Calculations
Adsorption isotherms at temperatures 20 °C (293.15 K), 30 °C (303.15K), and 40 °C (313.15 K) were analyzed for thermodynamic properties previously described in the literature [34,40,41]. The main focus is to study the enthalpy, entropy, and Gibbs free energy, which gives information on spontaneity. The equations used to calculate Gibbs free energy (Equations (3) and (4)):
R = universal constant of 8.314 J/mol.K; T = temperature in Kelvin; qe = adsorbed pollutant amount at equilibrium in mg/g; Ce = left over pollutant concentration in mg/L; and Kd (distribution coefficient of adsorption) = .
Additionally, the Van’t Hoff equation, evaluating the relationship between enthalpy and entropy, shows the relationship between Kd, enthalpy, and entropy:
ln(Kd) = ∆S°/R = ∆H°/RT
The values of ∆S° and ∆H° were calculated from the slope and intercept of the plot containing ln(Kd) versus (1/T). In this case, the isotherm data at initial pollutant concentration of 500 ppm is used for the study. Further calculations on activation energy (Ea) were derived from the plot ln(Kd) versus (1/T):
ln (KNe) = −Ea/RT + lnA
Kd = thermodynamic equilibrium constant (qe/Ce); R = universal constant of 8.314 J/mol.K; T = temperature in Kelvin; Ea = activation energy (J/mol); and A = pre-exponential factor.
4. Conclusions
In an attempt to convert wastes to a value-added product, this study involved utilizing gas-to-liquid (GTL)-derived biosolids, a major waste produced from the wastewater treatment process from the Qatar-Shell GTL plant. The biosolid waste was activated directly using potassium carbonate in 1:3 (sample:activating agent) ratio (KBS), and the surface area increased from 0.010 to 156 m2/g and pore volume from 0.021 to 0.235 cm3/g, which was confirmed by observing SEM scanning images. Further analysis using EDS and XPS showed an increase in metals after activation, especially iron. Deconvolution of the XPS results shows the increased presence of -CO3/O-C=O after activation of the sample. XRD analysis revealed the presence of magnetite and potassium iron oxide upon activation, and tesla meter measurement confirms magnetic properties in the AC.
The methylene blue adsorption is rapid and reaches equilibrium after 9 h, showing a maximum adsorption capacity of 59.27 mg/g, comparable to other waste adsorbents reported in the literature. Modelling using seven different isotherm and kinetic models revealed the best fit to be the Langmuir and PFO, respectively. Adsorption at different temperatures shows that the increase in temperature is favorable. It was also revealed that the process favored physisorption as it was quick, spontaneous, and exothermic. Future work will include exploring other activation methods and targeting pollutants that utilize the AC’s magnetic properties for water treatment applications.
Supplementary Materials
The following supporting information can be downloaded at https://www.mdpi.com/article/10.3390/molecules28031511/s1, Table S1: Activated carbon properties, Table S2: Isotherm model assumptions and equations, Table S3: Kinetic model assumptions and equations, Table S4: Thermodynamic calculation for MB adsorption by KBS, Figure S1: Biosolids (a) before (BS) and (b) after activation (KBS), Figure S2: N2 adsorption of KBS using BET instrument, Figure S3: Effect of pH on methylene blue adsorption, Figure S4: Methylene blue calibration curve using UV-Vis Spectrophotometer, Figure S5: Methylene blue UV-Vis adsorption spectra. References [42,43,44,45,46,47,48,49,50,51,52,53,54,55] are cited in the supplementary materials.
Author Contributions
Conceptualization, methodology, formal analysis, writing, S.Z.; methodology, investigation, visualization, S.P.; investigation, formal analysis, Y.Z.; investigation, formal analysis, A.R.S.; supervision, writing—review and editing, G.M. All authors have read and agreed to the published version of the manuscript.
Funding
This research received no external funding.
Institutional Review Board Statement
Not applicable.
Informed Consent Statement
Not applicable.
Data Availability Statement
Research data not available in the manuscript can be obtained from the corresponding author through email.
Acknowledgments
The authors would like to acknowledge the financial support for the project provided by the Qatar National Research Fund and Hamad Bin Khalifa University. A special appreciation is expressed to the Qatar Shell Research and Technology Center, Qatar, for the collaboration and for providing the biosolid samples. Additional thanks to Qatar Environment and Energy Research and Texas A&M University at Qatar for supporting the characterization of the samples in this research. Any opinions, findings, and conclusions or recommendations expressed in this material are those of the authors and do not necessarily reflect the views of any of the parties. Finally, the authors would also like to express thanks to the Qatar National Library for access to articles.
Conflicts of Interest
The authors have no competing interest to declare that are relevant to the content of this article.
Abbreviations
| Activated carbon | AC |
| American Society for Testing and Materials | ASTM |
| Brunauer–Emmett–Teller | BET |
| Biosolid | BS |
| Diffusion-chemisorption | DF |
| Gas-to-liquid | GTL |
| Langmuir–Freundlich | LF |
| Methylene blue | MB |
| Potassium-carbonate-activated biosolid | KBS |
| Pseudo-first order | PFO |
| Pseudo-second order | PSO |
| Scanning electron microscopy (SEM) and energy dispersive X-ray spectroscopy (EDS) | SEM-EDS |
| Sum of squared error | SSE |
| X-ray powder diffraction | XRD |
| X-ray photoelectron spectroscopy | XPS |
References
- Qadir, M.; Drechsel, P.; Jiménez Cisneros, B.; Kim, Y.; Pramanik, A.; Mehta, P.; Olaniyan, O. Global and Regional Potential of Wastewater as a Water, Nutrient and Energy Source. Nat. Resour. Forum 2020, 44, 40–51. [Google Scholar] [CrossRef]
- Forgacs, E.; Cserháti, T.; Oros, G. Removal of Synthetic Dyes from Wastewaters: A Review. Environ. Int. 2004, 30, 953–971. [Google Scholar] [CrossRef] [PubMed]
- Zhou, Y.; Zhang, L.; Cheng, Z. Removal of Organic Pollutants from Aqueous Solution Using Agricultural Wastes: A Review. J. Mol. Liq. 2015, 212, 739–762. [Google Scholar] [CrossRef]
- Yusaf, A.; Usman, M.; Siddiq, M.; Bakhtiar, M.; Mansha, A.; Shaukat, S.; Rehman, H.F. Mixed Micellar Solubilization of Naphthol Green B Followed by Its Removal from Synthetic Effluent by Micellar-Enhanced Ultrafiltration under Optimized Conditions. Molecules 2022, 27, 6436. [Google Scholar] [CrossRef]
- Amjad, S.; Shaukat, S.; Rahman, H.M.A.; Usman, M.; Farooqi, Z.H.; Nazar, M.F. Application of Anionic-Nonionic Mixed Micellar System for Solubilization of Methylene Blue Dye. J. Mol. Liq. 2023, 369, 120958. [Google Scholar] [CrossRef]
- Da̧browski, A. Adsorption—From Theory to Practice. Adv. Colloid Interface Sci. 2001, 93, 135–224. [Google Scholar] [CrossRef]
- Anastopoulos, I.; Kyzas, G.Z. Agricultural Peels for Dye Adsorption: A Review of Recent Literature. J. Mol. Liq. 2014, 200, 381–389. [Google Scholar] [CrossRef]
- Mariyam, S.; Cochrane, L.; Zuhara, S.; McKay, G. Waste Management in Qatar: A Systematic Literature Review and Recommendations for System Strengthening. Sustainability 2022, 14, 8991. [Google Scholar] [CrossRef]
- Sindhu, R.; Gnansounou, E.; Rebello, S.; Binod, P.; Varjani, S.; Thakur, I.S.; Nair, R.B.; Pandey, A. Conversion of Food and Kitchen Waste to Value-Added Products. J. Environ. Manag. 2019, 241, 619–630. [Google Scholar] [CrossRef]
- Jjagwe, J.; Olupot, P.W.; Menya, E.; Kalibbala, H.M. Synthesis and Application of Granular Activated Carbon from Biomass Waste Materials for Water Treatment: A Review. J. Bioresour. Bioprod. 2021, 6, 292–322. [Google Scholar] [CrossRef]
- Obey, G.; Adelaide, M.; Ramaraj, R. Biochar Derived from Non-Customized Matamba Fruit Shell as an Adsorbent for Wastewater Treatment. J. Bioresour. Bioprod. 2022, 7, 109–115. [Google Scholar] [CrossRef]
- Elkhalifa, S.; Mackey, H.R.; Al-Ansari, T.; McKay, G. Pyrolysis of Biosolids to Produce Biochars: A Review. Sustainability 2022, 14, 9626. [Google Scholar] [CrossRef]
- Zuhara, S.; Mackey, H.R.; Al-Ansari, T.; McKay, G. A Review of Prospects and Current Scenarios of Biomass Co-Pyrolysis for Water Treatment. Biomass Convers. Biorefinery 2022. 1, 30. [CrossRef]
- Zhu, S.; Fang, S.; Huo, M.; Yu, Y.; Chen, Y.; Yang, X.; Geng, Z.; Wang, Y.; Bian, D.; Huo, H. A Novel Conversion of the Groundwater Treatment Sludge to Magnetic Particles for the Adsorption of Methylene Blue. J. Hazard. Mater. 2015, 292, 173–179. [Google Scholar] [CrossRef] [PubMed]
- Liu, L.; Zhao, J.; Liu, X.; Bai, S.; Lin, H.; Wang, D. Reduction and Removal of As(Ⅴ) in Aqueous Solution by Biochar Derived from Nano Zero-Valent-Iron (NZVI) and Sewage Sludge. Chemosphere 2021, 277, 130273. [Google Scholar] [CrossRef]
- Liu, L.; Liu, X.; Wang, D.; Lin, H.; Huang, L. Removal and Reduction of Cr(Ⅵ) in Simulated Wastewater Using Magnetic Biochar Prepared by Co-Pyrolysis of Nano-Zero-Valent Iron and Sewage Sludge. J. Clean. Prod. 2020, 257, 120562. [Google Scholar] [CrossRef]
- Fadillah, G.; Yudha, S.P.; Sagadevan, S.; Fatimah, I.; Muraza, O. Magnetic Iron Oxide/Clay Nanocomposites for Adsorption and Catalytic Oxidation in Water Treatment Applications. Open Chem. 2020, 18, 1148–1166. [Google Scholar] [CrossRef]
- Kogbara, R.B.; Yiming, W.; Iyengar, S.R.; Onwusogh, U.C.; Youssef, K.; Al-Ansary, M.; Sunifar, P.A.; Arora, D.; Al-Sharshani, A.; Abdalla, O.A.E.; et al. Recycling Industrial Biosludge for Buffel Grass Production in Qatar: Impact on Soil, Leachate and Plant Characteristics. Chemosphere 2020, 247, 125886. [Google Scholar] [CrossRef]
- Xi, J.; Zhang, R.; Ye, L.; Du, X.; Lu, X. Multi-Step Preparation of Fe and Si Modified Biochar Derived from Waterworks Sludge towards Methylene Blue Adsorption. J. Environ. Manag. 2022, 304, 114297. [Google Scholar] [CrossRef]
- Bergna, D.; Varila, T.; Romar, H.; Lassi, U. Produced in One-Stage and Two-Stage Processes. C 2018, 4, 41. [Google Scholar] [CrossRef]
- Nicomel, N.R.; Li, L.Y.; Du, G. Biosolids - Based Activated Carbon for Enhanced Copper Removal from Citric - Acid—Rich Aqueous Media. Environ. Sci. Pollut. Res. 2022, 74742–74755. [Google Scholar] [CrossRef]
- Nzihou, A.; Stanmore, B.; Sharrock, P.; Nzihou, A.; Stanmore, B.; Sharrock, P. A Review of Catalysts for the Gasification of Biomass Char, with Some Reference to Coal. Energy 2019, 58, 305–317. [Google Scholar]
- Almanassra, I.W.; Chatla, A.; Zakaria, Y.; Kochkodan, V.; Shanableh, A.; Laoui, T.; Atieh, M.A. Palm Leaves Based Biochar: Advanced Material Characterization and Heavy Metal Adsorption Study. Biomass Convers. Biorefinery 2022. [CrossRef]
- Al-Gaashani, R.; Zakaria, Y.; Lee, O.S.; Ponraj, J.; Kochkodan, V.; Atieh, M.A. Effects of Preparation Temperature on Production of Graphene Oxide by Novel Chemical Processing. Ceram. Int. 2021, 47, 10113–10122. [Google Scholar] [CrossRef]
- Al-Gaashani, R.; Najjar, A.; Zakaria, Y.; Mansour, S.; Atieh, M.A. XPS and Structural Studies of High Quality Graphene Oxide and Reduced Graphene Oxide Prepared by Different Chemical Oxidation Methods. Ceram. Int. 2019, 45, 14439–14448. [Google Scholar] [CrossRef]
- Song, X.; Zhang, Y.; Cao, N.; Sun, D.; Zhang, Z.; Wang, Y.; Wen, Y.; Yang, Y.; Lyu, T. Sustainable Chromium (VI) Removal from Contaminated Groundwater Using Nano-Magnetite-Modified Biochar via Rapid Microwave Synthesis. Molecules 2021, 26, 103. [Google Scholar] [CrossRef]
- Abbas, A.F.; Ahmed, M.J. Mesoporous Activated Carbon from Date Stones (Phoenix Dactylifera L.) by One-Step Microwave Assisted K2CO3 Pyrolysis. J. Water Process Eng. 2016, 9, 201–207. [Google Scholar] [CrossRef]
- Hoslett, J.; Ghazal, H.; Mohamad, N.; Jouhara, H. Removal of Methylene Blue from Aqueous Solutions by Biochar Prepared from the Pyrolysis of Mixed Municipal Discarded Material. Sci. Total Environ. 2020, 714, 136832. [Google Scholar] [CrossRef] [PubMed]
- Ramutshatsha-Makhwedzha, D.; Mavhungu, A.; Moropeng, M.L.; Mbaya, R. Activated Carbon Derived from Waste Orange and Lemon Peels for the Adsorption of Methyl Orange and Methylene Blue Dyes from Wastewater. Heliyon 2022, 8, e09930. [Google Scholar] [CrossRef]
- Baytar, O.; Ceyhan, A.A.; Şahin, Ö. Production of Activated Carbon from Elaeagnus Angustifolia Seeds Using H3PO4 Activator and Methylene Blue and Malachite Green Adsorption. Int. J. Phytoremediat. 2021, 23, 693–703. [Google Scholar] [CrossRef]
- Baloo, L.; Isa, M.H.; Sapari, N.B.; Jagaba, A.H.; Wei, L.J.; Yavari, S.; Razali, R.; Vasu, R. Adsorptive Removal of Methylene Blue and Acid Orange 10 Dyes from Aqueous Solutions Using Oil Palm Wastes-Derived Activated Carbons. Alex. Eng. J. 2021, 60, 5611–5629. [Google Scholar] [CrossRef]
- Rashid, R.A.; Jawad, A.H.; Ishak, M.A.B.M.; Kasim, N.N. FeCl3-Activated Carbon Developed from Coconut Leaves: Characterization and Application for Methylene Blue Removal. Sains Malays. 2018, 47, 603–610. [Google Scholar] [CrossRef]
- Bello, M.O.; Abdus-Salam, N.; Adekola, F.A.; Pal, U. Isotherm and Kinetic Studies of Adsorption of Methylene Blue Using Activated Carbon from Ackee Apple Pods. Chem. Data Collect. 2021, 31, 100607. [Google Scholar] [CrossRef]
- Edet, U.A.; Ifelebuegu, A.O. Kinetics, Isotherms, and Thermodynamic Modeling of the Adsorption of Phosphates from Model Wastewater Using Recycled Brick Waste. Processes 2020, 8, 665. [Google Scholar] [CrossRef]
- Fan, S.; Wang, Y.; Wang, Z.; Tang, J.; Tang, J.; Li, X. Removal of Methylene Blue from Aqueous Solution by Sewage Sludge-Derived Biochar: Adsorption Kinetics, Equilibrium, Thermodynamics and Mechanism. J. Environ. Chem. Eng. 2017, 5, 601–611. [Google Scholar] [CrossRef]
- Pandey, D.; Daverey, A.; Dutta, K.; Yata, V.K.; Arunachalam, K. Valorization of Waste Pine Needle Biomass into Biosorbents for the Removal of Methylene Blue Dye from Water: Kinetics, Equilibrium and Thermodynamics Study. Environ. Technol. Innov. 2022, 25, 102200. [Google Scholar] [CrossRef]
- Chen, F.X.; Zhou, C.R.; Li, G.P.; Peng, F. fei Thermodynamics and Kinetics of Glyphosate Adsorption on Resin D301. Arab. J. Chem. 2016, 9, S1665–S1669. [Google Scholar] [CrossRef]
- Amin, M.T.; Alazba, A.A.; Shafiq, M. Comparative Study for Adsorption of Methylene Blue Dye on Biochar Derived from Orange Peel and Banana Biomass in Aqueous Solutions. Environ. Monit. Assess. 2019, 191, 735. [Google Scholar] [CrossRef]
- Khan, I.; Saeed, K.; Zekker, I.; Zhang, B.; Hendi, A.H.; Ahmad, A.; Ahmad, S.; Zada, N.; Ahmad, H.; Shah, L.A.; et al. Review on Methylene Blue: Its Properties, Uses, Toxicity and Photodegradation. Water 2022, 14, 242. [Google Scholar] [CrossRef]
- Kazak, O. Fabrication of in Situ Magnetic Activated Carbon by Co-Pyrolysis of Sucrose with Waste Red Mud for Removal of Cr(VI) from Waters. Environ. Technol. Innov. 2021, 24, 101856. [Google Scholar] [CrossRef]
- Zhang, H.; Xiao, R.; Li, R.; Ali, A.; Chen, A.; Zhang, Z. Enhanced Aqueous Cr(VI) Removal Using Chitosan-Modified Magnetic Biochars Derived from Bamboo Residues. Chemosphere 2020, 261, 127694. [Google Scholar] [CrossRef] [PubMed]
- Langmuir, I. The Adsorption of Gases on Plane Surface of Glass, Mica and Olatinum. J. Am. Chem. Soc. 1918, 40, 1361–1403. [Google Scholar]
- Freundlich, H. Colloid and Capillary Chemistry; Mathuen and Co: London, UK, 1926; pp. 6–8. [Google Scholar]
- Redlich, O.J.D.L.; Peterson, D.L. A Useful Adsorption Isotherm. J. Phys. Chem. 1959, 63, 1024. [Google Scholar]
- Sips, R. On the Structure of a Catalyst Surface. J. Chem. Phys. 1948, 16, 490–495. [Google Scholar]
- Toth, J. Groundwater discharge: A common generator of diverse geologic and morphologic phenomena. Int. Assoc. Sci. Hydrol. Bull. 1971, 16, 7–24. [Google Scholar] [CrossRef]
- Temkin, M.I. Kinetics of Heterogeneous Catalysis. J. Phys. Chem. 1940, 14, 1153–1158. [Google Scholar]
- Dubinin, M.M. Surface and Nanomolecular Catalysis. Zhur Phys. Chem. 1960, 34, 959. [Google Scholar]
- Lagergren, S. Zur Theorie Der Sogenannten Adsorption Gelöster Stoffe. K. Sven. Vetenskapsakademiens 1898, 24, 1–39. [Google Scholar]
- Ho, Y.S.; McKay, G. Pseudo-Second Order Model for Sorption Processes. Process Biochem. 1999, 34, 451–465. [Google Scholar]
- Chien, S.H.; Clayton, W.R. Application of Elovich Equation to the Kinetics of Phosphate Release and Sorption in Soils. Soil Sci. Soc. Am. J. 1980, 44, 265–268. [Google Scholar]
- Lopes, E.C.; dos Anjos, F.S.; Vieira, E.F.; Cestari, A.R. An Alternative Avrami Equation to Evaluate Kinetic Parameters of the Interaction of Hg (II) with Thin Chitosan Membranes. J. Colloid Interface Sci. 2003, 263, 542–547. [Google Scholar]
- Weber, W.J., Jr.; Morris, J.C. Kinetics of Adsorption on Carbon from Solution. J. Sanit. Eng. Div. 1963, 89, 31–59. [Google Scholar]
- Hameed, B.H.; El-Khaiary, M.I. Equilibrium, Kinetics and Mechanism of Malachite Green Adsorption on Activated Carbon Prepared from Bamboo by K2CO3 Activation and Subsequent Gasification with CO2. J. Hazard. Mater. 2008, 157, 344–351. [Google Scholar] [CrossRef]
- Aharoni, C.; Ungarish, M. Kinetics of Activated Chemisorption Part 2.—Theoretical Models. J. Chem. Soc. Faraday Trans. 1977, 73, 456–464. [Google Scholar]
Disclaimer/Publisher’s Note: The statements, opinions and data contained in all publications are solely those of the individual author(s) and contributor(s) and not of MDPI and/or the editor(s). MDPI and/or the editor(s) disclaim responsibility for any injury to people or property resulting from any ideas, methods, instructions or products referred to in the content. |
© 2023 by the authors. Licensee MDPI, Basel, Switzerland. This article is an open access article distributed under the terms and conditions of the Creative Commons Attribution (CC BY) license (https://creativecommons.org/licenses/by/4.0/).