
Effects of Substituents on the Photophysical/Photobiological Properties of Mono-Substituted Corroles

 ,
,  and
and 
Abstract
1. Introduction
2. Results
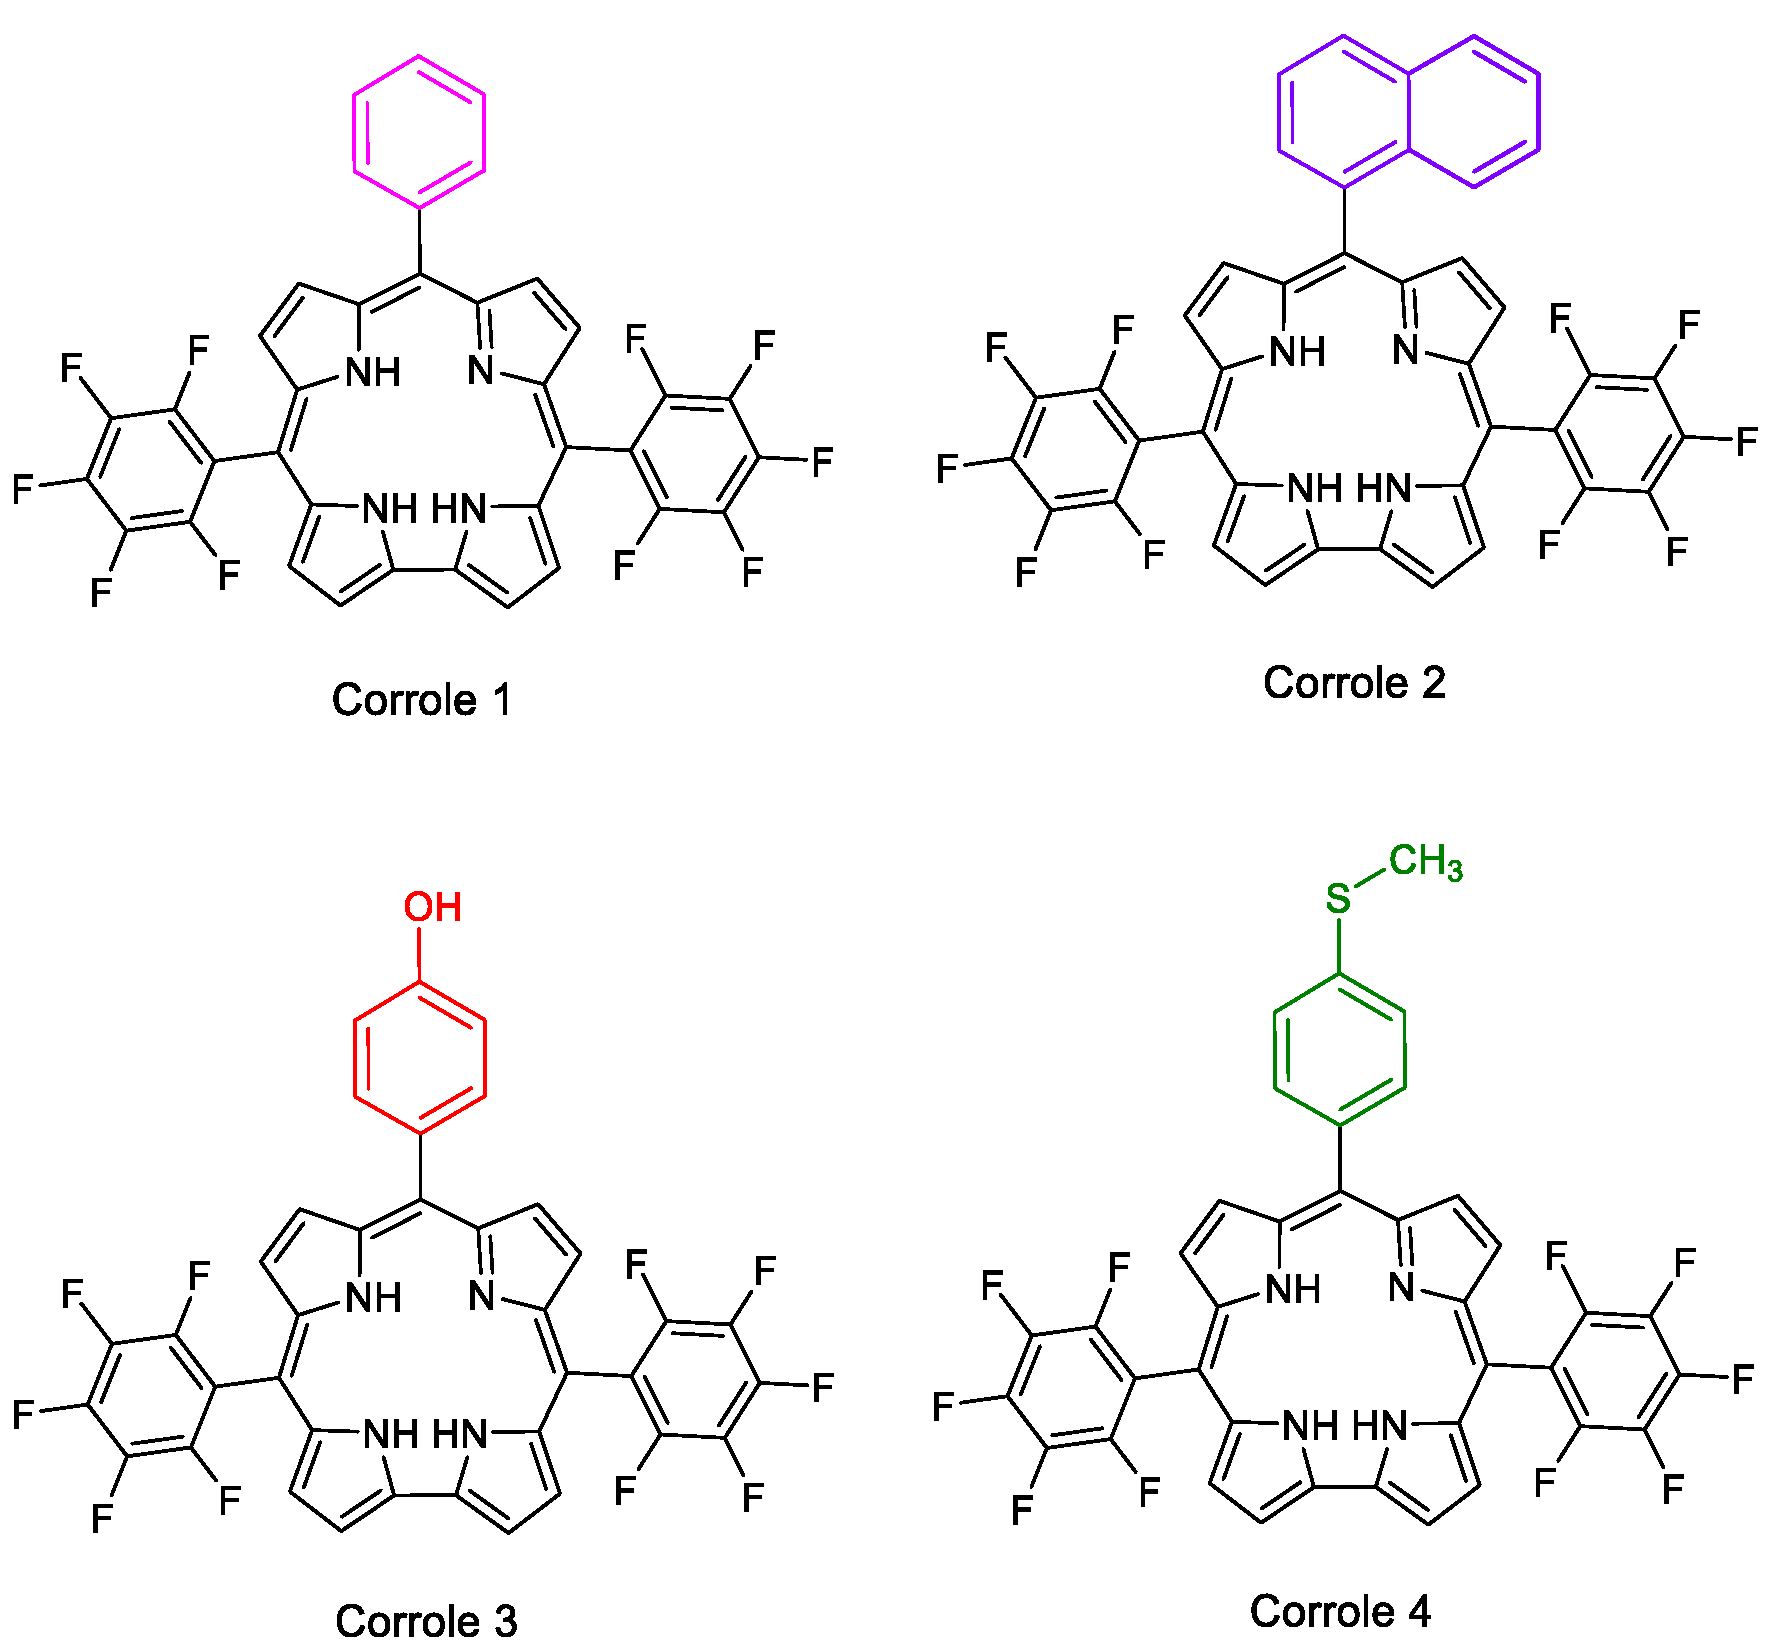
2.1. Corroles
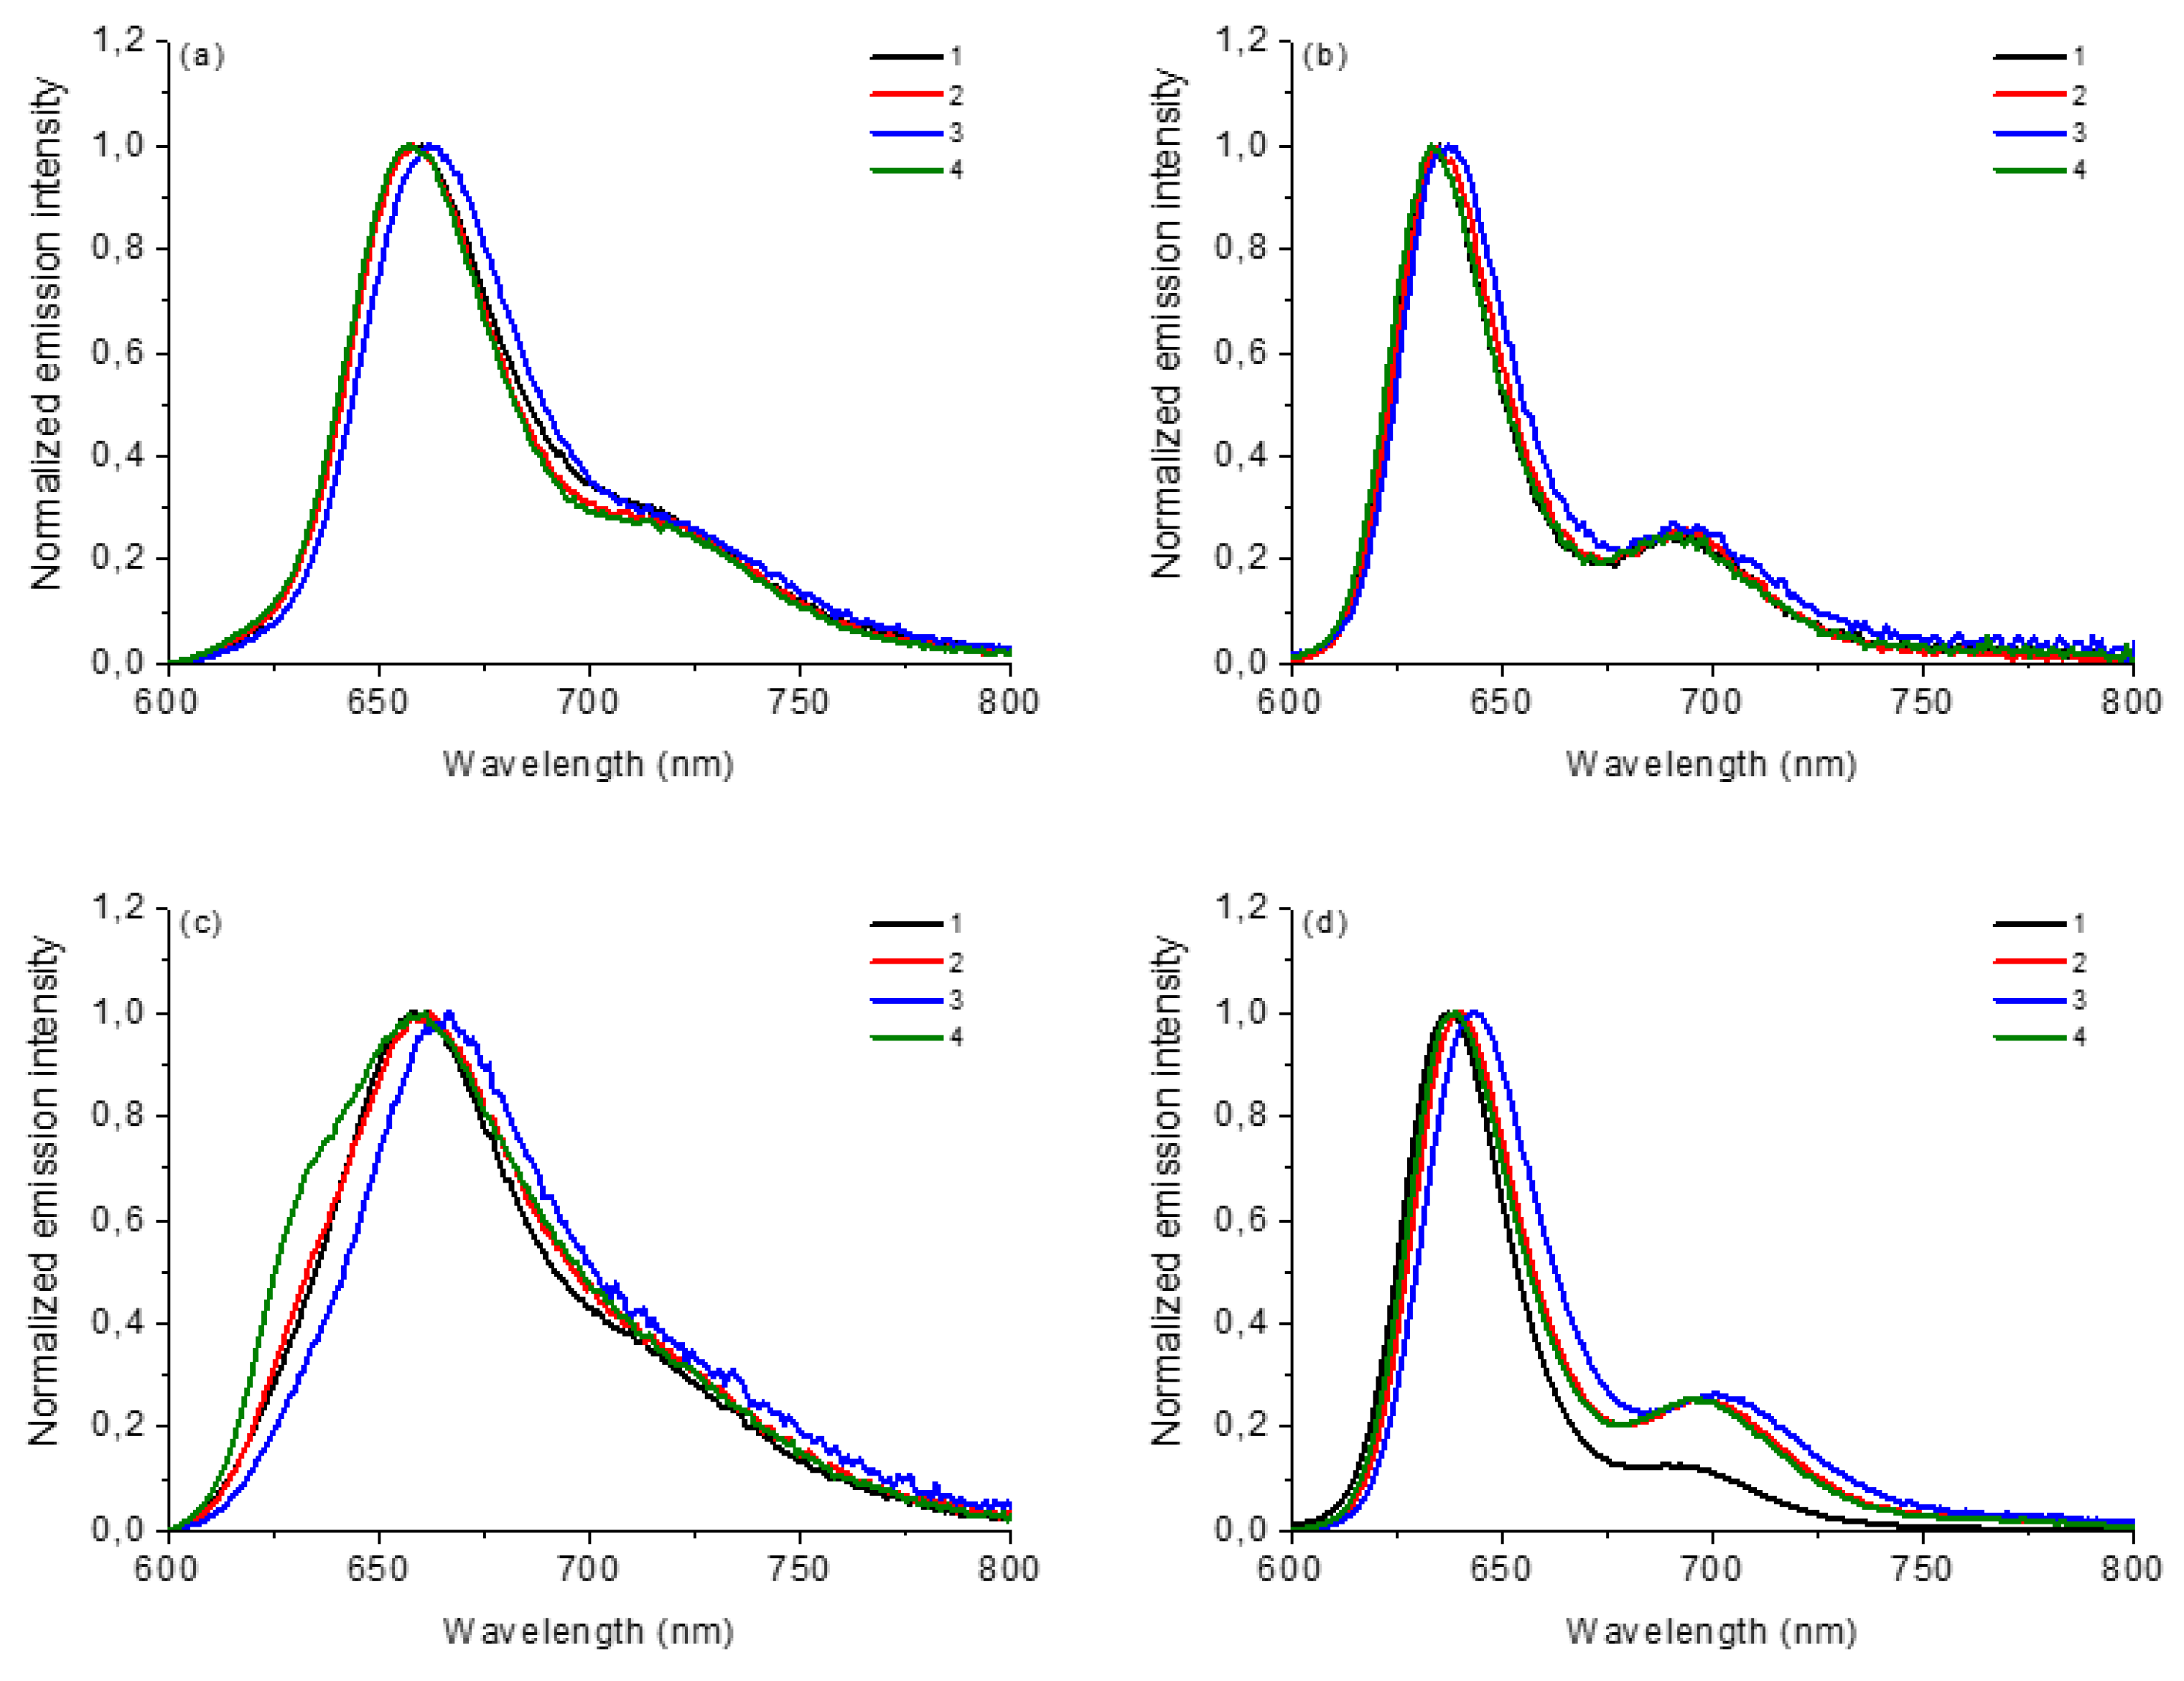
2.2. Photophysical Properties
2.3. TDDFT Analysis
2.4. Aggregation, Stability in Solution and Photostability Assays
2.5. Redox Analysis
2.6. Photobiological Assays
3. Biomolecule-Binding Assays
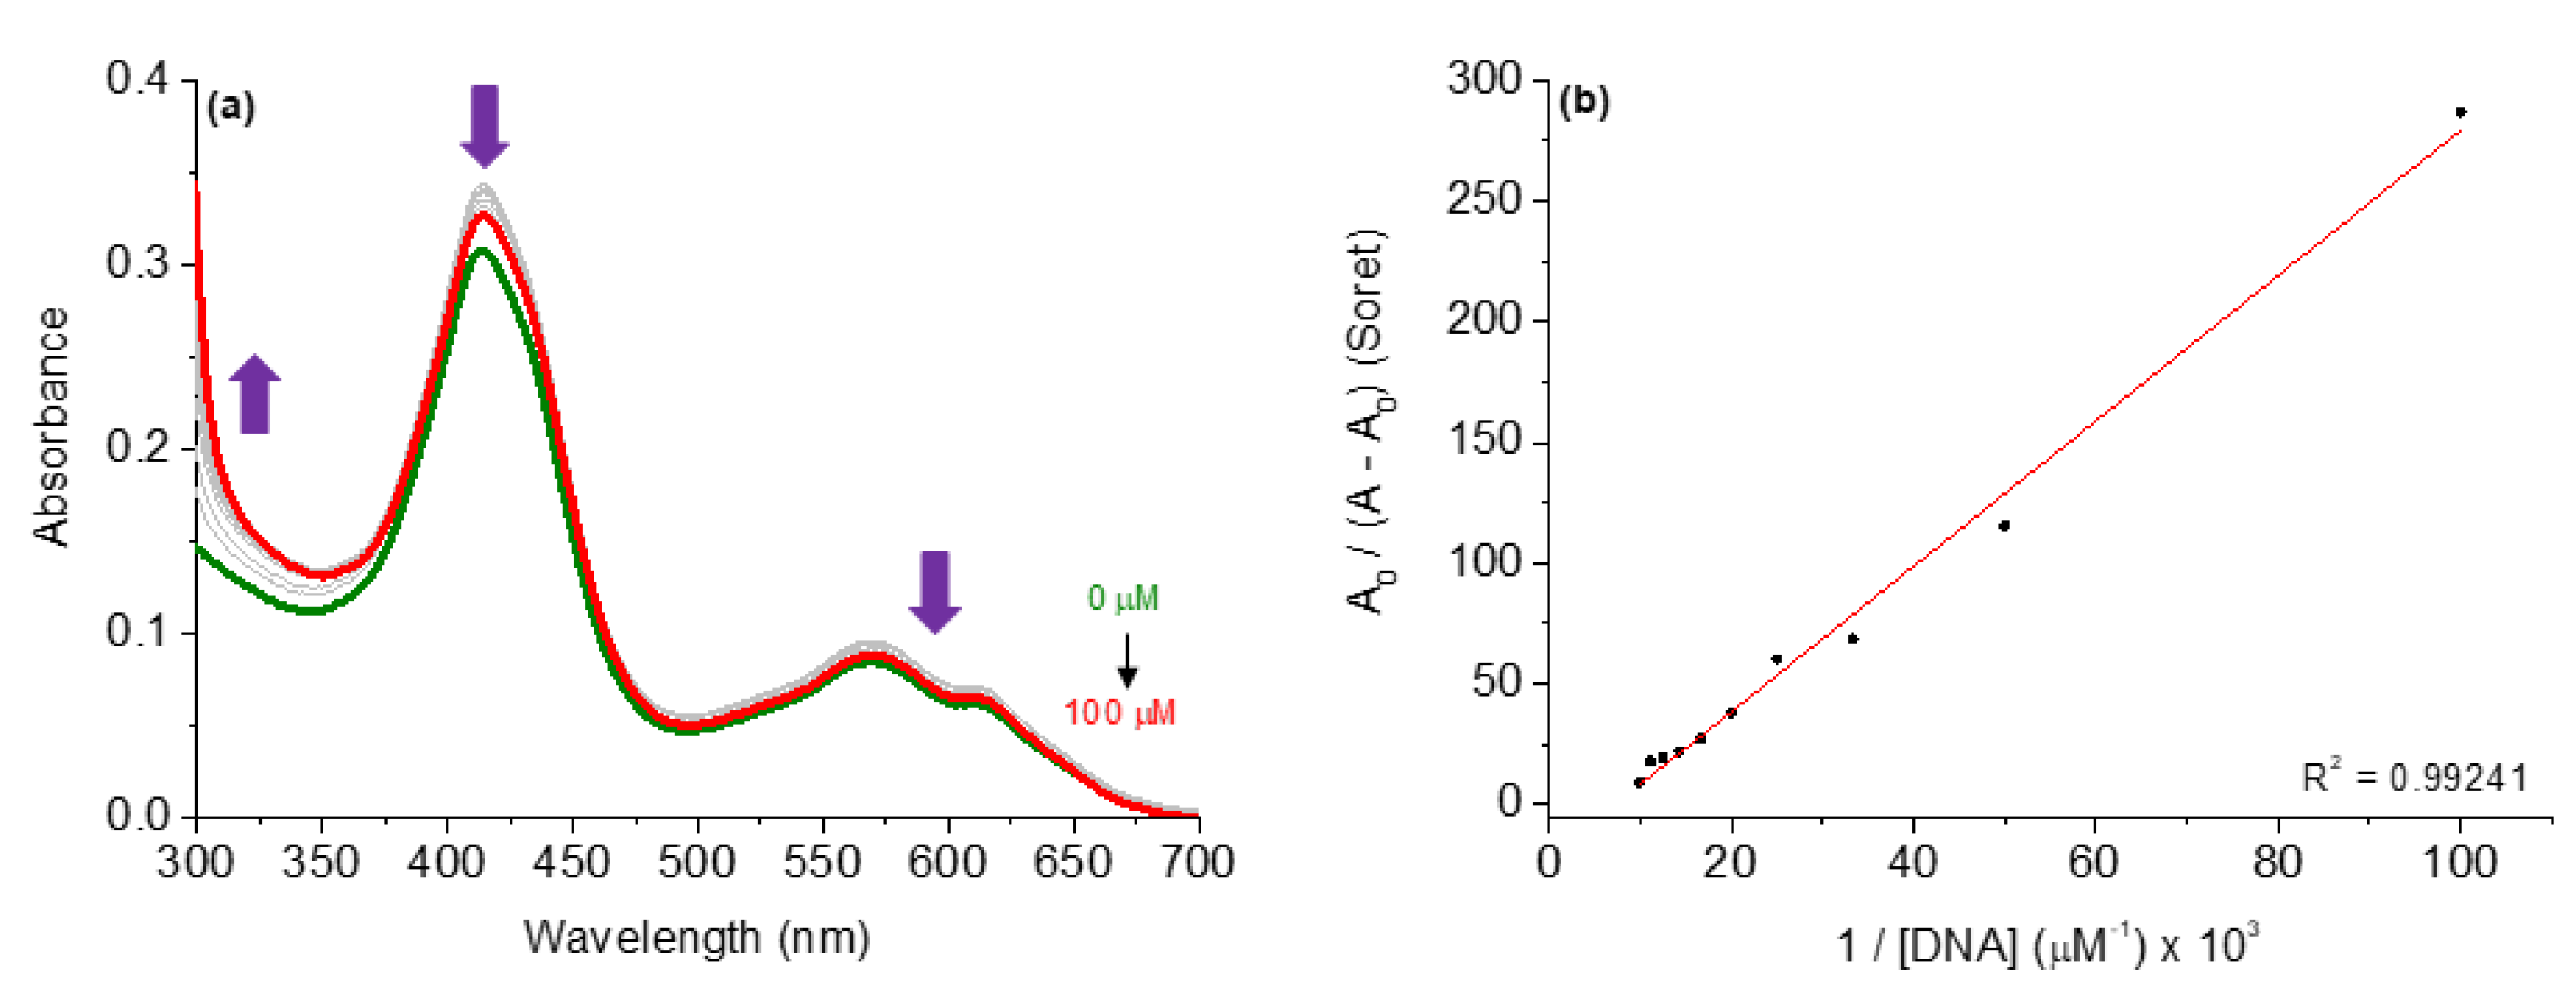
3.1. Binding Properties with DNA by UV-Vis Analysis
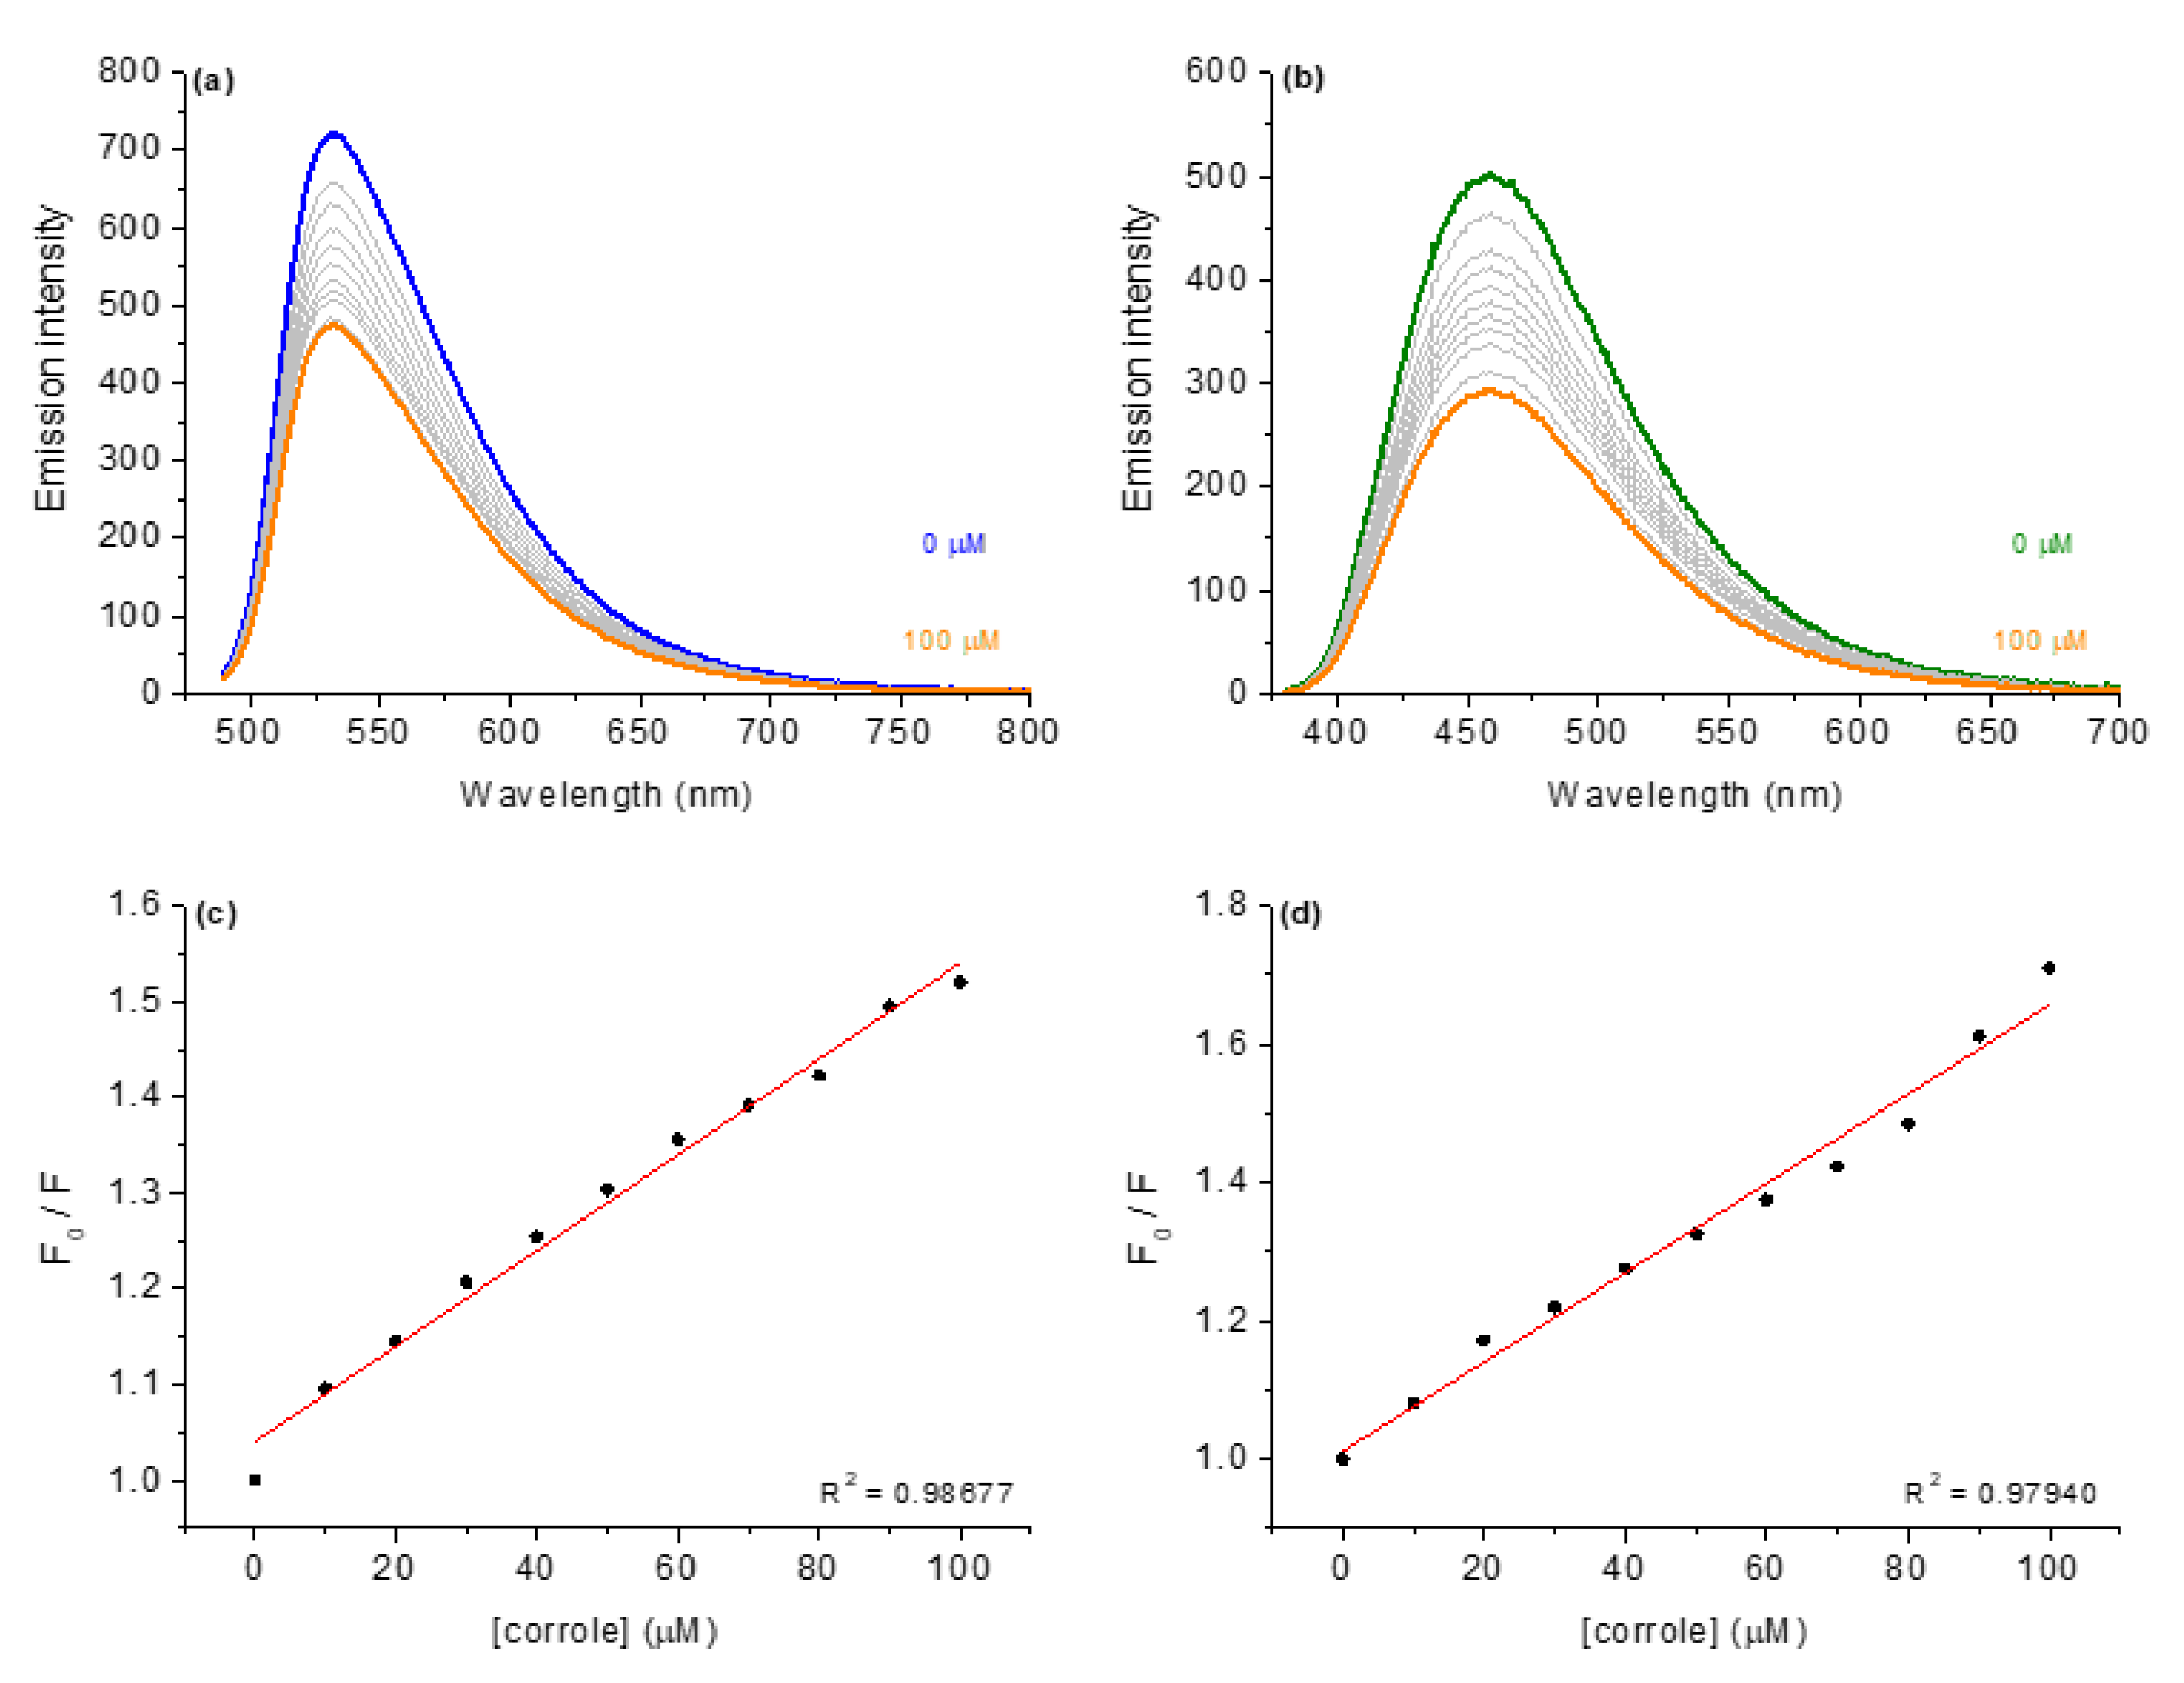
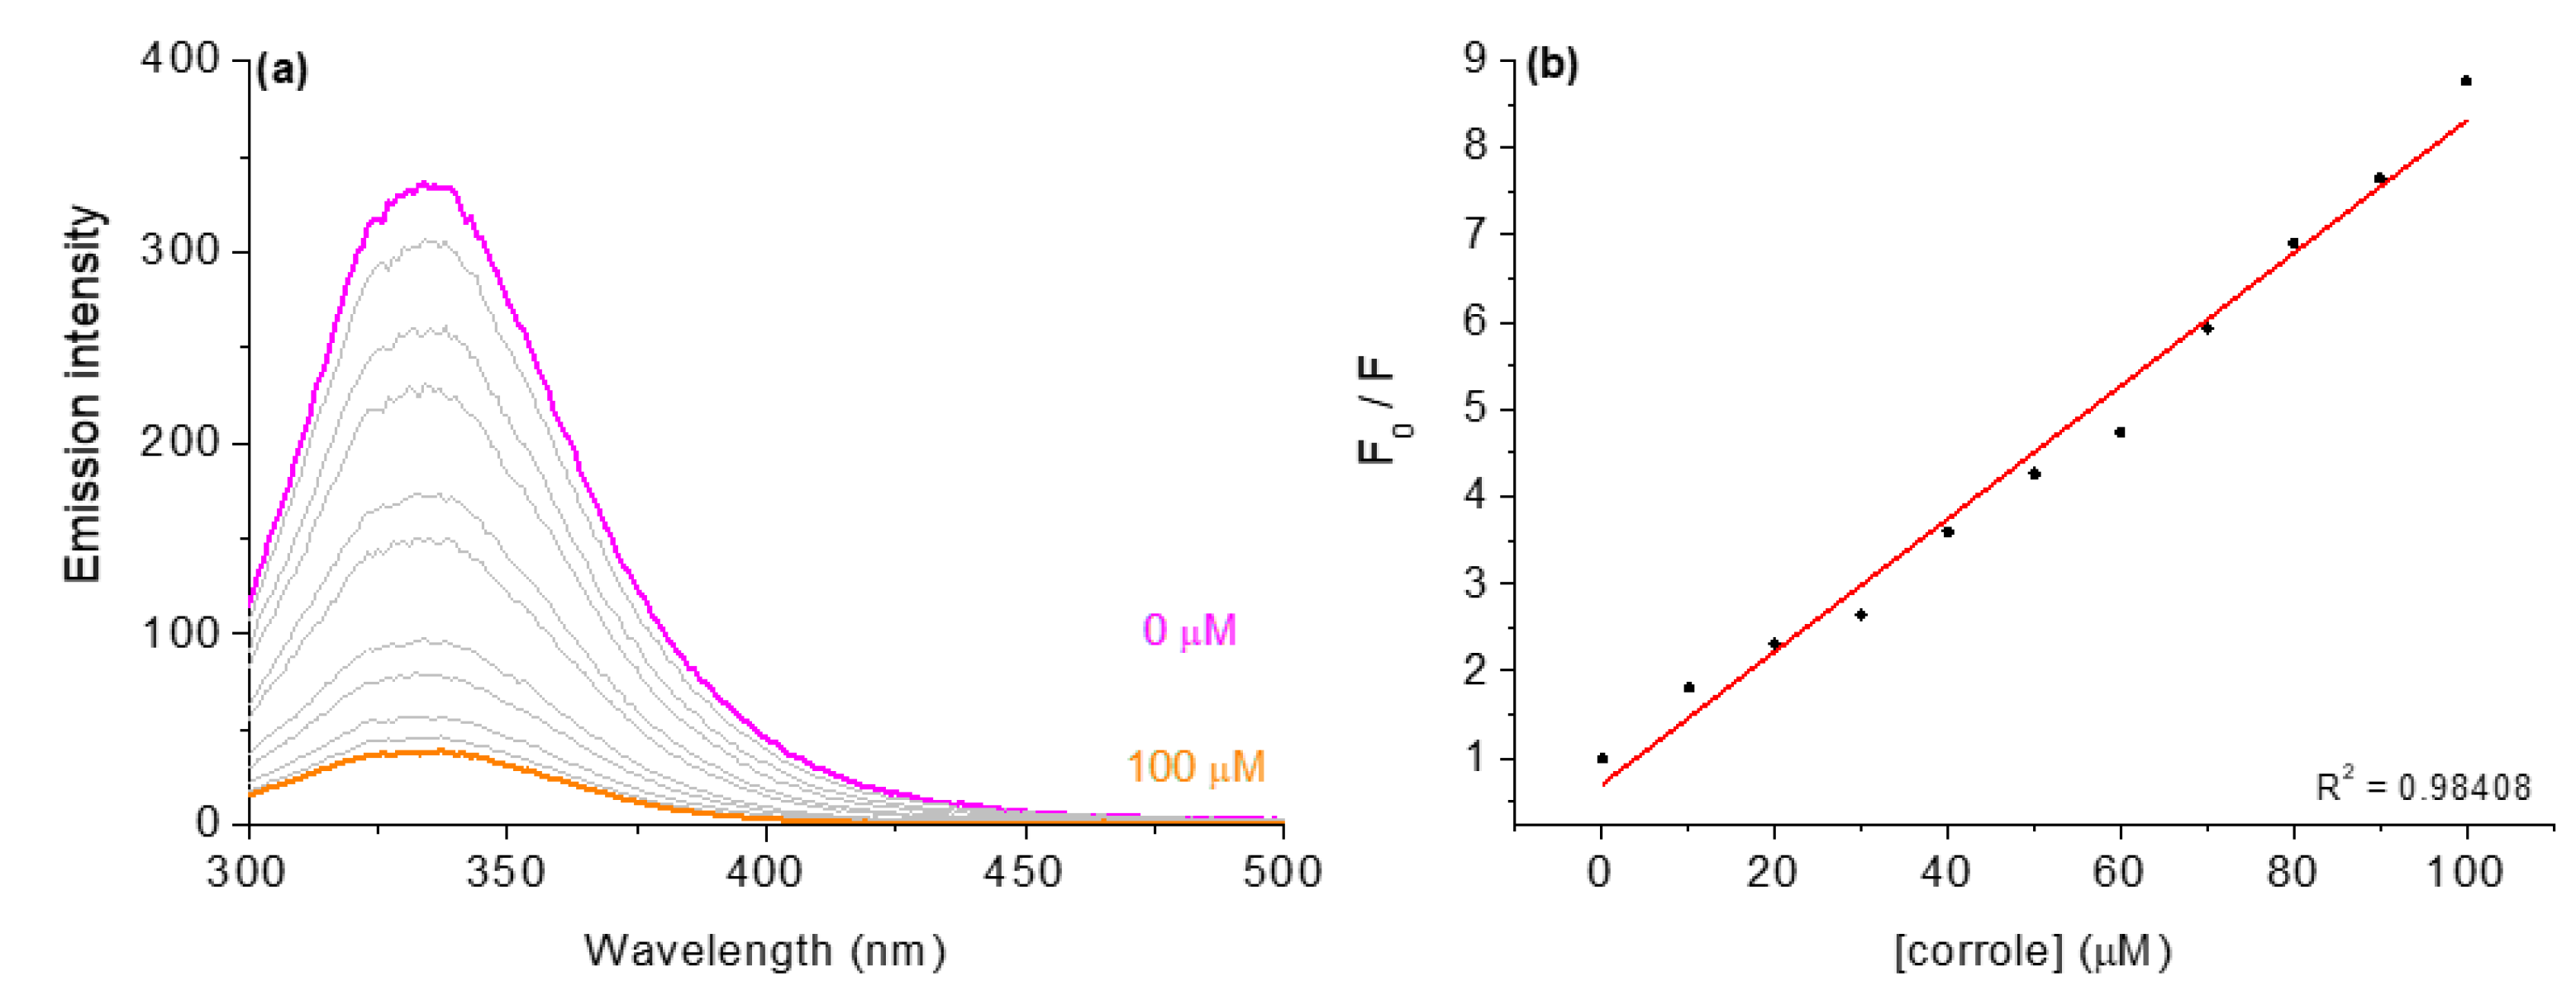
3.2. Competitive Binding Assays with DNA by Steady-State Fluorescence Emission
3.3. Viscosity Measurements with DNA
3.4. Binding Properties with HSA by UV-Vis and Emission Analysis
3.5. Synchronous Fluorescence (SF) Analysis
3.6. Time-Resolved Fluorescence with HSA and Corroles 1–4
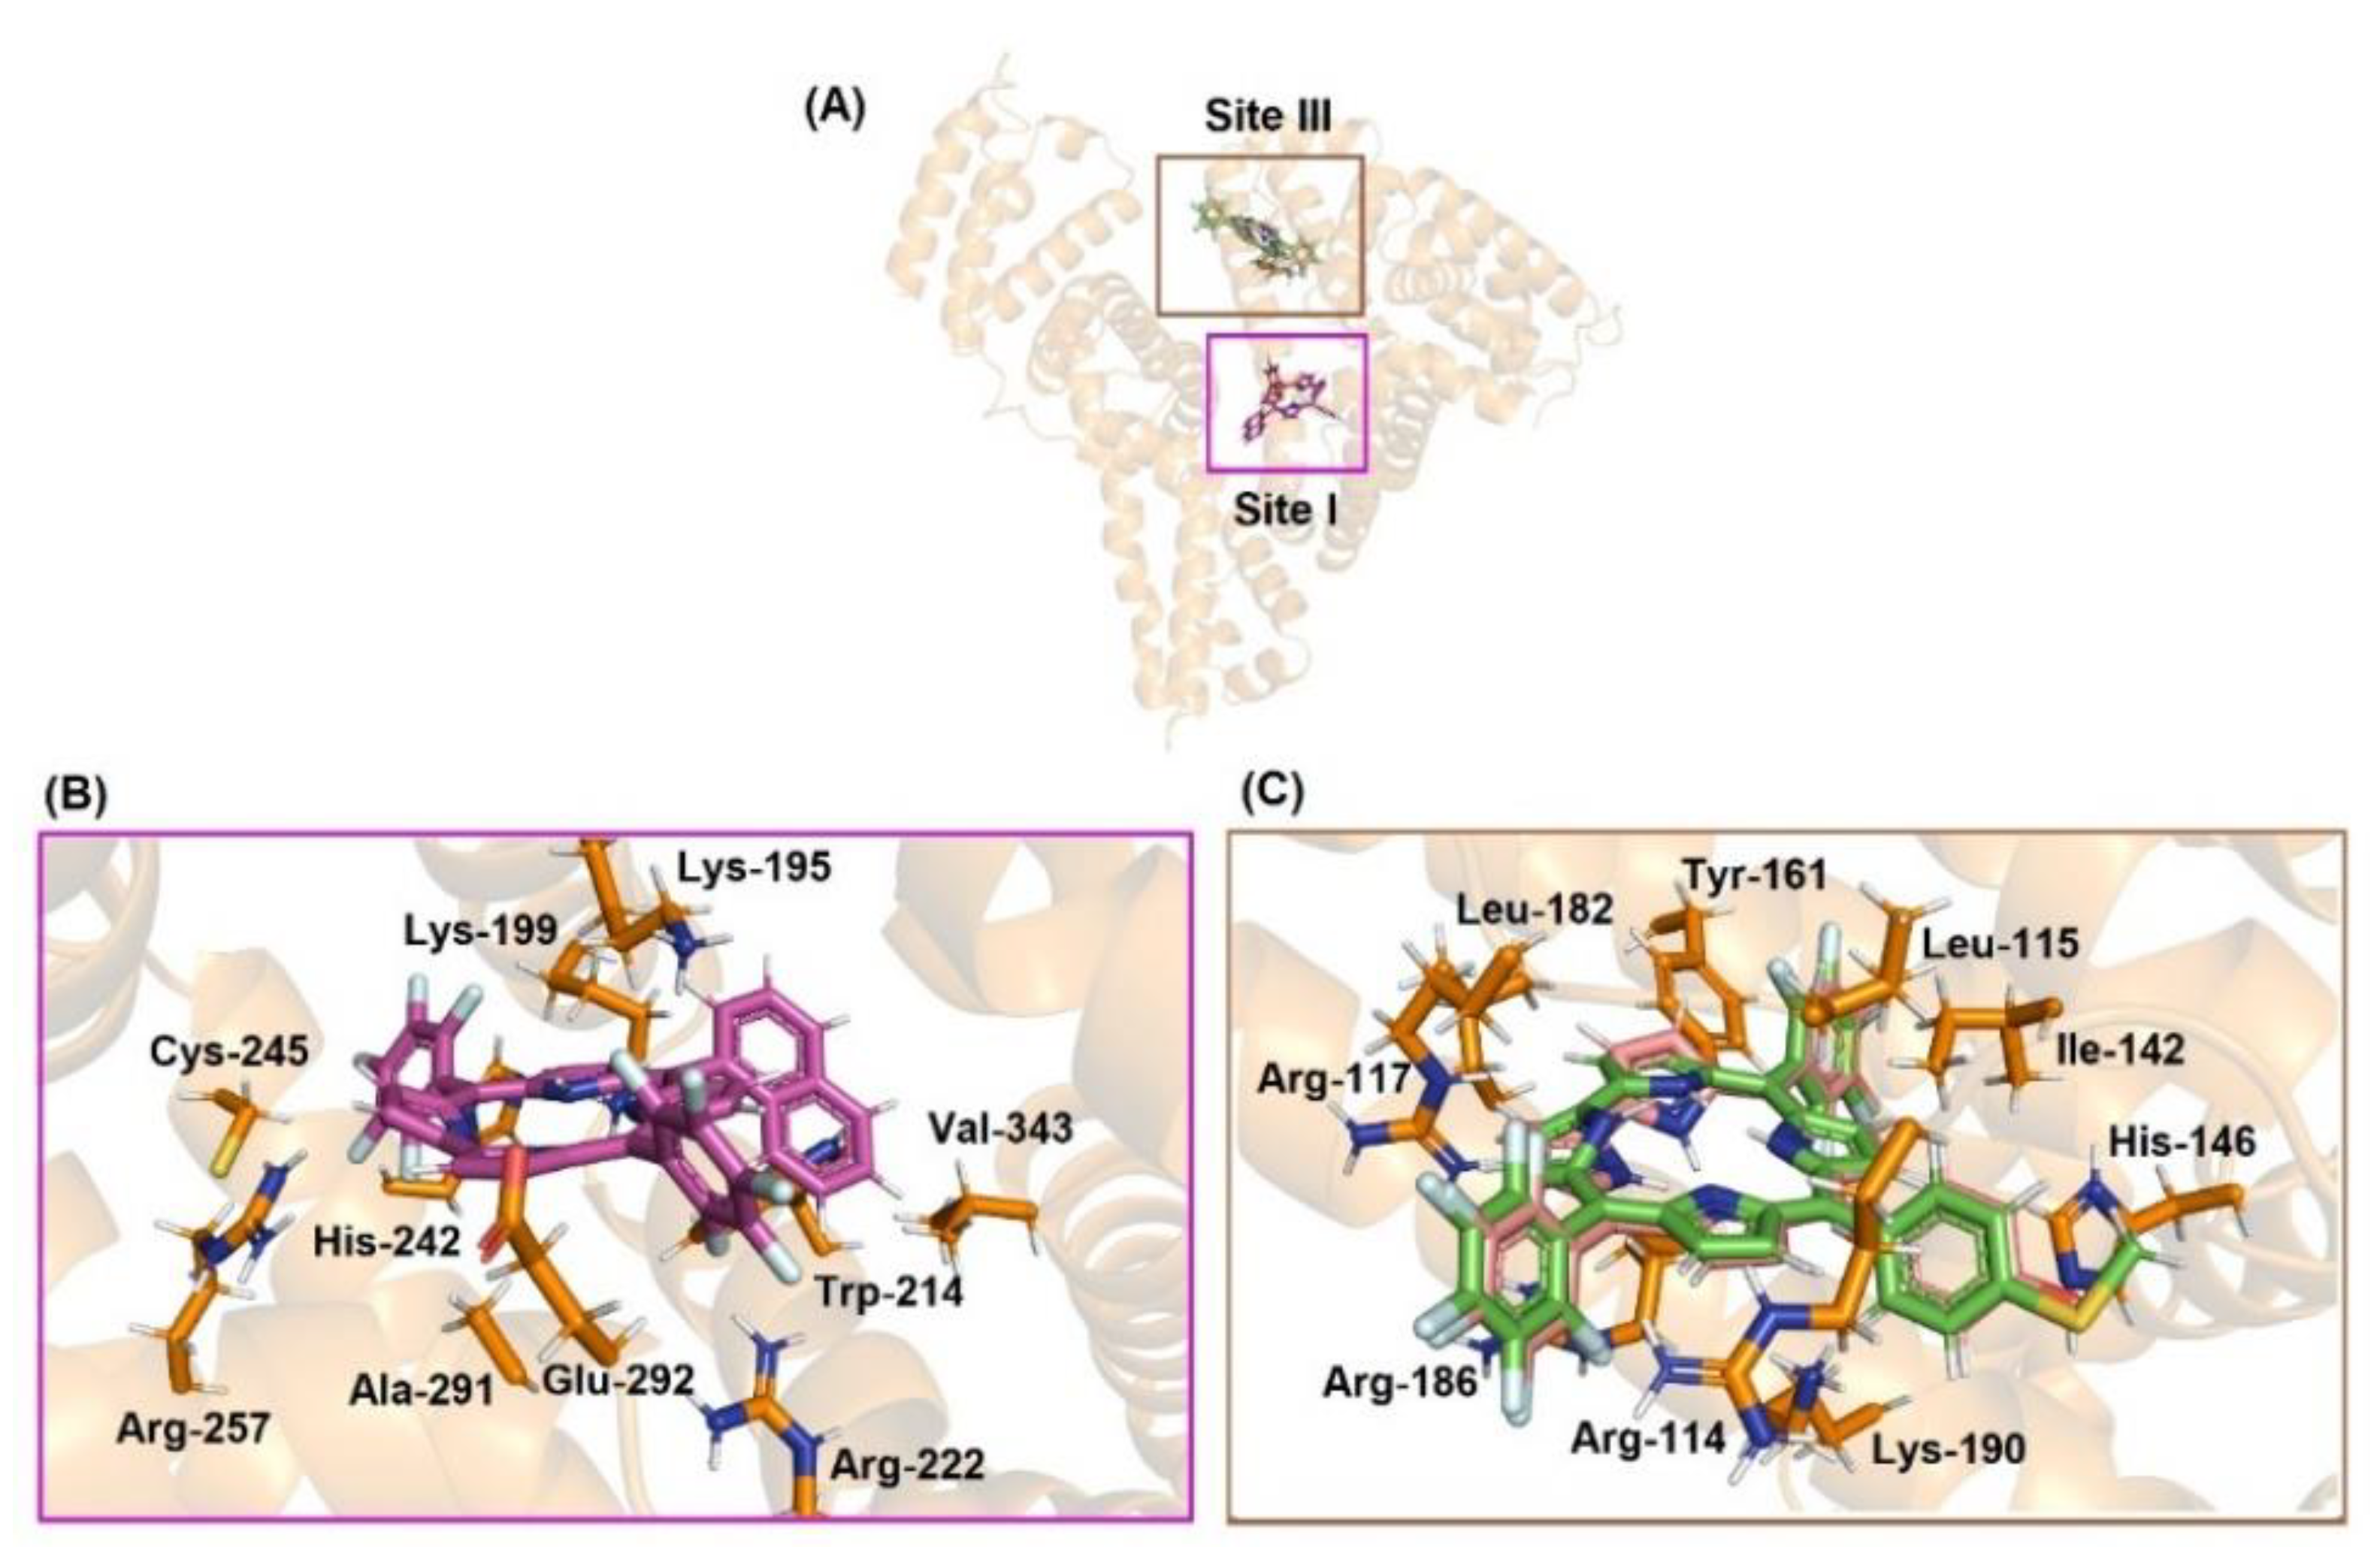
3.7. Molecular Docking Analysis with DNA and HSA
4. Materials and Methods
4.1. General
4.2. Photophysical Measurements
4.3. TDDFT Calculations
4.4. Electrochemical Analysis
4.5. Photobiological Parameters
4.6. Biomacromolecule Interactive Studies
4.7. Molecular Docking Procedure with DNA and HSA
5. Conclusions
Supplementary Materials
Author Contributions
Funding
Institutional Review Board Statement
Informed Consent Statement
Data Availability Statement
Acknowledgments
Conflicts of Interest
References
- Teo, R.D.; Hwang, J.Y.; Termini, J.; Gross, Z.; Gray, H.B. Fighting Cancer with Corroles. Chem. Rev. 2017, 117, 2711–2729. [Google Scholar] [CrossRef] [PubMed]
- Jiang, X.; Liu, R.-X.; Liu, H.-Y.; Chang, C.K. Corrole-based photodynamic antitumor therapy. J. Chin. Chem. Soc. 2019, 66, 1090–1099. [Google Scholar] [CrossRef]
- Lopes, S.M.M.; Pineiro, M.; Pinho e Melo, T.M.V.D. Corroles and Hexaphyrins: Synthesis and Application in Cancer Photodynamic Therapy. Molecules 2020, 25, 3450. [Google Scholar] [CrossRef]
- Pivetta, R.C.; Auras, B.L.; de Souza, B.; Neves, A.; Nunes, F.S.; Cocca, L.H.Z.; De Boni, L.; Iglesias, B.A. Synthesis, photophysical properties and spectroelectrochemical characterization of 10-(4-methyl-bipyridyl)-5,15-(pentafluorophenyl)corrole. J. Photochem. Photobiol. A Chem. 2017, 332, 306–315. [Google Scholar] [CrossRef]
- Acunha, T.V.; Victória, H.F.V.; Krambrock, K.; Marques, A.C.; Costa, L.A.S.; Iglesias, B.A. Photophysical and electrochemical properties of two trans-A2B-corroles: Differences between phenyl or pyrenyl groups at the meso-10 position. Phys. Chem. Chem. Phys. 2020, 22, 16965–16977. [Google Scholar] [CrossRef]
- Anusha, P.T.; Swain, D.; Hamad, S.; Giribabu, S.; Prashant, T.S.; Tewari, S.P.; Rao, S.V. Ultrafast Excited-State Dynamics and Dispersion Studies of Third-Order Optical Nonlinearities in Novel Corroles. J. Phys. Chem. C 2012, 116, 17828–17837. [Google Scholar] [CrossRef]
- Shao, W.; Wang, H.; He, S.; Shi, L.; Peng, K.; Lin, Y.; Zhang, L.; Ji, L.; Liu, H. Photophysical Properties and Singlet Oxygen Generation of Three Sets of Halogenated Corroles. J. Phys. Chem. B 2012, 116, 14228–14234. [Google Scholar] [CrossRef] [PubMed]
- Mahammed, A.; Gross, Z. Corroles as triplet photosensitizers. Coord. Chem. Rev. 2019, 379, 121–132. [Google Scholar] [CrossRef]
- Shi, L.; Liu, H.-Y.; Shen, H.; Hu, J.; Zhang, G.-L.; Wang, H.; Ji, L.-N.; Chang, C.-K.; Jiang, H.-F. Fluorescence properties of halogenated mono-hydroxyl corroles: The heavy-atom effects. J. Porphyr. Phthalocyanines 2009, 13, 1221–1226. [Google Scholar] [CrossRef]
- Zhao, F.; Zhan, X.; Lai, S.-H.; Zhang, L.; Liu, H.-Y. Photophysical properties and singlet oxygen generation of meso-iodinated free-base corroles. RSC Adv. 2019, 9, 12626–12634. [Google Scholar] [CrossRef]
- Lee, P.; Wu, X. Modifications of human serum albumin and their binding effect. Curr. Pharm. Des. 2015, 21, 1862–1865. [Google Scholar] [CrossRef]
- Mahammed, A.; Gray, H.B.; Weaver, J.J.; Sorasaenee, K.; Gross, Z. Amphiphilic Corroles Bind Tightly to Human Serum Albumin. Bioconjugate Chem. 2004, 15, 738–746. [Google Scholar] [CrossRef]
- Acunha, T.V.; Chaves, O.A.; Iglesias, B.A. Fluorescent pyrene moiety in fluorinated C6F5-corroles increases the interaction with HSA and CT-DNA. J. Porphyr. Phthalocyanines 2021, 25, 75–94. [Google Scholar] [CrossRef]
- Zhang, Y.; Wen, J.-Y.; Mahmood, M.H.R.; Wang, X.-L.; Lv, B.-B.; Ying, X.; Wang, H.; Ji, L.-N.; Liu, H.-L. DNA/HSA interaction and nuclease activity of an iron(III) amphiphilic sulfonated corrole. Luminescence 2015, 30, 1045–1054. [Google Scholar] [CrossRef]
- Iglesias, B.A.; Barata, J.F.B.; Pereira, P.M.R.; Girão, H.; Fernandes, R.; Tomé, J.P.C.; Neves, M.G.P.M.S.; Cavaleiro, J.A.S. New platinum(II)–bipyridyl corrole complexes: Synthesis, characterization and binding studies with DNA and HAS. J. Inorg. Biochem. 2015, 153, 32–41. [Google Scholar] [CrossRef]
- Gershman, Z.; Goldberg, I.; Gross, Z. DNA Binding and Catalytic Properties of Positively Charged Corroles. Angew. Chem. Int. Ed. 2007, 119, 4398–4402. [Google Scholar] [CrossRef]
- Na, N.; Zhao, D.-Q.; Li, H.; Jiang, N.; Wen, J.-Y.; Liu, H.-Y. DNA Binding, Photonuclease Activity and Human Serum Albumin Interaction of a Water-Soluble Freebase Carboxyl Corrole. Molecules 2016, 21, 54. [Google Scholar] [CrossRef] [PubMed]
- Wang, Y.-G.; Zhang, Z.; Wang, H.; Liu, H.-Y. Phosphorus(V) corrole: DNA binding, photonuclease activity and cytotoxicity toward tumor cells. Bioorg. Chem. 2016, 67, 57–63. [Google Scholar] [CrossRef]
- Liu, L.-G.; Sun, Y.-M.; Liu, Z.-Y.; Liao, Y.-H.; Zeng, L.; Ye, Y.; Liu, H.-Y. Halogenated Gallium Corroles:DNA Interaction and Photodynamic Antitumor Activity. Inorg. Chem. 2021, 60, 2234–2245. [Google Scholar] [CrossRef]
- Acunha, T.V.; Rodrigues, B.M.; da Silva, J.A.; Galindo, D.D.M.; Chaves, O.A.; da Rocha, V.N.; Piquini, P.C.; Köhler, M.H.; De Boni, L.; Iglesias, B.A. Unveiling the photophysical, biomolecule binding and photo-oxidative capacity of novel Ru(II)-polypyridyl corroles: A multipronged approach. J. Mol. Liq. 2021, 340, 117223. [Google Scholar] [CrossRef]
- Gryko, D.T.; Jadach, K. A Simple and Versatile One-Pot Synthesis of meso-Substituted trans-A2B-Corroles. J. Org. Chem. 2001, 66, 4267–4275. [Google Scholar] [CrossRef]
- Koszarna, B.; Gryko, D.T. Efficient Synthesis of meso-Substituted Corroles in a H2O−MeOH Mixture. J. Org. Chem. 2006, 71, 3707–3717. [Google Scholar] [CrossRef]
- Gryko, D.T. Adventures in the synthesis of meso-substituted corroles. J. Porphyr. Phthalocyanines 2008, 12, 906–917. [Google Scholar] [CrossRef]
- Orłowski, R.; Gryko, D.; Gryko, D.T. Synthesis of Corroles and Their Heteroanalogs. Chem. Rev. 2017, 117, 3102–3137. [Google Scholar] [CrossRef] [PubMed]
- Kruk, M.M.; Ngo, T.H.; Verstappen, P.; Starukhin, A.S.; Hofkens, J.; Dehaen, W.; Maes, W. Unraveling the Fluorescence Features of Individual Corrole NH Tautomers. J. Phys. Chem. A 2012, 116, 10695. [Google Scholar] [CrossRef]
- Ivanova, Y.B.; Savva, V.A.; Mamardashvili, N.Z.; Starukhin, A.S.; Ngo, T.H.; Dehaen, W.; Maes, W.; Kruk, M.M.; Corrole, N.H. Tautomers: Spectral Features and Individual Protonation. J. Phys. Chem. A 2012, 116, 10683. [Google Scholar] [CrossRef]
- Quina, F.H.; Silva, G.T.M. The photophysics of photosensitization: A brief overview. J. Photochem. Phototbiol. 2021, 7, 100042. [Google Scholar] [CrossRef]
- Egorov, S.Y.; Kamalov, V.F.; Koroteev, N.I.; Krasnovsky, A.A., Jr.; Toleutaev, B.N.; Zinukov, S.V. Rise and decay kinetics of photosensitized singlet oxygen luminescence in water. Measurements with nanosecond time-correlated single photon counting technique. Chem. Phys. Lett. 1989, 163, 421–424. [Google Scholar] [CrossRef]
- Barata, J.F.B.; Zamarrón, A.; Neves, M.G.P.M.S.; Faustino, M.A.F.; Tomé, A.C.; Cavaleiro, J.A.S.; Röder, B.; Juarranz, A.; Sanz-Rodríguez, F. Photodynamic effects induced by meso-tris(pentafluorophenyl)corrole and its cyclodextrin conjugates on cytoskeletal components of HeLa cells. Eur. J. Med. Chem. 2015, 92, 135–144. [Google Scholar] [CrossRef]
- Lakowicz, J.R. Principles of Fluorescence Spectroscopy, 3rd ed.; Springer: New York, NY, USA, 2006. [Google Scholar]
- Chaves, O.A.; Menezes, L.B.; Iglesias, B.A. Multiple spectroscopic and theoretical investigation of meso-tetra-(4-pyridyl)porphyrin ruthenium(II) complexes in HSA binding studies. Effect of Zn(II) in protein binding. J. Mol. Liq. 2019, 294, 111581. [Google Scholar] [CrossRef]
- Da Silveira, C.H.; Chaves, O.A.; Marques, A.C.; Rosa, N.M.O.; Costa, L.A.S.; Iglesias, B.A. Synthesis, photophysics, computational approaches, and biomolecule interactive studies of metalloporphyrins containing pyrenyl units: Influence of the metal center. Eur. J. Inorg. Chem. 2022, 12, e2022000075. [Google Scholar] [CrossRef]
- Chaves, O.A.; Amorim, A.P.O.; Castro, L.H.E.; de Sant’Anna, C.M.R.; de Oliveira, M.C.C.; Cesarin-Sobrinho, D.; Netto-Ferreira, J.C.; Ferreira, A.B.B. Fluorescence and docking studies of the interaction between human serum albumin and pheophytin. Molecules 2015, 20, 19526–19539. [Google Scholar] [CrossRef] [PubMed]
- Engelmann, F.M.; Losco, P.; Winnischofer, H.; Araki, K.; Toma, H.E. Synthesis, electrochemistry, spectroscopy and photophysical properties of a series of meso-phenylpyridylporphyrins with one to four pyridyl rings coordinated to [Ru (bipy) 2 Cl]+ groups. J. Porphyr. Phthalocyanines 2002, 6, 33. [Google Scholar] [CrossRef]
- Chai, J.-D.; Head-Gordon, M. Long-range corrected hybrid density functionals with damped atom-atom dispersion corrections. Phys. Chem. Chem. Phys. 2008, 10, 6615–6620. [Google Scholar] [CrossRef] [PubMed]
- Tomasi, J.; Mennucci, B.; Cammi, R. Quantum mechanical continuum solvation models. Chem. Rev. 2005, 105, 2999–3094. [Google Scholar] [CrossRef]
- Martin, R.L. Natural transition orbitals. J. Chem. Phys. 2003, 118, 4775–4777. [Google Scholar] [CrossRef]
- Revision, C.M.J.; Frisch, G.W.; Trucks, H.B.; Schlegel, G.E.; Scuseria, M.A.; Robb, J.R.; Cheeseman, G.; Scalmani, V.; Barone, G.A.; Petersson, H.; et al. Gaussian 09; Gaussian, Inc.: Wallingford, CT, USA, 2016. [Google Scholar]
- Santos, F.S.; da Silveira, C.H.; Nunes, F.S.; Ferreira, D.C.; Victória, H.F.V.; Krambrock, K.; Chaves, O.A.; Rodembusch, F.S.; Iglesias, B.A. Photophysical, photodynamical, redox properties and BSA interactions of novel isomeric tetracationic peripheral palladium(ii)-bipyridyl porphyrins. Dalton Trans. 2020, 49, 16278–16295. [Google Scholar] [CrossRef]
- Santamarina, S.C.; Heredia, D.A.; Durantini, A.M.; Durantini, E.N. Antimicrobial Photosensitizing Material Based on Conjugated Zn(II) Porphyrins. Antibiotics 2022, 11, 91. [Google Scholar] [CrossRef]
- Navarro, M.; Cisneros-Fajardo, E.J.; Sierralta, A.; Fernández-Mestre, M.; Silva, P.; Arrieche, D.; Marchán, E. Design of copper DNA intercalators with leishmanicidal activity. J. Biol. Inorg. Chem. 2003, 8, 401–408. [Google Scholar] [CrossRef]
- Drew, H.R.; Wing, R.M.; Takano, T.; Broka, C.; Tanaka, S.; Itakura, K.; Dickerson, R.E. Structure of a B-DNA dodecamer: Conformation and dynamics. Proc. Natl. Acad. Sci. USA 1981, 78, 2179. [Google Scholar] [CrossRef]
- Wardell, M.; Wang, Z.; Ho, J.X.; Robert, J.; Rucker, F.; Ruble, J.; Carter, D.C. The Atomic Structure of Human Methemalbumin at 1.9 Å. Biochem. Biophys. Res. Commun. 2002, 291, 813–819. [Google Scholar] [CrossRef] [PubMed]
- Available online: https://www.wavefun.com/ (accessed on 30 November 2022).
- Available online: http://www.ccdc.cam.ac.uk/solutions/csd-discovery/components/gold/ (accessed on 30 November 2022).
- Bessega, T.; Chaves, O.; Martins, F.; Acunha, T.; Back, D.; Iglesias, B.; de Oliveira, G. Coordination of Zn(II), Pd(II) and Pt(II) with ligands derived from diformylpyridine and thiosemicarbazide: Synthesis, structural characterization, DNA/BSA binding properties and molecular docking analysis. Inorg. Chim. Acta 2019, 496, 119049. [Google Scholar] [CrossRef]
- Ghuman, J.; Zunszain, P.; Petitpas, I.; Bhattacharya, A.; Otagiri, M.; Curry, S. Structural basis of the drug-binding specificity of human serum albumin. J. Mol. Biol. 2005, 353, 38–52. [Google Scholar] [CrossRef]
- Wang, Z.; Ho, J.; Ruble, J.; Rose, J.; Ruker, F.; Ellenburg, M.; Murphy, R.; Click, J.; Soistman, E.; Wilkerson, L.; et al. Structural studies of several clinically important oncology drugs in complex with human serum albumin. Biochim. Biophys. Acta 2013, 1830, 5356–5374. [Google Scholar] [CrossRef] [PubMed]
- Chaves, O.; Santos, M.; de Oliveira, M.; Sant’Anna, C.; Ferreira, R.; Echevarria, A.; Netto-Ferreira, J. Synthesis, tyrosinase inhibition and transportation behavior of novel β-enamino thiosemicarbazide derivatives by human serum albumin. J. Mol. Liq. 2018, 254, 280–290. [Google Scholar] [CrossRef]
- Câmara, V.; Chaves, O.; de Araújo, B.; Gonçalves, P.; Iglesias, B.; Ceschi, M.; Rodembusch, F. Photoactive homomolecular bis(n)-Lophine dyads: Multicomponent synthesis, photophysical properties, theoretical investigation, docking and interaction studies with biomacromolecules. J. Mol. Liq. 2022, 349, 118084. [Google Scholar] [CrossRef]
- Chaves, O.; Acunha, T.; Iglesias, B.; Jesus, C.; Serpa, C. Effect of peripheral platinum(II) bipyridyl complexes on the interaction of tetra-cationic porphyrins with human serum albumin. J. Mol. Liq. 2020, 301, 112466. [Google Scholar] [CrossRef]
- Available online: https://pymol.org/2/ (accessed on 30 November 2022).


| DCM | ||||||
|---|---|---|---|---|---|---|
| Corrole | λAbs (ε; M−1 cm−1 × 10⁵) a | λEm (QY; %) b | SS (nm/cm−1) c | τf (ns) d/Χ2 | kr (×108 s−1) e | knr (×108 s−1) e |
| 1 | 411 (1.47), 563 (0.24), 614 (0.14) | 659, 717 (15.0) | 248/9155 | 3.66/1.05815 | 0.41 | 2.32 |
| 2 | 412 (0.96), 562 (0.14), 614 (0.07) | 658, 719 (9.0) | 246/9075 | 4.20/0.97026 | 0.21 | 2.16 |
| 3 | 411 (0.86), 563 (0.15), 615 (0.09) | 662, 718 (8.0) | 251/9225 | 3.70/1.16247 | 0.21 | 2.49 |
| 4 | 411 (1.16), 562 (0.18), 612 (0.11) | 657, 719 (12.0) | 246/9110 | 3.87/1.14992 | 0.31 | 2.27 |
| ACN | ||||||
| Corrole | λAbs (ε; M−1 cm−1 × 10⁵) a | λEm (QY; %) b | SS (nm/cm−1) c | τf (ns)d/Χ2 | kr (×108 s−1) e | knr (×108 s−1) e |
| 1 | 419 (0.94), 577 (0.11), 625 (0.20) | 635, 693 (11.0) | 216/8120 | 4.04/1.05903 | 0.27 | 2.20 |
| 2 | 420 (1.01), 580 (0.10), 624 (0.25) | 634, 692 (17.0) | 214/8035 | 4.24/1.15462 | 0.40 | 1.96 |
| 3 | 419 (0.76), 583 (0.09), 627 (0.20) | 637, 694 (8.0) | 218/8165 | 3.68/1.13217 | 0.22 | 2.50 |
| 4 | 420 (0.79), 583 (0.07), 623 (0.22) | 633, 692 (11.0) | 213/8010 | 4.07/1.17485 | 0.27 | 2.18 |
| MeOH | ||||||
| Corrole | λAbs (ε; M−1 cm−1 × 10⁵) a | λEm (QY; %) b | SS (nm/cm−1) c | τf (ns)d/Χ2 | kr (×108 s−1) e | knr (×108 s−1) e |
| 1 | 409 (0.82), 571 (0.15), 617 (0.11) | 658 (11.0) | 249/9250 | 3.77/1.13135 | 0.29 | 2.36 |
| 2 | 410 (1.21), 567 (0.20), 613 (0.18) | 661 (6.0) | 251/9260 | 3.78/1.01780 | 0.16 | 2.48 |
| 3 | 410 (1.17), 568 (0.21), 613 (0.15) | 666 (22.0) | 256/9375 | 3.56/1.07740 | 0.62 | 2.19 |
| 4 | 409 (1.39), 567 (0.24), 613 (0.18) | 658 (10.0) | 249/9250 | 3.66/1.05354 | 0.27 | 2.46 |
| DMSO | ||||||
| Corrole | λAbs (ε; M−1 cm−1 × 10⁵) a | λEm (QY; %) b | SS (nm/cm−1) c | τf (ns) d/Χ2 | kr (×108 s−1) e | knr (×108 s−1) e |
| 1 | 425 (1.56), 580 (0.22), 627 (0.40) | 637, 692 (38.0) | 212/7830 | 4.26/1.00523 | 0.89 | 1.45 |
| 2 | 427 (1.05), 587 (0.11), 628 (0.31) | 640, 697 (26.0) | 213/7795 | 4.20/1.10980 | 0.62 | 1.76 |
| 3 | 426 (1.00), 579 (0.14), 630 (0.25) | 643, 701 (22.0) | 217/7920 | 4.12/1.08084 | 0.53 | 1.89 |
| 4 | 427 (1.37), 585 (0.15), 627 (0.38) | 639, 696 (27.0) | 212/7770 | 4.35/1.09784 | 0.62 | 1.68 |
| Corrole | HOMO Plot | LUMO Plot | Soret Band (f) | Q Bands (f) |
|---|---|---|---|---|
| 1 |  |  | 390.98 (1.1256) | 535.89 (0.1006); 555.81 (0.2818) |
| 2 |  |  | 367.33 (1.3793) | 547.84 (0.1095); 564.03 (0.2953) |
| 3 |  |  | 371.05 (1.3838) | 554.66 (0.0884); 575.63 (0.3254) |
| 4 |  |  | 371.99 (1.4419) | 553.48 (0.0835); 573.47 (0.3171) |
| Corrole | Eox1 | Eox2 | Eox3 | Ered1 | EHOMO d | ELUMO e | ΔE |
|---|---|---|---|---|---|---|---|
| 1 * | +0.65 V a | +0.78 V c | +0.95 V c | −1.29 V b | −5.45 | −3.51 | 1.94 |
| 2 | +0.80 V a | +1.32 V c | - | −1.18 V b | −5.60 | −3.62 | 1.98 |
| 3 | +0.60 V a | +1.09 V c | +1.93 V c | −1.21 V b | −5.40 | −3.59 | 1.81 |
| 4 | +0.21 V a | +0.95 V c | +1.62 V c | −1.37 V b | −5.01 | −3.43 | 1.58 |
| Corrole | kpo (M−1 s−1) a | φΔ (%) b | kSO (min−1) c | log POW d |
|---|---|---|---|---|
| 1 * | 0.322 | 33.0 | 0.641 | +2.948 |
| 2 | 0.504 | 51.0 | 0.540 | +3.542 |
| 3 | 0.444 | 45.0 | 0.913 | +2.431 |
| 4 | 0.390 | 40.0 | 0.513 | +2.135 |
| TPhCor ** | 0.650 | 67.0 | ----- | ----- |
| UV-Vis Analysis | |||||
|---|---|---|---|---|---|
| Corrole | H(%) a | Δλ (nm) b | Kb (×105; M−1) c | ΔG° (kcal mol−1) d | |
| 1 * | 6.10 | 0.0 | 1.49 ± 0.02 | −7.05 | |
| 2 | 10.6 | 0.0 | 3.21 ± 0.07 | −7.50 | |
| 3 | 3.80 | 0.0 | 1.75 ± 0.10 | −7.15 | |
| 4 | 10.7 | 0.0 | 3.32 ± 0.03 | −7.55 | |
| AO:DNA by Emission | |||||
| Corrole | Q(%) e | KSV(×103; M−1) f | kq(×1012; M−1s−1) g | Kb(×103; M−1) h | ΔG° (kcal mol−1) d |
| 1 * | 25.0 | 3.43 ± 0.13 | 2.02 | ----- | ----- |
| 2 | 7.40 | 0.80 ± 0.01 | 0.47 | 1.16 ± 0.18 | −4.18 |
| 3 | 33.3 | 4.27 ± 0.07 | 2.51 | 3.41 ± 0.12 | −4.82 |
| 4 | 34.2 | 5.00 ± 0.10 | 2.94 | 2.71 ± 0.06 | −4.68 |
| DAPI:DNA by Emission | |||||
| Corrole | Q(%) e | KSV(×103; M−1) f | kq(×1012; M−1s−1) i | Kb(×103; M−1) h | ΔG° (kcal mol−1) d |
| 1 * | 37.4 | 5.81 ± 0.11 | 2.64 | ----- | ----- |
| 2 | 21.2 | 1.96 ± 0.02 | 0.89 | 3.90 ± 0.09 | −4.90 |
| 3 | 33.8 | 3.43 ± 0.03 | 1.56 | 3.42 ± 0.13 | −4.82 |
| 4 | 41.5 | 6.47 ± 0.02 | 2.94 | 3.29 ± 0.16 | −4.80 |
| UV-Vis Analysis | |||||||
|---|---|---|---|---|---|---|---|
| Corrole | H(%) a | Δλ (nm) b | Kb (×103; M−1) c | ΔG° (kcal mol−1) d | |||
| 1 | 17.4 | 0.0 | 4.83 ± 0.04 | −5.00 | |||
| 2 | 7.25 | 0.0 | 4.76 ± 0.04 | −5.00 | |||
| 3 | 16.0 | 0.0 | 3.30 ± 0.07 | −4.80 | |||
| 4 | 29.0 | 0.0 | 16.4 ± 0.07 | −5.75 | |||
| Emission Analysis | |||||||
| Corrole | Q(%) e | KSV(×104; M−1) f | kq(×1012; M−1s−1) g | Ka(×104; M−1) h | Kb(×104; M−1) i | nj | ΔG° (kcal mol−1) d |
| 1 * | ----- | 1.41 ± 0.01 | 2.49 | 2.29 ± 0.13 | - | - | −5.85 |
| 2 | 65.7 | 1.91 ± 0.05 | 3.37 | 1.00 ± 0.11 | 5.22 ± 0.19 | 1.23 | −6.45 |
| 3 | 88.6 | 7.60 ± 0.18 | 13.4 | 8.75 ± 0.23 | 8.63 ± 0.42 | 1.95 | −6.75 |
| 4 | 77.2 | 2.10 ± 0.06 | 3.70 | 9.13 ± 0.25 | 6.29 ± 0.39 | 1.45 | −6.75 |
| DNA | HSA | ||||
|---|---|---|---|---|---|
| Corrole | Minor Groove | Major Groove | Site I | Site II | Site III |
| 2 | 61.19 | 40.37 | 83.03 | 30.30 | 74.09 |
| 3 | 63.75 | 39.87 | 53.84 | 30.90 | 72.20 |
| 4 | 65.60 | 43.86 | 69.31 | 30.88 | 76.72 |
Disclaimer/Publisher’s Note: The statements, opinions and data contained in all publications are solely those of the individual author(s) and contributor(s) and not of MDPI and/or the editor(s). MDPI and/or the editor(s) disclaim responsibility for any injury to people or property resulting from any ideas, methods, instructions or products referred to in the content. |
© 2023 by the authors. Licensee MDPI, Basel, Switzerland. This article is an open access article distributed under the terms and conditions of the Creative Commons Attribution (CC BY) license (https://creativecommons.org/licenses/by/4.0/).
Share and Cite
de Souza, V.B.; da Rocha, V.N.; Piquini, P.C.; Chaves, O.A.; Iglesias, B.A. Effects of Substituents on the Photophysical/Photobiological Properties of Mono-Substituted Corroles. Molecules 2023, 28, 1385. https://doi.org/10.3390/molecules28031385
de Souza VB, da Rocha VN, Piquini PC, Chaves OA, Iglesias BA. Effects of Substituents on the Photophysical/Photobiological Properties of Mono-Substituted Corroles. Molecules. 2023; 28(3):1385. https://doi.org/10.3390/molecules28031385
Chicago/Turabian Stylede Souza, Vitória Barbosa, Vinícius N. da Rocha, Paulo Cesar Piquini, Otávio Augusto Chaves, and Bernardo A. Iglesias. 2023. "Effects of Substituents on the Photophysical/Photobiological Properties of Mono-Substituted Corroles" Molecules 28, no. 3: 1385. https://doi.org/10.3390/molecules28031385
APA Stylede Souza, V. B., da Rocha, V. N., Piquini, P. C., Chaves, O. A., & Iglesias, B. A. (2023). Effects of Substituents on the Photophysical/Photobiological Properties of Mono-Substituted Corroles. Molecules, 28(3), 1385. https://doi.org/10.3390/molecules28031385