1. Introduction
Chitosan oligosaccharide (Cos) is a product of Chitosan degradation [
1,
2] with several biological properties [
3,
4], such as anti-oxidation [
5,
6], anti-cancer [
7] or reducing blood fat [
8].
At present, the best method of Cos preparation is enzymatic hydrolysis of Chitosan, which is mediated by chitosanases [
9,
10,
11]. These are a group of enzymes with high similarity formed by seven families: GH3, GH5, GH7, GH8, GH46, GH75 and GH80 [
12,
13], where the GH46 family is different from the others.
Chitosanase MY002 (a GH46 family member) was successfully isolated in 2021 from
Bacillus subtilis [
14] and was referred to as chitosanase CSNMY002. Three mutants were produced, E19A, G21K and G21R, that were also active, but different from the wild type with respect to substrate binding and cleavage mechanism. The cleavage mode of Chitohexose (GlcN)
6 by CSNMY002 is a “3 + 3” symmetry mode, whereas the three mutants have a different mechanism.
Subsequent functional experiments explored the enzymatic properties of these enzymes, but how these three mutations affect the substrate binding and splitting mechanism is not known. Herein, we have used molecular dynamics to simulate the reaction of CSNMY002 wild type (WT) and its two mutants G21R and G21K with Chitodisaccharide (GlcN)2 and Chitohexose (GlcN)6. Our results provide the basis for the design of new chitosanases.
2. Results and Discussion
2.1. The Binding Mode of (GlcN)2 to CSNMY002
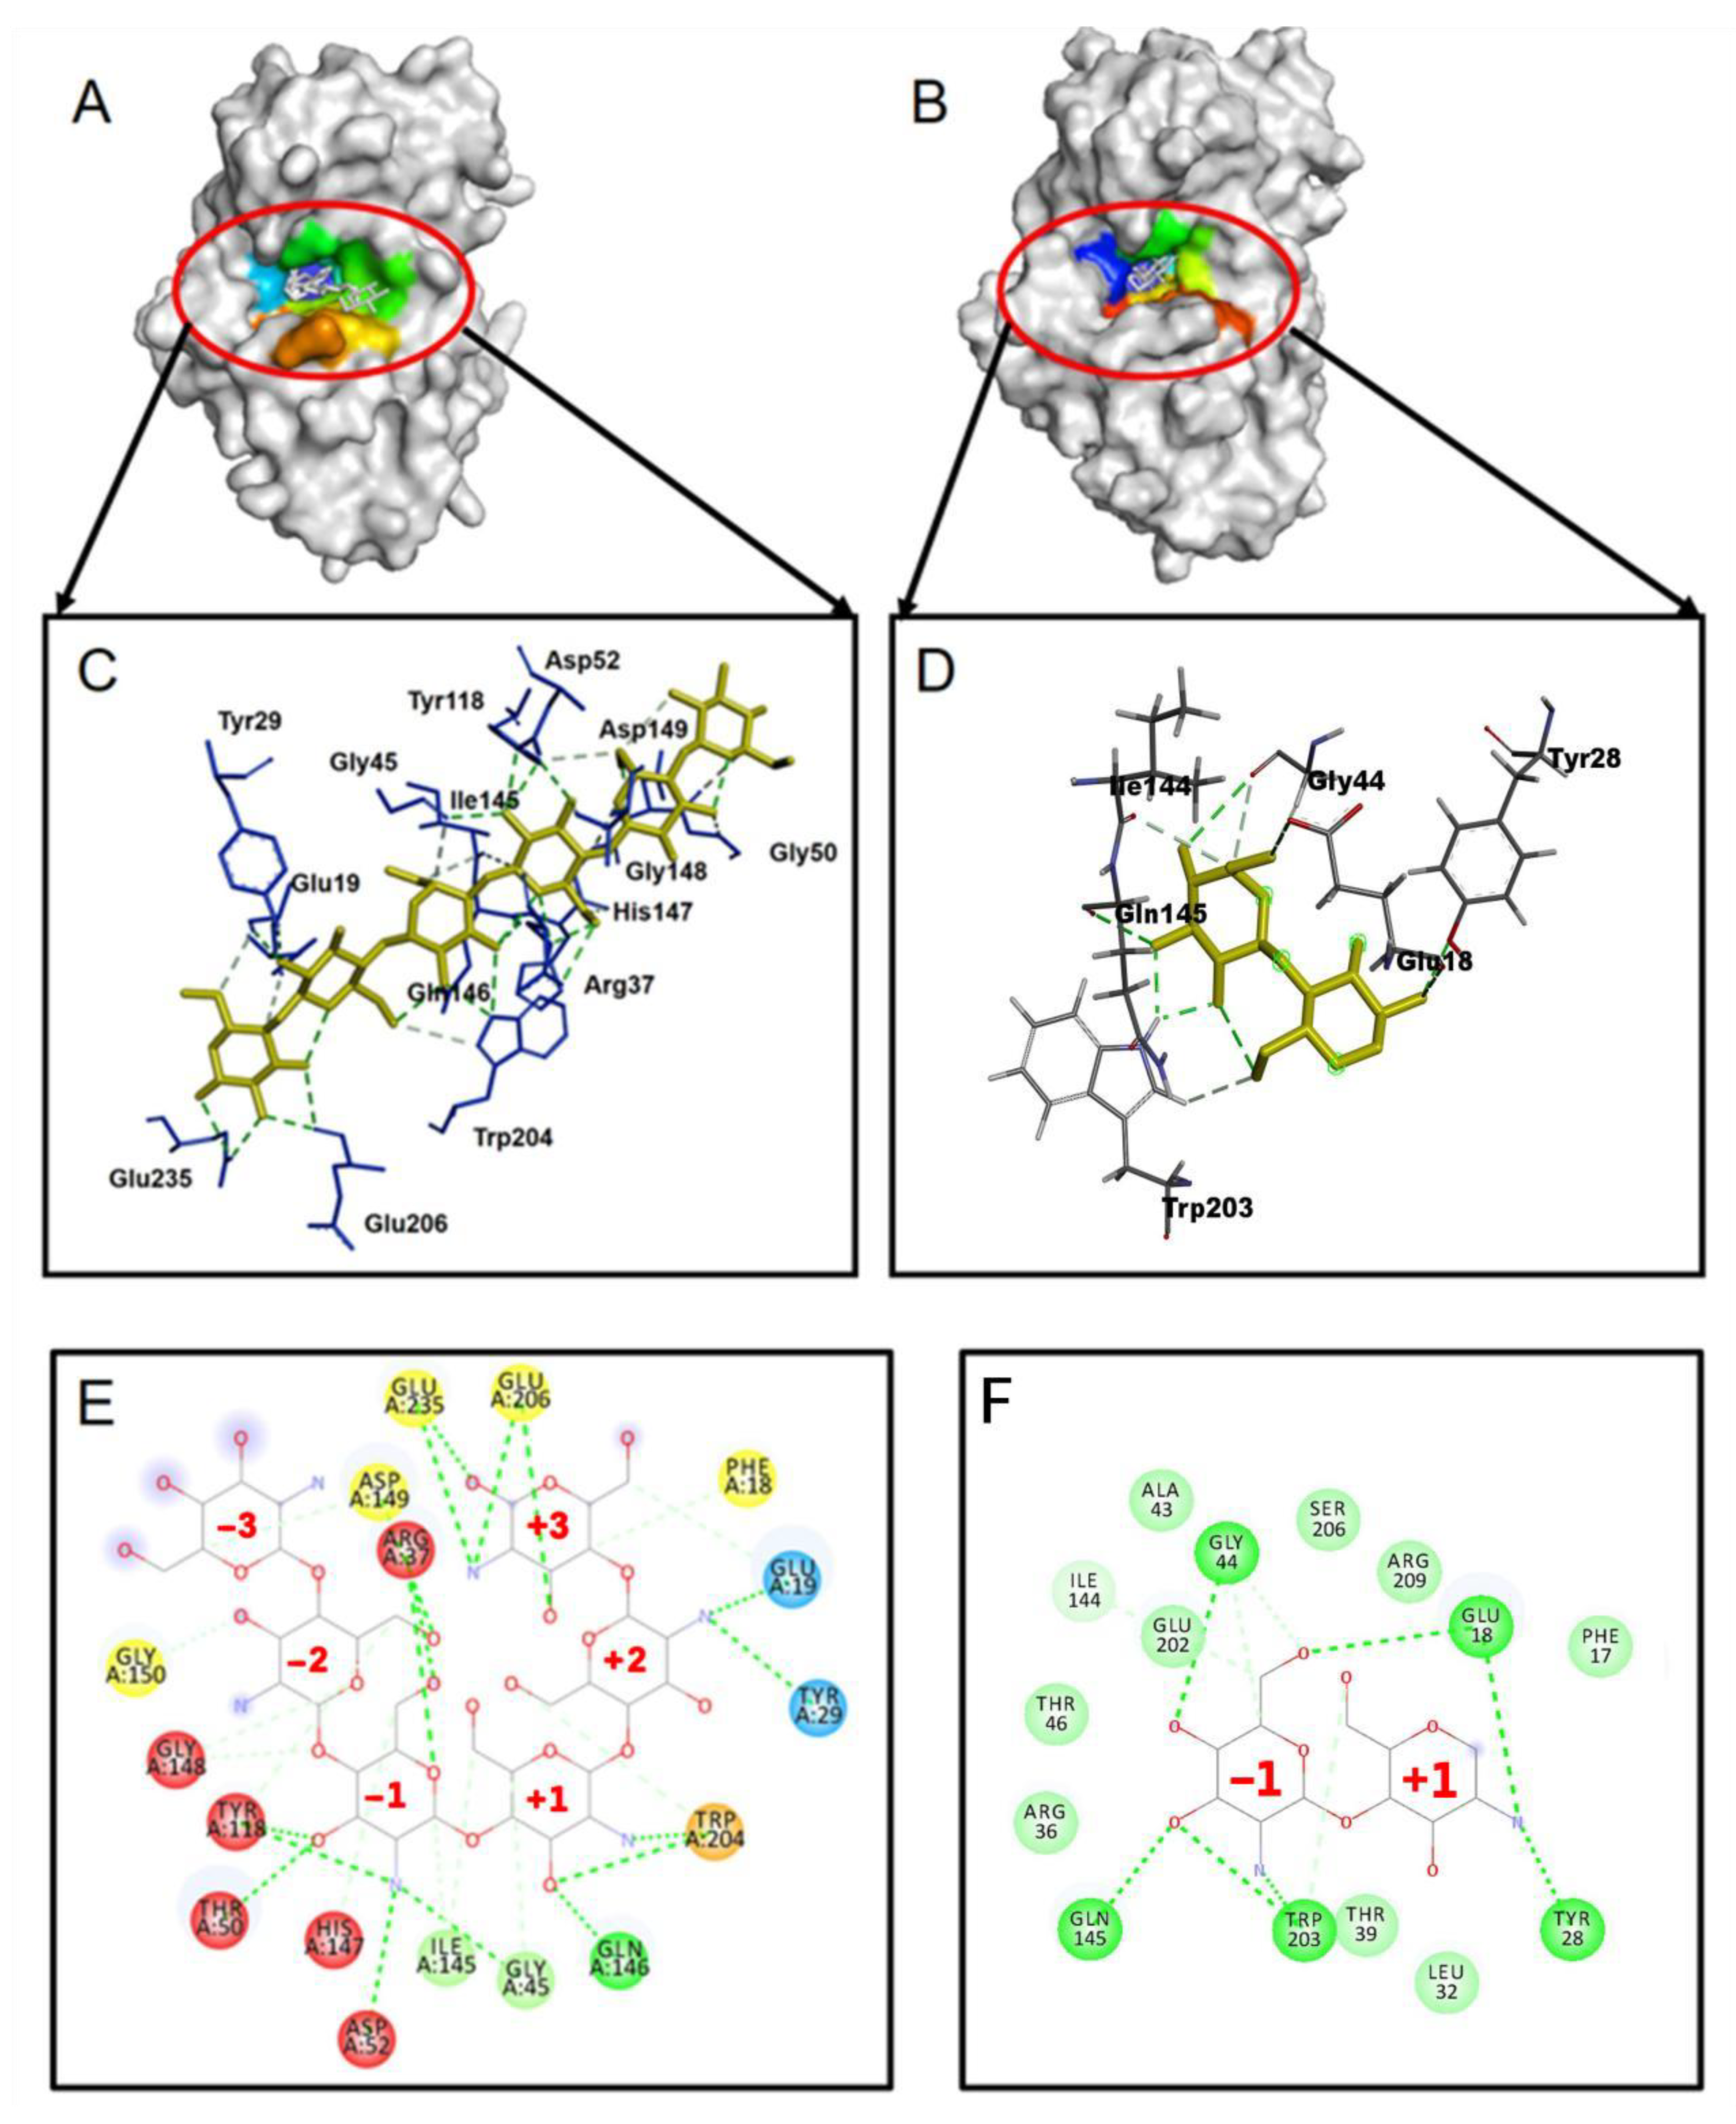
The docking of (GlcN)
2 and (GlcN)
6 to WT CSNMY002 (
Figure 1A–F) shows that both ligands have the same binding pose, with residues Gly45, IIe145, Gln146 and Trp204 involved in subsite +1 and Arg37, Gly45, Thr50, Asp52, Tyr118, IIe145, His147 and Gly148 involved in subsite −1.
2.2. System Stabilization
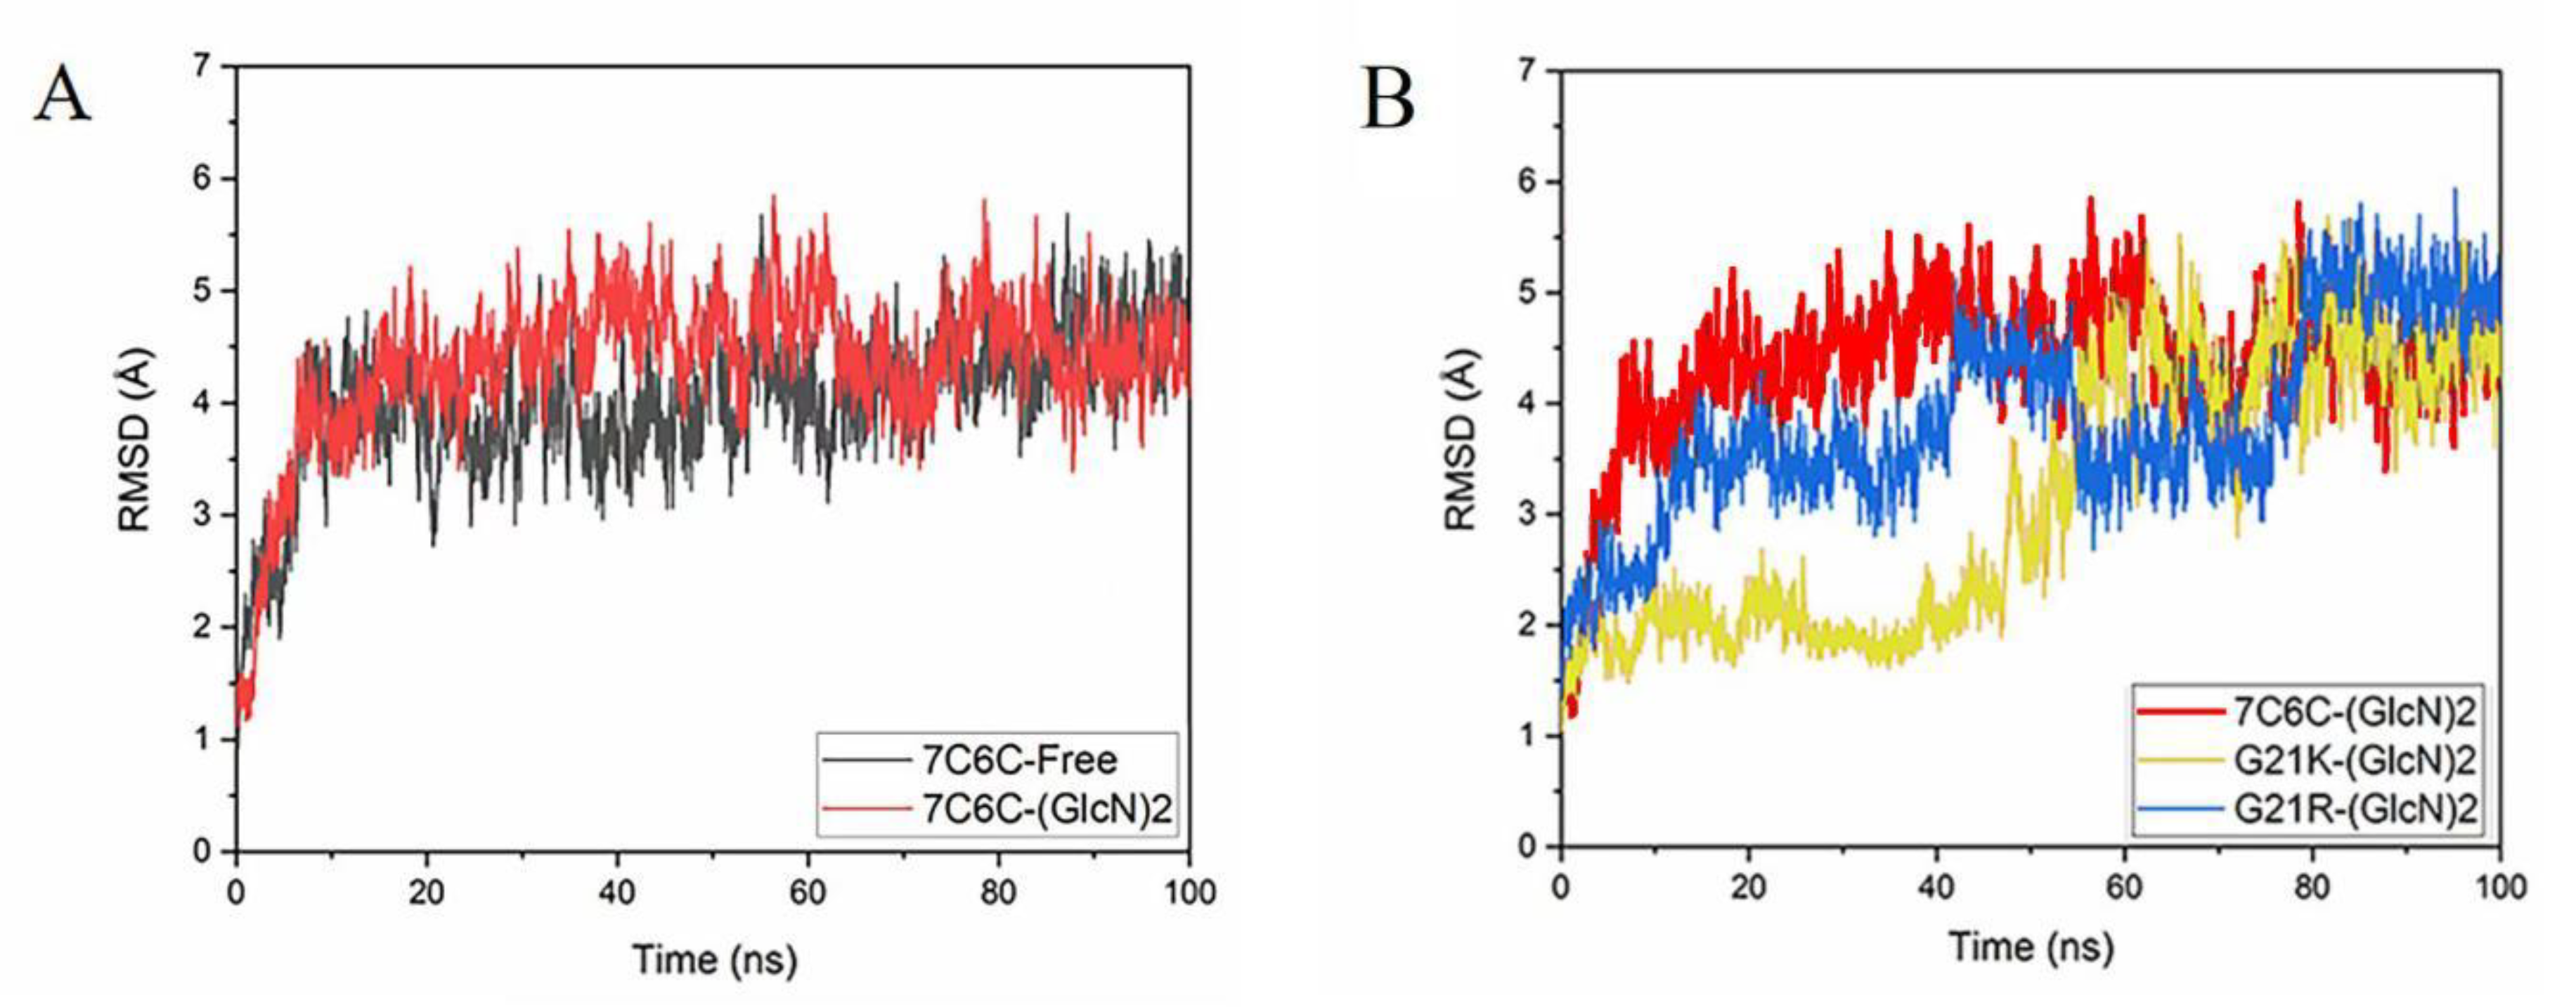
The root-mean-square deviation (RMSD) values of the atomic skeletons in the four simulation architectures (
Figure 2A,B) showed that the four reaction systems reached equilibrium after 60 ns. The final RMSD was always below 5 Å, indicating that the systems were stable during the 100 ns MD simulation.
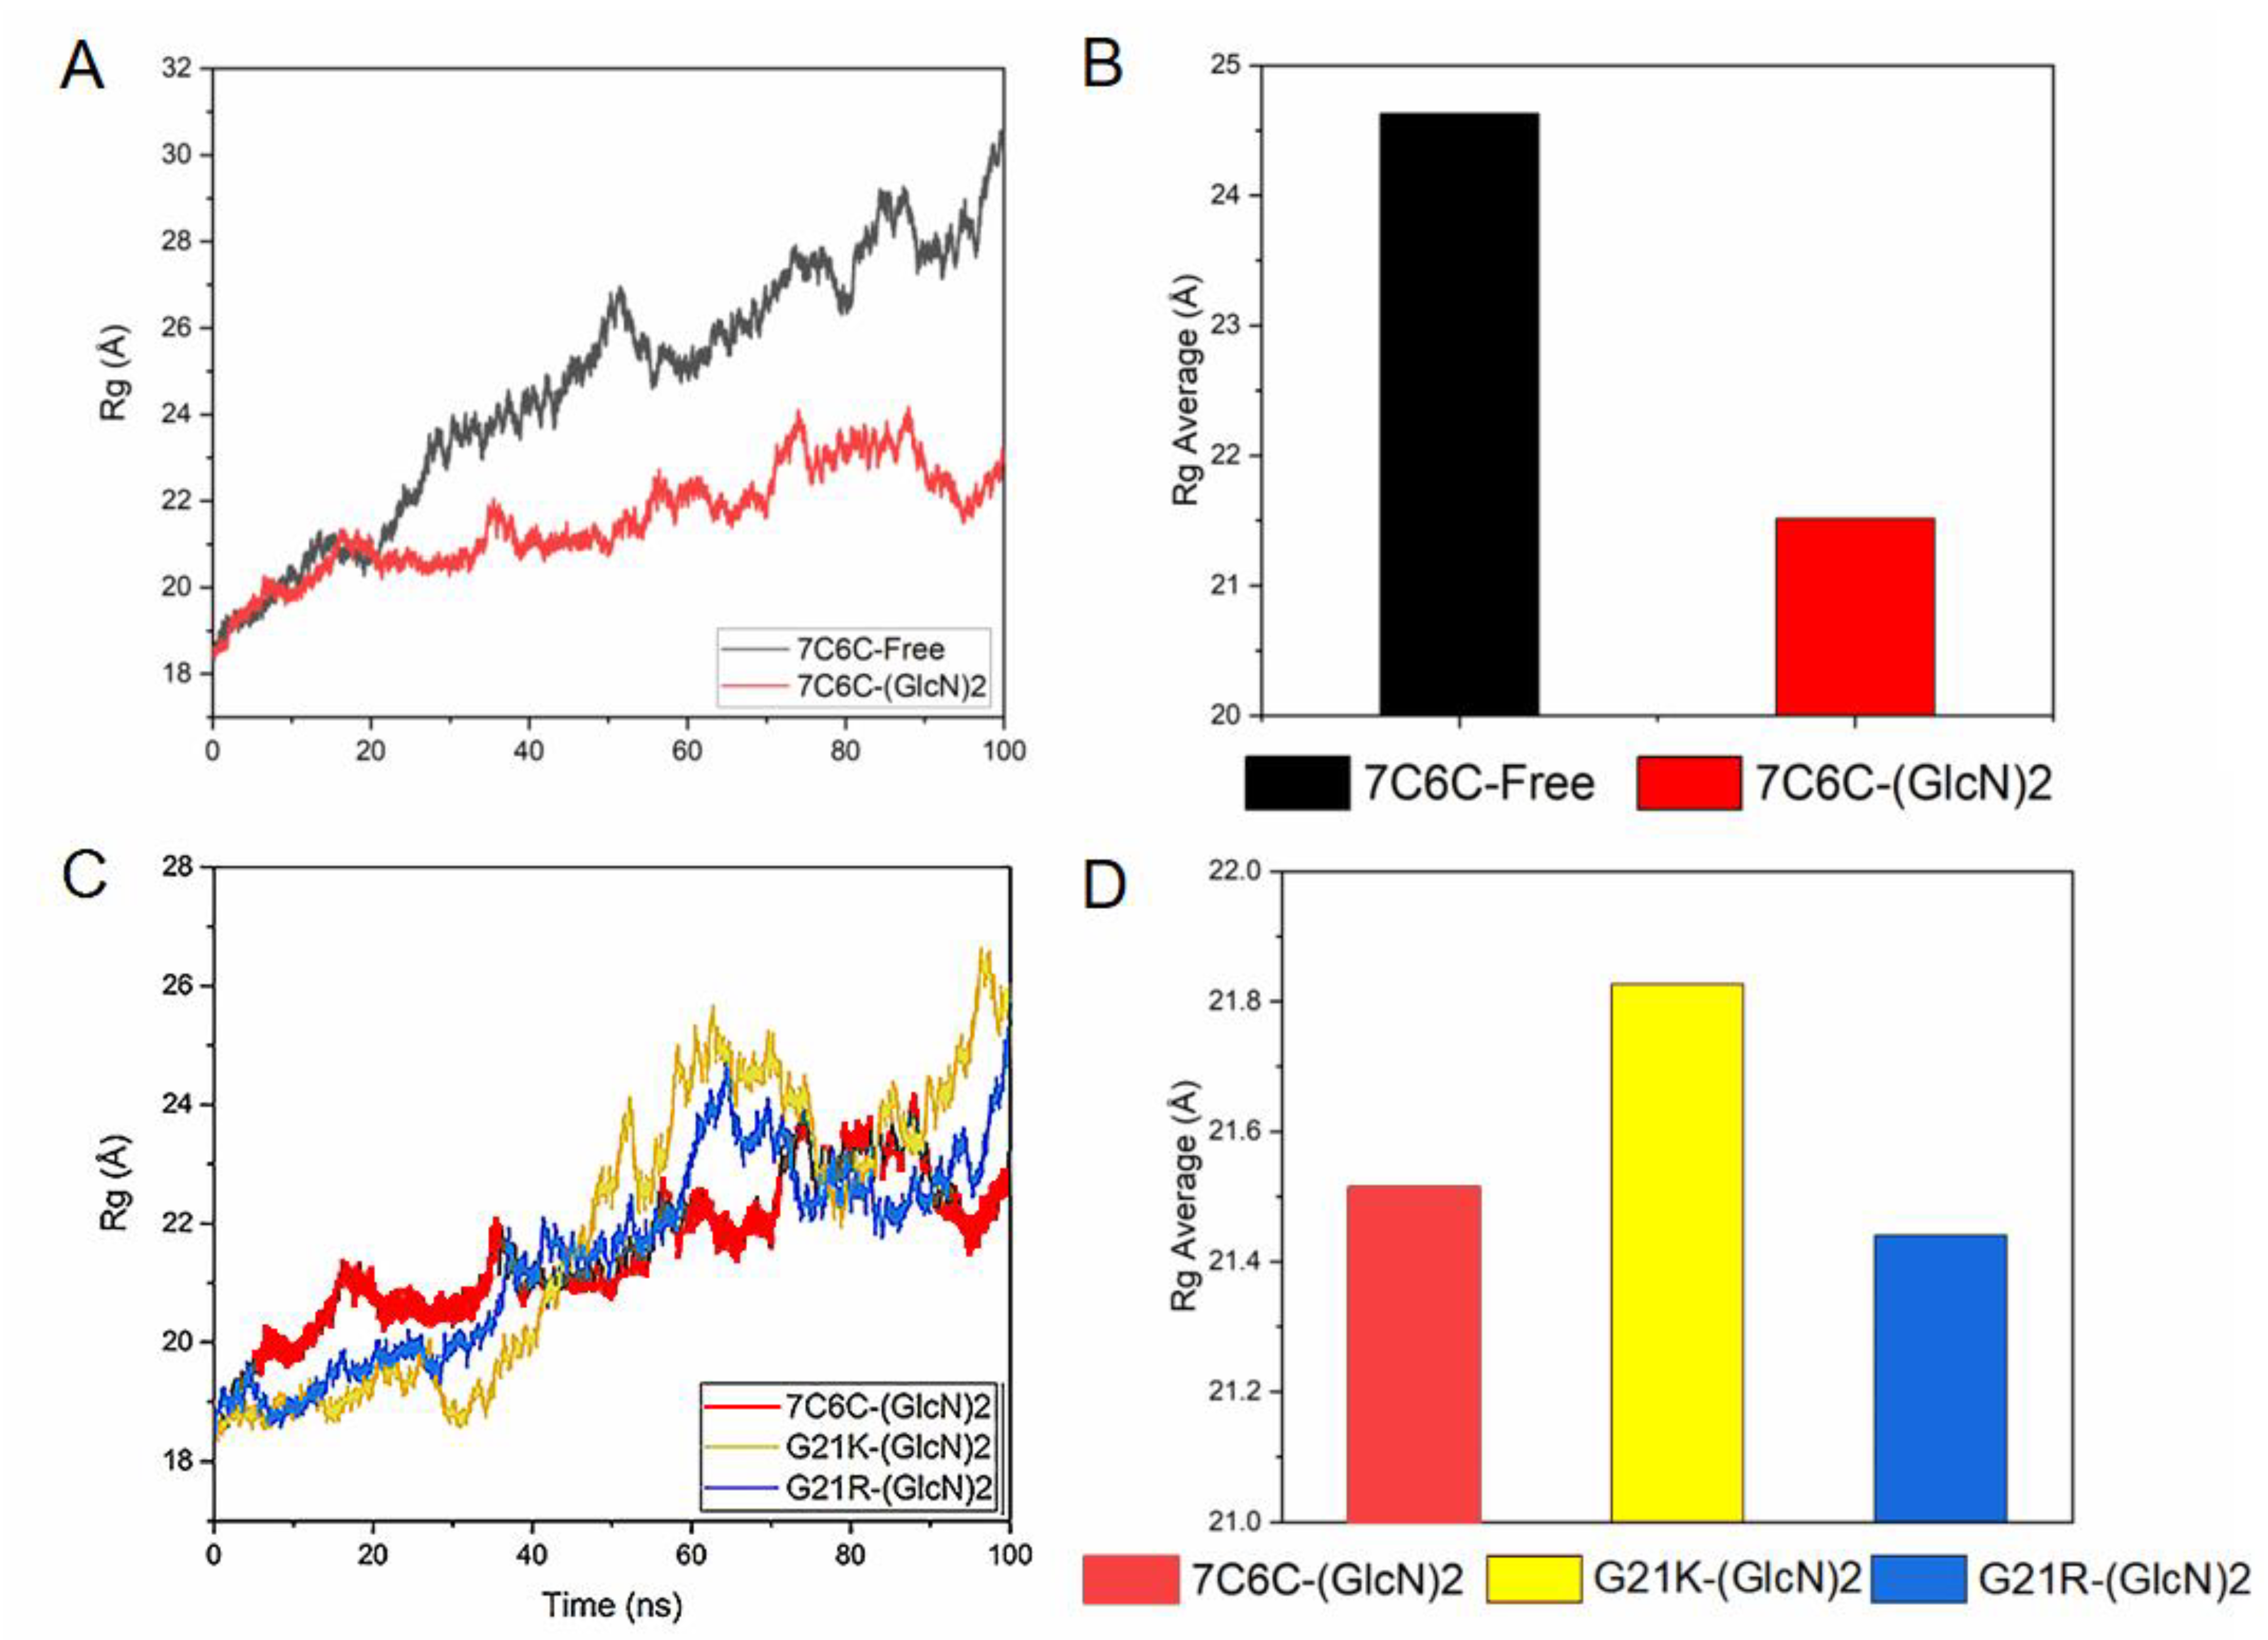
Then Rg value represents the tight degree of protein structure. The smaller the value of Rg is, the more closely the 3D structure of the protein is. The Rg was below 30 Å in all four systems (
Figure 3A–D), and it was smaller in the mutants, indicating a conformational change after binding to ligand.
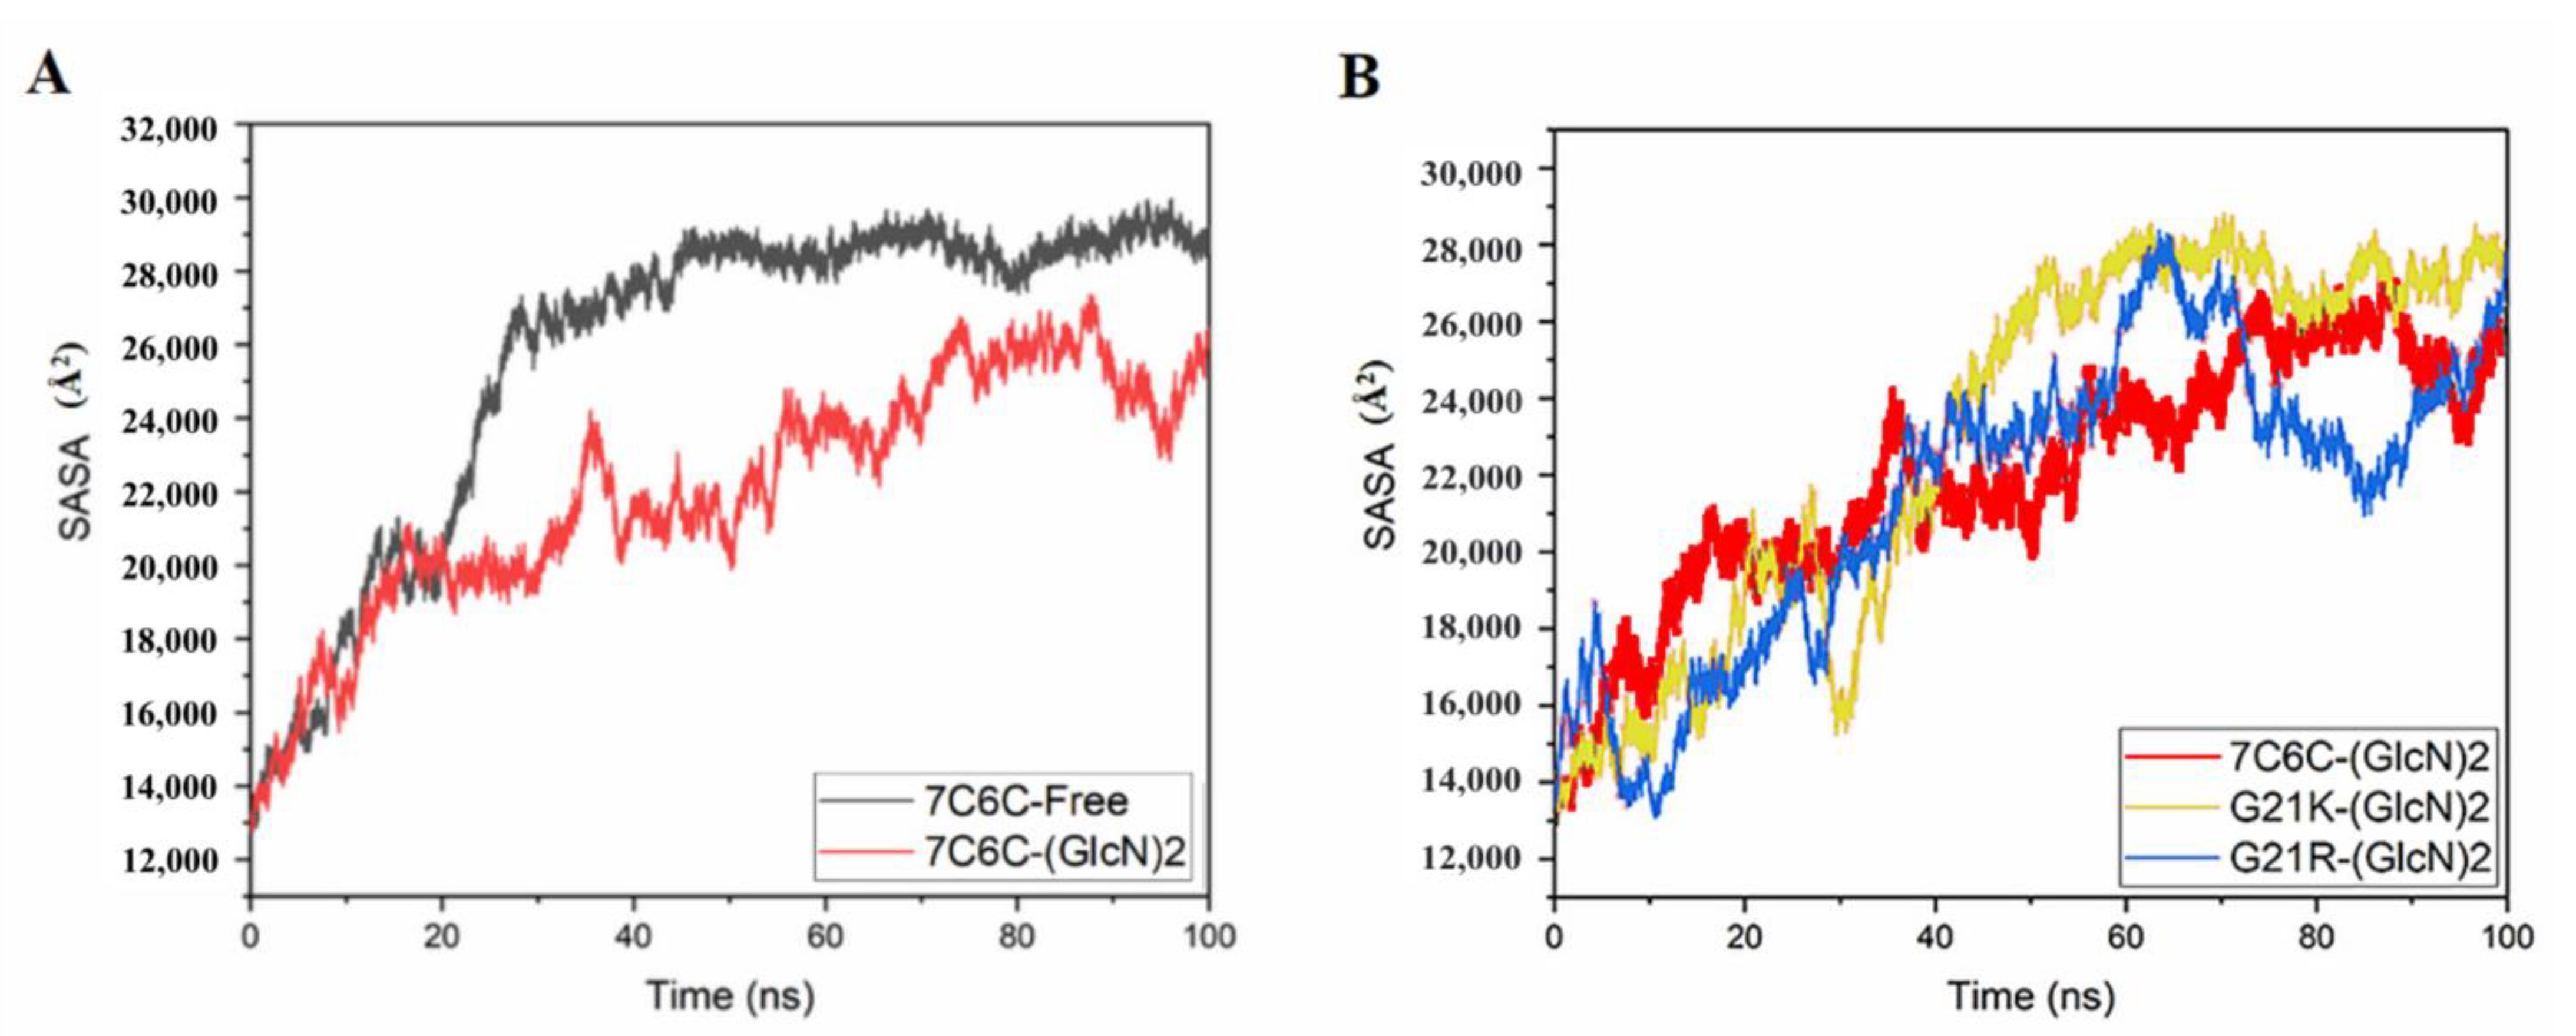
The SASA value of the free protein was stable (around 28,000~30,000 Å
2) after 100 ns (
Figure 4 and
Figure 5), but it was smaller in the three complexes, with final values stable between 26,000 and 28,000 Å
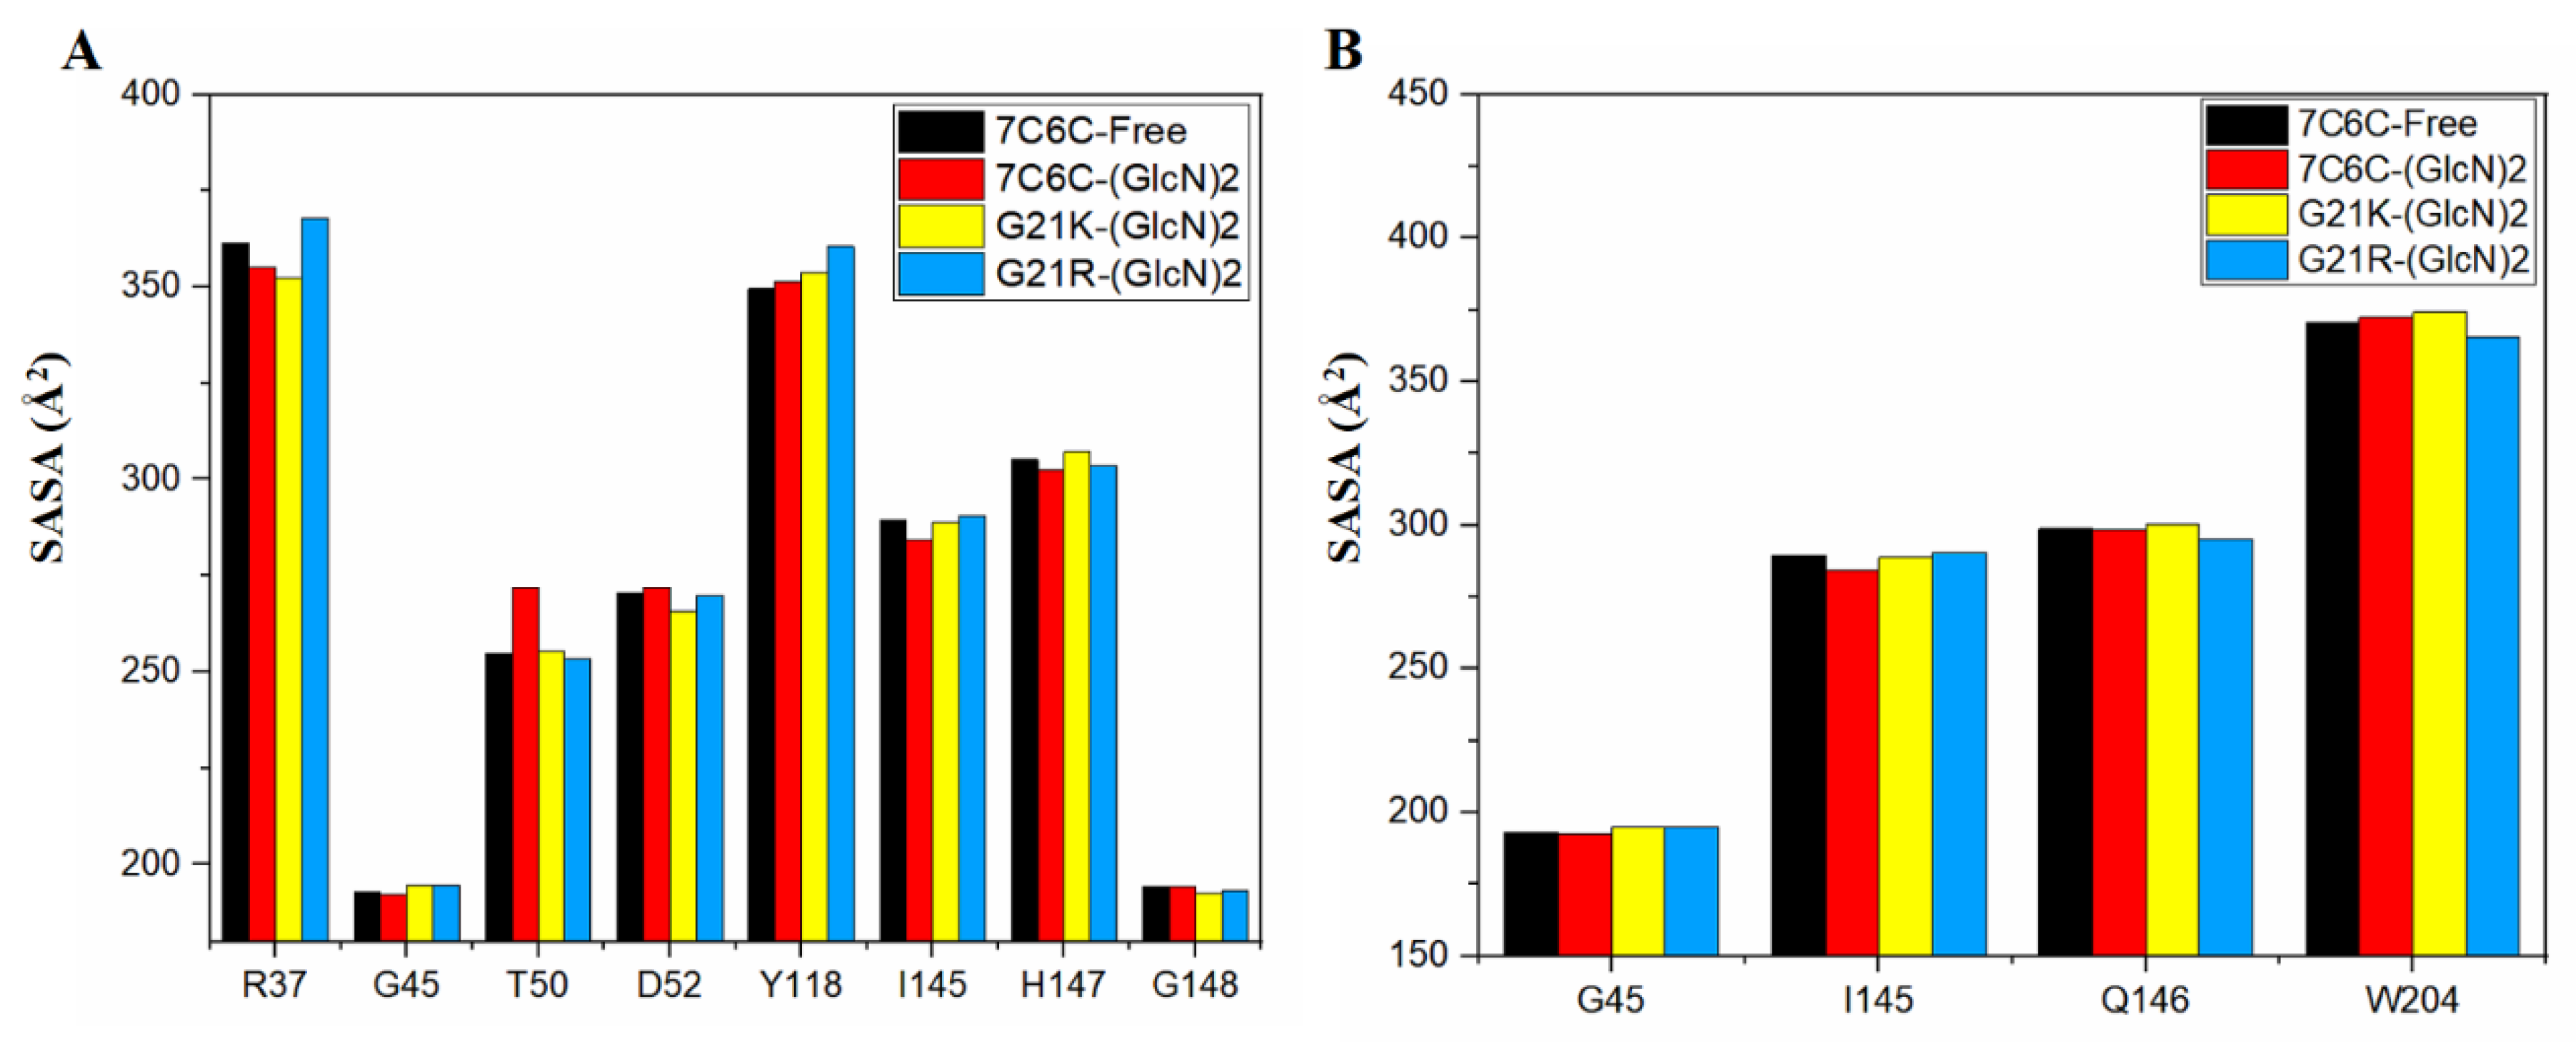
2, suggesting reduced protein hydrophilicity caused by ligand binding. The SASA residue values of subsites −1 and +1 (
Figure 5A,B) showed a significant increase in Thr50 in 7C6C-(GlcN)
2, compared to 7C6C-free, but residues at subsite 1 did not show significant differences. The SASA values of residue Tyr118 in the two mutants increased, whereas G21K did not show significant changes in these key sites.
Overall, the four systems were stable after 100 ns MD simulations and could be used in subsequent steps.
2.3. Conformational Changes between Protein and Ligands
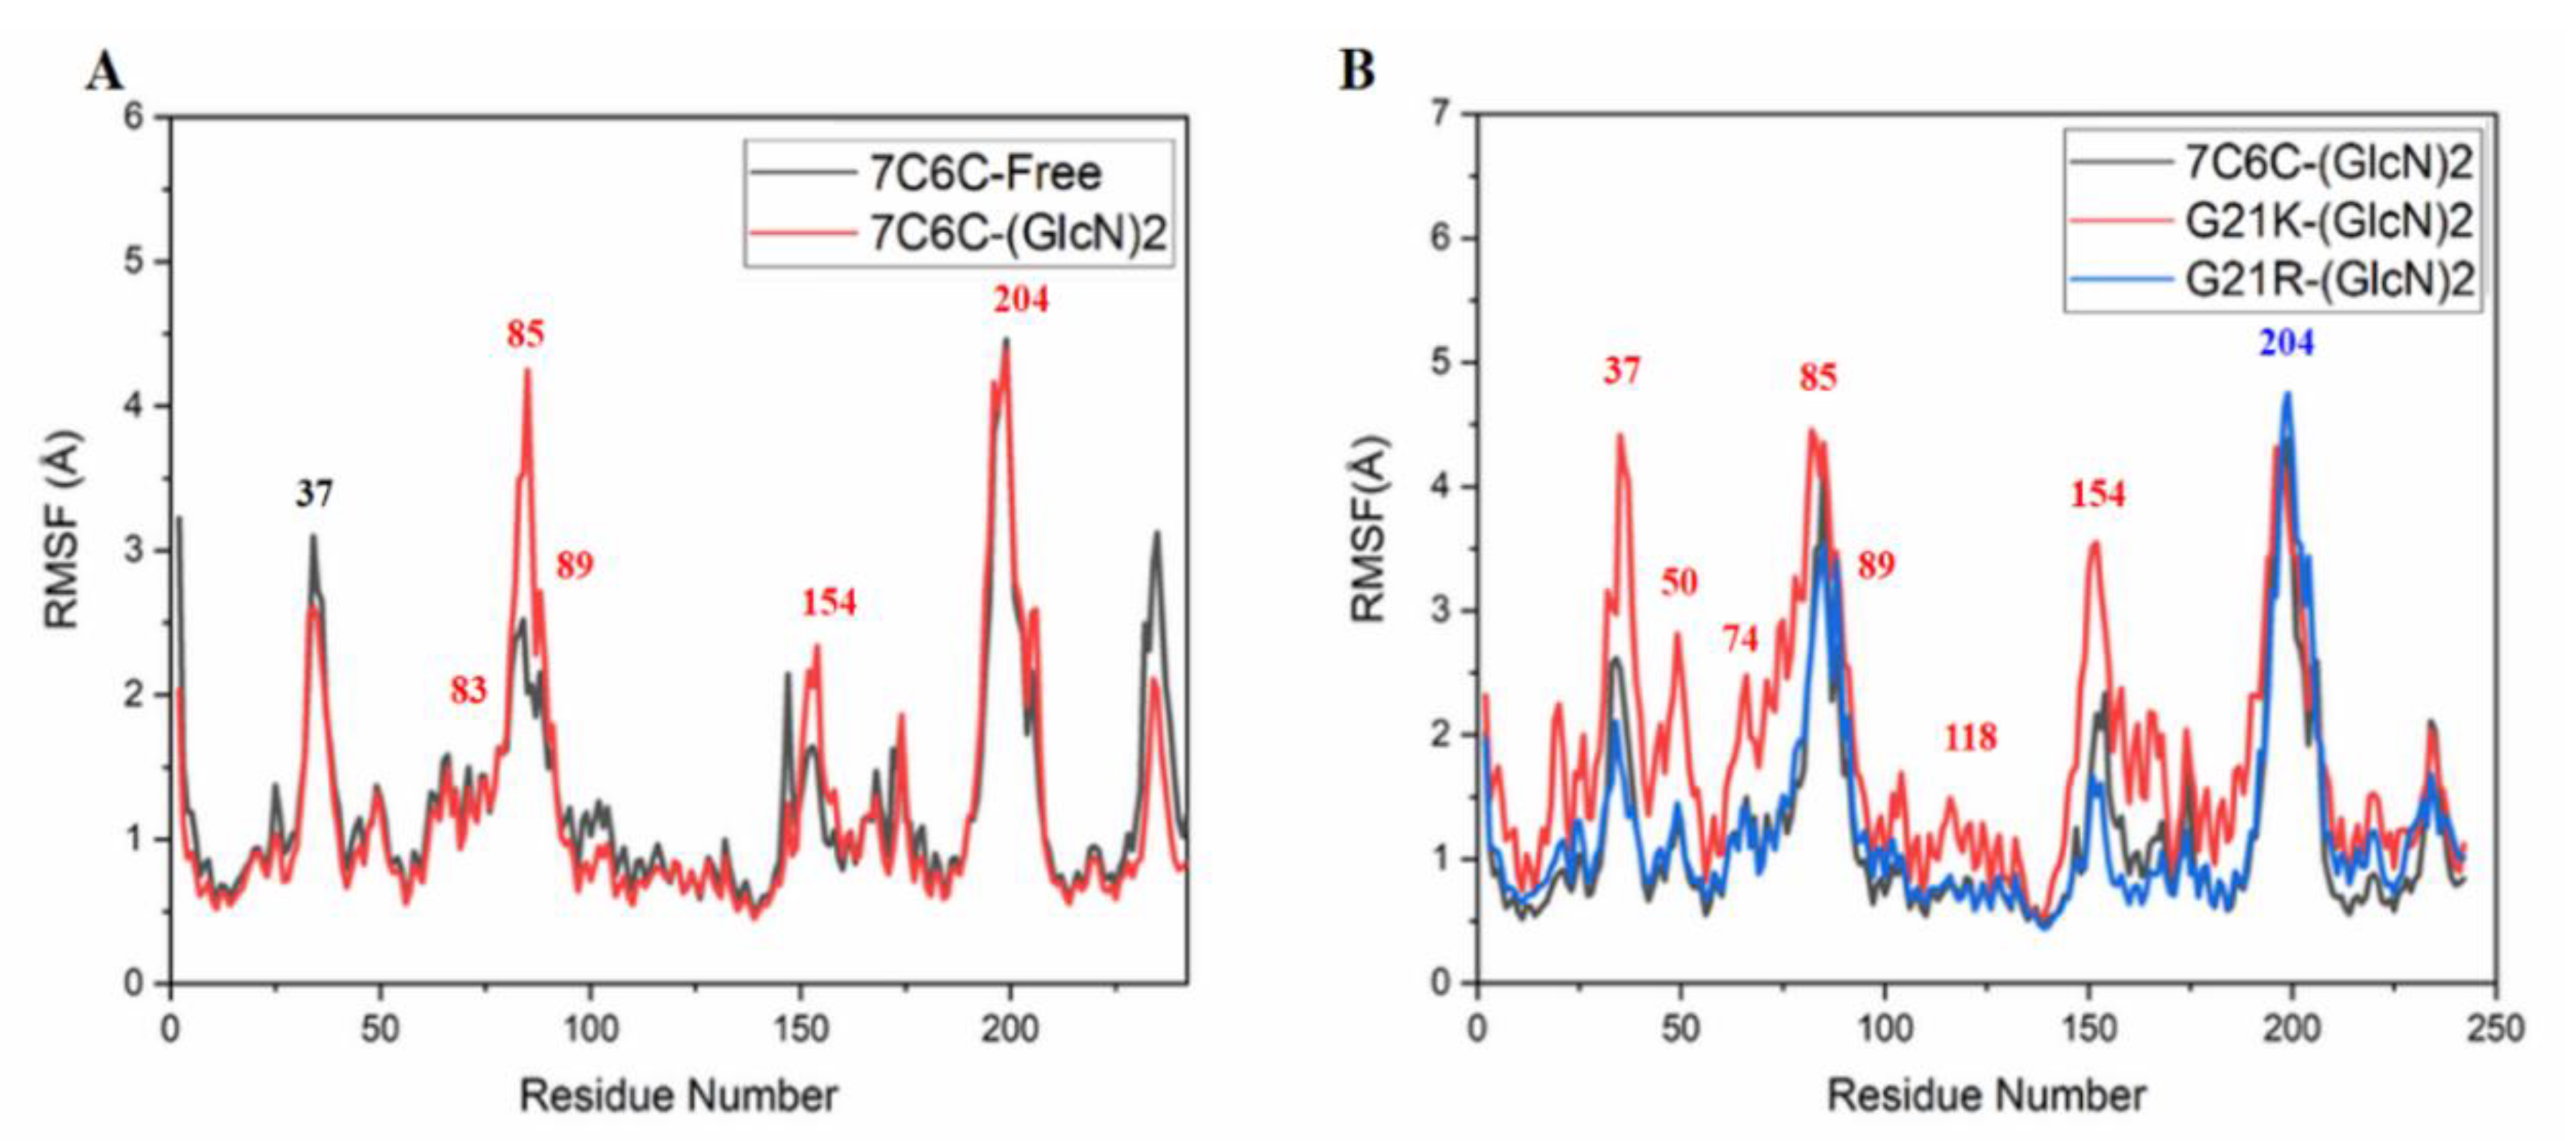
Compared with free CSNMY002, binding to (GLCN)
2 induced changes in residues 83–89 (
Figure 6A), and differences were observed in the active site region. The RMSF value of the G21R mutant and free WT were almost the same and only showed a strong fluctuation at the active site Trp204. In contrast, the G21K mutant showed strong fluctuations during the MD simulations at Arg37, Thr50, Tyr118 and Trp204.
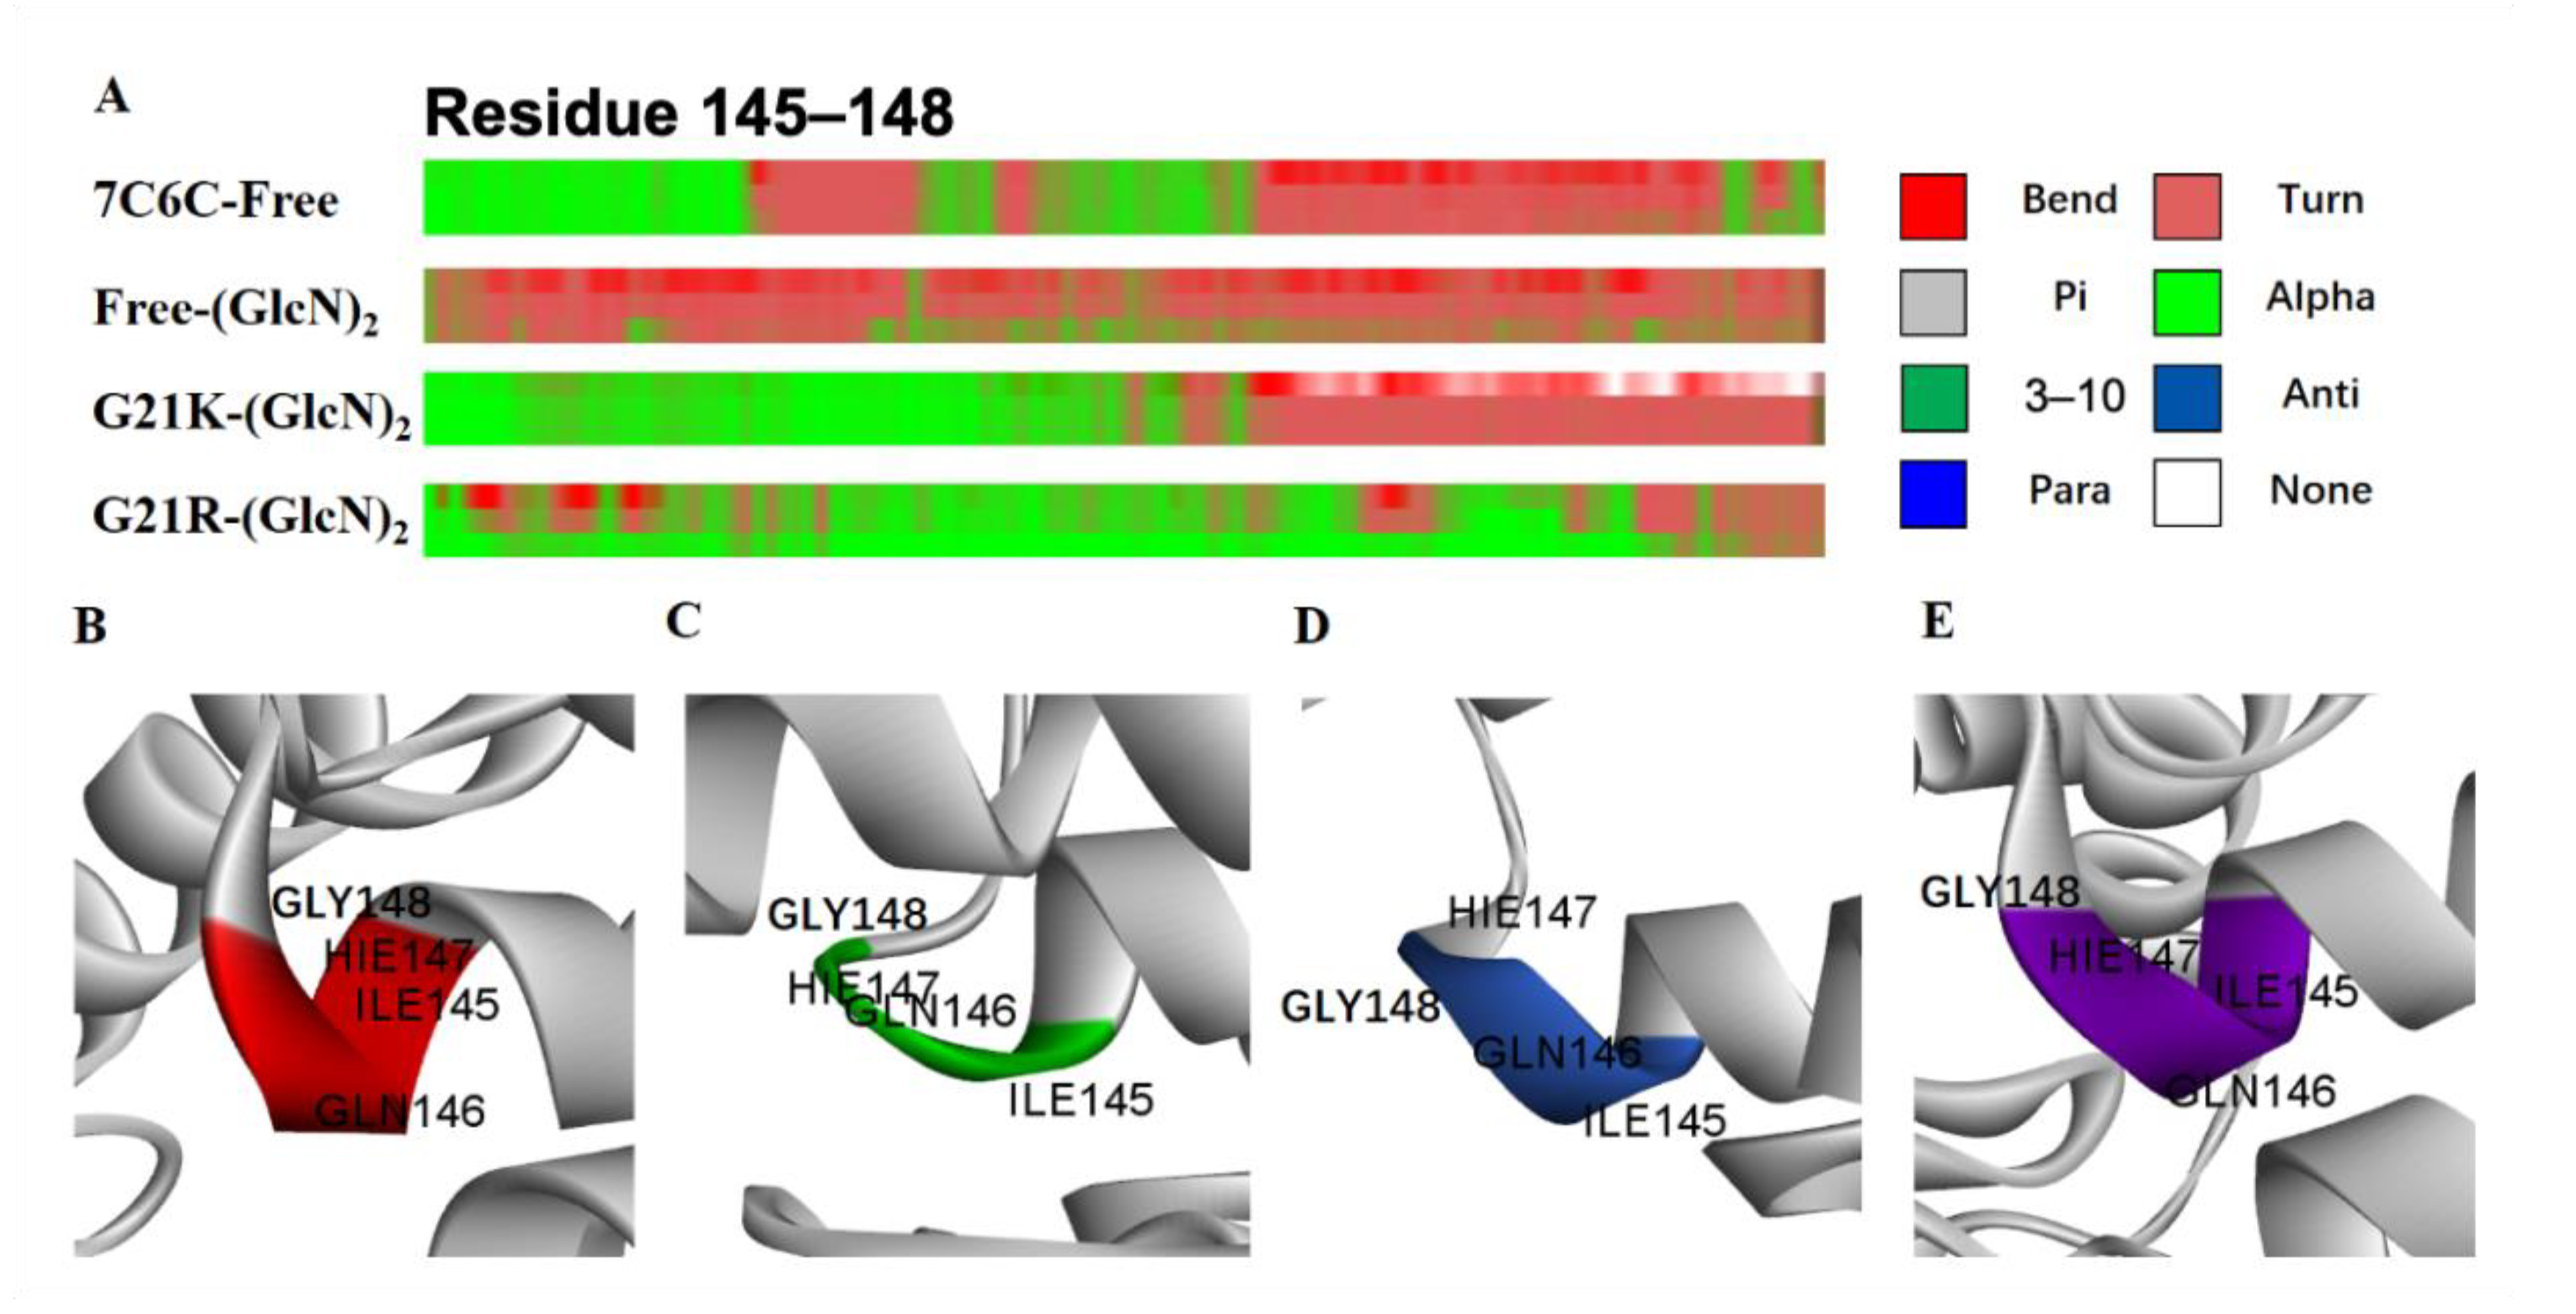
The secondary structure change probability is shown in (
Figure 7A–E).
In two mutants, the α-helices remained unchanged in the Ile145-Gly148 domain (
Table 1). In the free WT, the α-helices in the inner part dropped and sharply formed a loop. Residues Ile145-Gly148 located at the α6 region contain key catalytic residues at subsites −1 and +1. In both mutants, the enhanced helix probability may increase the tunnel length of the α6 helix, which may facilitate sliding of the substrate into the tunnel.
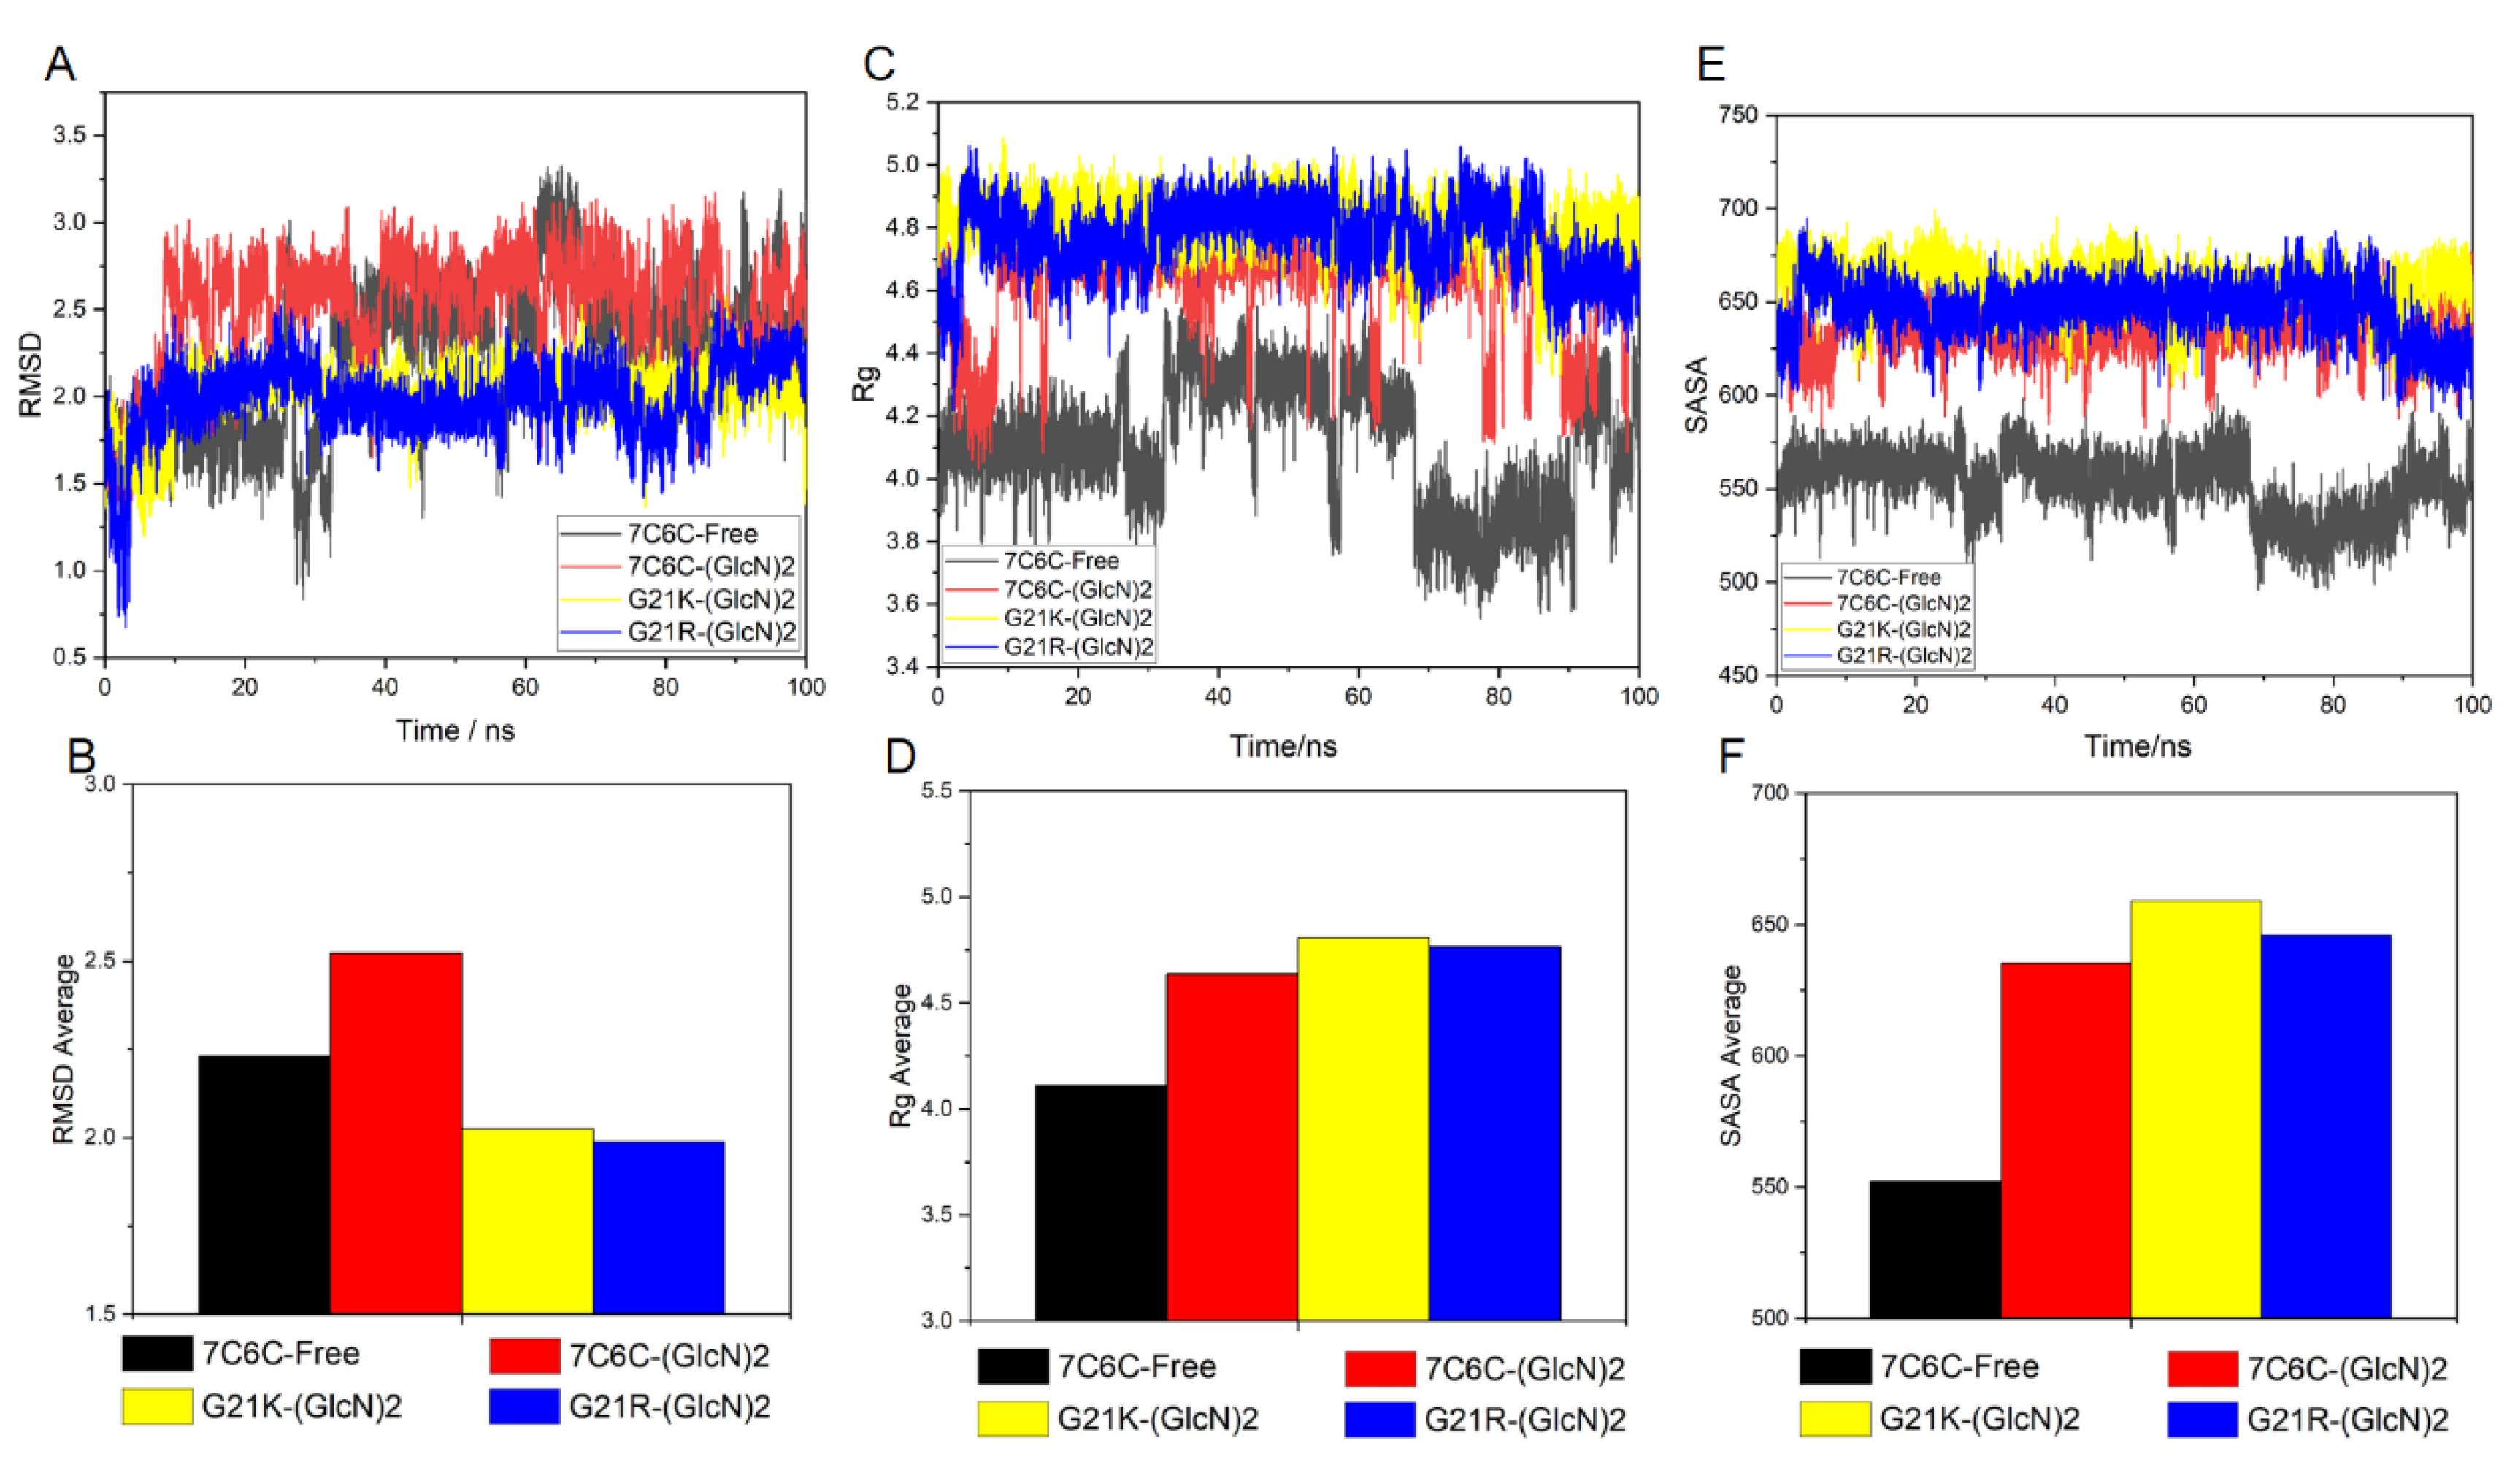
The amino acid residues of the Ile145-Gly148 fragment were used to analyze RMSD, Rg and SASA. The RMSD value of the free protein fluctuated, especially around 60 ns (
Figure 8A,B), but that of the three complexes was more stable. The Rg of the free protein in this region was smaller than in the three complexes (
Figure 8C,D), where it increased after binding the substrate, especially those involving the two mutant complex systems. The SASA of the free protein in this region was lower, whereas the hydrophilicity of the three complex systems increased. The SASA values of the two mutants showed an increase (
Figure 8E,F).
Protein active pocket analysis is important to study protease activity. The active pocket region in the MD simulation was calculated using POCASA [
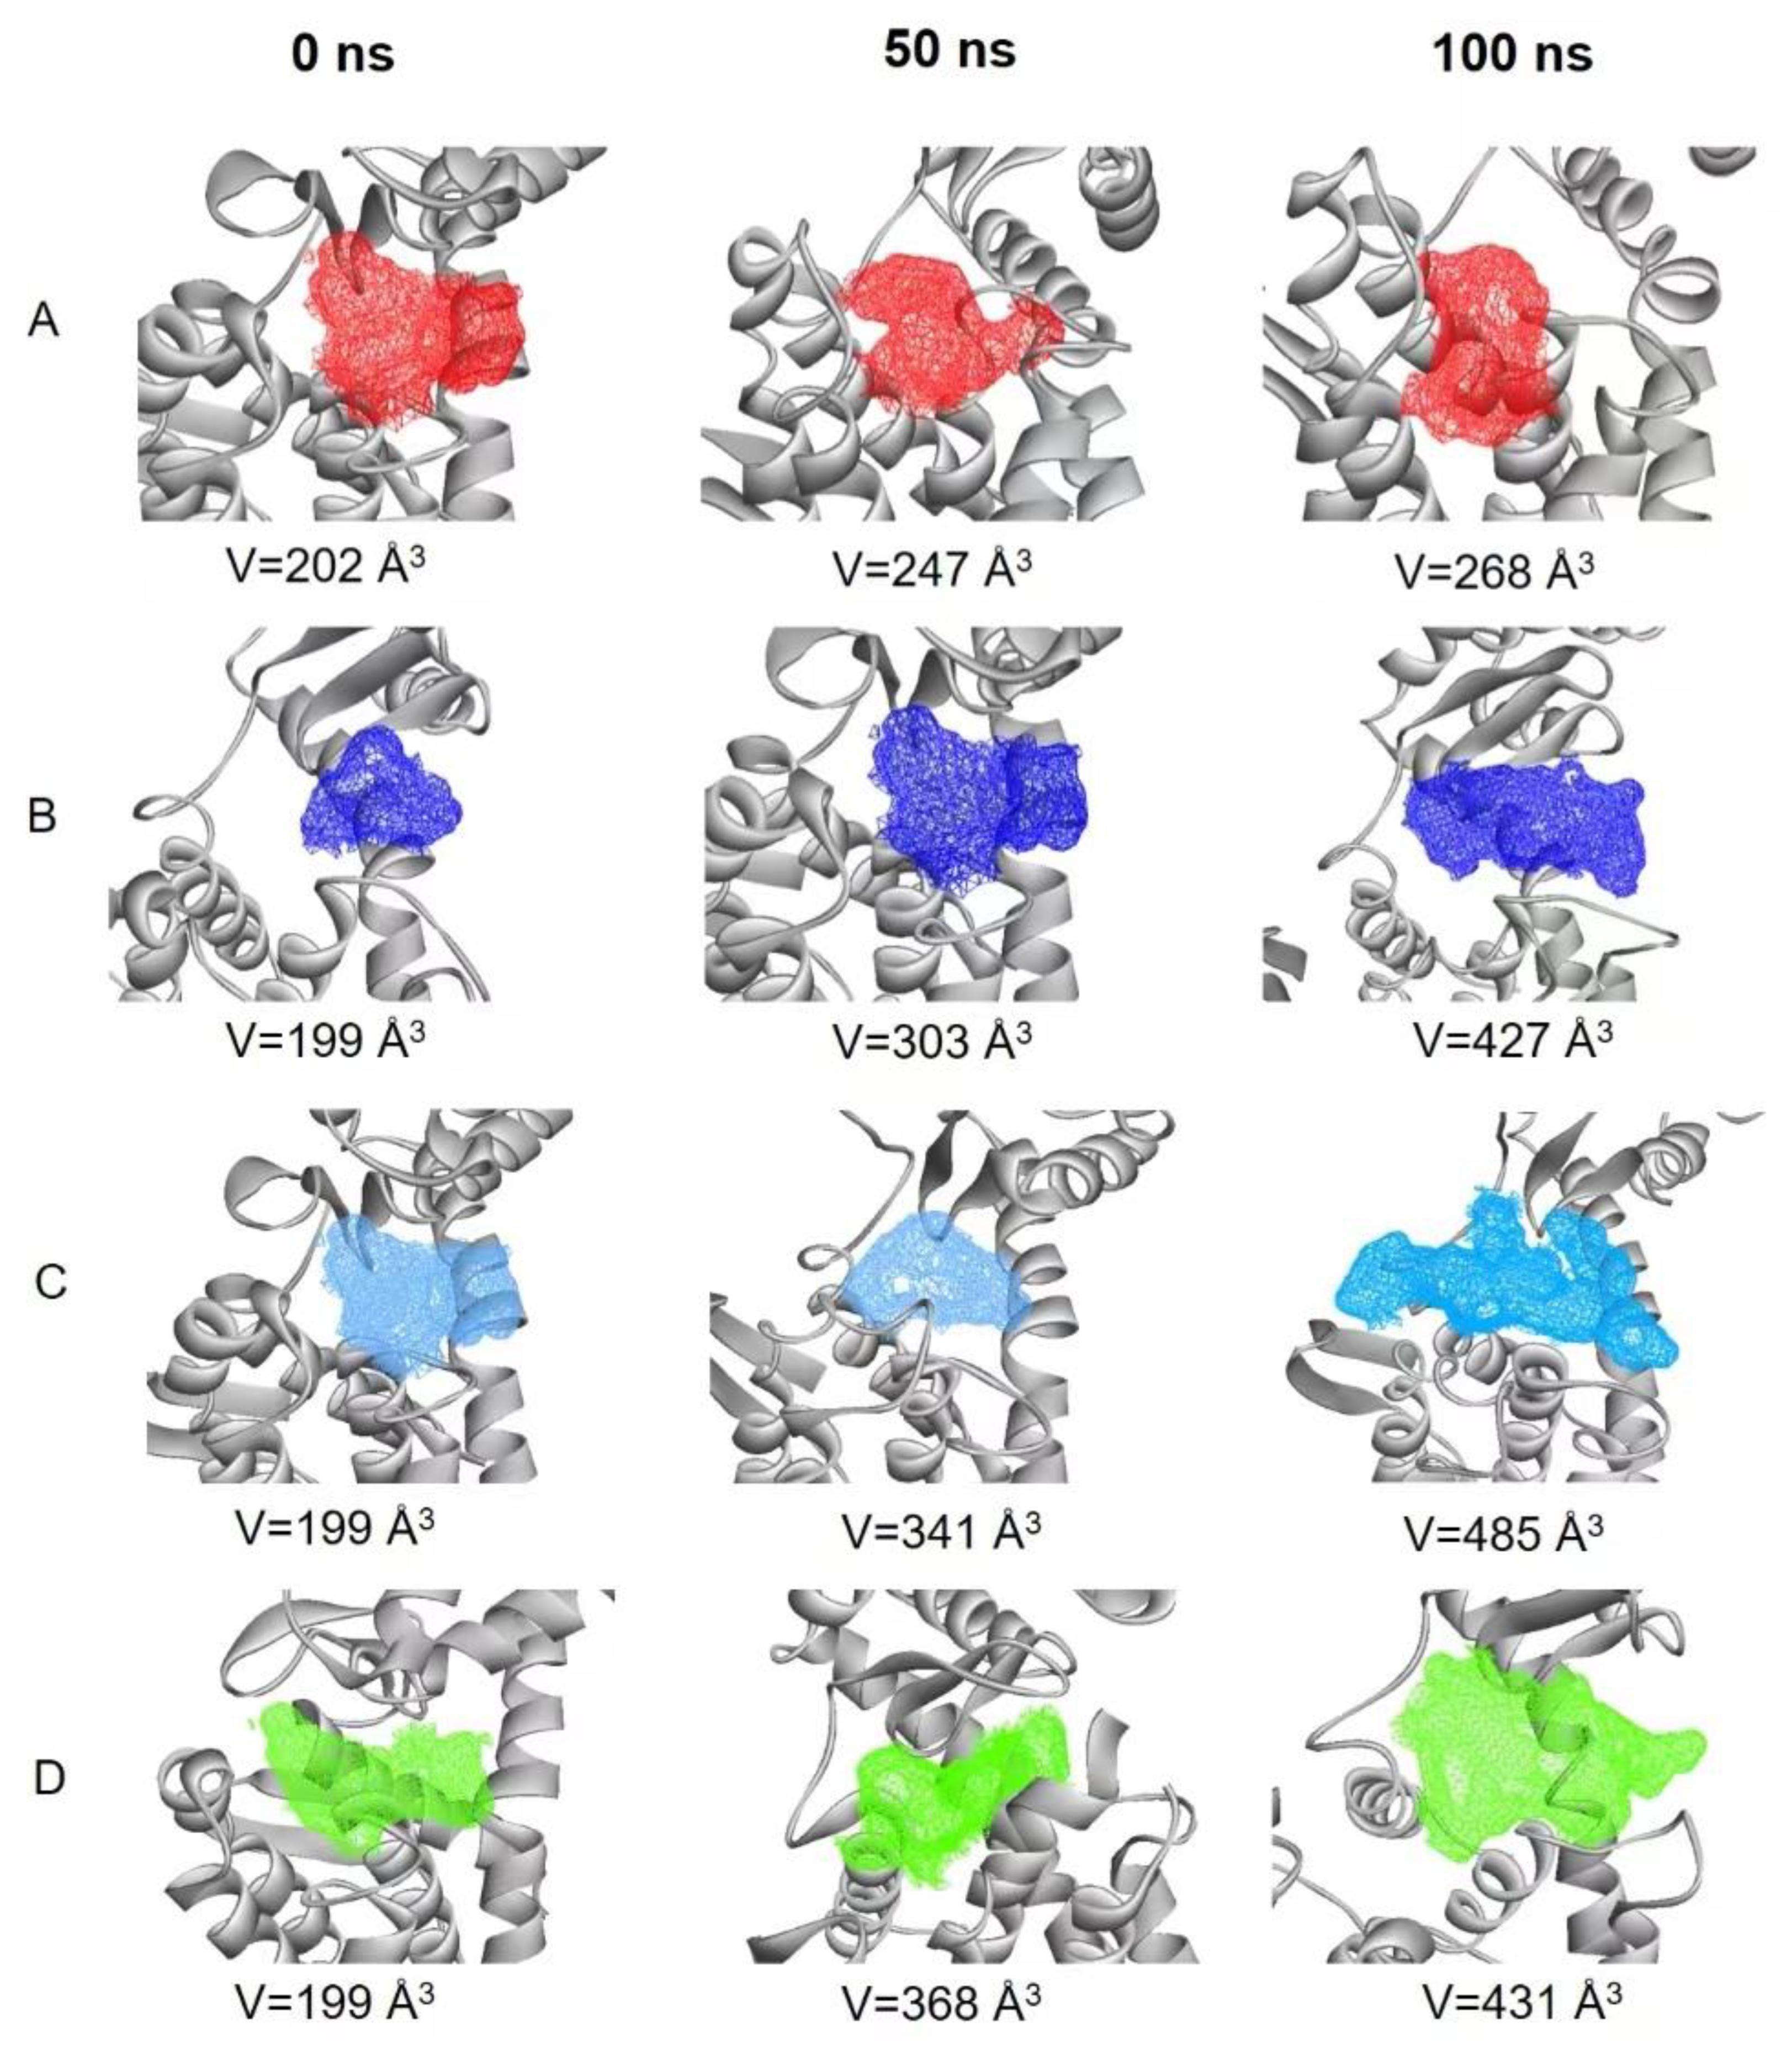
15]. Changes in active pocket volume were examined after 0, 50 and 100 ns (
Figure 9A–D). Compared with the free protein, the active pocket volumes of the three complex systems increased. In the two mutants, they were bigger than in the 7C6C-(GlcN)
2 complex, which may be useful for the substrate to slide into and to start the catalytic reaction. This may be one of the reasons for the improvement of enzyme activity in the two mutants.
2.4. Cross-Correlation Analysis
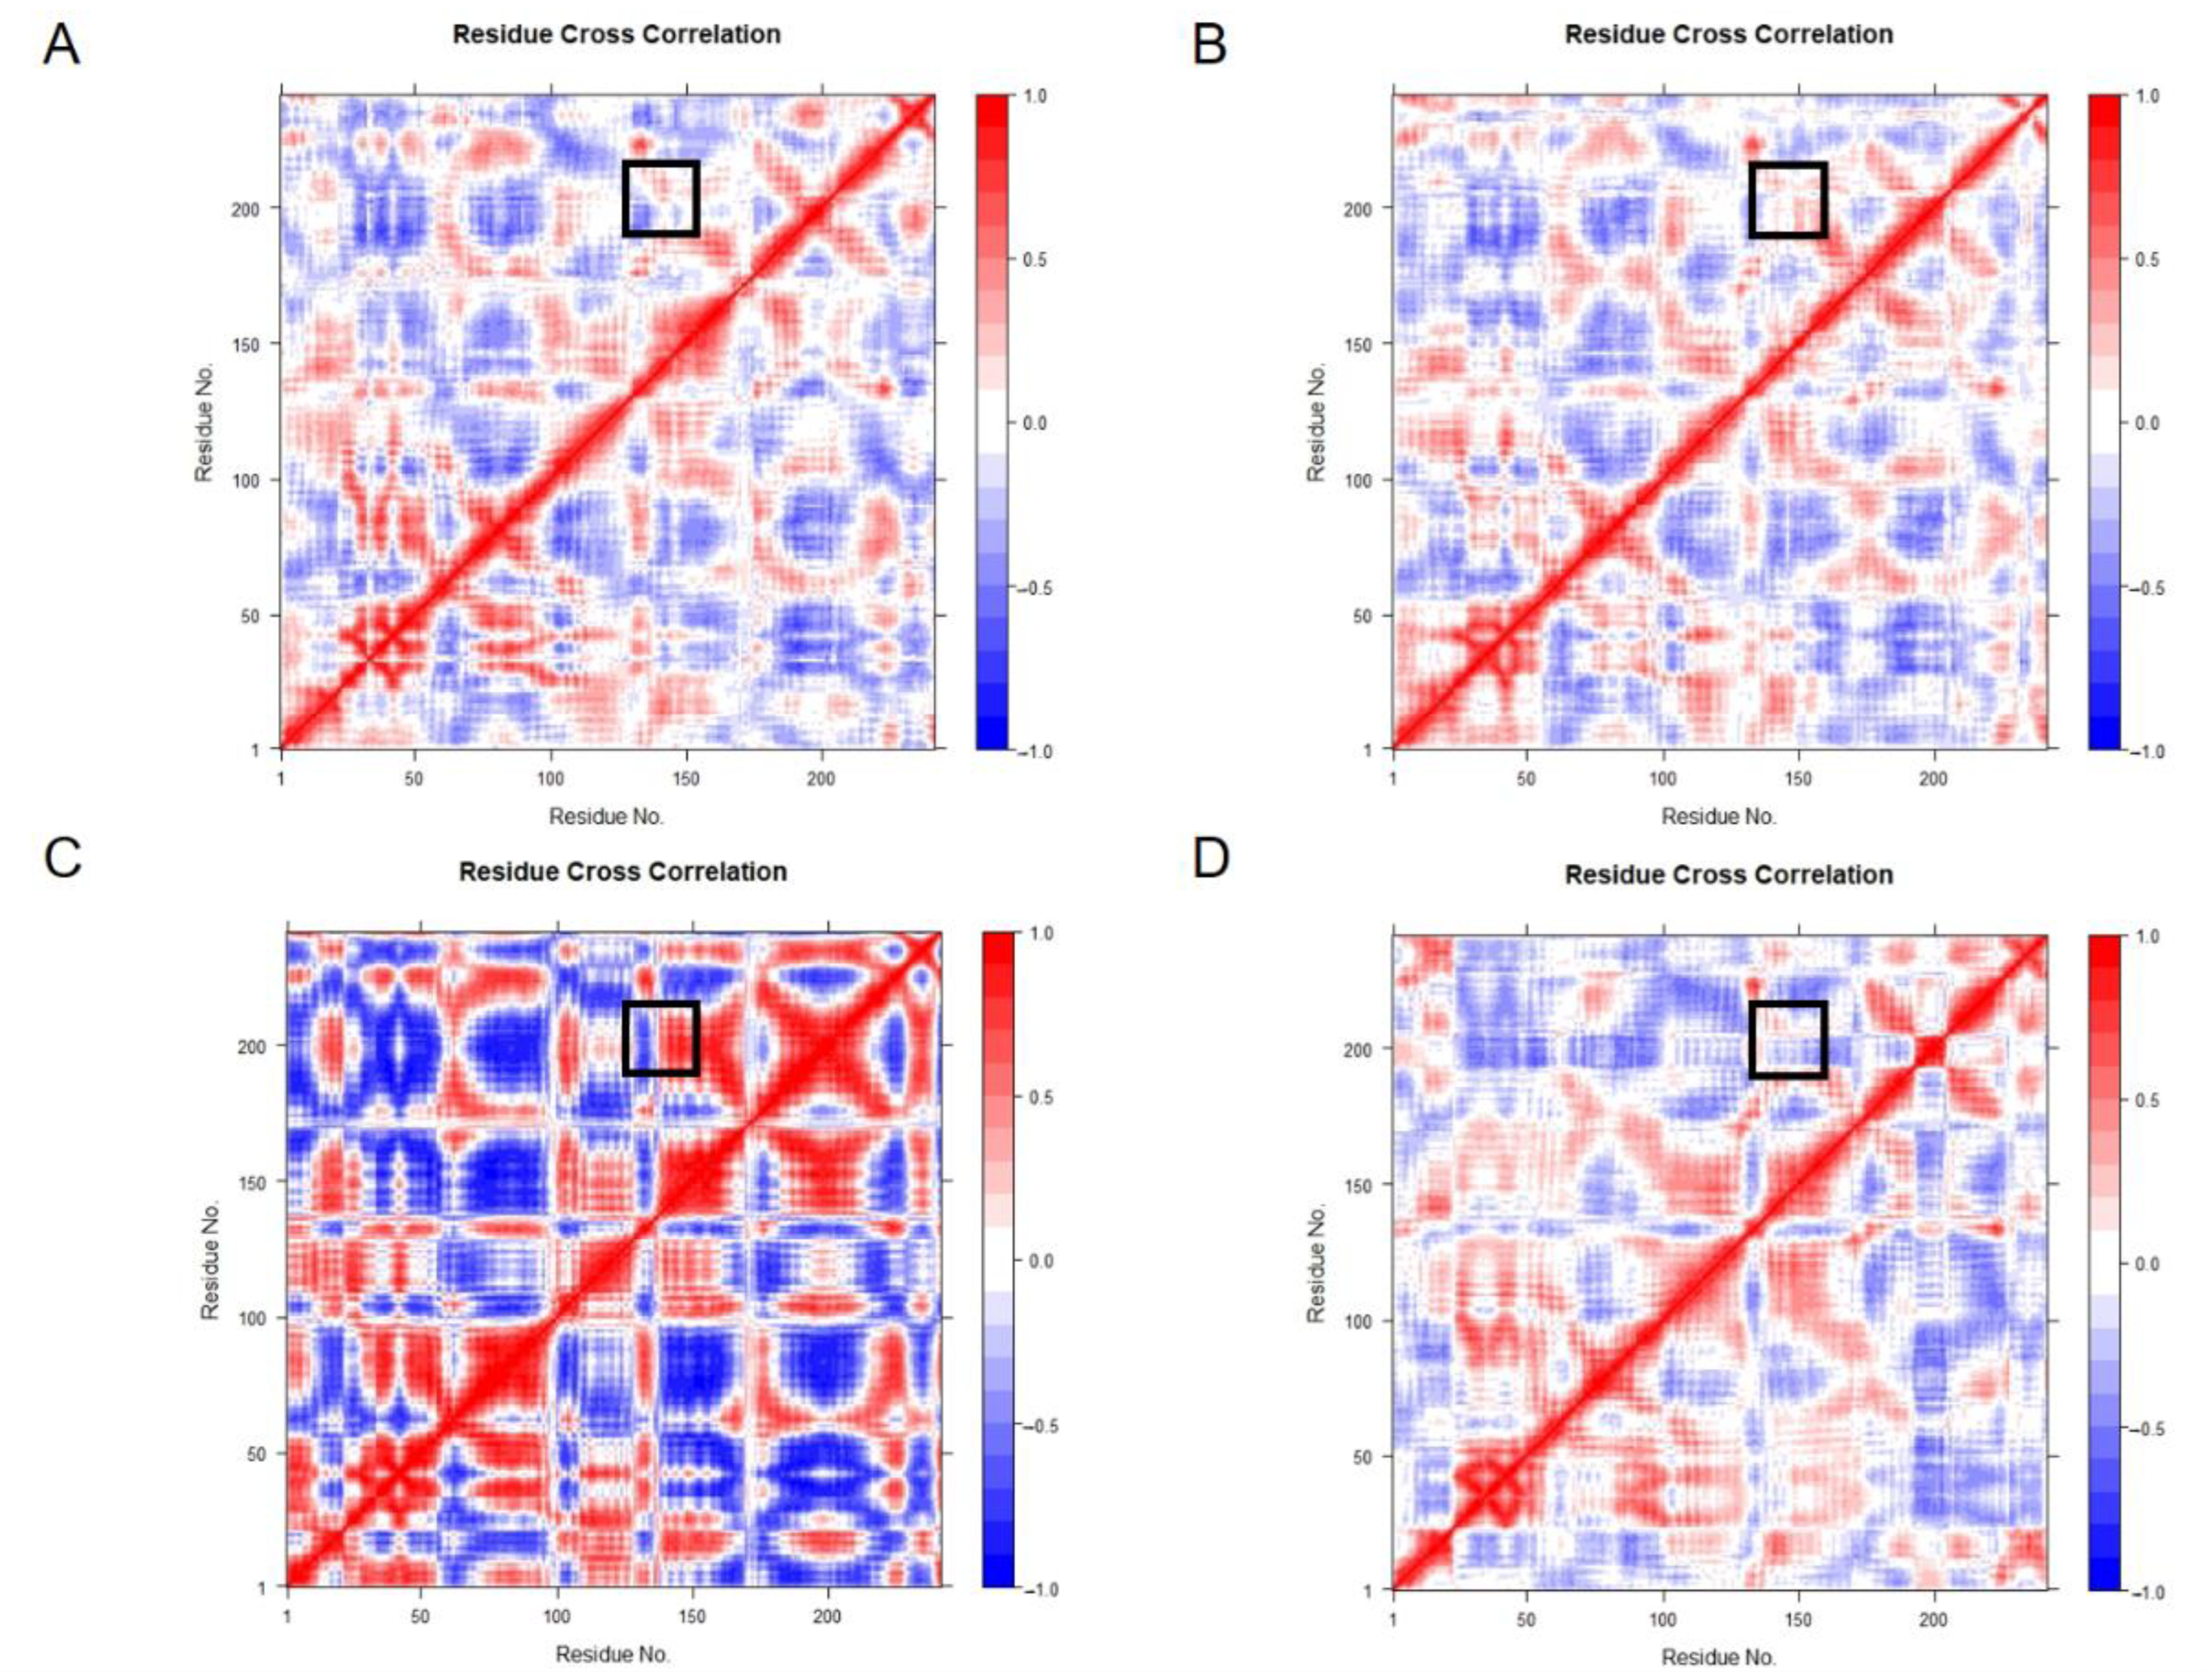
Cross-correlation matrix analysis can find protein regions that experience large conformational changes. The G21K-(GlcN)
2 complex showed more flexibility in the MD simulations, whereas Ile145-Gly148 were negatively correlated in the G21K-(GlcN)
2 system (
Figure 10A–D).
2.5. MM-PBSA Calculation
To confirm these results, the binding free energies of the protein–ligand complexes in 7C6C-(GlcN)
2, G21K-(GlcN)
2 and G21R-(GlcN)
2 were calculated with MM-PBSA, showing nonbonded van der Waals (ΔE
vdW), nonbonded electrostatic (ΔE
ele) interactions and binding free energy (ΔG
bind) (
Table 2). Mutants showed lower binding free energy, indicating more favorable binding to substrates and improved catalytic ability, confirming previous experimental results.
3. Methods
3.1. System Preparation
The structure of chitosanase CSNMY002 (PDB: 7C6C) [
14] was obtained from the protein database
www.rcsb.org (accessed on 21 December 2021). The structures of Chitodisaccharide (GlcN)
2 and Chitohexose (GlcN)
6 were downloaded from the PubChem database (
https://PubChem.ncbi.nlm.nih.gov (accessed on 21st December 2021)) (PUBCHEM CID: 91859334, 100978292) [
16]. After removing water and ligand from the protein, mutations at residue 21 were introduced using Chimera Software [
17].
3.2. Molecular Docking
The substrate was docked to CSNMY002 with AutoDock 4.2 software [
18,
19,
20,
21]. The grid size was set to 60 × 50 × 60 Å and spacing between grid points was 0.375 Å. After docking, protein–ligand complexes with the lowest energy were selected and used for subsequent molecular dynamics simulations.
3.3. Molecular Dynamics Simulations
Amber 16 software [
22,
23] was used to simulate the systems consisting of free WT, WT-(GlcN)
2, G21K-(GlcN)
2 and G21R-(GLCN)
2 for 100 ns. The force field for the protein was Amber FF99SB [
24,
25], whereas for (GLCN)
2 it was GAFF2 [
26,
27]. The TIP3P model [
28,
29] was used, and periodic boundary conditions were applied to the reaction system during the simulation. Because the net charge in the initial reaction system is not zero, Na
+ was added in the initial stage of the simulation. The information of each system is listed in
Table 3.
After the system was built, it was energy-minimized using the steepest descent and a conjugate gradient method, each with 500 steps. After this minimization, the initial structure was stable. The temperature of the simulated reaction was raised from 0 to 300 K in 50 ps. At the end of heating, the system was left to react for another 50 ps. Finally, the system was equilibrated with constant pressure under NPT condition [
30,
31,
32], with a constant pressure balance of 500 ps at 300 K. This was the last step for the system balance, which took 2 fs. After stabilization of all the thermodynamic parameters, a 100 ns MD simulation was performed for each system, collecting data every 1 fs, with a storage interval of 2 ps/interval and a total of 10,000 frames.
AutoDockTools 1.5.6 was used for the six molecular docking systems. The results of molecular docking were visualized with Pymol 2.4.0. Data from four MD systems were collected and analyzed for protein structure fluctuation, combined with analysis of pocket volume, stretch kinetics and secondary structure. Trajectory analyses were computed using Amber16′s CPPTRAJ module [
15] and included RMSD, radius of gyration, RMSF, SASA and dictionary of secondary structures. The cross-correlation matrix of the trajectory was generated with Tcl script in VMD, and its eigenvector and eigenvalue were calculated [
33,
34].
3.4. MM-PBSA
The MM-PBSA method [
35] was used to predict binding free energies and relative stabilities of the models [
36]. Binding free energies were calculated using the MM-PBSA method in AMBER 16. A total of 100 snapshots were chosen evenly from the MD trajectory. Total binding energy (ΔG
bind) was computed using the equation:
where ΔGbind is the binding free energy between protein and ligand, calculated as the difference between the total free energy of the complex (Gcomplex) and the sum of the free energy of protein (Gprotein) and ligand (Gligand). The binding energy is expressed as the combination of enthalpy and entropy terms:
where TΔS refers to the entropic contribution to the free energy in a vacuum, and T and S are temperature and entropy, respectively. The changes in protein and ligand upon binding were similar in all complexes, with very small entropy differences; therefore, the calculation of the solvate entropy term is omitted.
where E
MM is the molecular mechanics energy of the molecule expressed as the sum of internal energy and electrostatic and van der Waals energies.
The solvation free energy is the sum of polar and nonpolar contributions:
where G
nonpolar is calculated from the solvent-accessible surface area (SASA):
Here, γ = 0.0072 kcal/mol/Å, and b = 0 kcal/mol.
4. Conclusions
First, binding of substrate can activate the protein, changing the conformation of the active and catalytic regions. The combination of chitosaccharide and chitosanase can effectively stabilize the structure of chitosanase during the reaction and enhance its stability. The point mutation of residue 21 changed the original properties of regions 145–148 and 198–208. When combined with the substrate, the segment underwent obvious stretching deformation, thus changing the initial wave condition. In chitosanase CSNMY002, the active region recruits Chitosan molecules through stretching and deformation. When Chitodisaccharide or Chitohexose docks and reacts with CSNMY002, a tight interaction network forms, and Chitosan is degraded.
Second, point mutations such as G21K and G21R lead to conformational changes of the original degradation site and a changed degree of polymerization of the final degradation product. In the two mutants, the helical augmentation effect effectively inhibited the catalytic action of the original specificity on the +1/−1 site and at the same time increased the tunnel length of the α6 helix, which made the hydrogen bond network between chitosanase and chitosan molecules more stable and closer.
Finally, in this enzyme, Arg37, Ile145-Gly148 and Trp204 are important catalytic residues, and Arg37 forms two stable hydrogen bonds with the -1 site which helps to form a tighter complex with Chitosan. Ile145-Gly148 is an important binding and catalytic site, which can catalytically degrade the β-(1,4)-glycosidic bond under the synergistic action of Glu19 sites while binding the +1/−1 sites. Trp204, located in the α9 helix, is also an important site for degradation, which can be induced by the synergistic action of Lys21 or Arg21. These sites are potential target sites for CSNMY002 optimization.
Author Contributions
Conceptualization, J.L. and C.W.; methodology, S.X.; software, K.L.; validation, C.W., J.L. and C.W; formal analysis, J.L.; investigation, J.L.; resources, C.W.; data curation, Y.M.; writing—Original draft preparation, J.L.; writing review and editing, C.W.; visualization, Y.M.; supervision, X.F.; project administration, S.X.; funding acquisition, X.F. All authors have read and agreed to the published version of the manuscript.
Funding
This work was supported by the National Key Research and Development Program of China (2021YFA1500400 to Xueqi Fu), and Science & Technology Development Project in Jilin Province of China (20210101004JC to Shu Xing).
Institutional Review Board Statement
Not applicable.
Informed Consent Statement
Not applicable.
Data Availability Statement
Not applicable.
Acknowledgments
The authors would like to express their gratitude to EditSprings (
https://www.editsprings.cn (accessed on 7 Decemer 2022)) for the expert linguistic services provided.
Conflicts of Interest
The authors declare no conflict of interest.
References
- Sun, T.; Yao, Q.; Zhou, D.; Mao, F. Antioxidant activity of N-carboxymethyl chitosan oligosaccharides. Bioorg. Med. Chem. Lett. 2008, 18, 5774–5776. [Google Scholar] [CrossRef] [PubMed]
- Benchamas, G.; Huang, G.; Huang, S.; Huang, H. Preparation and biological activities of chitosan oligosaccharides. Trends Food Sci. Technol. 2021, 107, 38–44. [Google Scholar] [CrossRef]
- Wiczorek, A.S.; Hetz, S.A.; Kolb, S. Microbial responses to chitin and chitosan in oxic and anoxic agricultural soil slurries. Biogeosciences 2014, 11, 9–3352. [Google Scholar] [CrossRef]
- Qin, Z.; Luo, S.; Li, Y.; Chen, Q.; Qiu, Y.; Zhao, L.; Jiang, L.; Zhou, J. Biochemical properties of a novel chitosanase from Bacillus amyloliquefaciens and its use in membrane reactor. Lwt 2018, 97, 9–16. [Google Scholar] [CrossRef]
- Shi, L.; Fang, B.; Yong, Y.; Li, X.; Gong, D.; Li, J.; Yu, T.; Gooneratne, R.; Gao, Z.; Li, S.; et al. Chitosan oligosaccharide-mediated attenuation of LPS-induced inflammation in IPEC-J2 cells is related to the TLR4/NF-κB signaling pathway. Carbohydr. Polym. 2019, 219, 269–279. [Google Scholar] [CrossRef]
- Kong, S.Z.; Li, D.D.; Luo, H.; Li, W.J.; Huang, Y.M.; Li, J.C.; Hu, Z.; Huang, N.; Guo, M.H.; Chen, Y.; et al. Anti-photoaging effects of chitosan oligosaccharide in ultraviolet-irradiated hairless mouse skin. Exp. Gerontol. 2018, 103, 27–34. [Google Scholar] [CrossRef]
- Chen, P.; Zhao, M.; Chen, Q.; Fan, L.; Gao, F.; Zhao, L. Absorption Characteristics of Chitobiose and Chitopentaose in the Human Intestinal Cell Line Caco-2 and Everted Gut Sacs. J. Agric. Food Chem. 2019, 67, 4513–4523. [Google Scholar] [CrossRef]
- Hafsa, J.; Smach, M.A.; Mrid, R.B.; Sobeh, M.; Majdoub, H.; Yasri, A. Functional properties of chitosan derivatives obtained through Maillard reaction: A novel promising food preservative. Food Chem. 2021, 349, 129072. [Google Scholar] [CrossRef]
- Bhuvanachandra, B.; Sivaramakrishna, D.; Alim, S.; Preethiba, G.; Rambabu, S.; Swamy, M.J.; Podile, A.R. New Class of chitosanase from Bacillus amyloliquefaciens for the Generation of Chitooligosaccharides. J. Agric. Food Chem. 2021, 69, 78–87. [Google Scholar] [CrossRef]
- Ding, M.; Zhang, T.; Sun, C.; Zhang, H.; Zhang, Y. A chitosanase mutant from Streptomyces sp. N174 prefers to produce functional chitopentasaccharide. Int. J. Biol. Macromol. 2020, 151, 1091–1098. [Google Scholar] [CrossRef]
- Li, Q.; Wang, T.; Ye, Y.; Guan, S.; Cai, B.; Zhang, S.; Rong, S. A temperature-induced chitosanase bacterial cell-surface display system for the efficient production of chitooligosaccharides. Biotechnol. Lett. 2021, 43, 1625–1635. [Google Scholar] [CrossRef] [PubMed]
- Fukamizo, T.; Ohkawa, T.; Ikeda, Y.; Goto, S. Specificity of chitosanase from Bacillus pumilus. Biochim. Biophys. Acta. 1994, 1205, 183–188. [Google Scholar] [CrossRef] [PubMed]
- Shinya, S.; Fukamizo, T. Interaction between chitosan and its related enzymes: A review. Int. J. Biol. Macromol. 2017, 104 Pt B, 1422–1435. [Google Scholar] [CrossRef]
- Li, Y.; Gou, Y.; Liu, Z.; Xie, T.; Wang, G. Structure-based rational design of chitosanase CsnMY002 for high yields of chitobiose. Colloids Surf. B Biointerfaces 2021, 202, 111692. [Google Scholar] [CrossRef] [PubMed]
- Roe, D.R.; Cheatham, T.E. PTRAJ and CPPTRAJ: Software for Processing and Analysis of Molecular Dynamics Trajectory Data. J. Chem. Theory Comput. 2013, 9, 3084–3095. [Google Scholar] [CrossRef]
- Kim, S.; Thiessen, P.A.; Bolton, E.E.; Chen, J.; Fu, G.; Gindulyte, A.; Han, L.; He, J.; He, S.; Shoemaker, B.A.; et al. PubChem Substance and Compound databases. Nucleic Acids Res. 2016, 44, D1202–D1213. [Google Scholar] [CrossRef]
- Pettersen, E.F.; Goddard, T.D.; Huang, C.C.; Couch, G.S.; Greenblatt, D.M.; Meng, E.C.; Ferrin, T.E. UCSF Chimera—A visualization system for exploratory research and analysis. J. Comput. Chem. 2004, 25, 1605–1612. [Google Scholar] [CrossRef]
- Huey, R.; Morris, G.M.; Olson, A.J.; Goodsell, D.S. A semiempirical free energy force field with charge-based desolvation. J. Comput. Chem. 2007, 28, 1145–1152. [Google Scholar] [CrossRef]
- Goodsell, D.S.; Morris, G.M.; Olson, A.J. Automated docking of flexible ligands: Applications of AutoDock. J. Mol. Recognit. 1996, 9, 1–5. [Google Scholar] [CrossRef]
- Morris, G.M.; Goodsell, D.S.; Halliday, R.S.; Huey, R.; Hart, W.E.; Belew, R.K.; Olson, A.J. Automated docking using a Lamarckian genetic algorithm and an empirical binding free energy function. J. Comput. Chem. 1998, 19, 1639–1662. [Google Scholar] [CrossRef]
- Zhan, D.; Wang, D.; Min, W.; Han, W. Exploring the molecular basis for selective binding of homoserine dehydrogenase from Mycobacterium leprae TN toward inhibitors: A virtual screening study. Int. J. Mol. Sci. 2014, 15, 1826–1841. [Google Scholar] [CrossRef] [PubMed]
- Case, D.A.; Cerutti, D.S.; Cheatham, T.E., III; Darden, T.A.; Duke, R.E.; Gohlke, H.; Goetz, A.W.; Homeyer, N.; Izadi, S.; Janowski, P.; et al. AMBER; University of California: San Francisco, CA, USA, 2016. [Google Scholar]
- Li, C.; Liu, K.; Chen, S.; Han, L.; Han, W. Gaussian Accelerated Molecular Dynamics Simulations Investigation on the Mechanism of Angiotensin-Converting Enzyme (ACE) C-Domain Inhibition by Dipeptides. Foods 2022, 11, 327. [Google Scholar] [CrossRef] [PubMed]
- Maier, J.A.; Martinez, C.; Kasavajhala, K.; Wickstrom, L.; Hauser, K.E.; Simmerling, C. ff14SB: Improving the Accuracy of Protein Side Chain and Backbone Parameters from ff99SB. J. Chem. Theory Comput. 2015, 11, 3696–3713. [Google Scholar] [CrossRef]
- Cino, E.A.; Choy, W.Y.; Karttunen, M. Comparison of Secondary Structure Formation Using 10 Different Force Fields in Microsecond Molecular Dynamics Simulations. J. Chem. Theory Comput. 2012, 8, 2725–2740. [Google Scholar] [CrossRef]
- Vassetti, D.; Pagliai, M.; Procacci, P. Assessment of GAFF2 and OPLS-AA General Force Fields in Combination with the Water Models TIP3P, SPCE, and OPC3 for the Solvation Free Energy of Druglike Organic Molecules. J. Chem. Theory Comput. 2019, 15, 1983–1995. [Google Scholar] [CrossRef]
- Machireddy, B.; Kalra, G.; Jonnalagadda, S.; Ramanujachary, K.; Wu, C. Probing the Binding Pathway of BRACO19 to a Parallel-Stranded Human Telomeric G-Quadruplex Using Molecular Dynamics Binding Simulation with AMBER DNA OL15 and Ligand GAFF2 Force Fields. J. Chem. Inf. Model. 2017, 57, 2846–2864. [Google Scholar] [CrossRef]
- Sengupta, A.; Li, Z.; Song, L.F.; Li, P.; Merz, K.M., Jr. Parameterization of Monovalent Ions for the OPC3, OPC, TIP3P-FB, and TIP4P-FB Water Models. J. Chem. Inf. Model. 2021, 61, 869–880. [Google Scholar] [CrossRef]
- Huggins, D.J. Correlations in liquid water for the TIP3P-Ewald, TIP4P-2005, TIP5P-Ewald, and SWM4-NDP models. J. Chem. Phys. 2012, 136, 064518. [Google Scholar] [CrossRef]
- Ströker, P.; Hellmann, R.; Meier, K. Systematic formulation of thermodynamic properties in the NpT ensemble. Phys Rev E. 2021, 103, 023305. [Google Scholar] [CrossRef]
- Cuendet, M.A. The Jarzynski identity derived from general Hamiltonian or non-Hamiltonian dynamics reproducing NVT or NPT ensemles. J. Chem. Phys. 2006, 125, 144109. [Google Scholar] [CrossRef] [PubMed]
- Aslyamov, T.; Akhatov, I. Zeros of partition functions in the NPT ensemble. Phys. Rev. E 2019, 100, 052118. [Google Scholar] [CrossRef] [PubMed]
- Yu, Z.; Su, H.; Chen, J.; Hu, G. Deciphering Conformational Changes of the GDP-Bound NRAS Induced by Mutations G13D, Q61R, and C118S through Gaussian Accelerated Molecular Dynamic Simulations. Molecules 2022, 27, 5596. [Google Scholar] [CrossRef] [PubMed]
- Chen, J.; Zeng, Q.; Wang, W.; Sun, H.; Hu, G. Decoding the Identification Mechanism of an SAM-III Riboswitch on Ligands through Multiple Independent Gaussian-Accelerated Molecular Dynamics Simulations. J. Chem. Inf. Model. 2022, 62, 6118–6132. [Google Scholar] [CrossRef]
- KuKmari, R.; Kumar, R. Open Source Drug Discovery Consortium, Lynn, A. g_mmpbsa--a GROMACS tool for high-throughput MM-PBSA calculations. J. Chem. Inf. Model. 2014, 54, 1951–1962. [Google Scholar] [CrossRef] [PubMed]
- Kollman, P.A.; Massova, I.; Reyes, C.; Kuhn, B.; Huo, S.; Chong, L.; Lee, M.; Lee, T.; Duan, Y.; Wang, W.; et al. Calculating structures and free energies of complex molecules: Combining molecular mechanics and continuum models. Acc. Chem. Res. 2000, 33, 889–897. [Google Scholar] [CrossRef] [PubMed]
Figure 1.
(A) Docking pose of (GLCN)6; (B) docking pose of (GlcN)2; (C) residues involved in (GLCN)6 binding; (D) residues involved in (GLCN)2 binding; (E,F) subsites for (GlcN)6; (E) and (GlcN)2 (F) binding: subsite −1 (red), subsite +1 (black).
Figure 1.
(A) Docking pose of (GLCN)6; (B) docking pose of (GlcN)2; (C) residues involved in (GLCN)6 binding; (D) residues involved in (GLCN)2 binding; (E,F) subsites for (GlcN)6; (E) and (GlcN)2 (F) binding: subsite −1 (red), subsite +1 (black).
Figure 2.
(A) RMSD plot of 7C6C-free and 7C6C-(GlcN)2 complex; (B) RMSD plot of 7C6C-(GlcN)2, G21K-(GlcN)2 and G21R-(GlcN)2.
Figure 2.
(A) RMSD plot of 7C6C-free and 7C6C-(GlcN)2 complex; (B) RMSD plot of 7C6C-(GlcN)2, G21K-(GlcN)2 and G21R-(GlcN)2.
Figure 3.
(A) Rg plot of 7C6C-free and 7C6C-(GlcN)2 complex; (B) average of Rg plots of 7C6C-free and 7C6C-(GlcN)2 complexes during MD simulations; (C) Rg plot of 7C6C-(GlcN)2, G21K-(GlcN) and G21R-(GlcN)2; (D) average of Rg plots of 7C6C-(GlcN)2, G21K-(GlcN) and G21R-(GlcN)2.
Figure 3.
(A) Rg plot of 7C6C-free and 7C6C-(GlcN)2 complex; (B) average of Rg plots of 7C6C-free and 7C6C-(GlcN)2 complexes during MD simulations; (C) Rg plot of 7C6C-(GlcN)2, G21K-(GlcN) and G21R-(GlcN)2; (D) average of Rg plots of 7C6C-(GlcN)2, G21K-(GlcN) and G21R-(GlcN)2.
Figure 4.
SASA plots. (A) 7C6C-free (black) and 7C6C-(GlcN)2 (red); (B) 7C6C-(GlcN)2 (red), G21K-(GlcN)2 (yellow) and G21R-(GlcN)2 (blue).
Figure 4.
SASA plots. (A) 7C6C-free (black) and 7C6C-(GlcN)2 (red); (B) 7C6C-(GlcN)2 (red), G21K-(GlcN)2 (yellow) and G21R-(GlcN)2 (blue).
Figure 5.
(A,B) SASA plot of each residue in subsite −1 (A) and subsite +1 (B).
Figure 5.
(A,B) SASA plot of each residue in subsite −1 (A) and subsite +1 (B).
Figure 6.
RMSF plots. (A) 7C6C-Free (black) and 7c6c-(GLCN)2 (red); (B) 7c6c-(GLCN)2 (black), G21k-(GLCN)2 (red) and G21R-(GLCN)2 (blue).
Figure 6.
RMSF plots. (A) 7C6C-Free (black) and 7c6c-(GLCN)2 (red); (B) 7c6c-(GLCN)2 (black), G21k-(GLCN)2 (red) and G21R-(GLCN)2 (blue).
Figure 7.
(A) Secondary structure changes in residues Ile145-Gly148; (B) 7C6C-free; (C) 7C6C-(GlcN)2; (D) G21K-(GlcN)2; (E) G21R-(GlcN)2.
Figure 7.
(A) Secondary structure changes in residues Ile145-Gly148; (B) 7C6C-free; (C) 7C6C-(GlcN)2; (D) G21K-(GlcN)2; (E) G21R-(GlcN)2.
Figure 8.
Analysis of active residues in Ile145-Gly148 fragment of each reaction system. (A) RMSD; (B) RMSD average; (C) Rg; (D) Rg average; (E) SASA; (F) SASA average.
Figure 8.
Analysis of active residues in Ile145-Gly148 fragment of each reaction system. (A) RMSD; (B) RMSD average; (C) Rg; (D) Rg average; (E) SASA; (F) SASA average.
Figure 9.
Size and shape of active pockets at 0, 50 and 100 ns in: (A) free 7C6C (red); (B) 7C6C-(GlcN)2 (dark blue); (C) G21K-(GlcN)2 (light blue); (D) G21R-(GlcN)2 (green).
Figure 9.
Size and shape of active pockets at 0, 50 and 100 ns in: (A) free 7C6C (red); (B) 7C6C-(GlcN)2 (dark blue); (C) G21K-(GlcN)2 (light blue); (D) G21R-(GlcN)2 (green).
Figure 10.
Correlation diagram of residue covariance used to mark the interaction positions of segments Ile145-Gly148 and His198-Val208 with black rectangles: (A) 7C6C-Free; (B) 7C6C-(GlcN)2; (C) G21K-(GlcN)2; (D) G21R-(GlcN)2.
Figure 10.
Correlation diagram of residue covariance used to mark the interaction positions of segments Ile145-Gly148 and His198-Val208 with black rectangles: (A) 7C6C-Free; (B) 7C6C-(GlcN)2; (C) G21K-(GlcN)2; (D) G21R-(GlcN)2.
Table 1.
Probability of α-helix in Ile145-Gly148 during 100 ns MD simulations.
Table 1.
Probability of α-helix in Ile145-Gly148 during 100 ns MD simulations.
| | 7C6C-Free | 7C6C-(GlcN)2 | G21K-(GlcN)2 | G21R-(GlcN)2 |
|---|
| Residue | α-helix | Loop | α-helix | Loop | α-helix | Loop | α-helix | Loop |
|---|
| Ile145 | 0.42 | 0.58 | 0.24 | 0.76 | 0.49 | 0.51 | 0.62 | 0.38 |
| Gln146 | 0.38 | 0.62 | 0.08 | 0.92 | 0.49 | 0.51 | 0.59 | 0.41 |
| His147 | 0.37 | 0.63 | 0.08 | 0.92 | 0.45 | 0.35 | 0.64 | 0.36 |
| Gly148 | 0 | 0.01 | 0 | 0.01 | 0 | 0.01 | 0 | 0.01 |
Table 2.
Results of MM-PBSA.
Table 2.
Results of MM-PBSA.
| | 7C6C-(GlcN)2 | G21R-(GlcN)2 | G21K-(GlcN)2 |
|---|
| ΔEvdW | −24.04 ± 1.04 | −24.53 ± 0.73 | −23.03 ± 1.11 |
| ΔEele | 0.43 ± 1.13 | −3.37 ± 0.74 | −1.34 ± 1.04 |
| ΔEPB | 12.18 ± 0.58 | 15.72 ± 1.19 | 9.90 ± 1.53 |
| ΔGgas | −23.62 ± 0.90 | −27.90 ± 1.20 | −24.37 ± 1.78 |
| ΔGsolv | 12.18 ± 0.58 | 15.72 ± 1.89 | 9.90 ± 1.53 |
| ΔGbind | −11.44 ± 1.04 | −12.19 ± 0.86 | −14.47 ± 0.47 |
Table 3.
Details corresponding to the four systems.
Table 3.
Details corresponding to the four systems.
| Complex | Protein | Ligand | Ions | Total Molecules |
|---|
| 7C6C-Free | 1 | None | Na+ (22) | 13,158 |
| 7C6C-(GlcN)2 | 1 | (GlcN)2 | Na+ (23) | 13,155 |
| G21K-(GlcN)2 | 1 | (GlcN)2 | Na+ (24) | 13,149 |
| G21R-(GlcN)2 | 1 | (GlcN)2 | Na+ (18) | 13,148 |
| Disclaimer/Publisher’s Note: The statements, opinions and data contained in all publications are solely those of the individual author(s) and contributor(s) and not of MDPI and/or the editor(s). MDPI and/or the editor(s) disclaim responsibility for any injury to people or property resulting from any ideas, methods, instructions or products referred to in the content. |
© 2023 by the authors. Licensee MDPI, Basel, Switzerland. This article is an open access article distributed under the terms and conditions of the Creative Commons Attribution (CC BY) license (https://creativecommons.org/licenses/by/4.0/).
