
Mass Spectrometric Detection of Formaldehyde-Crosslinked PBMC Proteins in Cell-Free DNA Blood Collection Tubes


Abstract
:
1. Introduction
2. Results
3. Discussion
4. Materials and Methods
4.1. Chemicals and Reagents
4.2. Collection and Processing of Blood Samples
4.3. Isolation of Human Peripheral Blood Mononuclear Cells
4.4. Lysis of the Peripheral Blood Mononuclear Cells
4.5. Protein Preparation for Mass Spectrometry
4.6. Liquid Chromatography—Mass Spectrometry (LC-MS)
4.7. Data Processing and Analysis
4.8. Validation of Formaldehyde Protein Crosslinks Using Parallel Reaction Monitoring (PRM)
5. Conclusions
Supplementary Materials
Author Contributions
Funding
Institutional Review Board Statement
Informed Consent Statement
Data Availability Statement
Conflicts of Interest
References
- Dhondt, B.; Pinheiro, C.; Geeurickx, E.; Tulkens, J.; Vergauwen, G.; Van Der Pol, E.; Nieuwland, R.; Decock, A.; Miinalainen, I.; Rappu, P.; et al. Benchmarking blood collection tubes and processing intervals for extracellular vesicle performance metrics. J. Extracell. Vesicles 2023, 12, e12315. [Google Scholar] [CrossRef] [PubMed]
- Medina Diaz, I.; Nocon, A.; Mehnert, D.H.; Fredebohm, J.; Diehl, F.; Holtrup, F. Performance of Streck cfDNA Blood Collection Tubes for Liquid Biopsy Testing. PLoS ONE 2016, 11, e0166354. [Google Scholar] [CrossRef] [PubMed]
- Sutherland, B.W.; Toews, J.; Kast, J. Utility of formaldehyde cross-linking and mass spectrometry in the study of protein-protein interactions. J. Mass Spectrom. 2008, 43, 699–715. [Google Scholar] [CrossRef] [PubMed]
- Srinivasa, S.; Ding, X.; Kast, J. Formaldehyde cross-linking and structural proteomics: Bridging the gap. Methods 2015, 89, 91–98. [Google Scholar] [CrossRef]
- Metz, B.; Kersten, G.F.; Baart, G.J.; de Jong, A.; Meiring, H.; ten Hove, J.; van Steenbergen, M.J.; Hennink, W.E.; Crommelin, D.J.; Jiskoot, W. Identification of formaldehyde-induced modifications in proteins: Reactions with insulin. Bioconjugate Chem. 2006, 17, 815–822. [Google Scholar] [CrossRef] [PubMed]
- Tayri-Wilk, T.; Slavin, M.; Zamel, J.; Blass, A.; Cohen, S.; Motzik, A.; Sun, X.; Shalev, D.E.; Ram, O.; Kalisman, N. Mass spectrometry reveals the chemistry of formaldehyde cross-linking in structured proteins. Nat. Commun. 2020, 11, 3128. [Google Scholar] [CrossRef] [PubMed]
- Alexovic, M.; Ulicna, C.; Sabo, J.; Davalieva, K. Human peripheral blood mononuclear cells as a valuable source of disease-related biomarkers: Evidence from comparative proteomics studies. Proteom. Clin. Appl. 2023, e2300072. [Google Scholar] [CrossRef] [PubMed]
- Almazi, J.G.; Pockney, P.; Gedye, C.; Smith, N.D.; Hondermarck, H.; Verrills, N.M.; Dun, M.D. Cell-Free DNA Blood Collection Tubes Are Appropriate for Clinical Proteomics: A Demonstration in Colorectal Cancer. Proteom. Clin. Appl. 2018, 12, e1700121. [Google Scholar] [CrossRef] [PubMed]
- Goldberg, E.; Ievari-Shariati, S.; Kidane, B.; Kim, J.; Banerji, S.; Qing, G.; Srinathan, S.; Murphy, L.; Aliani, M. Comparative metabolomics studies of blood collected in streck and heparin tubes from lung cancer patients. PLoS ONE 2021, 16, e0249648. [Google Scholar] [CrossRef] [PubMed]
- Outram, S.V.; Hager-Theodorides, A.L.; Shah, D.K.; Rowbotham, N.J.; Drakopoulou, E.; Ross, S.E.; Lanske, B.; Dessens, J.T.; Crompton, T. Indian hedgehog (Ihh) both promotes and restricts thymocyte differentiation. Blood 2009, 113, 2217–2228. [Google Scholar] [CrossRef] [PubMed]
- Hanna, A.; Metge, B.J.; Bailey, S.K.; Chen, D.; Chandrashekar, D.S.; Varambally, S.; Samant, R.S.; Shevde, L.A. Inhibition of Hedgehog signaling reprograms the dysfunctional immune microenvironment in breast cancer. Oncoimmunology 2019, 8, 1548241. [Google Scholar] [CrossRef] [PubMed]
- Moore, M.P.; Wang, X.; Shi, H.; Meroni, M.; Cherubini, A.; Ronzoni, L.; Parks, E.J.; Ibdah, J.A.; Rector, R.S.; Valenti, L.; et al. Circulating indian hedgehog is a marker of the hepatocyte-TAZ pathway in experimental NASH and is elevated in humans with NASH. JHEP Rep. 2023, 5, 100716. [Google Scholar] [CrossRef] [PubMed]
- Monaco, G.; Lee, B.; Xu, W.; Mustafah, S.; Hwang, Y.Y.; Carre, C.; Burdin, N.; Visan, L.; Ceccarelli, M.; Poidinger, M.; et al. RNA-Seq Signatures Normalized by mRNA Abundance Allow Absolute Deconvolution of Human Immune Cell Types. Cell Rep. 2019, 26, 1627–1640.e7. [Google Scholar] [CrossRef] [PubMed]
- Osman, Y.; Elsharkawy, T.; Hashim, T.M.; Alratroot, J.A.; Alsuwat, H.S.; Otaibi, W.M.A.; Hegazi, F.M.; AbdulAzeez, S.; Borgio, J.F. Functional multigenic variations associated with hodgkin lymphoma. Int. J. Lab. Hematol. 2021, 43, 1472–1482. [Google Scholar] [CrossRef] [PubMed]
- Wisniewski, J.R.; Zougman, A.; Nagaraj, N.; Mann, M. Universal sample preparation method for proteome analysis. Nat. Methods 2009, 6, 359–362. [Google Scholar] [CrossRef] [PubMed]
- Mangiola, S.; Papenfuss, A. tidyHeatmap: An R package for modular heatmap production based on tidy principles. J. Open Source Softw. 2020, 5, 2472. [Google Scholar] [CrossRef]


| ID | Crosslink | z | m/z (calc.) | m/z (obs.) | CM | RT [min] |
|---|---|---|---|---|---|---|
| 1 | AGYLEKR—RIYQFTAASPK | 4 | 536.043 | 536.0420 | 24 | 40.2 |
| 2 | ALEEAMEQK—ALEEAMEQKAELER | 4 | 677.3295 | 677.3230 | 12 | 53.7 |
| 3 | ALSTDPAAPNLKSQLAAAAR— LNEAAAGLNQAATELVQASRGTPQDLAR | 5 | 971.715 | 971.715 | 24 | 102.9 |
| 4 | ANLEKAK—KEEELQAALARVEEEAAQK | 4 5 | 735.3925 588.5154 | 735.3925 588.5156 | 24 | 66.9 67.0 |
| 5 | AQYEDIAQK—SKAEAESLYQSK | 4 | 605.0512 | 605.0511 | 12 | 32 |
| 6 | ATKEQLK—FQNALLVRYTK | 4 5 | 549.0652 439.4536 | 549.0655 439.4538 | 24 | 43.0 43.1 |
| 7 | AVFPSIVGRPR—GILTLKYPIEHGIITNWDDMEK | 4 5 6 | 952.7618 762.4109 635.5103 | 952.7612 762.4112 635.5105 | 24 | 99.1 99.5 99.0 |
| 8 | AVFPSIVGRPR— RGILTLKYPIEHGIITNWDDMEK | 6 | 661.5272 | 661.5275 | 24 | 92.8 |
| 9 | AVPAEGVR—LLLPGELAKHAVSEGTK | 4 | 646.8669 | 646.8665 | 24 | 91.9 |
| 10 | DAMVARAR—LGGSQEDQIKNAIDK | 4 | 632.8276 | 632.8277 | 24 | 50.7 |
| 11 | DAQIFIQKK—NFTEVHPDYGSHIQALLDK | 4 5 | 822.178 657.9439 | 822.1781 657.9442 | 12 | 73.1 73.1 |
| 12 | DAVTYTEHAKR—RSTITSREIQTAVR | 5 | 587.1137 | 587.1135 | 24 | 31.7 |
| 13 | DAVTYTEHAKR—STITSREIQTAVR | 4 5 | 694.6151 555.8935 | 694.6149 555.8934 | 24 | 36.8 36.9 |
| 14 | DLKDFIR—IGQLSEKEIQK | 5 | 438.8484 | 439.2515 | 12 | 42.8 |
| 15 | EEALNNAFK—ALEEAMEQKAELER | 4 | 677.0826 | 677.33375 * | 24 | 53.9 |
| 16 | EKGRDLAPR—EKGRDLAPR | 4 | 527.2936 | 527.2959 | 24 | 75.9 |
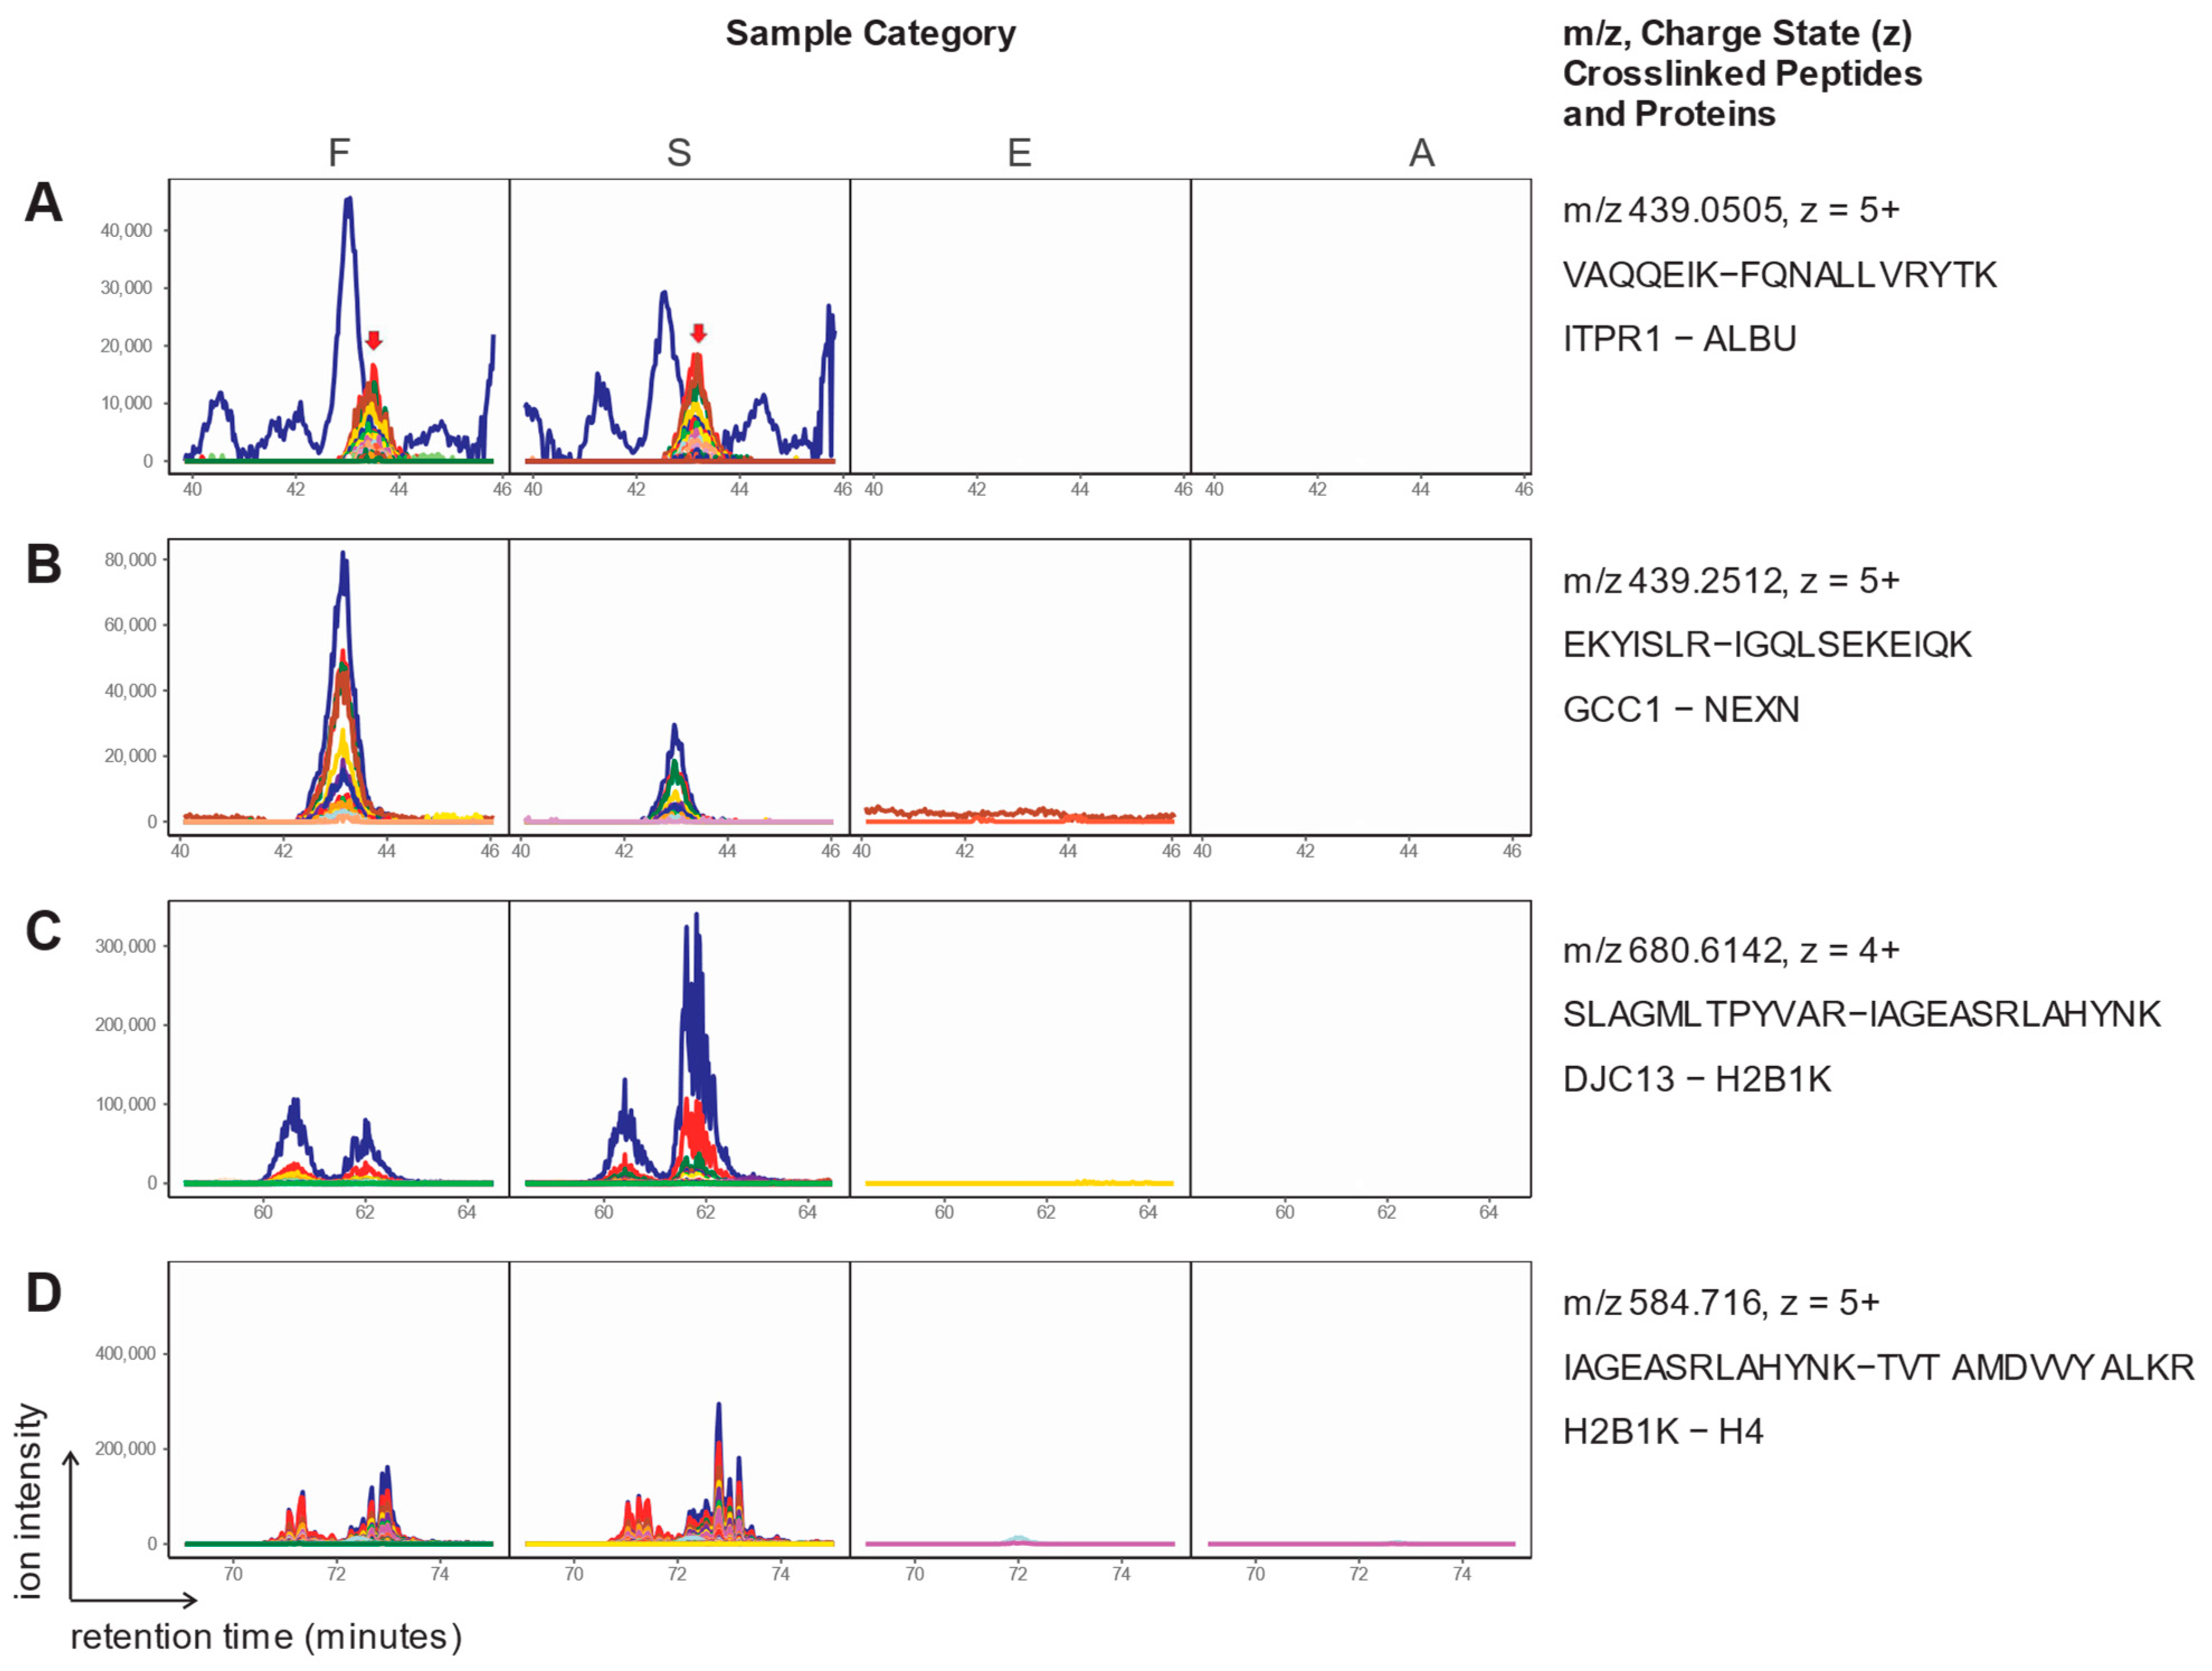
| 17 | EKYISLR—IGQLSEKEIQK | 5 | 439.2515 | 439.4538 * | 12 | 43.1 |
| 18 | ELSGPEGK—FQNALLVRYTK | 4 | 548.7982 | 548.7982 | 24 | 43 |
| 19 | FGERAFK—LAKTYETTLEK | 4 | 544.2928 | 544.293 | 24 | 40.8 |
| 20 | FKDCHLAR—CSTSPLLEACEFLRK | 5 6 | 576.8849 480.9053 | 576.8852 480.9054 | 24 | 67.4 67.3 |
| 21 | FKDCHLAR—HFENKFAVETLICS | 5 | 553.6725 | 553.6729 | 24 | 65.6 |
| 22 | FQNALLVRYTK—KVPQVSTPTLVEVSR | 4 5 | 754.6802 603.9456 | 754.6804 603.9458 | 24 | 73.7 73.8 |
| 23 | IAGEASRLAHYNK—NSLLTDIIAAYQR | 4 | 730.3925 | 730.3901 | 12 | 71 |
| 24 | IAGEASRLAHYNK—TVTAMDVVYALKR | 4 5 6 | 730.6432 584.716 487.4312 | 730.6436 584.7161 487.4313 | 24 | 72.1 72.0 72.0 |
| 25 | IAGEASR—TVTAMDVVYALKR | 4 | 549.0479 | 549.0475 | 24 | 79.2 |
| 26 | IASAEGR—TLGASGRYEGKIAR | 4 | 549.0488 | 549.0477 | 12 | 79.4 |
| 27 | KESYSVYVYK—TVTAMDVVYALK | 4 | 647.5896 | 647.5913 | 12 | 74.9 |
| 28 | KPAPKTPPK—KVPQVSTPTLVEVSR | 4 | 657.3877 | 657.3879 | 24 | 61.8 |
| 29 | KSHEESHKE—LLETECPQYIR | 4 | 636.5603 | 636.5604 | 12 | 17.8 |
| 30 | KSHEESHKE—LLETECPQYIRK | 4 5 6 | 671.5841 537.4687 448.0585 | 671.5840 537.4684 448.0583 | 24 | 15.2 15.9 16.1 |
| 31 | LKCASLQK—IAQDKLNDIK | 4 | 532.8003 | 532.8015 | 24 | 39.7 |
| 32 | LKQVLLHQQAK—NLLFNDNTECLAR | 4 | 727.892 | 727.8919 | 24 | 65.2 |
| 33 | MADMQNLVER—LLETECPQYIRK | 4 | 692.5948 | 692.5941 | 12 | 58.8 |
| 34 | MGVAAHKK—LLETECPQYIRK | 4 | 604.3225 | 604.3228 | 24 | 28.7 |
| 35 | NLAEKAK—KEEELQAALARVEEEAAQK | 4 | 735.3925 | 735.3928 | 24 | 67 |
| 36 | NLLFNDNTECLAR— CLAENAGDVAFVKDVTVLQNTDGNNNEAWAK | 5 | 991.6732 | 991.6738 | 12 | 100.1 |
| 37 | NLVNNLRK—LIELAKDMPSLK | 5 | 471.0754 | 471.0758 | 24 | 68.5 |
| 38 | RSTITSR—DAVTYTEHAKR | 4 | 534.2804 | 534.2802 | 24 | 17.5 |
| 39 | SHEESHKE—LLETECPQYIR | 4 | 604.5366 | 604.5362 | 12 | 22.3 |
| 40 | SHEESHKE—LLETECPQYIRK | 5 | 511.8497 | 511.8496 | 24 | 23.2 |
| 41 | SILENLRSK—YLQEIYNSNNQKIVNLK | 4 | 791.6832 | 791.6837 | 24 | 73.1 |
| 42 | SLAGMLTPYVAR—IAGEASRLAHYNK | 4 | 680.6142 | 680.6152 | 12 | 61.4 |
| 43 | VAQQEIK—FQNALLVRYTK | 5 | 439.0505 | 439.2513 * | 24 | 42.9 |
| 44 | VPQSGTLK—EQIQVPSNLALK | 4 | 548.8126 | 549.0652 * | 24 | 43.1 |
| 45 | VVAGVANALAHK— VLGAFSDGLAHLDNLKGTFATLSELHCDK | 6 | 715.8784 | 715.8791 | 12 | 101.9 |
| ID | Protein 1 | Protein 2 | ||||||
|---|---|---|---|---|---|---|---|---|
| Name | MW [kD] | Gene Name | Uniprot ID | Name | MW [kD] | Gene Name | Uniprot ID | |
| 1 | Src kinase-associated phosphoprotein 2 | 41.2 | SKAP2 | O75563 | Src kinase-associated phosphoprotein 2 | 42.2 | SKAP2 | O75563 |
| 2 | Myosin-9 | 226.5 | MYH9 | P35579 | Myosin-9 | 226.5 | MYH9 | P35579 |
| 3 | Talin-1 | 269.8 | TLN1 | Q9Y490 | Talin-1 | 269.8 | TLN1 | Q9Y490 |
| 4 | Myosin-9 | 226.5 | MYH9 | P35579 | Myosin-9 | 226.5 | MYH9 | P35579 |
| 5 | Keratin | 66 | KRT1 | P04264 | Keratin | 66 | KRT1 | P04264 |
| 6 | Albumin | 69.4 | ALB | P02768 | Albumin | 69.4 | ALB | P02768 |
| 7 | POTE ankyrin dom. family member F/Actin | 121.4 41.9 | POTEF ACTG2 | A5A3E0 P63267 | Actin | 41.9 | ACTG2 | P63267 |
| 8 | POTE ankyrin dom. family member F/Actin | 121.4 41.9 | POTEF ACTG2 | A5A3E0 P63267 | Actin | 41.9 | ACTG2 | P63267 |
| 9 | Mannosyl-oligosaccharide glucosidase | 91.9 | MOGS | Q13724 | Histone H2B | 13.9 | H2BC12 | O60814 |
| 10 | Transaldolase | 37.5 | TALDO1 | P37837 | Transaldolase | 37.5 | TALDO1 | P37837 |
| 11 | Catalase | 59.8 | CAT | P04040 | Catalase | 59.8 | CAT | P04040 |
| 12 | Histone H4 | 11.4 | H4C1-16 | P62805 | Histone H2B | 13.9 | H2BC12 | O60814 |
| 13 | Histone H4 | 11.4 | H4C1-16 | P62805 | Histone H2B | 13.9 | H2BC12 | O60814 |
| 14 | Potassium voltage-gated channel subfamily H member 8 | 123.8 | KCNH8 | Q96L42 | Nexilin | 80.7 | NEXN | Q0ZGT2 |
| 15 | Arf-GAP with SH3 dom., ANK repeat and PH dom.-containing protein 2 | 111.7 | ASAP2 | O43150 | Myosin-9 | 226.5 | MYH9 | P35579 |
| 16 | Multiple epidermal growth-factor-like dom. protein 11 | 110.8 | MEGF11 | A6BM72 | Multiple epidermal growth factor-like dom. protein 11 | 110.8 | MEGF11 | A6BM72 |
| 17 | GRIP and coiled-coil dom.-containing protein 1 | 87.8 | GCC1 | Q96CN9 | Nexilin | 80.7 | NEXN | Q0ZGT2 |
| 18 | Docking protein 2 | 45.4 | DOK2 | O60496 | Albumin | 69.4 | ALB | P02768 |
| 19 | Albumin | 69.4 | ALB | P02768 | Albumin | 69.4 | ALB | P02768 |
| 20 | Lactotransferrin | 78.2 | LTF | P02788 | Lactotransferrin | 78.2 | LTF | P02788 |
| 21 | Lactotransferrin | 78.2 | LTF | P02788 | Integral membrane protein 2B | 30.3 | ITM2B | Q9Y287 |
| 22 | Albumin | 69.4 | ALB | P02768 | Albumin | 69.4 | ALB | P02768 |
| 23 | Histone H2B | 13.9 | H2BC12 | O60814 | AFG3-like protein 2 | 88.6 | AFG3L2 | Q9Y4W6 |
| 24 | Histone H2B | 13.9 | H2BC12 | O60814 | Histone H4 | 11.4 | H4C1-16 | P62805 |
| 25 | Histone H2B | 13.9 | H2BC12 | O60814 | Histone H4 | 11.4 | H4C1-16 | P62805 |
| 26 | Olfactory receptor 10J4 | 34.9 | OR10J4 | P0C629 | Indian hedgehog protein | 45.25 | IHH | Q14623 |
| 27 | Histone H2B | 13.9 | H2BC12 | O60814 | Histone H4 | 11.4 | H4C1-16 | P62805 |
| 28 | Myosin light chain kinase | 210.7 | MYLK | Q15746 | Albumin | 69.4 | ALB | P02768 |
| 29 | Protein S100-A8 | 10.8 | S100A8 | P05109 | Protein S100-A8 | 10.8 | S100A8 | P05109 |
| 30 | Protein S100-A8 | 10.8 | S100A8 | P05109 | Protein S100-A8 | 10.8 | S100A8 | P05109 |
| 31 | Albumin | 69.4 | ALB | P02768 | DNA repair protein RAD50 | 153.9 | RAD50 | Q92878 |
| 32 | Lactotransferrin | 78.2 | LTF | P02788 | Lactotransferrin | 78.2 | LTF | P02788 |
| 33 | Adenylyl cyclase-associated protein 1 | 51.9 | CAP1 | Q01518 | Protein S100-A8 | 10.8 | S100A8 | P05109 |
| 34 | Protein S100-A8 | 10.8 | S100A8 | P05109 | Protein S100-A8 | 10.8 | S100A8 | P05109 |
| 35 | Protein mono-ADP-ribosyltransferase PARP9 | 96.3 | PARP9 | Q8IXQ6 | Myosin-9 | 226.5 | MYH9 | P35579 |
| 36 | Lactotransferrin | 78.2 | LTF | P02788 | Lactotransferrin | 78.2 | LTF | P02788 |
| 37 | Myeloid cell nuclear differentiation antigen | 45.8 | MNDA | P41218 | Myeloid cell nuclear differentiation antigen | 45.8 | MNDA | P41218 |
| 38 | Histone H2B | 13.9 | H2BC12 | O60814 | Histone H4 | 11.4 | H4C1-16 | P62805 |
| 39 | Protein S100-A8 | 10.8 | S100A8 | P05109 | Protein S100-A8 | 10.8 | S100A8 | P05109 |
| 40 | Protein S100-A8 | 10.8 | S100A8 | P05109 | Protein S100-A8 | 10.8 | S100A8 | P05109 |
| 41 | Fibrinogen beta chain | 55.9 | FGB | P02675 | Fibrinogen gamma chain | 51.5 | FGG | P02679 |
| 42 | DnaJ homolog subfamily C member 13 | 254.4 | DNAJC13 | O75165 | Histone H2B | 13.9 | H2BC12 | O60814 |
| 43 | Inositol 1,4,5-trisphosphate receptor type 1\ | 313.9 | ITPR1 | Q14643 | Albumin | 69.4 | ALB | P02768 |
| 44 | Low-density lipoprotein receptor-related protein 11 | 53.3 | LRP11 | Q86VZ4 | Ras-related protein Rab-33A | 26.6 | RAB33A | Q14088 |
| 45 | Hemoglobin subunit delta | 16.1 | HBD | P02042 | Hemoglobin subunit beta | 16 | HBB | P68871 |
Disclaimer/Publisher’s Note: The statements, opinions and data contained in all publications are solely those of the individual author(s) and contributor(s) and not of MDPI and/or the editor(s). MDPI and/or the editor(s) disclaim responsibility for any injury to people or property resulting from any ideas, methods, instructions or products referred to in the content. |
© 2023 by the authors. Licensee MDPI, Basel, Switzerland. This article is an open access article distributed under the terms and conditions of the Creative Commons Attribution (CC BY) license (https://creativecommons.org/licenses/by/4.0/).
Share and Cite
Röth, D.; Molina-Franky, J.; Williams, J.C.; Kalkum, M. Mass Spectrometric Detection of Formaldehyde-Crosslinked PBMC Proteins in Cell-Free DNA Blood Collection Tubes. Molecules 2023, 28, 7880. https://doi.org/10.3390/molecules28237880
Röth D, Molina-Franky J, Williams JC, Kalkum M. Mass Spectrometric Detection of Formaldehyde-Crosslinked PBMC Proteins in Cell-Free DNA Blood Collection Tubes. Molecules. 2023; 28(23):7880. https://doi.org/10.3390/molecules28237880
Chicago/Turabian StyleRöth, Daniel, Jessica Molina-Franky, John C. Williams, and Markus Kalkum. 2023. "Mass Spectrometric Detection of Formaldehyde-Crosslinked PBMC Proteins in Cell-Free DNA Blood Collection Tubes" Molecules 28, no. 23: 7880. https://doi.org/10.3390/molecules28237880
APA StyleRöth, D., Molina-Franky, J., Williams, J. C., & Kalkum, M. (2023). Mass Spectrometric Detection of Formaldehyde-Crosslinked PBMC Proteins in Cell-Free DNA Blood Collection Tubes. Molecules, 28(23), 7880. https://doi.org/10.3390/molecules28237880