

GC-MS Fingerprinting Combined with Chemical Pattern-Recognition Analysis Reveals Novel Chemical Markers of the Medicinal Seahorse

 , , , and
Abstract
:1. Introduction
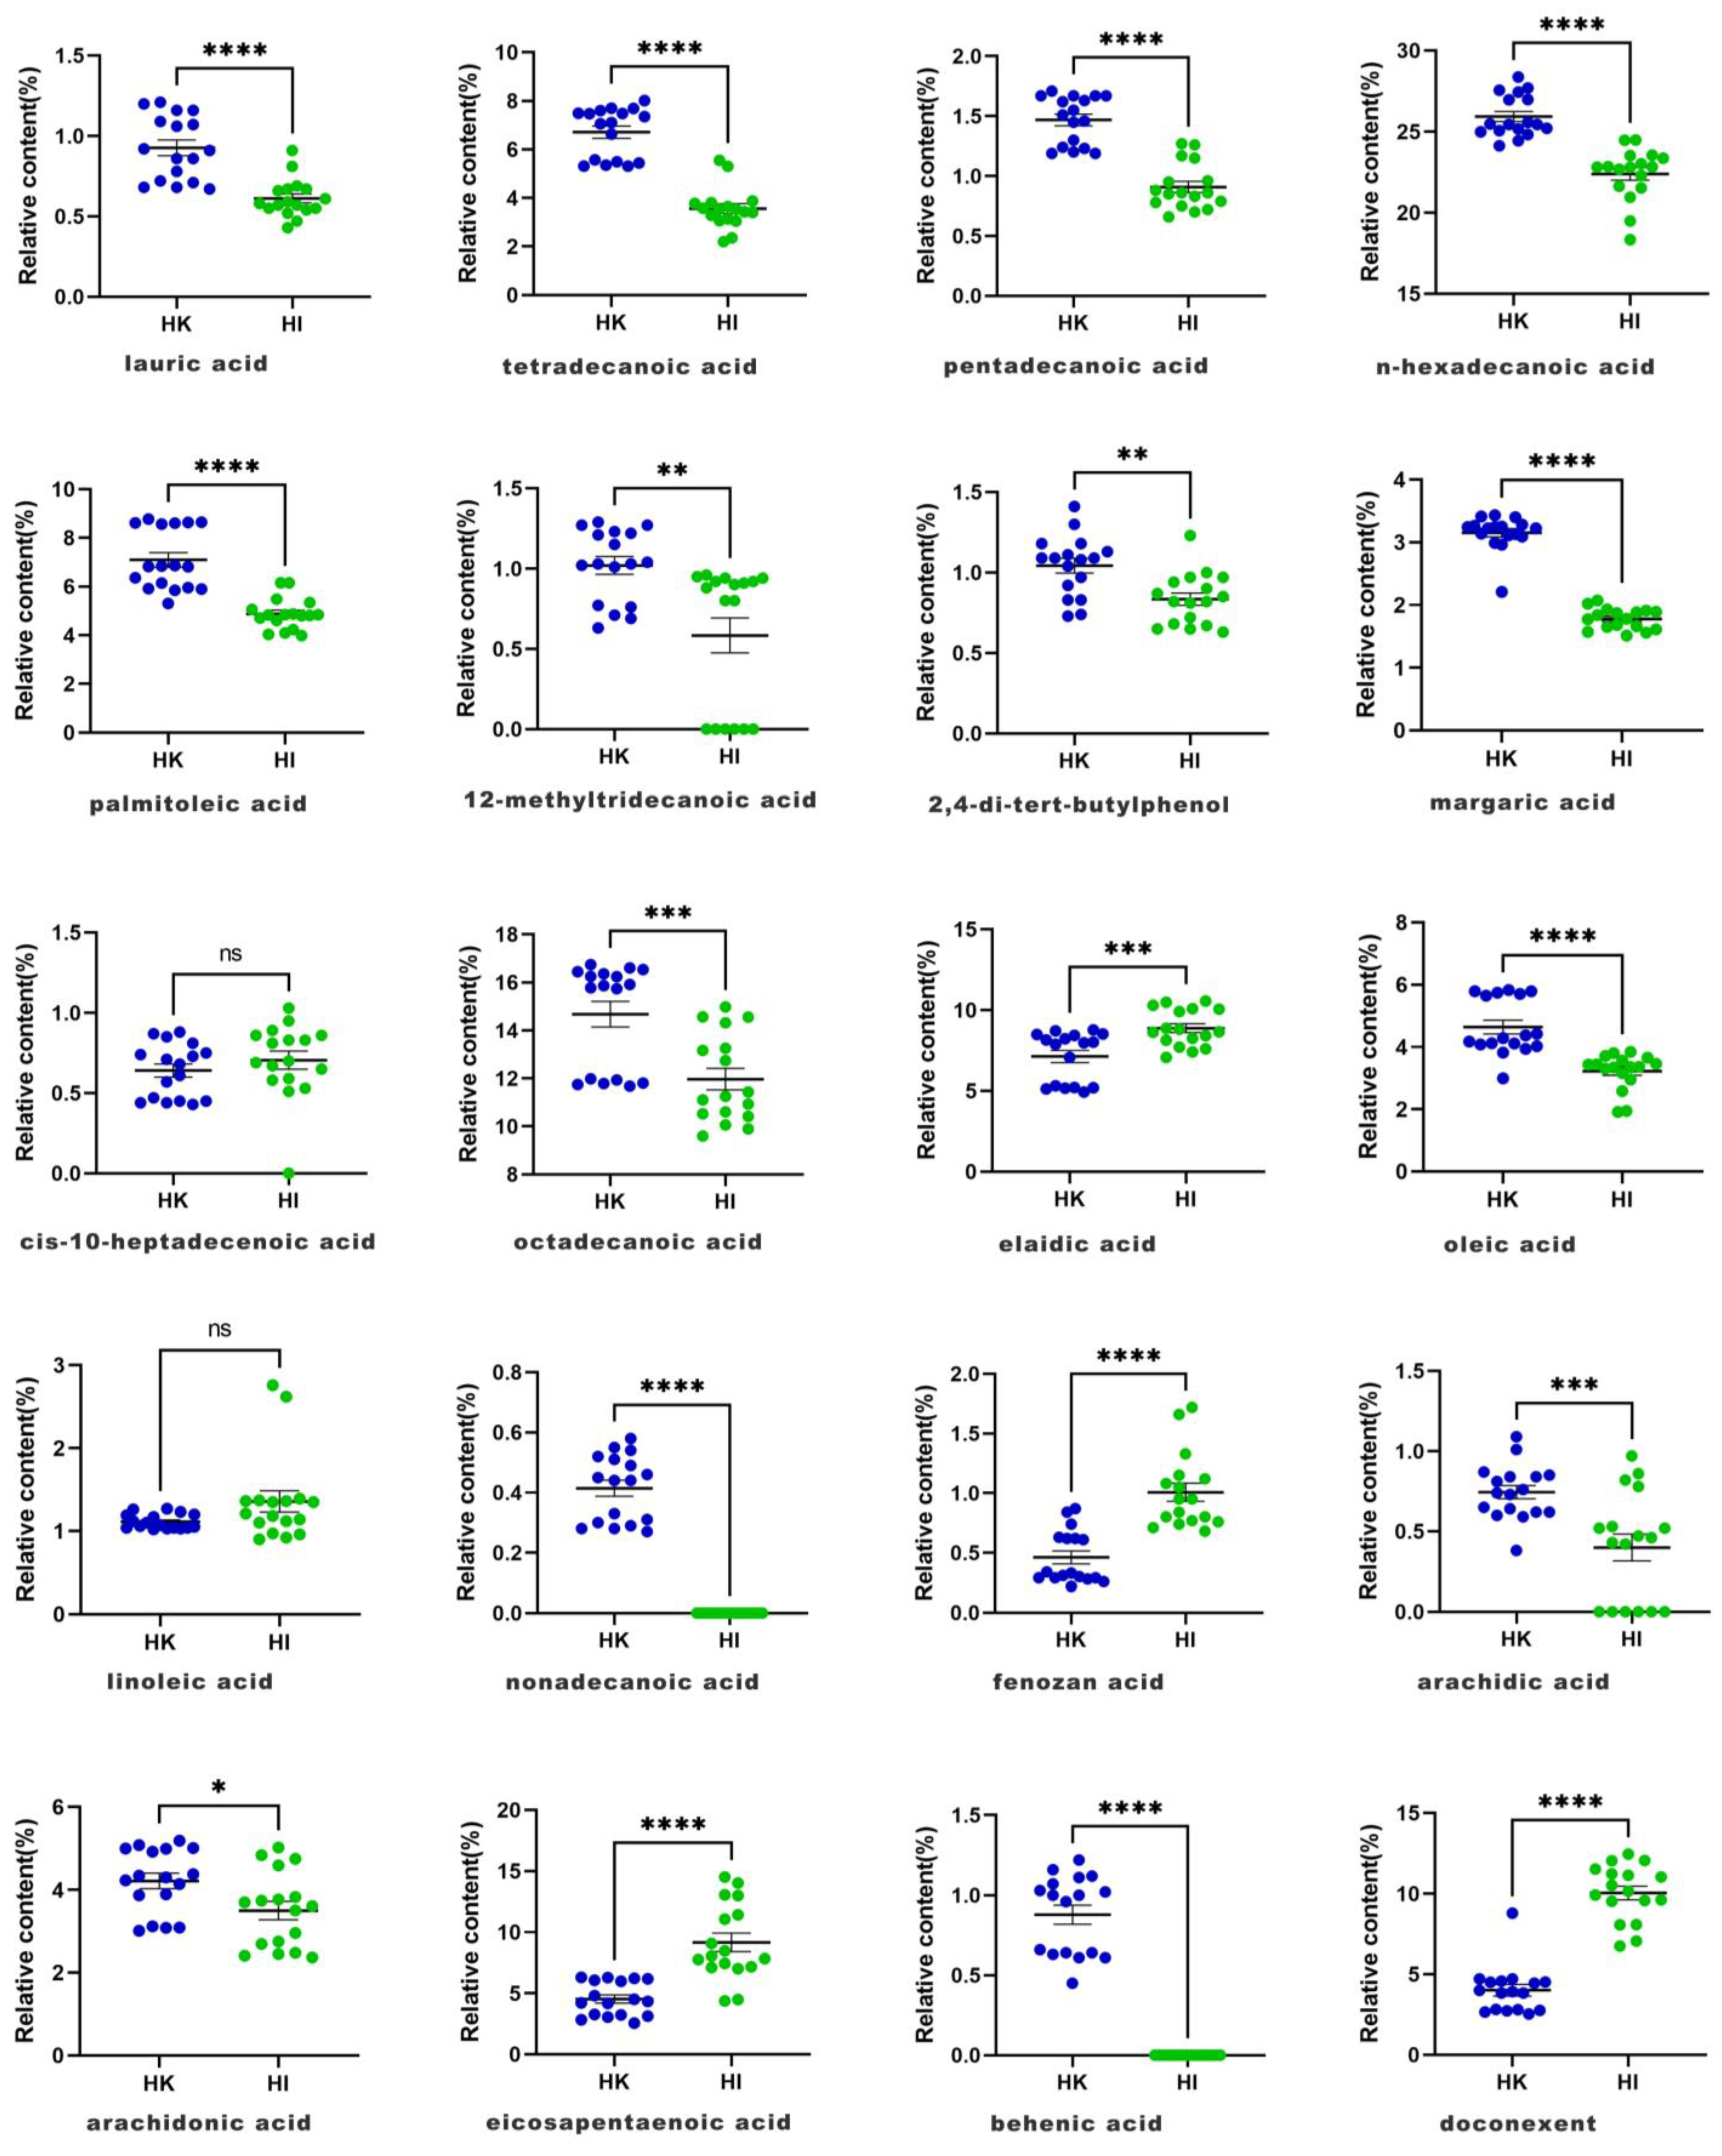
2. Results and Discussion
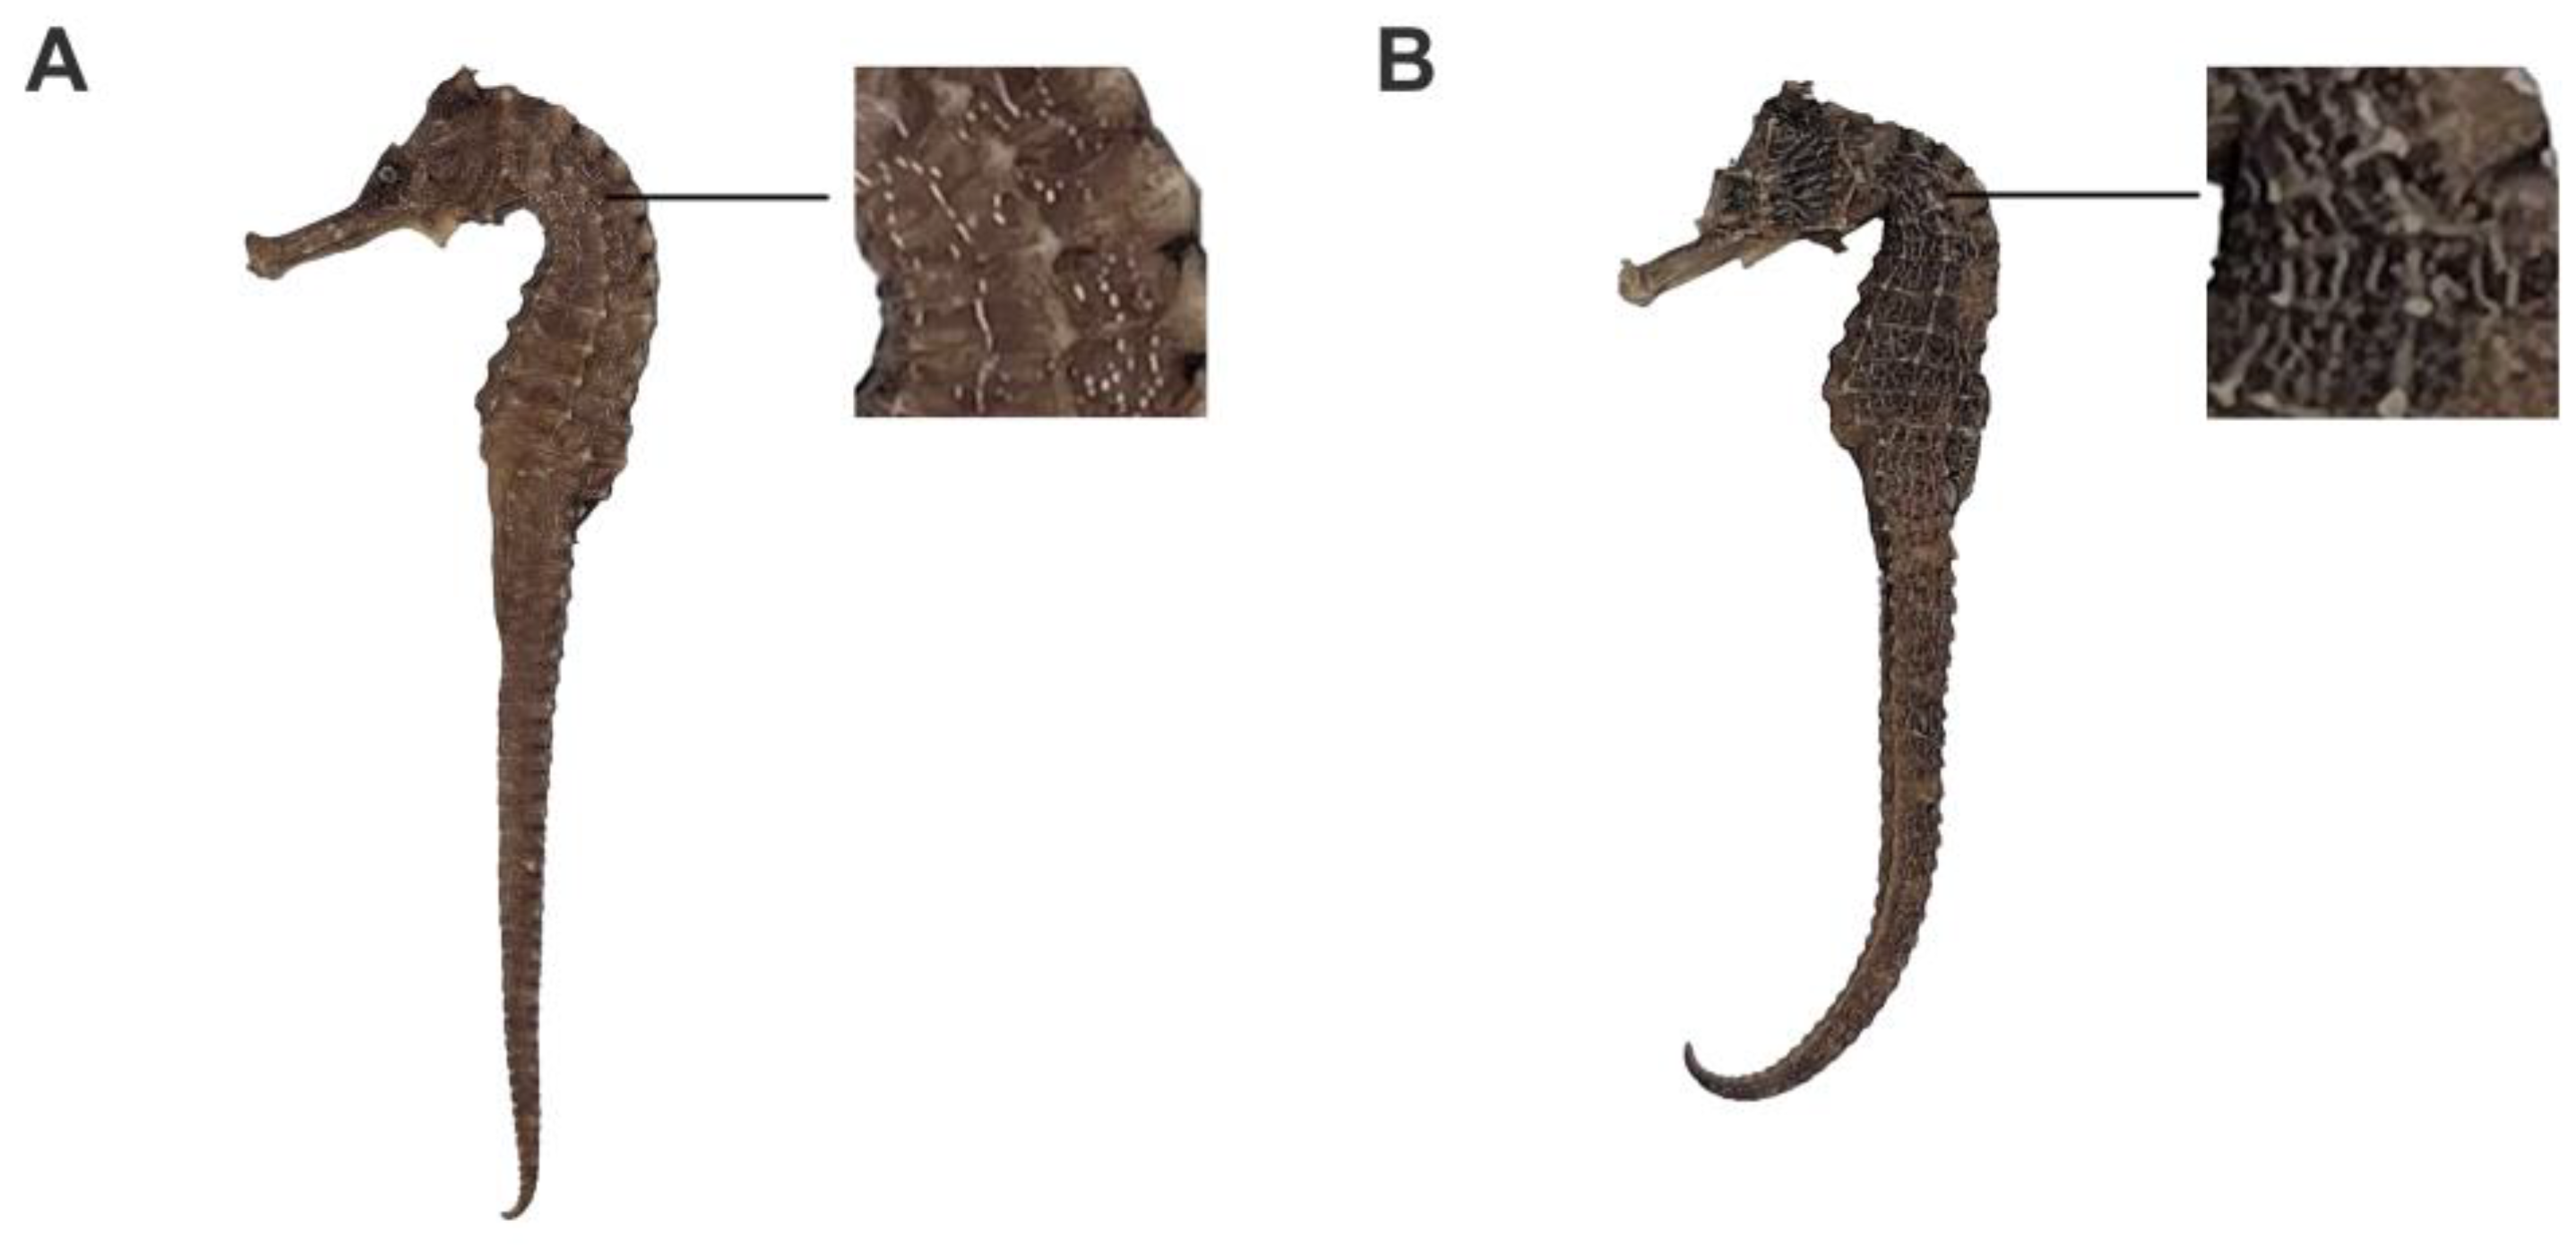
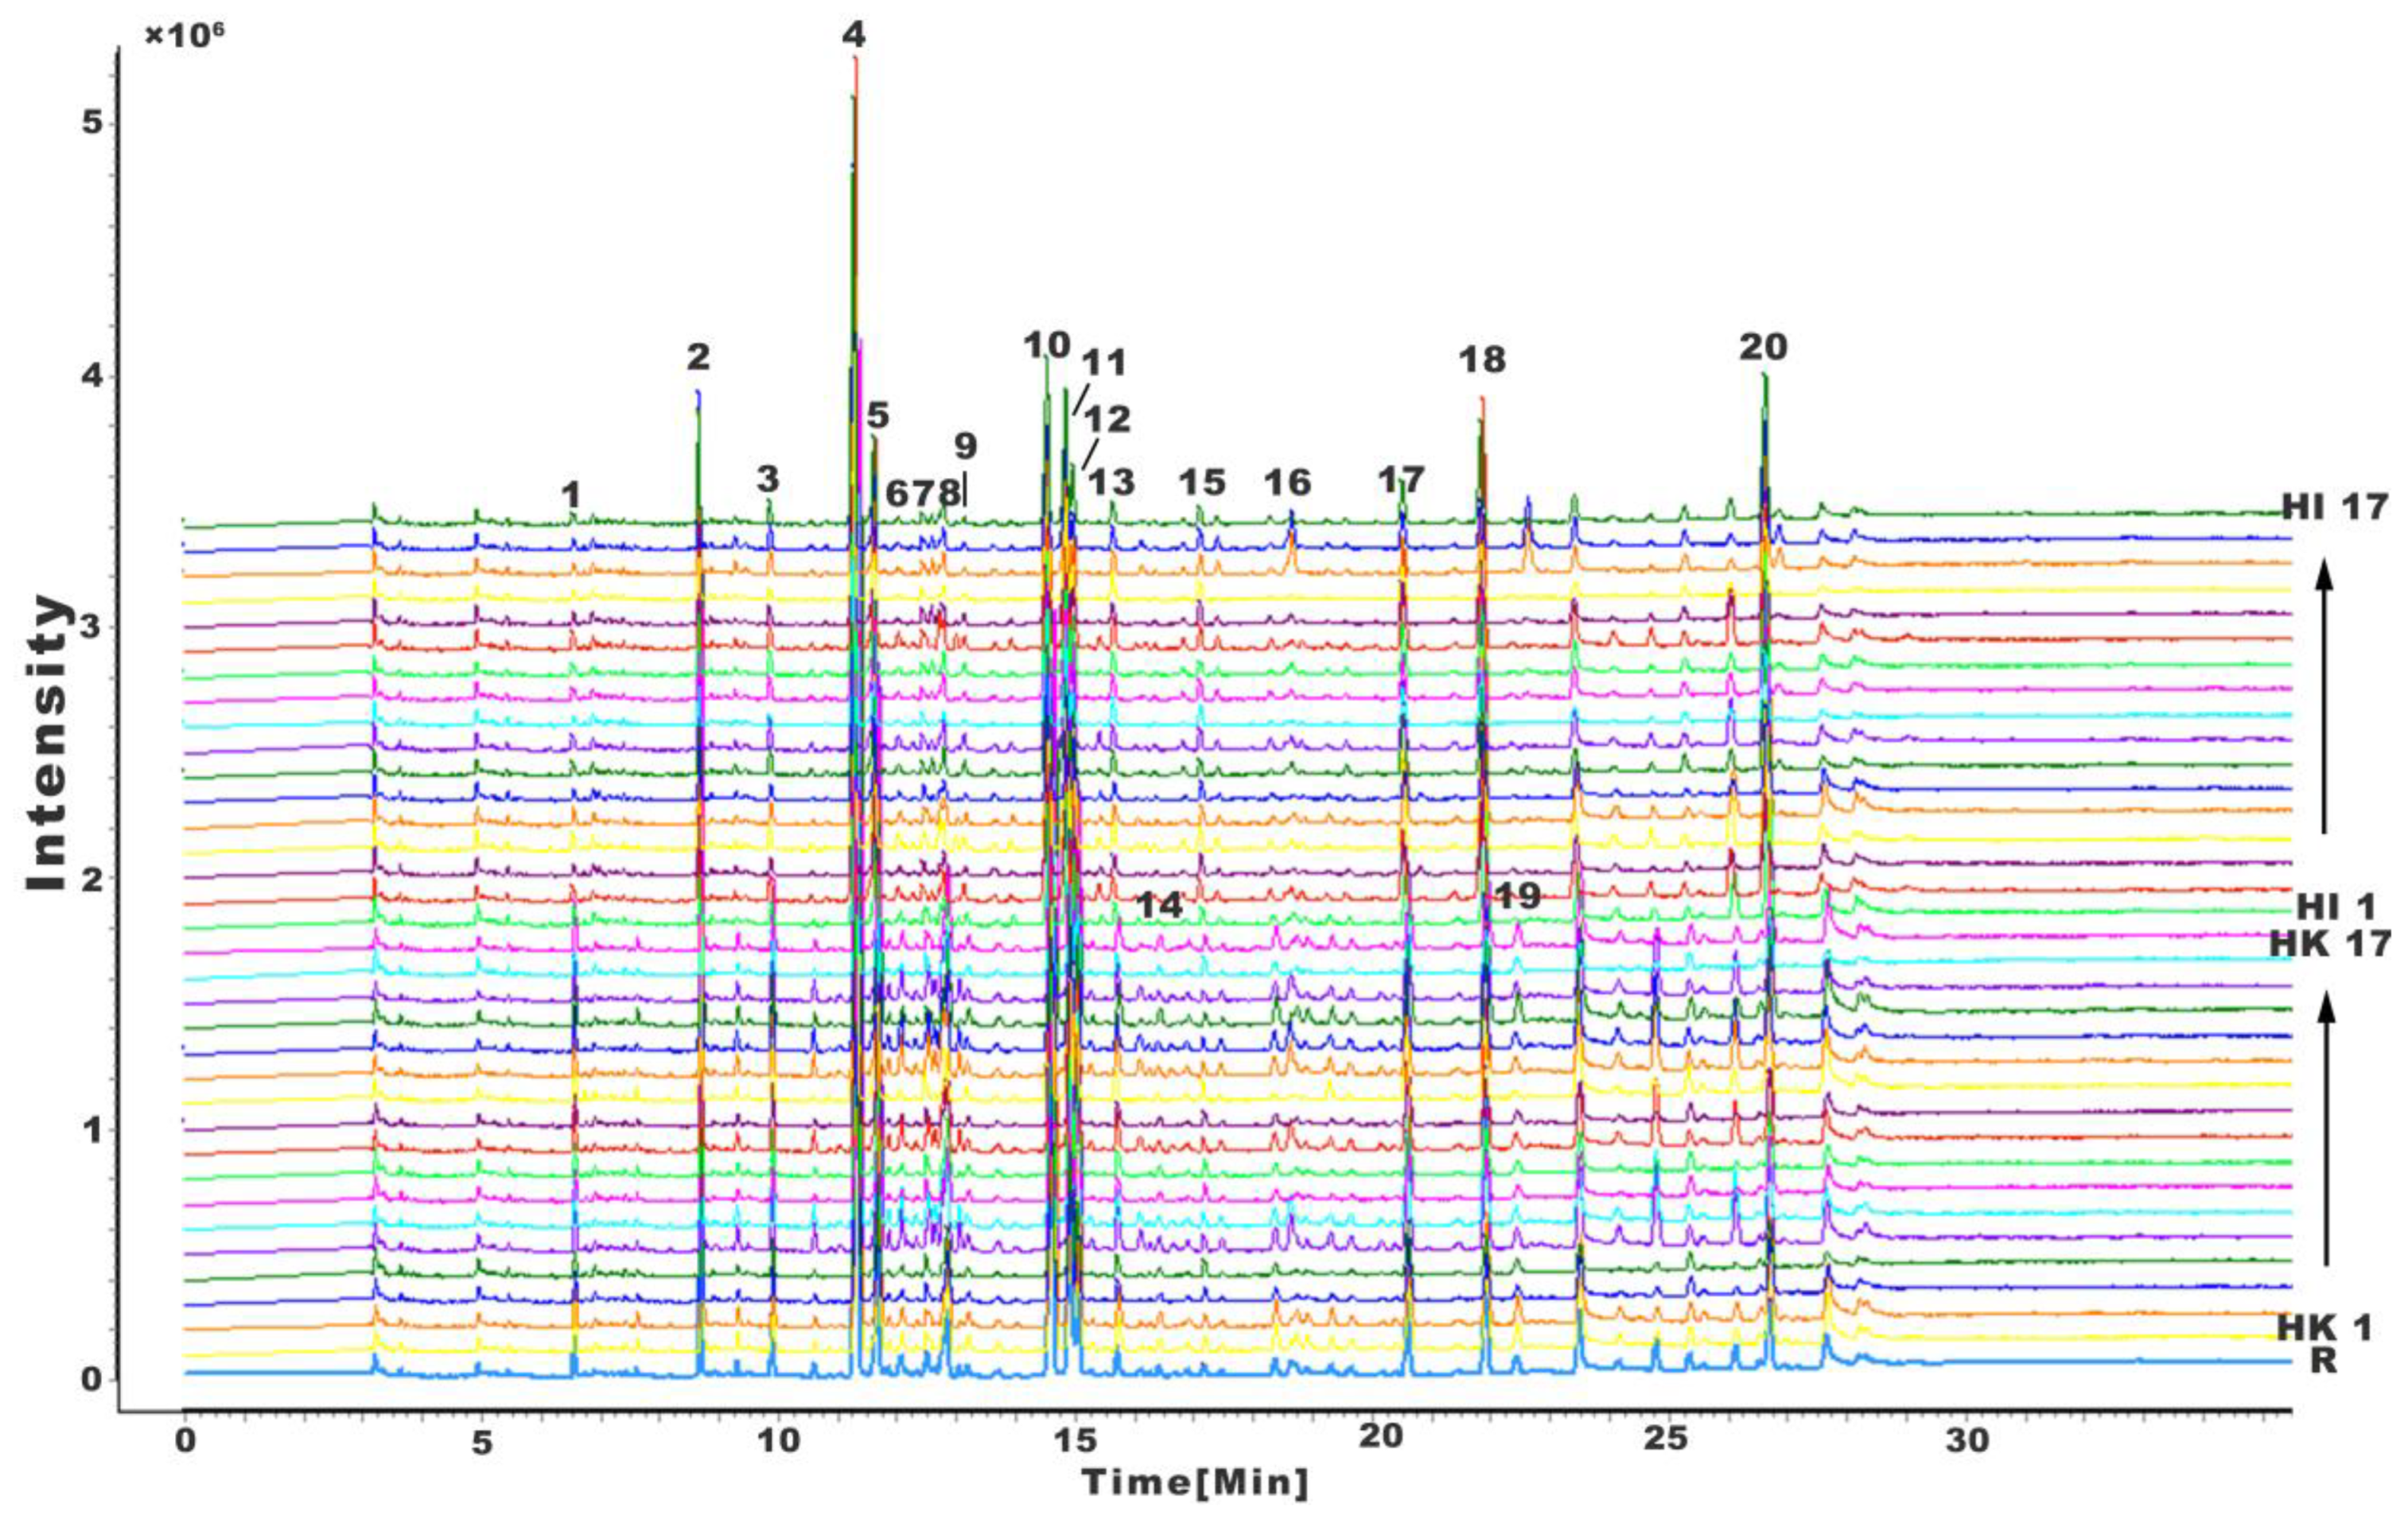
2.1. Fingerprints of H. kelloggi and H. ingens
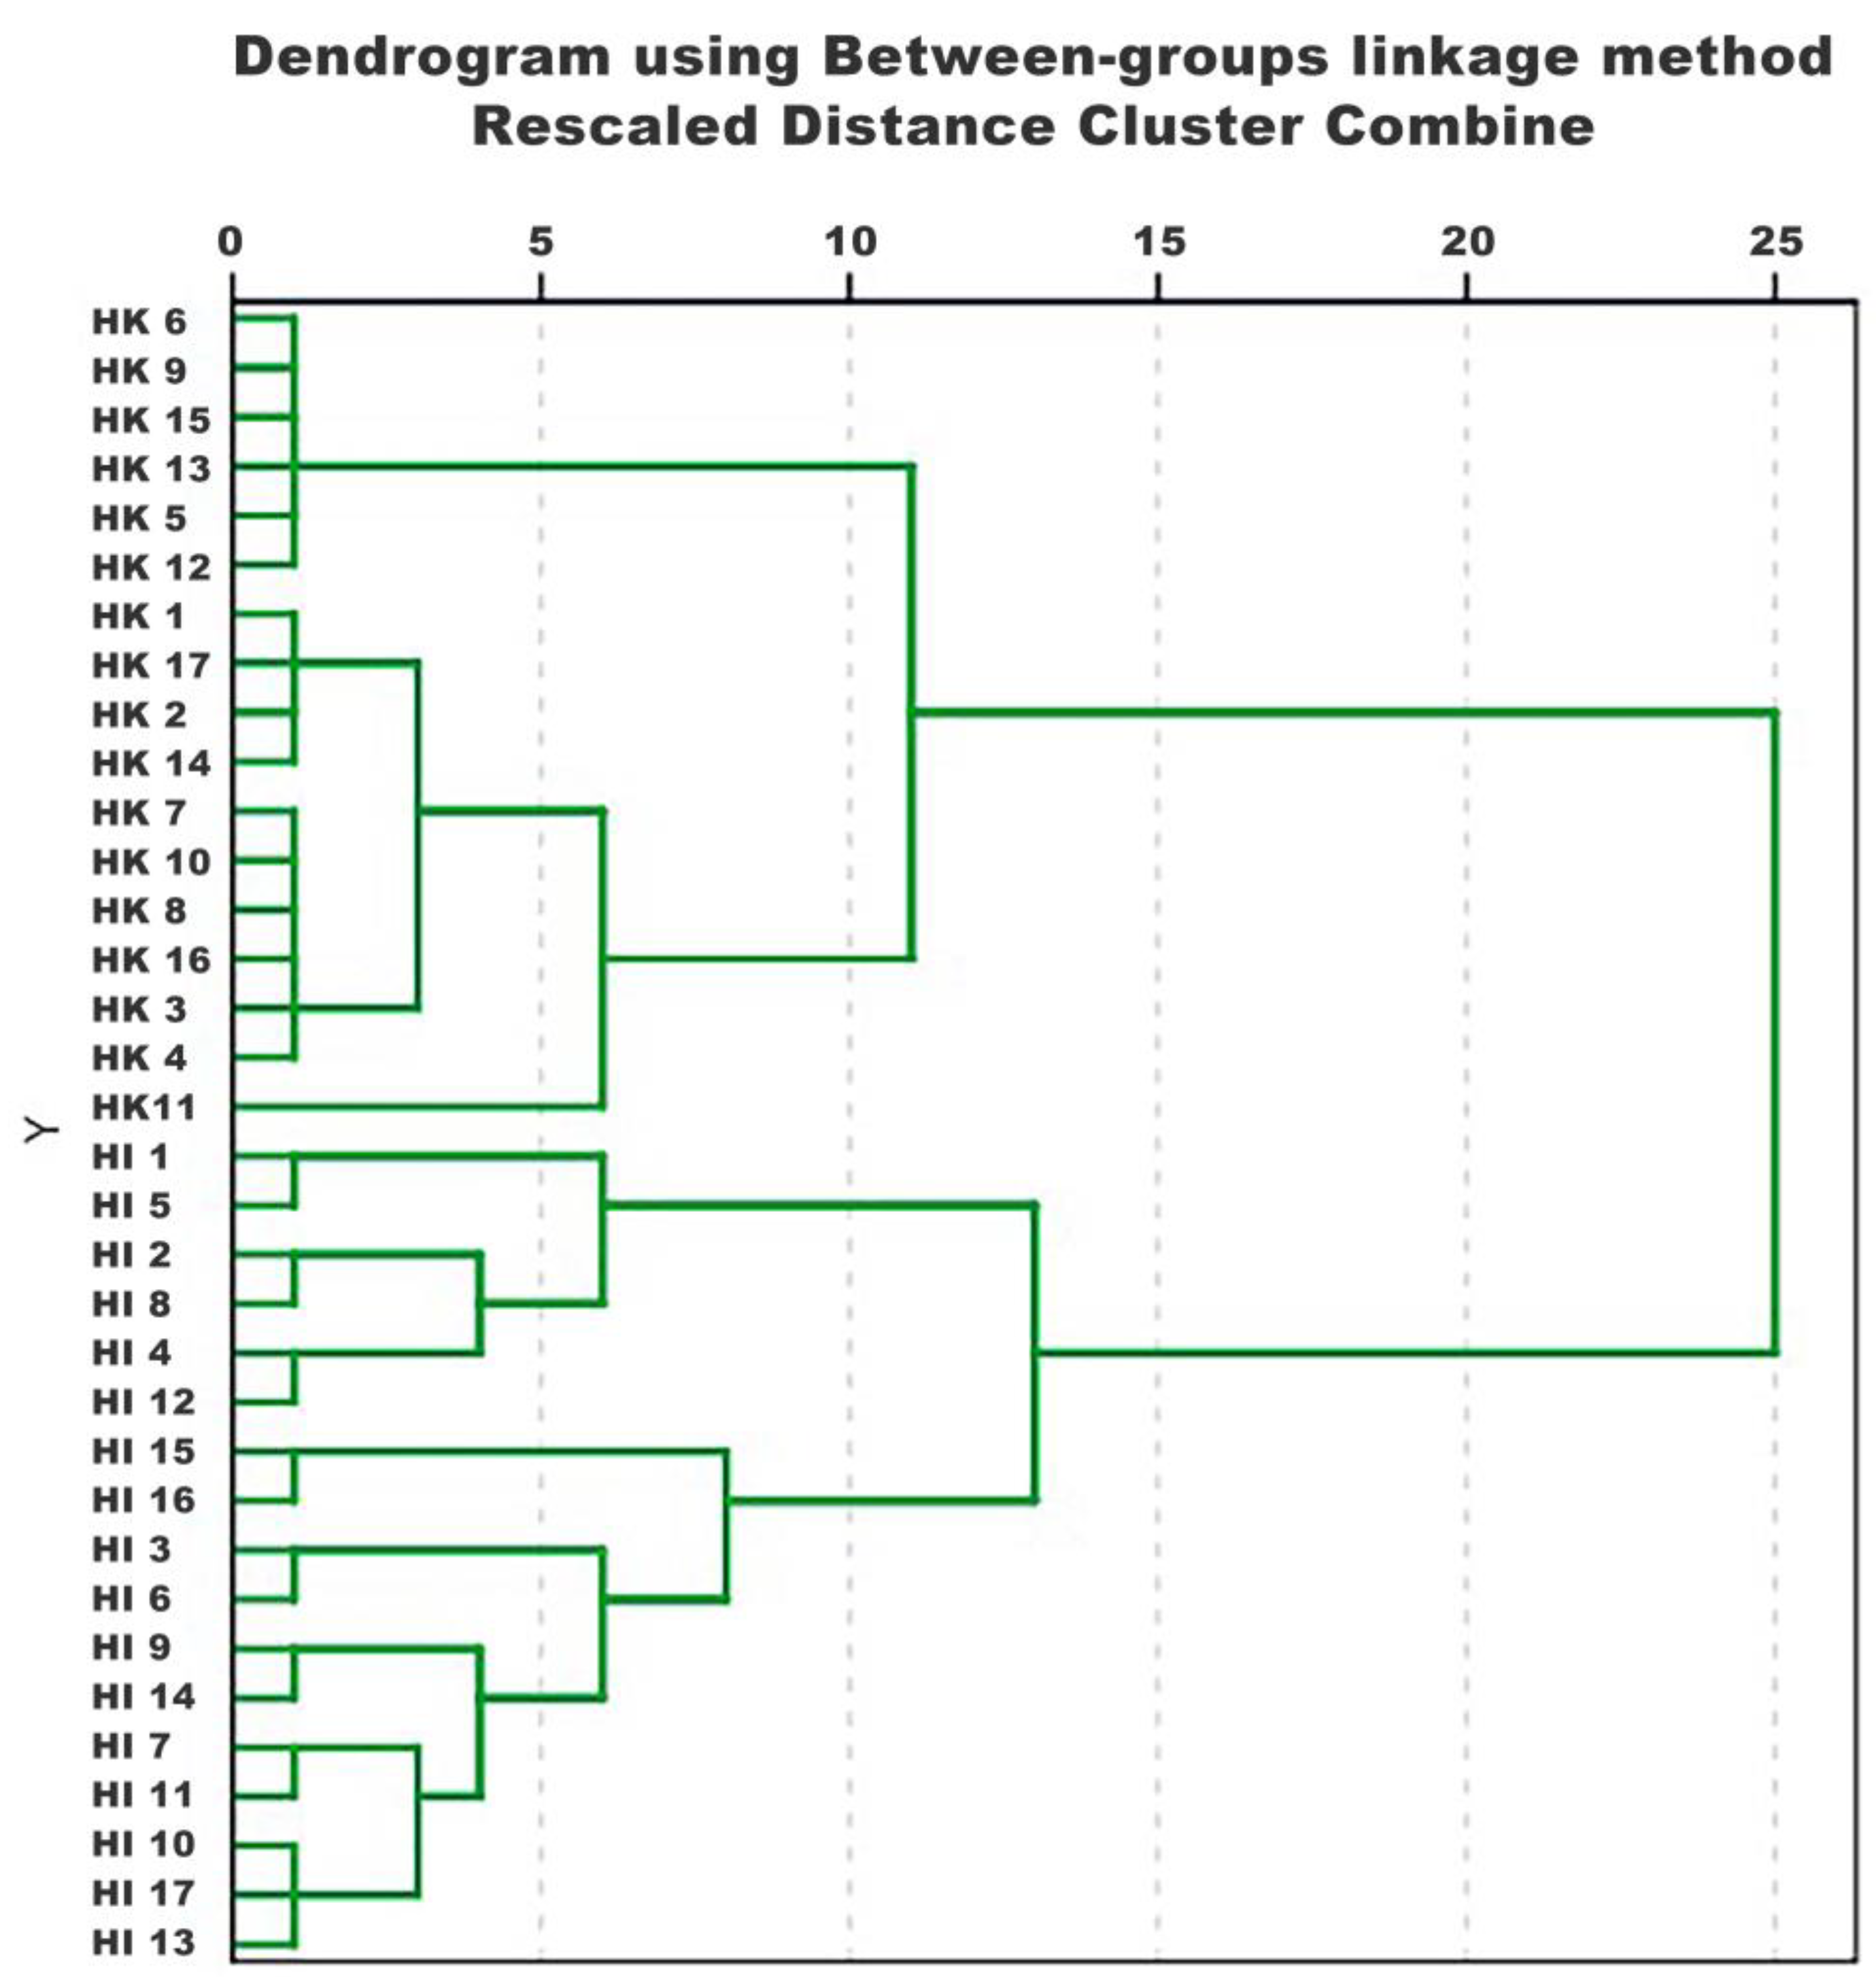
2.2. HCA
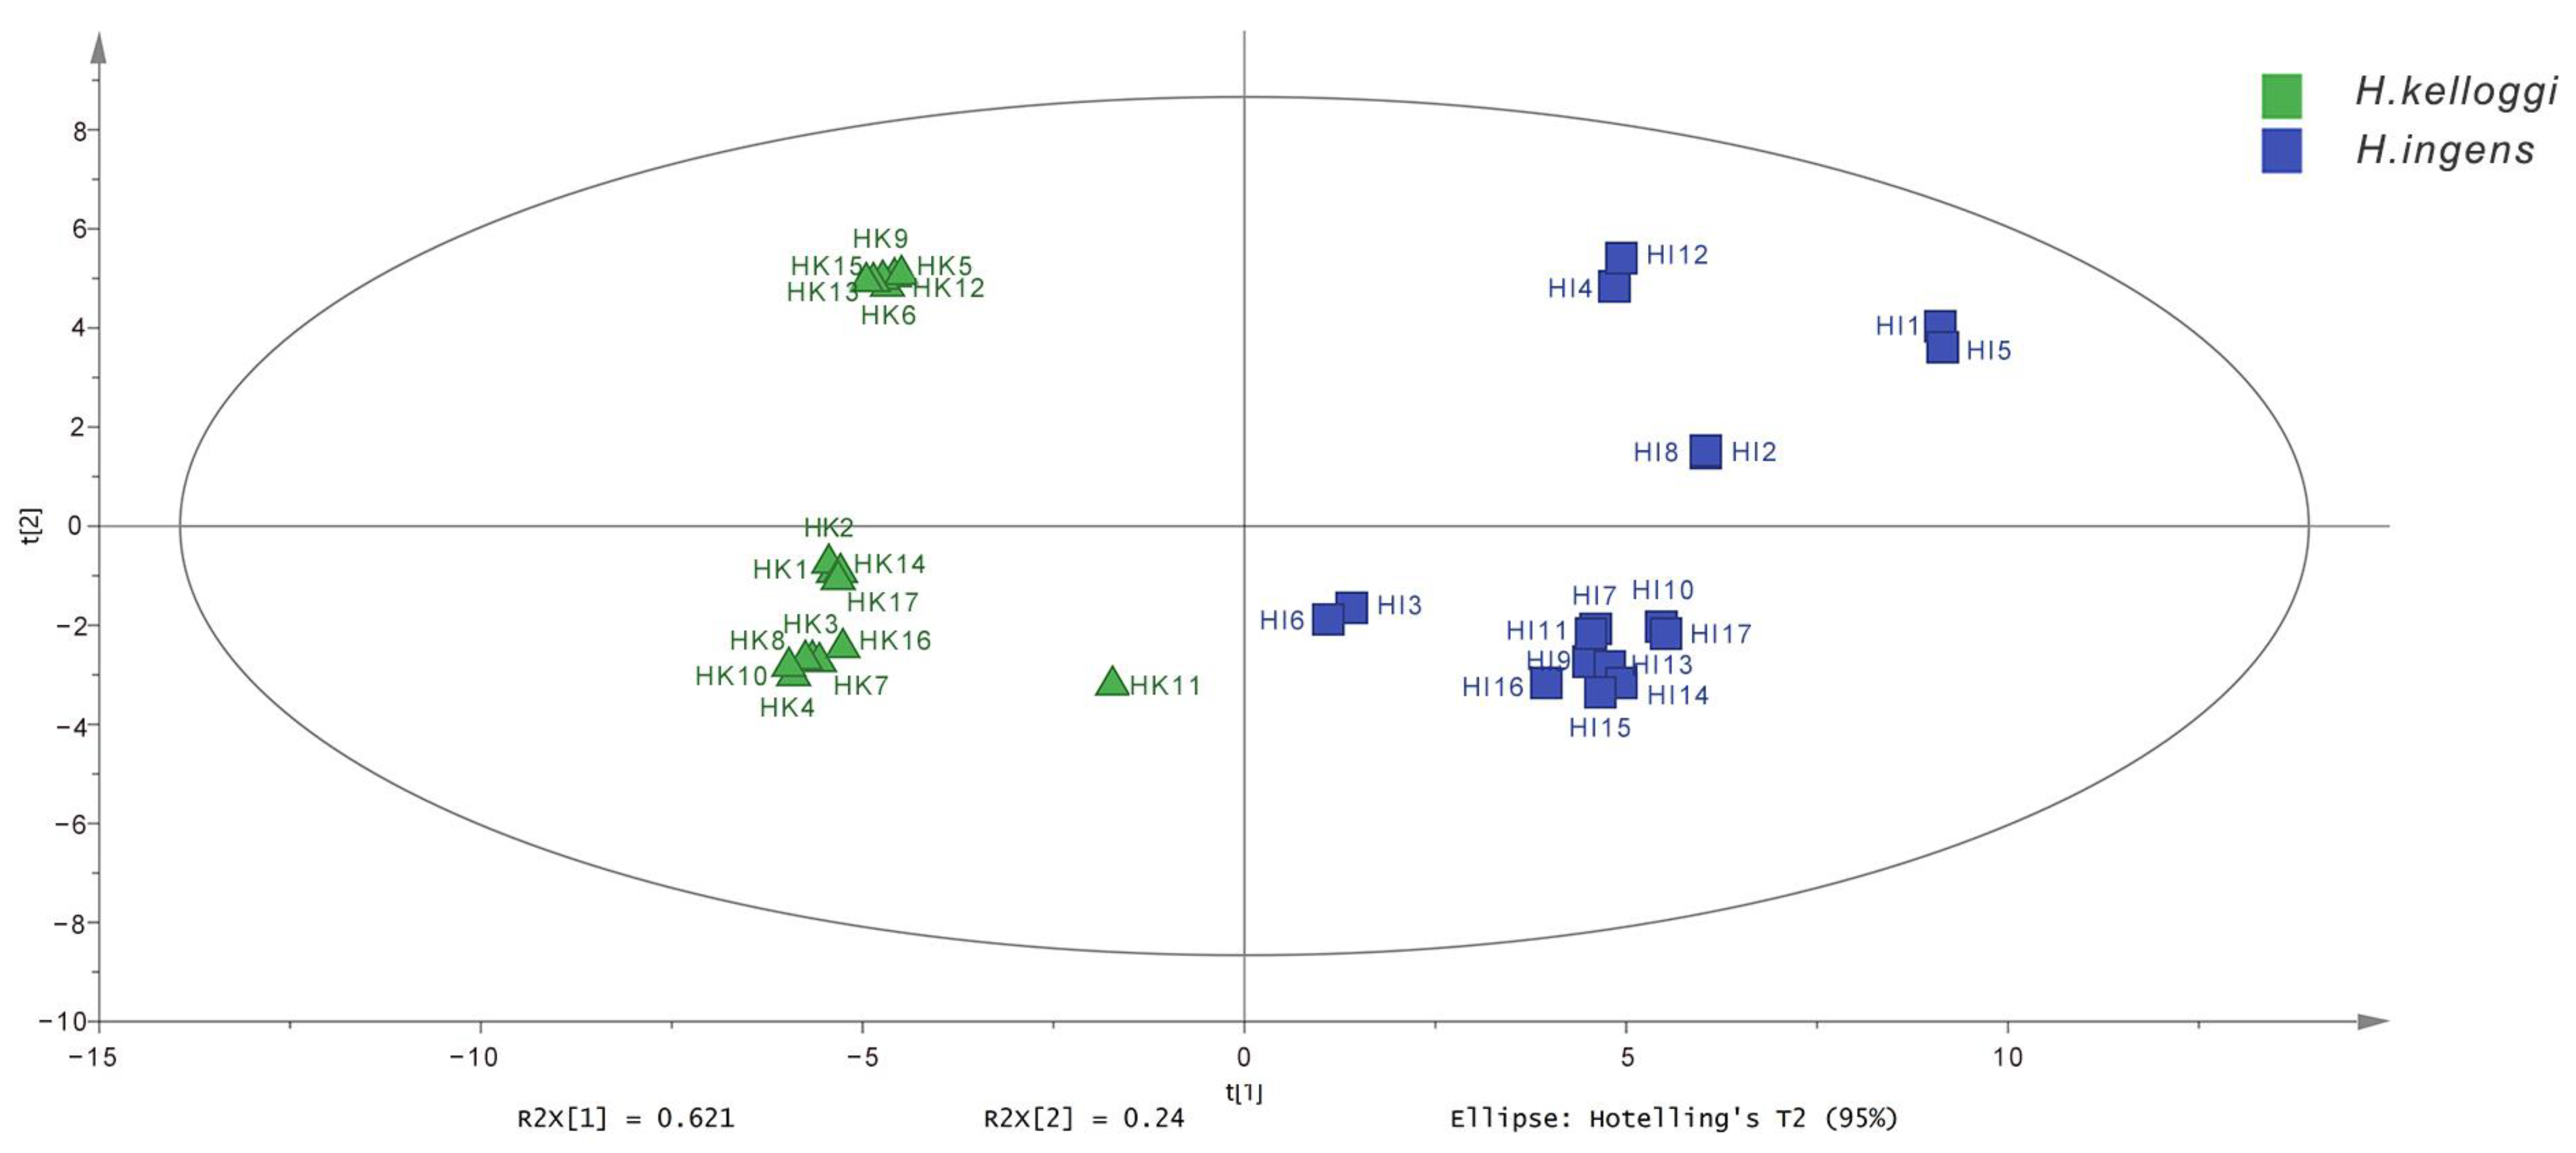
2.3. PCA
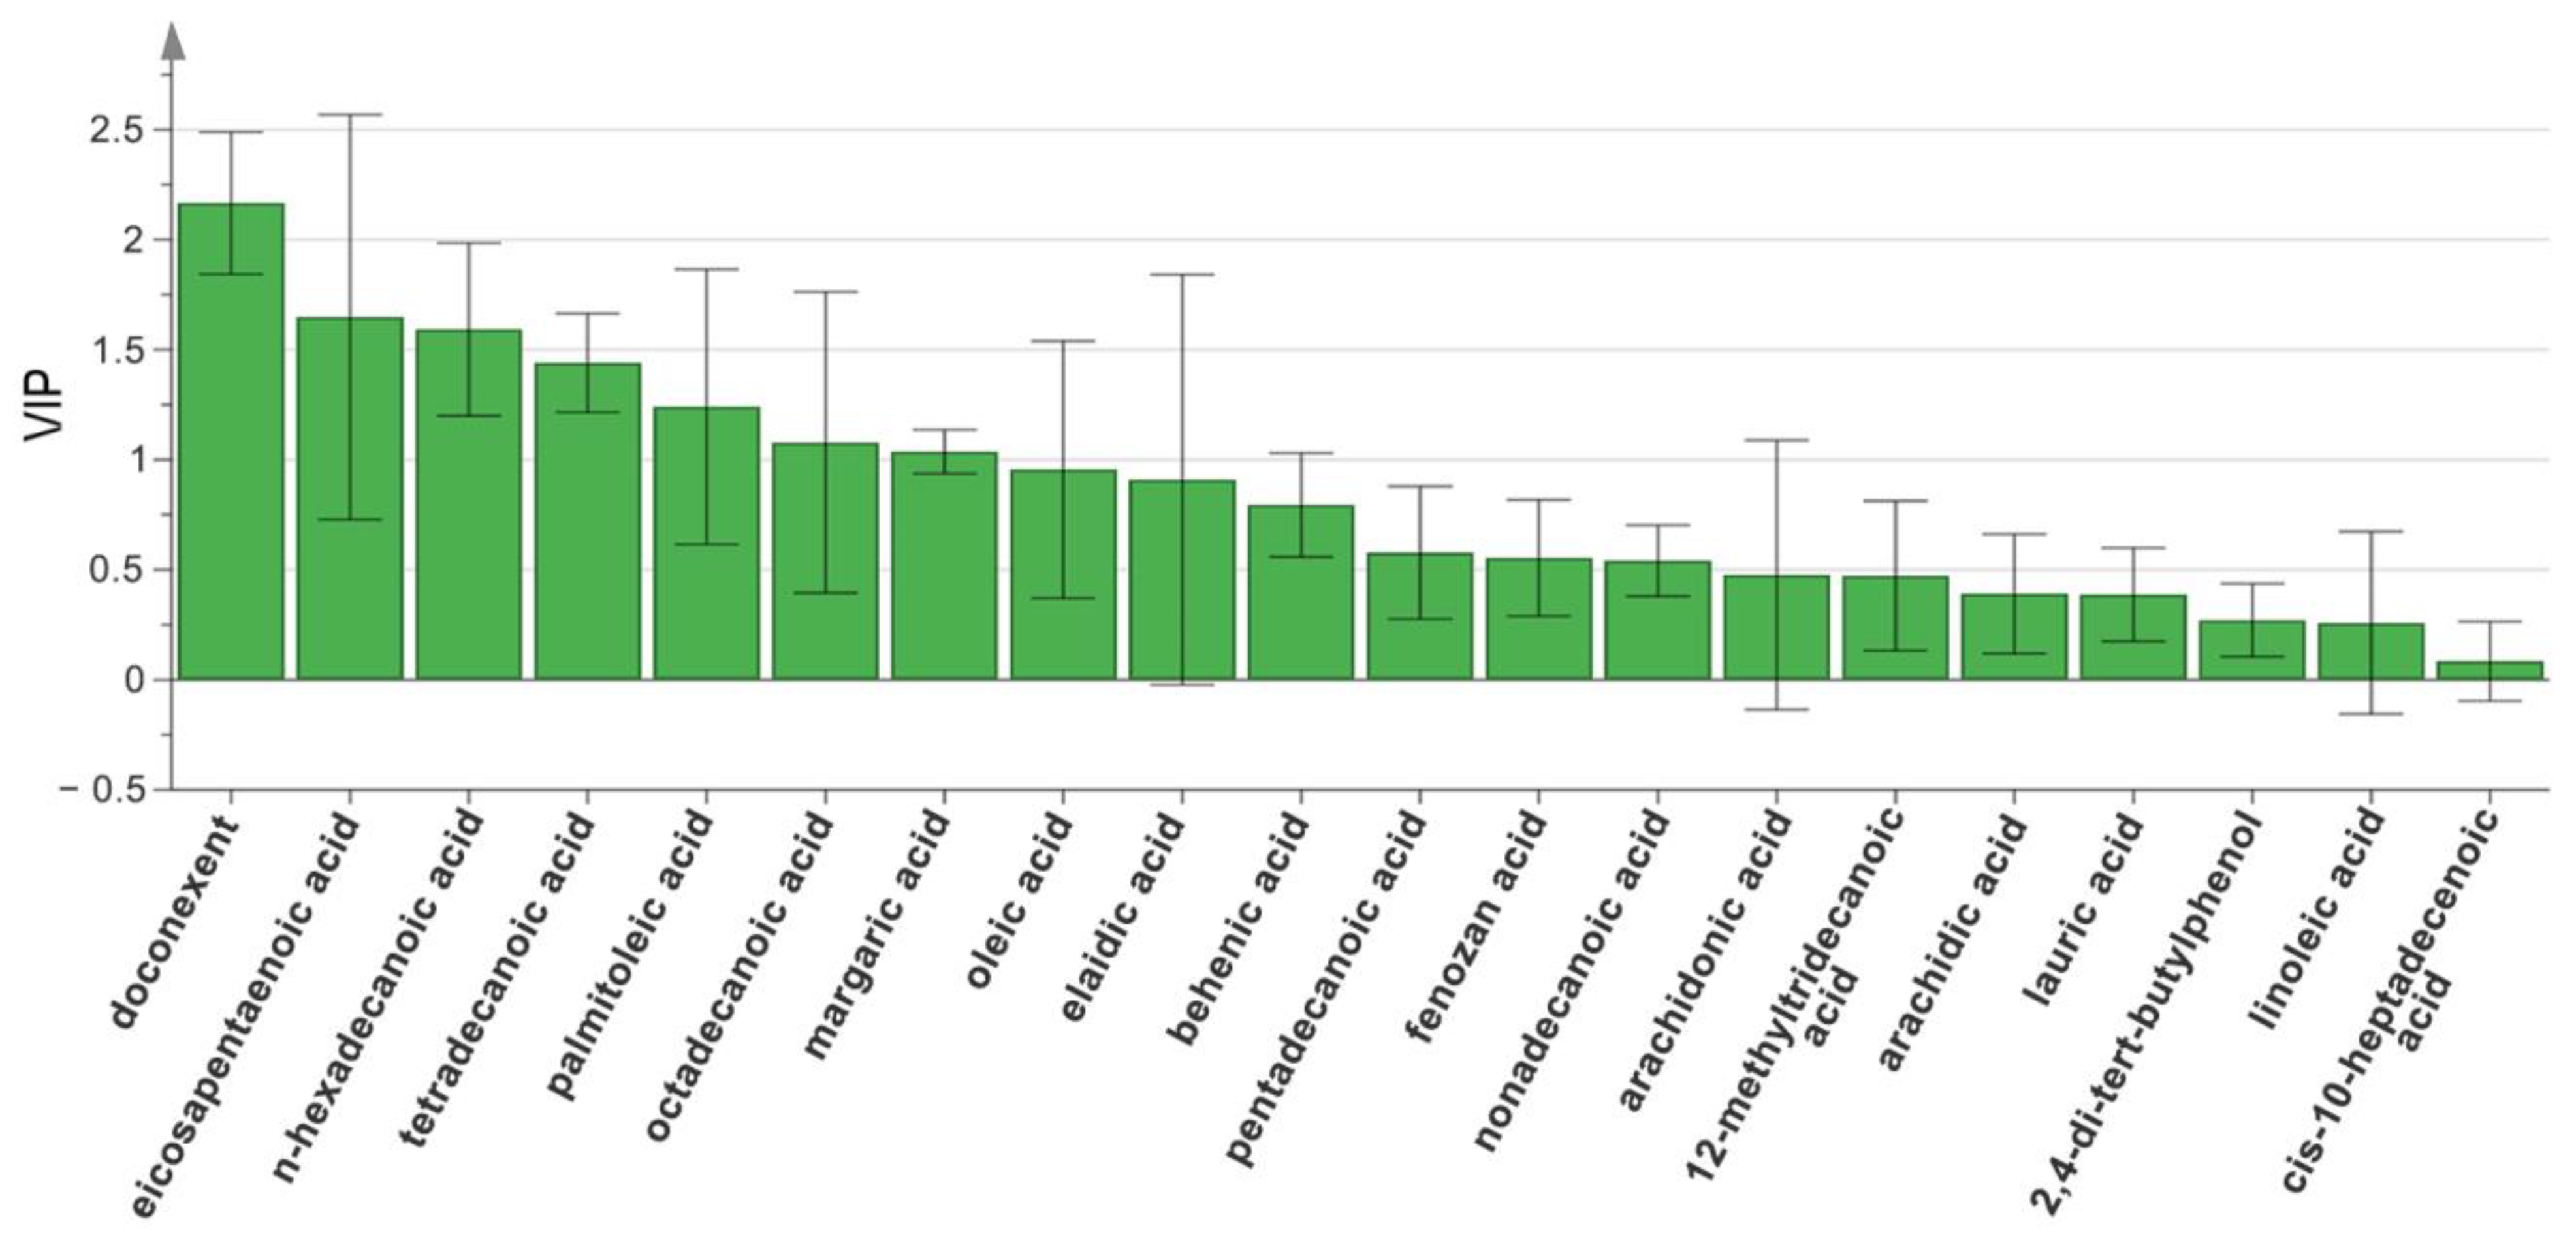
2.4. OPLS-DA
3. Materials and Methods
3.1. Experimental Materials
3.1.1. Samples
3.1.2. Reagents
3.1.3. Instruments
3.2. Preparation of Sample Extracts
3.2.1. Extraction of Samples
3.2.2. Methyl Esterification
3.3. GC-MS Analysis
3.4. Methodological Examination
3.4.1. Precision Test
3.4.2. Stability Test
3.4.3. Repeatability Test
3.5. Data Analysis
4. Conclusions
Supplementary Materials
Author Contributions
Funding
Institutional Review Board Statement
Informed Consent Statement
Data Availability Statement
Acknowledgments
Conflicts of Interest
References
- Chen, M.; Chen, J.Z.; Ge, Y.Q.; Shi, S.L.; Zhang, G.J.; Cheng, R.B. Research progress on chemical constituents and pharmacological activities of Hippocampus. Chin. Tradit. Herb. Drugs 2017, 48, 4089–4099. (In Chinese) [Google Scholar]
- Chinese Pharmacopoeia Commission. Pharmacopoeia of the People’s Republic of China; China Medical Science Press: Beijing, China, 2020; p. 305. [Google Scholar]
- Zhang, S.Y. Research status and culture technology of seahorse. Sci. Fish Farming 2022, 3–4. [Google Scholar] [CrossRef]
- Wang, H.T.; Liang, H.Y.; Zheng, C.B.; Yu, X.Y.; Jiang, Q.P. Techniques of artificial breeding and culture of Hippocampus kelloggi. Sci. Fish Farming 2019, 58–60. [Google Scholar] [CrossRef]
- Jiang, C.; Liu, F.Y.; Jin, Y.; Yuan, Y.; Zhao, Y.Y.; Huang, L.Q. Zoological origin survey of commercial hippocampus in Chinese herbal markets by morphological and DNA sequencing identification. China J. Chin. Mater. Medica 2018, 43, 4553–4561. [Google Scholar] [CrossRef]
- Tang, X.M.; Guo, J.L.; Chen, L.; Ho, P.C. Application for proteomics analysis technology in studying animal-derived traditional Chinese medicine: A review. J. Pharm. Biomed. Anal. 2020, 191, 113609. [Google Scholar] [CrossRef] [PubMed]
- Wan, D.G.; Yang, W.Y. A Holistic and Correlative View of Species/Varieties, Quality and Efficacy for Animal Medicines in TCM. Mod. Chin. Med. 2019, 21, 1127–1136. [Google Scholar] [CrossRef]
- Chen, M.; Zhu, L.Y.; Huang, Z.; Ge, Y.Q.; Zhang, G.J.; Cheng, R.B. Molecular identification of Hippocampus trimaculatus and its adulterants based on DNA barcoding. Chin. Tradit. Herb. Drugs 2019, 50, 5554–5562. (In Chinese) [Google Scholar]
- Sun, S.Y.; Fang, Y.; Lai, M.R.; Ge, Y.Q.; Zhang, G.J.; Cheng, R.B. Morphological characteristics identification and molecular DNA barcoding analysis of Hippocampus spinosissimus. China J. Chin. Mater. Medica 2019, 44, 4837–4843. [Google Scholar] [CrossRef]
- Zhang, G.X.; Liu, J.X.; Jia, J.; Sun, W.; Sun, Z.Y.; Shi, L.C. Molecular Identification of Hippocampus and Its Adulterants Based on COI Barcode. Chin. Pharm. J. 2015, 50, 1469–1473. (In Chinese) [Google Scholar]
- Zhang, C.H.; Xu, G.J.; Xu, L.S.; Wang, Q.; Suneo, N.T.; Shigetoshi, K. Analysis of Lipophilic Compounds in Syngnathus acus L. by GC/MS. J. China Pharm. Univ. 1998, 28–29. (In Chinese) [Google Scholar]
- Liu, J.; Chen, X.F.; Zou, Y.F. Progress on chemical pattern recognition in traditional Chinese medicines by multidimensional information of metabolic fingerprinting analysis. China J. Chin. Mater. Medica 2012, 37, 1081–1088. (In Chinese) [Google Scholar]
- Wen, Z.; Dang, Z.; Zhu, Z.X. Research on Identification of Sterols in Trachyrhamphus serratus and Starfish (Asterias amurensis) by GC-MS. Mar. Sci. Bull. 2003, 22, 92–95. (In Chinese) [Google Scholar]
- Li, J.; Li, J.; Fu, P.; Peng, S.; Chen, L.Y.; Yu, X.L. Improvement of Quality Standard of Shenwei Gubi Tablets and Changes of Transfer Rates of Its Quality Control Indicators in Production Based on Chemical Pattern Recognition Technology. Chin. J. Exp. Tradit. Med. Formulae 2020, 26, 130–136. [Google Scholar] [CrossRef]
- Yan, X.; Wang, W.; Chen, Z.; Xie, Y.; Li, Q.; Yu, Z.; Hu, H.; Wang, Z. Quality assessment and differentiation of Aucklandiae Radix and Vladimiriae Radix based on GC-MS fingerprint and chemometrics analysis: Basis for clinical application. Anal. Bioanal. Chem. 2020, 412, 1535–1549. [Google Scholar] [CrossRef]
- Lv, S.; Wu, Y.; Zhou, J.; Lian, M.; Li, C.; Xu, Y.; Liu, S.; Wang, C.; Meng, Q. The study of fingerprint characteristics of Dayi Pu-Erh tea using a fully automatic HS-SPME/GC-MS and combined chemometrics method. PLoS ONE 2014, 9, e116428. [Google Scholar] [CrossRef]
- Wang, W.; Jiang, Y.; Song, B.; Tang, X.; Wu, H.; Jin, Z.; Chen, L. Discovery of quality markers in the rhizome of Atractylodes chinensis using GC–MS fingerprint and network pharmacology. Arab. J. Chem. 2023, 16, 105114. [Google Scholar] [CrossRef]
- Ongo, E.A.; Montevecchi, G.; Antonelli, A.; Sberveglieri, V.; Sevilla, I.F. Metabolomics fingerprint of Philippine coffee by SPME-GC-MS for geographical and varietal classification. Food Res. Int. 2020, 134, 109227. [Google Scholar] [CrossRef]
- Sone, M.; Komatsu, K.; Zhu, S.; Cheng, X.; Ketphanh, S.; Kawahara, N. Essential oil components in the seed masses of Amomum xanthioides and its related species from Southeast Asia and China. J. Nat. Med. 2022, 76, 435–450. [Google Scholar] [CrossRef] [PubMed]
- Dyall, S.C. Long-chain omega-3 fatty acids and the brain: A review of the independent and shared effects of EPA, DPA and DHA. Front. Aging Neurosci. 2015, 7, 52. [Google Scholar] [CrossRef] [PubMed]
- Yang, X.Q.; Lv, J.W.; Lin, W.L.; Li, L.H.; Li, X.Y. Research progress in biological function and antioxidative activity of DHA (Docosahexaenoic acid). Sci. Technol. Food Ind. 2014, 35, 390–394. [Google Scholar] [CrossRef]
- Stough, C.; Downey, L.; Silber, B.; Lloyd, J.; Kure, C.; Wesnes, K.; Camfield, D. The effects of 90-day supplementation with the omega-3 essential fatty acid docosahexaenoic acid (DHA) on cognitive function and visual acuity in a healthy aging population. Neurobiol. Aging 2012, 33, e821–e823. [Google Scholar] [CrossRef]
- German, O.L.; Insua, M.F.; Gentili, C.; Rotstein, N.P.; Politi, L.E. Docosahexaenoic acid prevents apoptosis of retina photoreceptors by activating the ERK/MAPK pathway. J. Neurochem. 2006, 98, 1507–1520. [Google Scholar] [CrossRef]
- Shi, Y.; Wei, F.; Ma, S.C. Discussion on application of principal component analysis in analysis of traditional Chinese medicines and natural drugs. China J. Chin. Mater. Medica 2018, 43, 3031–3035. (In Chinese) [Google Scholar]
- Sun, J.; Xia, S.; Xie, S.; Yang, Y.; Cui, P.; Shao, P.; Xu, Y.; Shuang, L. Biochemical composition of wild and cultured seahorses (Hippocampus kuda Bleeker). Aquac. Res. 2020, 51, 1542–1550. [Google Scholar] [CrossRef]
- Jiang, Z.Z.; Xu, Y.J.; Su, Y.T. The extraction technology of fat from bone powder of seahorse by SFE and the analysis of fatty acid composition. Chin. J. Mar. Drugs 2013, 32, 47–52. (In Chinese) [Google Scholar]
- Ou, H.M.; Zhang, X.L.; Zhong, R.Z.; Li, J.Z.; Tan, Z.L.; Xu, L.W.; Jiao, J.Z. Change law of odor fatty acid contents in three adipose tissues of Hulun buir sheep at different growth stages. Chin. J. Anim. Nutr. 2022, 34, 7220–7227. (In Chinese) [Google Scholar]
- Chiu, H.H.; Kuo, C.H. Gas chromatography-mass spectrometry-based analytical strategies for fatty acid analysis in biological samples. J. Food Drug Anal. 2020, 28, 60–73. [Google Scholar] [CrossRef]


| Similarity | Sample No. | ||||||||||||||||
|---|---|---|---|---|---|---|---|---|---|---|---|---|---|---|---|---|---|
| 1 | 2 | 3 | 4 | 5 | 6 | 7 | 8 | 9 | 10 | 11 | 12 | 13 | 14 | 15 | 16 | 17 | |
| HK | 0.997 | 0.997 | 0.992 | 0.990 | 0.995 | 0.996 | 0.992 | 0.992 | 0.994 | 0.993 | 0.979 | 0.994 | 0.994 | 0.996 | 0.994 | 0.990 | 0.996 |
| HI | 0.885 | 0.937 | 0.967 | 0.951 | 0.879 | 0.968 | 0.945 | 0.940 | 0.941 | 0.935 | 0.938 | 0.946 | 0.933 | 0.936 | 0.931 | 0.937 | 0.937 |
| No. | Retention Time | Component | Molecular Formula | Relative Content (%) | |||||||||||||||||
|---|---|---|---|---|---|---|---|---|---|---|---|---|---|---|---|---|---|---|---|---|---|
| 1 | 2 | 3 | 4 | 5 | 6 | 7 | 8 | 9 | 10 | 11 | 12 | 13 | 14 | 15 | 16 | 17 | Mean ± S.D. | ||||
| 1 | 6.567 | lauric acid | C12H24O2 | 0.91 | 0.86 | 1.07 | 1.06 | 0.78 | 0.68 | 1.16 | 1.2 | 0.68 | 1.21 | 1.09 | 0.71 | 0.67 | 0.86 | 0.72 | 1.16 | 0.92 | 0.93 ± 0.20 |
| 2 | 8.677 | tetradecanoic acid | C12H24O2 | 7.06 | 7.48 | 5.32 | 5.35 | 7.47 | 7.6 | 5.49 | 5.44 | 7.69 | 5.57 | 6.64 | 7.49 | 7.7 | 7.35 | 8.01 | 5.32 | 7.11 | 6.71 ± 1.03 |
| 3 | 9.889 | pentadecanoic acid | C14H28O2 | 1.55 | 1.46 | 1.63 | 1.62 | 1.19 | 1.23 | 1.71 | 1.67 | 1.19 | 1.67 | 1.67 | 1.2 | 1.24 | 1.51 | 1.3 | 1.67 | 1.45 | 1.47 ± 0.20 |
| 4 | 11.303 | n-hexadecanoic acid | C15H30O2 | 25.44 | 25.57 | 28.36 | 26.98 | 24.12 | 24.82 | 27.44 | 27.69 | 25.06 | 27.56 | 25.47 | 24.43 | 25.16 | 25.21 | 24.98 | 26.97 | 25.44 | 25.92 ± 1.29 |
| 5 | 11.64 | palmitoleic acid | C16H32O2 | 6.82 | 6.84 | 5.92 | 5.9 | 8.57 | 8.61 | 5.96 | 6.14 | 8.62 | 6.36 | 5.31 | 8.65 | 8.64 | 6.86 | 8.77 | 5.85 | 6.81 | 7.10 ± 1.25 |
| 6 | 12.055 | 12-methyltridecanoic acid | C16H30O2 | 0.76 | 0.71 | 1.04 | 1.15 | 1.29 | 1.27 | 1.01 | 1.03 | 1.22 | 1.03 | 0.63 | 1.23 | 1.27 | 0.69 | 1.21 | 1.02 | 0.77 | 1.02 ± 0.23 |
| 7 | 12.482 | 2,4-di-tert-butylphenol | C14H28O2 | 0.83 | 0.74 | 1.11 | 1.41 | 1.13 | 1.08 | 0.97 | 0.92 | 1.09 | 1.18 | 1.18 | 1.09 | 1.09 | 0.73 | 1.04 | 1.3 | 0.83 | 1.04 ± 0.19 |
| 8 | 12.819 | margaric acid | C14H22O | 3.09 | 2.96 | 3.28 | 3.41 | 3.25 | 3.13 | 3.26 | 3.43 | 3.22 | 3.4 | 2.21 | 3.14 | 3.22 | 2.99 | 3.11 | 3.24 | 3.24 | 3.15 ± 0.28 |
| 9 | 13.144 | cis-10-heptadecenoic acid | C17H34O2 | 0.57 | 0.71 | 0.85 | 0.73 | 0.45 | 0.43 | 0.61 | 0.88 | 0.44 | 0.87 | 0.74 | 0.47 | 0.45 | 0.68 | 0.44 | 0.75 | 0.81 | 0.64 ± 0.17 |
| 10 | 14.569 | octadecanoic acid | C17H32O2 | 16.45 | 15.92 | 15.78 | 16.61 | 11.75 | 11.94 | 16.36 | 15.87 | 11.79 | 16.25 | 16.54 | 11.81 | 11.68 | 16.24 | 11.99 | 15.74 | 16.74 | 14.67 ± 2.19 |
| 11 | 14.884 | elaidic acid | C18H36O2 | 8.01 | 7.89 | 8.52 | 8.15 | 5.16 | 5.31 | 8.49 | 8.77 | 5.12 | 8.71 | 7.07 | 5.19 | 4.93 | 7.98 | 5.21 | 8.43 | 8.23 | 7.13 ± 1.55 |
| 12 | 15.007 | oleic acid | C18H34O2 | 4.37 | 4.12 | 4.02 | 3.82 | 5.7 | 5.79 | 4.11 | 4.28 | 5.79 | 3.94 | 2.99 | 5.74 | 5.65 | 4.17 | 5.83 | 4.08 | 4.42 | 4.64 ± 0.90 |
| 13 | 15.681 | linoleic acid | C18H34O2 | 1.04 | 1.06 | 1.2 | 1.17 | 1.07 | 1.04 | 1.19 | 1.26 | 1.05 | 1.27 | 1.12 | 1.1 | 1.03 | 1.02 | 1.03 | 1.23 | 1.04 | 1.11 ± 0.09 |
| 14 | 16.422 | nonadecanoic acid | C18H32O2 | 0.44 | 0.44 | 0.51 | 0.58 | 0.31 | 0.3 | 0.49 | 0.54 | 0.28 | 0.55 | 0.33 | 0.29 | 0.28 | 0.45 | 0.27 | 0.52 | 0.46 | 0.41 ± 0.11 |
| 15 | 17.151 | fenozan acid | C18H32O2 | 0.34 | 0.29 | 0.61 | 0.84 | 0.29 | 0.31 | 0.62 | 0.63 | 0.3 | 0.62 | 0.74 | 0.28 | 0.29 | 0.26 | 0.22 | 0.87 | 0.33 | 0.46 ± 0.22 |
| 16 | 18.341 | arachidic acid | C17H26O3 | 0.84 | 0.84 | 0.73 | 1.09 | 0.62 | 0.62 | 0.76 | 0.74 | 0.59 | 0.81 | 0.38 | 0.6 | 0.65 | 0.87 | 0.64 | 1.01 | 0.85 | 0.74 ± 0.17 |
| 17 | 20.574 | arachidonic acid | C20H36O2 | 3.12 | 3.01 | 4.38 | 4.14 | 4.92 | 5.08 | 4.34 | 3.89 | 5.19 | 4.3 | 3.87 | 4.99 | 5 | 3.09 | 5.01 | 4.23 | 3.08 | 4.21 ± 0.77 |
| 18 | 21.91 | eicosapentaenoic acid | C20H32O2 | 4.32 | 4.2 | 3.27 | 2.55 | 5.98 | 6.22 | 3.22 | 3.04 | 6.28 | 2.82 | 4.79 | 6.29 | 6.06 | 4.16 | 6.17 | 3.13 | 4.5 | 4.53 ± 1.39 |
| 19 | 22.494 | behenic acid | C20H30O2 | 0.96 | 1.02 | 1.11 | 1.22 | 0.64 | 0.66 | 1 | 1 | 0.64 | 1.12 | 0.45 | 0.61 | 0.61 | 1.07 | 0.63 | 1.16 | 1.03 | 0.88 ± 0.25 |
| 20 | 26.691 | docosahexaenoic acid | C24H48O2 | 3.84 | 3.83 | 4.7 | 4.5 | 2.53 | 2.76 | 4.71 | 4.44 | 2.8 | 4.52 | 8.79 | 2.66 | 2.81 | 4 | 2.72 | 4.57 | 3.93 | 4.00 ± 1.48 |
| Total percentage of common compounds | 90.76 | 89.95 | 93.41 | 92.28 | 87.22 | 88.88 | 92.9 | 92.86 | 89.04 | 93.76 | 92.01 | 87.97 | 88.43 | 90.19 | 89.3 | 92.25 | 91.99 | 90.78 ± 2.06 | |||
| No. | Retention Time | Component | Molecular Formula | Relative Content (%) | |||||||||||||||||
|---|---|---|---|---|---|---|---|---|---|---|---|---|---|---|---|---|---|---|---|---|---|
| 1 | 2 | 3 | 4 | 5 | 6 | 7 | 8 | 9 | 10 | 11 | 12 | 13 | 14 | 15 | 16 | 17 | Mean ± S.D. | ||||
| 1 | 6.567 | lauric acid | C12H24O2 | 0.59 | 0.43 | 0.66 | 0.67 | 0.67 | 0.57 | 0.47 | 0.55 | 0.81 | 0.69 | 0.57 | 0.61 | 0.58 | 0.91 | 0.55 | 0.54 | 0.52 | 0.61 ± 0.12 |
| 2 | 8.677 | tetradecanoic acid | C12H24O2 | 3.54 | 3.29 | 3.07 | 3.58 | 3.4 | 3.05 | 3.81 | 3.14 | 2.2 | 3.65 | 3.78 | 3.53 | 3.43 | 2.36 | 5.31 | 5.55 | 3.88 | 3.56 ± 0.84 |
| 3 | 9.889 | pentadecanoic acid | C14H28O2 | 0.83 | 0.88 | 0.85 | 0.79 | 0.7 | 0.86 | 1.15 | 0.78 | 0.86 | 0.96 | 1.17 | 0.72 | 0.75 | 0.66 | 1.27 | 1.26 | 0.95 | 0.91 ± 0.19 |
| 4 | 11.303 | n-hexadecanoic acid | C15H30O2 | 18.33 | 22.83 | 24.46 | 22.81 | 19.49 | 24.48 | 23.02 | 22.67 | 21.63 | 22.84 | 23.35 | 22.79 | 23.52 | 21.53 | 20.95 | 22.29 | 23.55 | 22.38 ± 1.61 |
| 5 | 11.64 | palmitoleic acid | C16H32O2 | 4.7 | 5.06 | 5.34 | 6.15 | 4.84 | 5.48 | 4.81 | 4.87 | 4.09 | 4.61 | 4.83 | 6.15 | 4.84 | 3.99 | 4.03 | 4.23 | 4.8 | 4.87 ± 0.64 |
| 6 | 12.055 | 12-methyltridecanoic acid | C16H30O2 | 0.94 | 0.88 | 0.94 | 0.95 | 0.92 | 0.96 | 0.9 | 0.92 | 0 | 0.8 | 0.8 | 0.91 | 0 | 0 | 0 | 0 | 0 | 0.58 ± 0.45 |
| 7 | 12.482 | 2,4-di-tert-butylphenol | C14H28O2 | 1.23 | 0.67 | 0.82 | 1 | 0.94 | 0.85 | 0.63 | 0.65 | 0.97 | 0.68 | 0.65 | 0.97 | 0.9 | 0.87 | 0.81 | 0.82 | 0.72 | 0.83 ± 0.16 |
| 8 | 12.819 | margaric acid | C14H22O | 1.77 | 1.56 | 1.93 | 2.07 | 1.84 | 1.91 | 1.65 | 1.57 | 1.89 | 1.78 | 1.51 | 2.02 | 1.87 | 1.68 | 1.61 | 1.66 | 1.88 | 1.78 ± 0.17 |
| 9 | 13.144 | cis-10-heptadecenoic acid | C17H34O2 | 0.58 | 0.81 | 0.83 | 0.53 | 0.59 | 0.83 | 1.03 | 0.86 | 0 | 0.65 | 0.95 | 0.51 | 0.86 | 0.89 | 0.69 | 0.7 | 0.67 | 0.70 ± 0.24 |
| 10 | 14.569 | octadecanoic acid | C17H32O2 | 10.61 | 10.93 | 14.56 | 10.42 | 11.11 | 14.98 | 11.43 | 10.53 | 14.32 | 12.74 | 11.26 | 9.6 | 13.26 | 14.57 | 10.06 | 9.9 | 13.17 | 11.97 ± 1.84 |
| 11 | 14.884 | elaidic acid | C18H36O2 | 7.61 | 8.87 | 8.26 | 7.41 | 7.7 | 8.13 | 10.56 | 8.66 | 9.91 | 8.62 | 10.29 | 7.07 | 8.42 | 10.48 | 10.09 | 10.05 | 8.82 | 8.88 ± 1.15 |
| 12 | 15.007 | oleic acid | C18H34O2 | 3.44 | 3.46 | 3.71 | 3.84 | 3.36 | 3.8 | 3.57 | 3.35 | 2.95 | 3.3 | 3.34 | 3.65 | 2.58 | 3.16 | 1.94 | 1.91 | 3.43 | 3.22 ± 0.58 |
| 13 | 15.681 | linoleic acid | C18H34O2 | 0.97 | 0.96 | 1.14 | 1.21 | 0.9 | 1.18 | 1.35 | 0.92 | 2.62 | 1.37 | 1.35 | 1.12 | 1.1 | 2.76 | 1.36 | 1.39 | 1.36 | 1.36 ± 0.53 |
| 14 | 16.422 | nonadecanoic acid | C18H32O2 | 0 | 0 | 0 | 0 | 0 | 0 | 0 | 0 | 0 | 0 | 0 | 0 | 0 | 0 | 0 | 0 | 0 | - |
| 15 | 17.151 | fenozan acid | C18H32O2 | 0.71 | 0.74 | 1.12 | 0.8 | 0.68 | 1.08 | 0.8 | 0.76 | 1.72 | 0.95 | 0.84 | 0.77 | 1.33 | 1.66 | 1.05 | 1.15 | 0.95 | 1.01 ± 0.31 |
| 16 | 18.341 | arachidic acid | C17H26O3 | 0.52 | 0.78 | 0.97 | 0.43 | 0.53 | 0 | 0 | 0.46 | 0 | 0.52 | 0 | 0.42 | 0.86 | 0 | 0.47 | 0 | 0.82 | 0.40 ± 0.34 |
| 17 | 20.574 | arachidonic acid | C20H36O2 | 3.61 | 3.83 | 2.48 | 5.02 | 3.74 | 2.37 | 4.59 | 3.77 | 3.5 | 2.75 | 4.75 | 4.84 | 2.69 | 3.7 | 2.41 | 2.45 | 2.96 | 3.50 ± 0.91 |
| 18 | 21.91 | eicosapentaenoic acid | C20H32O2 | 14.01 | 11.42 | 7.44 | 12.99 | 14.51 | 7.1 | 7.16 | 11.06 | 7.83 | 8.46 | 7.01 | 13.06 | 7.75 | 8.04 | 4.36 | 4.49 | 9.07 | 9.16 ± 3.13 |
| 19 | 22.494 | behenic acid | C20H30O2 | 0 | 0 | 0 | 0 | 0 | 0 | 0 | 0 | 0 | 0 | 0 | 0 | 0 | 0 | 0 | 0 | 0 | - |
| 20 | 26.691 | docosahexaenoic acid | C24H48O2 | 9.91 | 9.62 | 8.06 | 7.05 | 10.51 | 8.08 | 11.03 | 9.52 | 9.57 | 12.05 | 11.22 | 6.75 | 12.03 | 10.14 | 11.52 | 11.14 | 12.45 | 10.04 ± 1.73 |
| Total percentage of common compounds | 83.9 | 87.02 | 86.64 | 87.72 | 86.43 | 85.71 | 87.96 | 85.04 | 84.87 | 87.42 | 87.67 | 85.49 | 86.77 | 87.4 | 78.48 | 79.53 | 90 | 85.77 ± 2.92 | |||
| No. | Species | Collection Place | Batch Number | No. | Species | Collection Place | Batch Number |
|---|---|---|---|---|---|---|---|
| HK1 | H. kelloggi | Chengdu Hehuachi Traditional Chinese Medicine Market | HK20230301H | HI1 | H. ingens | Chengdu Hehuachi Traditional Chinese Medicine Market | HI20220901H |
| HK2 | H. kelloggi | Chengdu Hehuachi Traditional Chinese Medicine Market | HK20230302H | HI2 | H. ingens | Chengdu Hehuachi Traditional Chinese Medicine Market | HI20220902H |
| HK3 | H. kelloggi | Chengdu Hehuachi Traditional Chinese Medicine Market | HK20230303H | HI3 | H. ingens | Chengdu Hehuachi Traditional Chinese Medicine Market | HI20220903H |
| HK4 | H. kelloggi | Chengdu Hehuachi Traditional Chinese Medicine Market | HK20230304H | HI4 | H. ingens | Chengdu Hehuachi Traditional Chinese Medicine Market | HI20220904H |
| HK5 | H. kelloggi | Chengdu Hehuachi Traditional Chinese Medicine Market | HK20230305H | HI5 | H. ingens | Chengdu Hehuachi Traditional Chinese Medicine Market | HI20221105H |
| HK6 | H. kelloggi | Chengdu Hehuachi Traditional Chinese Medicine Market | HK20230306H | HI6 | H. ingens | Chengdu Hehuachi Traditional Chinese Medicine Market | HI20221106H |
| HK7 | H. kelloggi | Chengdu Hehuachi Traditional Chinese Medicine Market | HK20230307H | HI7 | H. ingens | Guangxi Yulin Traditional Chinese Medicine Market | HI20221107Q |
| HK8 | H. kelloggi | Chengdu Hehuachi Traditional Chinese Medicine Market | HK20230308H | HI8 | H. ingens | Guangxi Yulin Traditional Chinese Medicine Market | HI20221108Y |
| HK9 | H. kelloggi | Guangxi Yulin Traditional Chinese Medicine Market | HK20221101Y | HI9 | H. ingens | Guangxi Yulin Traditional Chinese Medicine Market | HI20221109Y |
| HK10 | H. kelloggi | Guangxi Yulin Traditional Chinese Medicine Market | HK20221102Y | HI10 | H. ingens | Guangxi Yulin Traditional Chinese Medicine Market | HI20221110Y |
| HK11 | H. kelloggi | Guangxi Yulin Traditional Chinese Medicine Market | HK 20221103Y | HI11 | H. ingens | Guangxi Yulin Traditional Chinese Medicine Market | HI20221111Y |
| HK12 | H. kelloggi | Guangxi Yulin Traditional Chinese Medicine Market | HK20221104Y | HI12 | H. ingens | Guangxi Yulin Traditional Chinese Medicine Market | HI20221112Y |
| HK13 | H. kelloggi | Guangxi Yulin Traditional Chinese Medicine Market | HK20221105Y | HI13 | H. ingens | Guangzhou Qingping Traditional Chinese Medicine Market | HI20221113Q |
| HK14 | H. kelloggi | Guangzhou Qingping Traditional Chinese Medicine Market | HK20221106Q | HI14 | H. ingens | Guangzhou Qingping Traditional Chinese Medicine Market | HI20221114Q |
| HK15 | H. kelloggi | Guangzhou Qingping Traditional Chinese Medicine Market | HK20221107Q | HI15 | H. ingens | Guangzhou Qingping Traditional Chinese Medicine Market | HI20221115Q |
| HK16 | H. kelloggi | Guangzhou Qingping Traditional Chinese Medicine Market | HK20221108H | HI16 | H. ingens | Guangzhou Qingping Traditional Chinese Medicine Market | HI20221116Q |
| HK17 | H. kelloggi | Guangzhou Qingping Traditional Chinese Medicine Market | HK20221109H | HI17 | H. ingens | Guangzhou Qingping Traditional Chinese Medicine Market | H20221117Q |
| Incubation Time (min) | 0.5 | 1 | 2 | 5 | 10 | 20 | 30 | 60 | 120 |
|---|---|---|---|---|---|---|---|---|---|
| 0.5 | 1 | 1 | 1 | 1 | 0.999 | 0.999 | 0.998 | 0.998 | 0.993 |
| 1 | 1 | 1 | 1 | 1 | 0.999 | 0.999 | 0.998 | 0.998 | 0.994 |
| 2 | 1 | 1 | 1 | 1 | 0.999 | 0.999 | 0.999 | 0.998 | 0.994 |
| 5 | 1 | 1 | 1 | 1 | 1 | 0.999 | 0.999 | 0.998 | 0.994 |
| 10 | 0.999 | 0.999 | 0.999 | 1 | 1 | 1 | 1 | 0.999 | 0.996 |
| 20 | 0.999 | 0.999 | 0.999 | 0.999 | 1 | 1 | 0.999 | 0.999 | 0.996 |
| 30 | 0.998 | 0.998 | 0.999 | 0.999 | 1 | 0.999 | 1 | 1 | 0.997 |
| 60 | 0.998 | 0.998 | 0.998 | 0.998 | 0.999 | 0.999 | 1 | 1 | 0.998 |
| 120 | 0.993 | 0.994 | 0.994 | 0.994 | 0.996 | 0.996 | 0.997 | 0.998 | 1 |
Disclaimer/Publisher’s Note: The statements, opinions and data contained in all publications are solely those of the individual author(s) and contributor(s) and not of MDPI and/or the editor(s). MDPI and/or the editor(s) disclaim responsibility for any injury to people or property resulting from any ideas, methods, instructions or products referred to in the content. |
© 2023 by the authors. Licensee MDPI, Basel, Switzerland. This article is an open access article distributed under the terms and conditions of the Creative Commons Attribution (CC BY) license (https://creativecommons.org/licenses/by/4.0/).
Share and Cite
Jiang, Y.; Wu, H.; Ho, P.C.L.; Tang, X.; Ao, H.; Chen, L.; Cai, J. GC-MS Fingerprinting Combined with Chemical Pattern-Recognition Analysis Reveals Novel Chemical Markers of the Medicinal Seahorse. Molecules 2023, 28, 7824. https://doi.org/10.3390/molecules28237824
Jiang Y, Wu H, Ho PCL, Tang X, Ao H, Chen L, Cai J. GC-MS Fingerprinting Combined with Chemical Pattern-Recognition Analysis Reveals Novel Chemical Markers of the Medicinal Seahorse. Molecules. 2023; 28(23):7824. https://doi.org/10.3390/molecules28237824
Chicago/Turabian StyleJiang, Yuanyuan, Hongfei Wu, Paul Chi Lui Ho, Xuemei Tang, Hui Ao, Lu Chen, and Jinjin Cai. 2023. "GC-MS Fingerprinting Combined with Chemical Pattern-Recognition Analysis Reveals Novel Chemical Markers of the Medicinal Seahorse" Molecules 28, no. 23: 7824. https://doi.org/10.3390/molecules28237824
APA StyleJiang, Y., Wu, H., Ho, P. C. L., Tang, X., Ao, H., Chen, L., & Cai, J. (2023). GC-MS Fingerprinting Combined with Chemical Pattern-Recognition Analysis Reveals Novel Chemical Markers of the Medicinal Seahorse. Molecules, 28(23), 7824. https://doi.org/10.3390/molecules28237824