
Analysis of the Differences in Volatile Organic Compounds in Different Rice Varieties Based on GC-IMS Technology Combined with Multivariate Statistical Modelling

 ,
,
Abstract
:1. Introduction
2. Results and Discussion
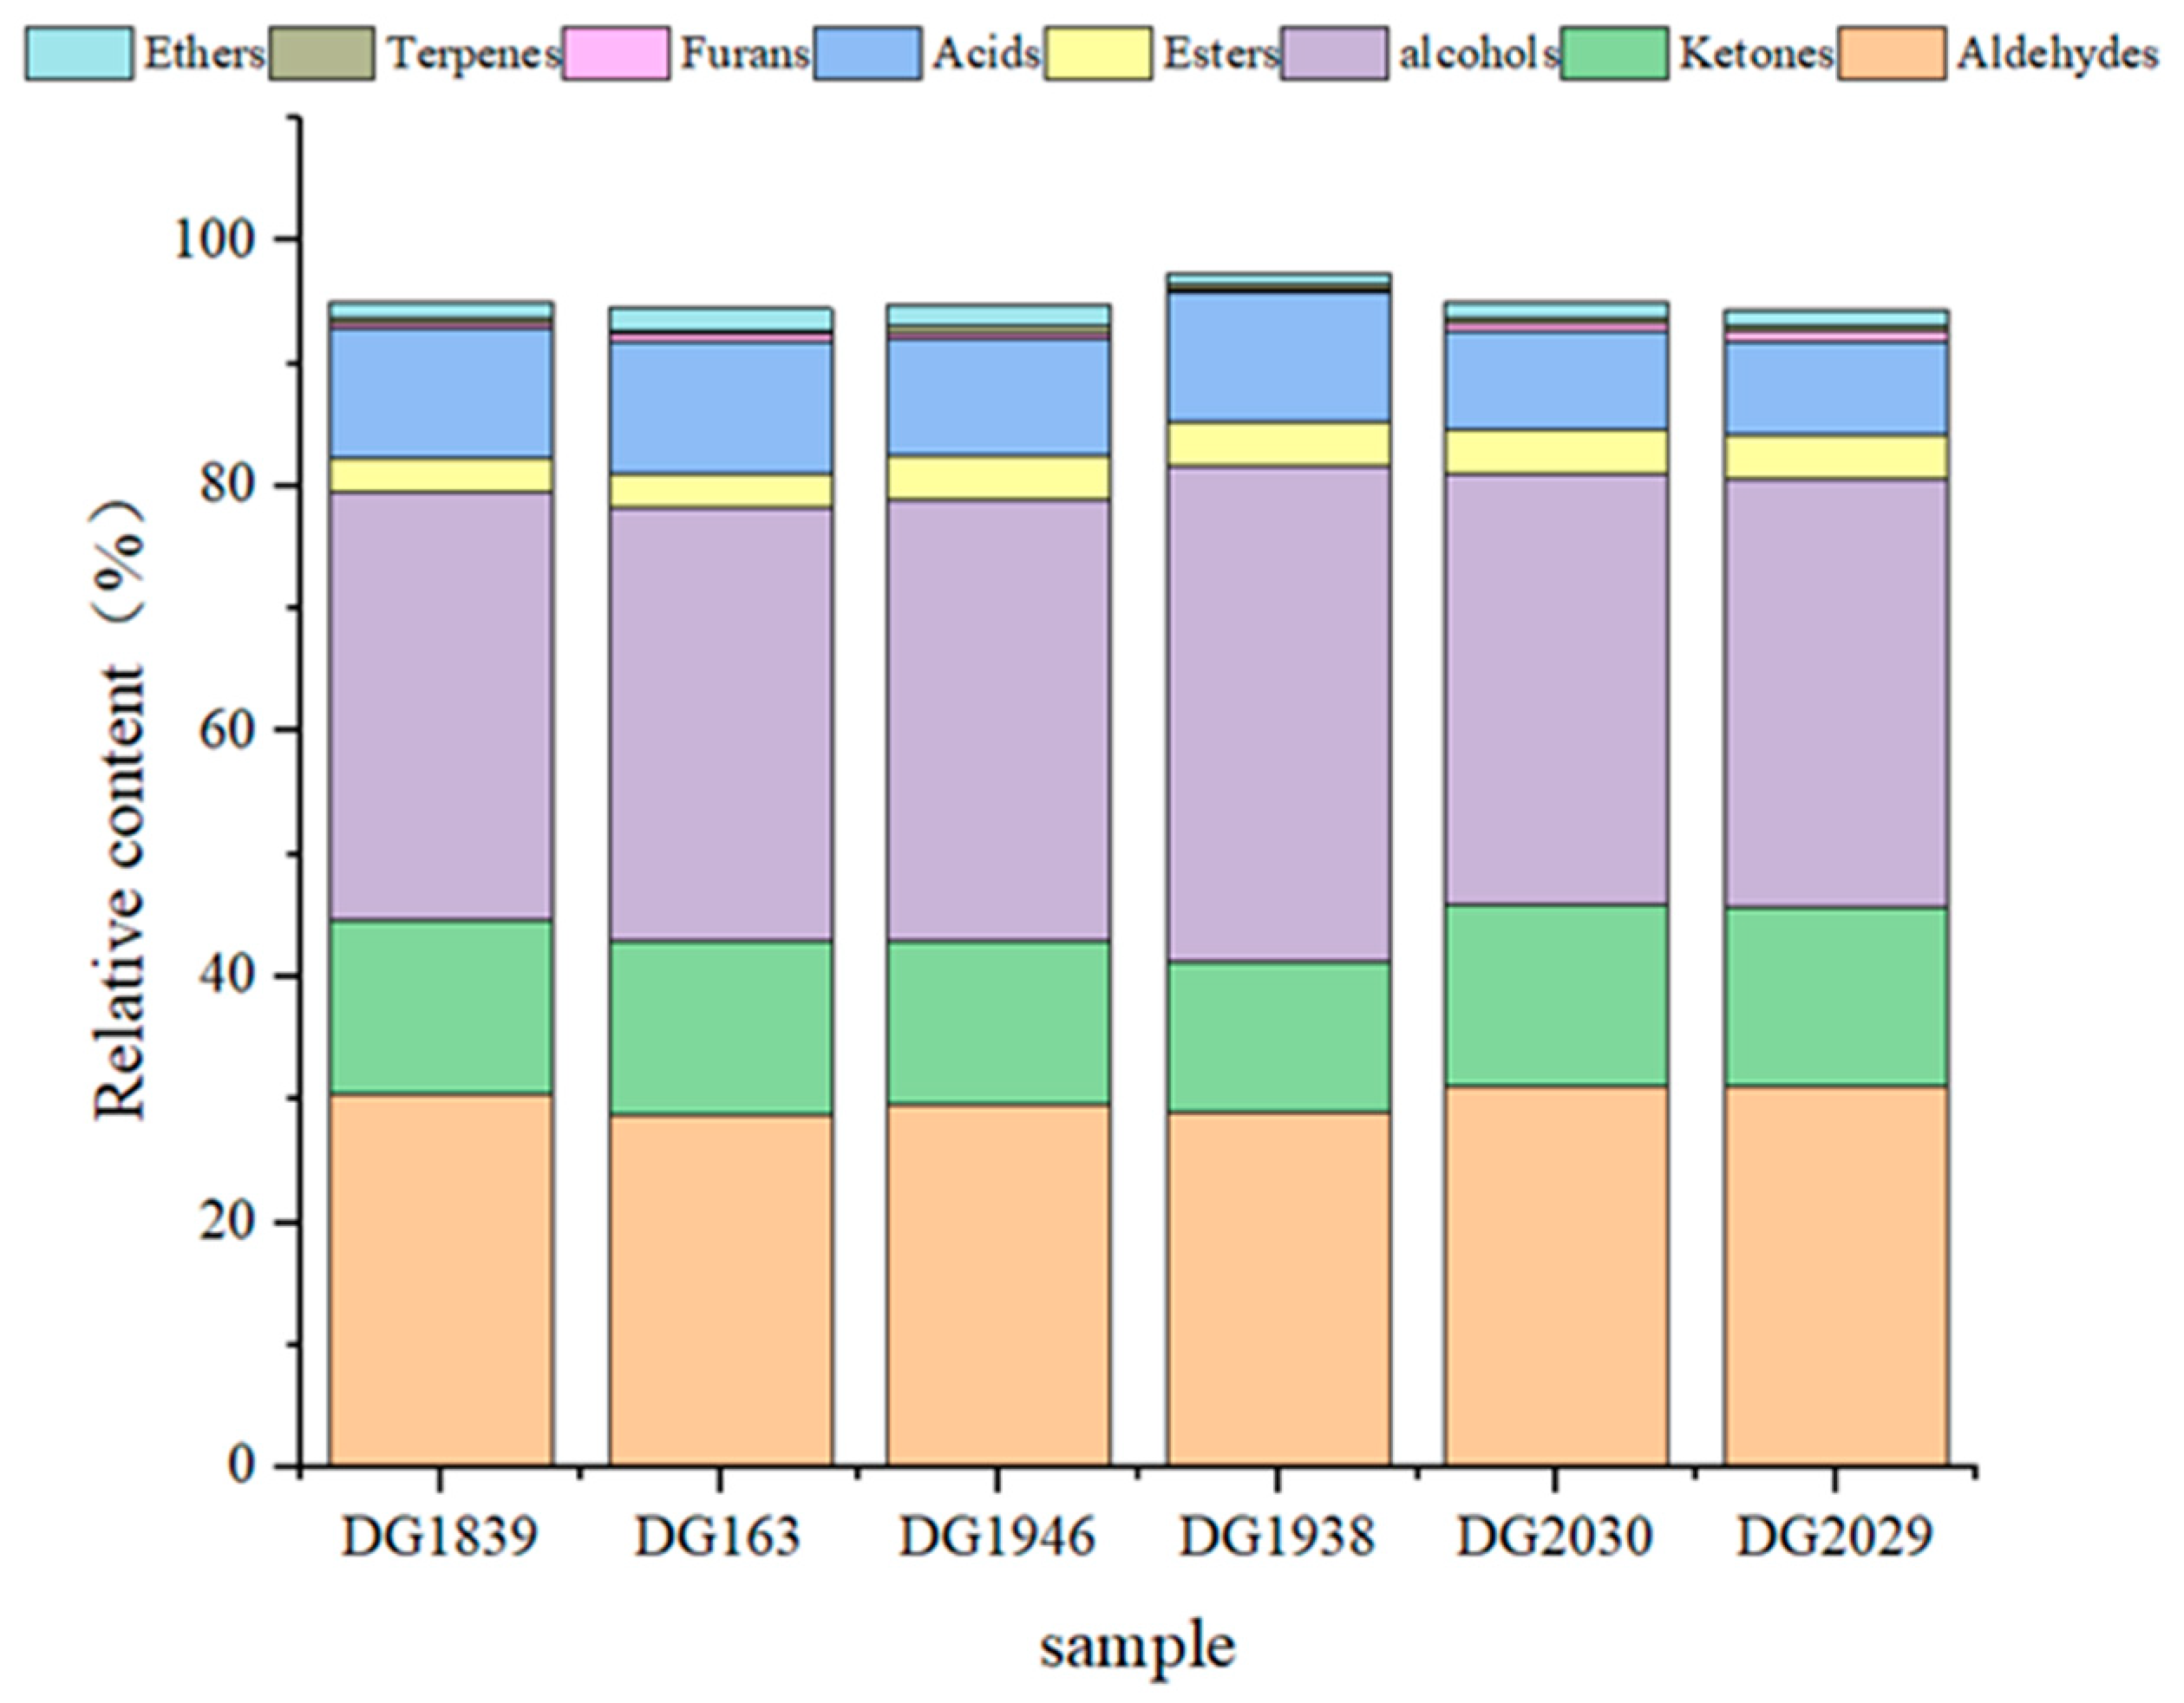
2.1. Direct Comparison of the Differences in Volatile Compounds Amongst Different Rice Varieties
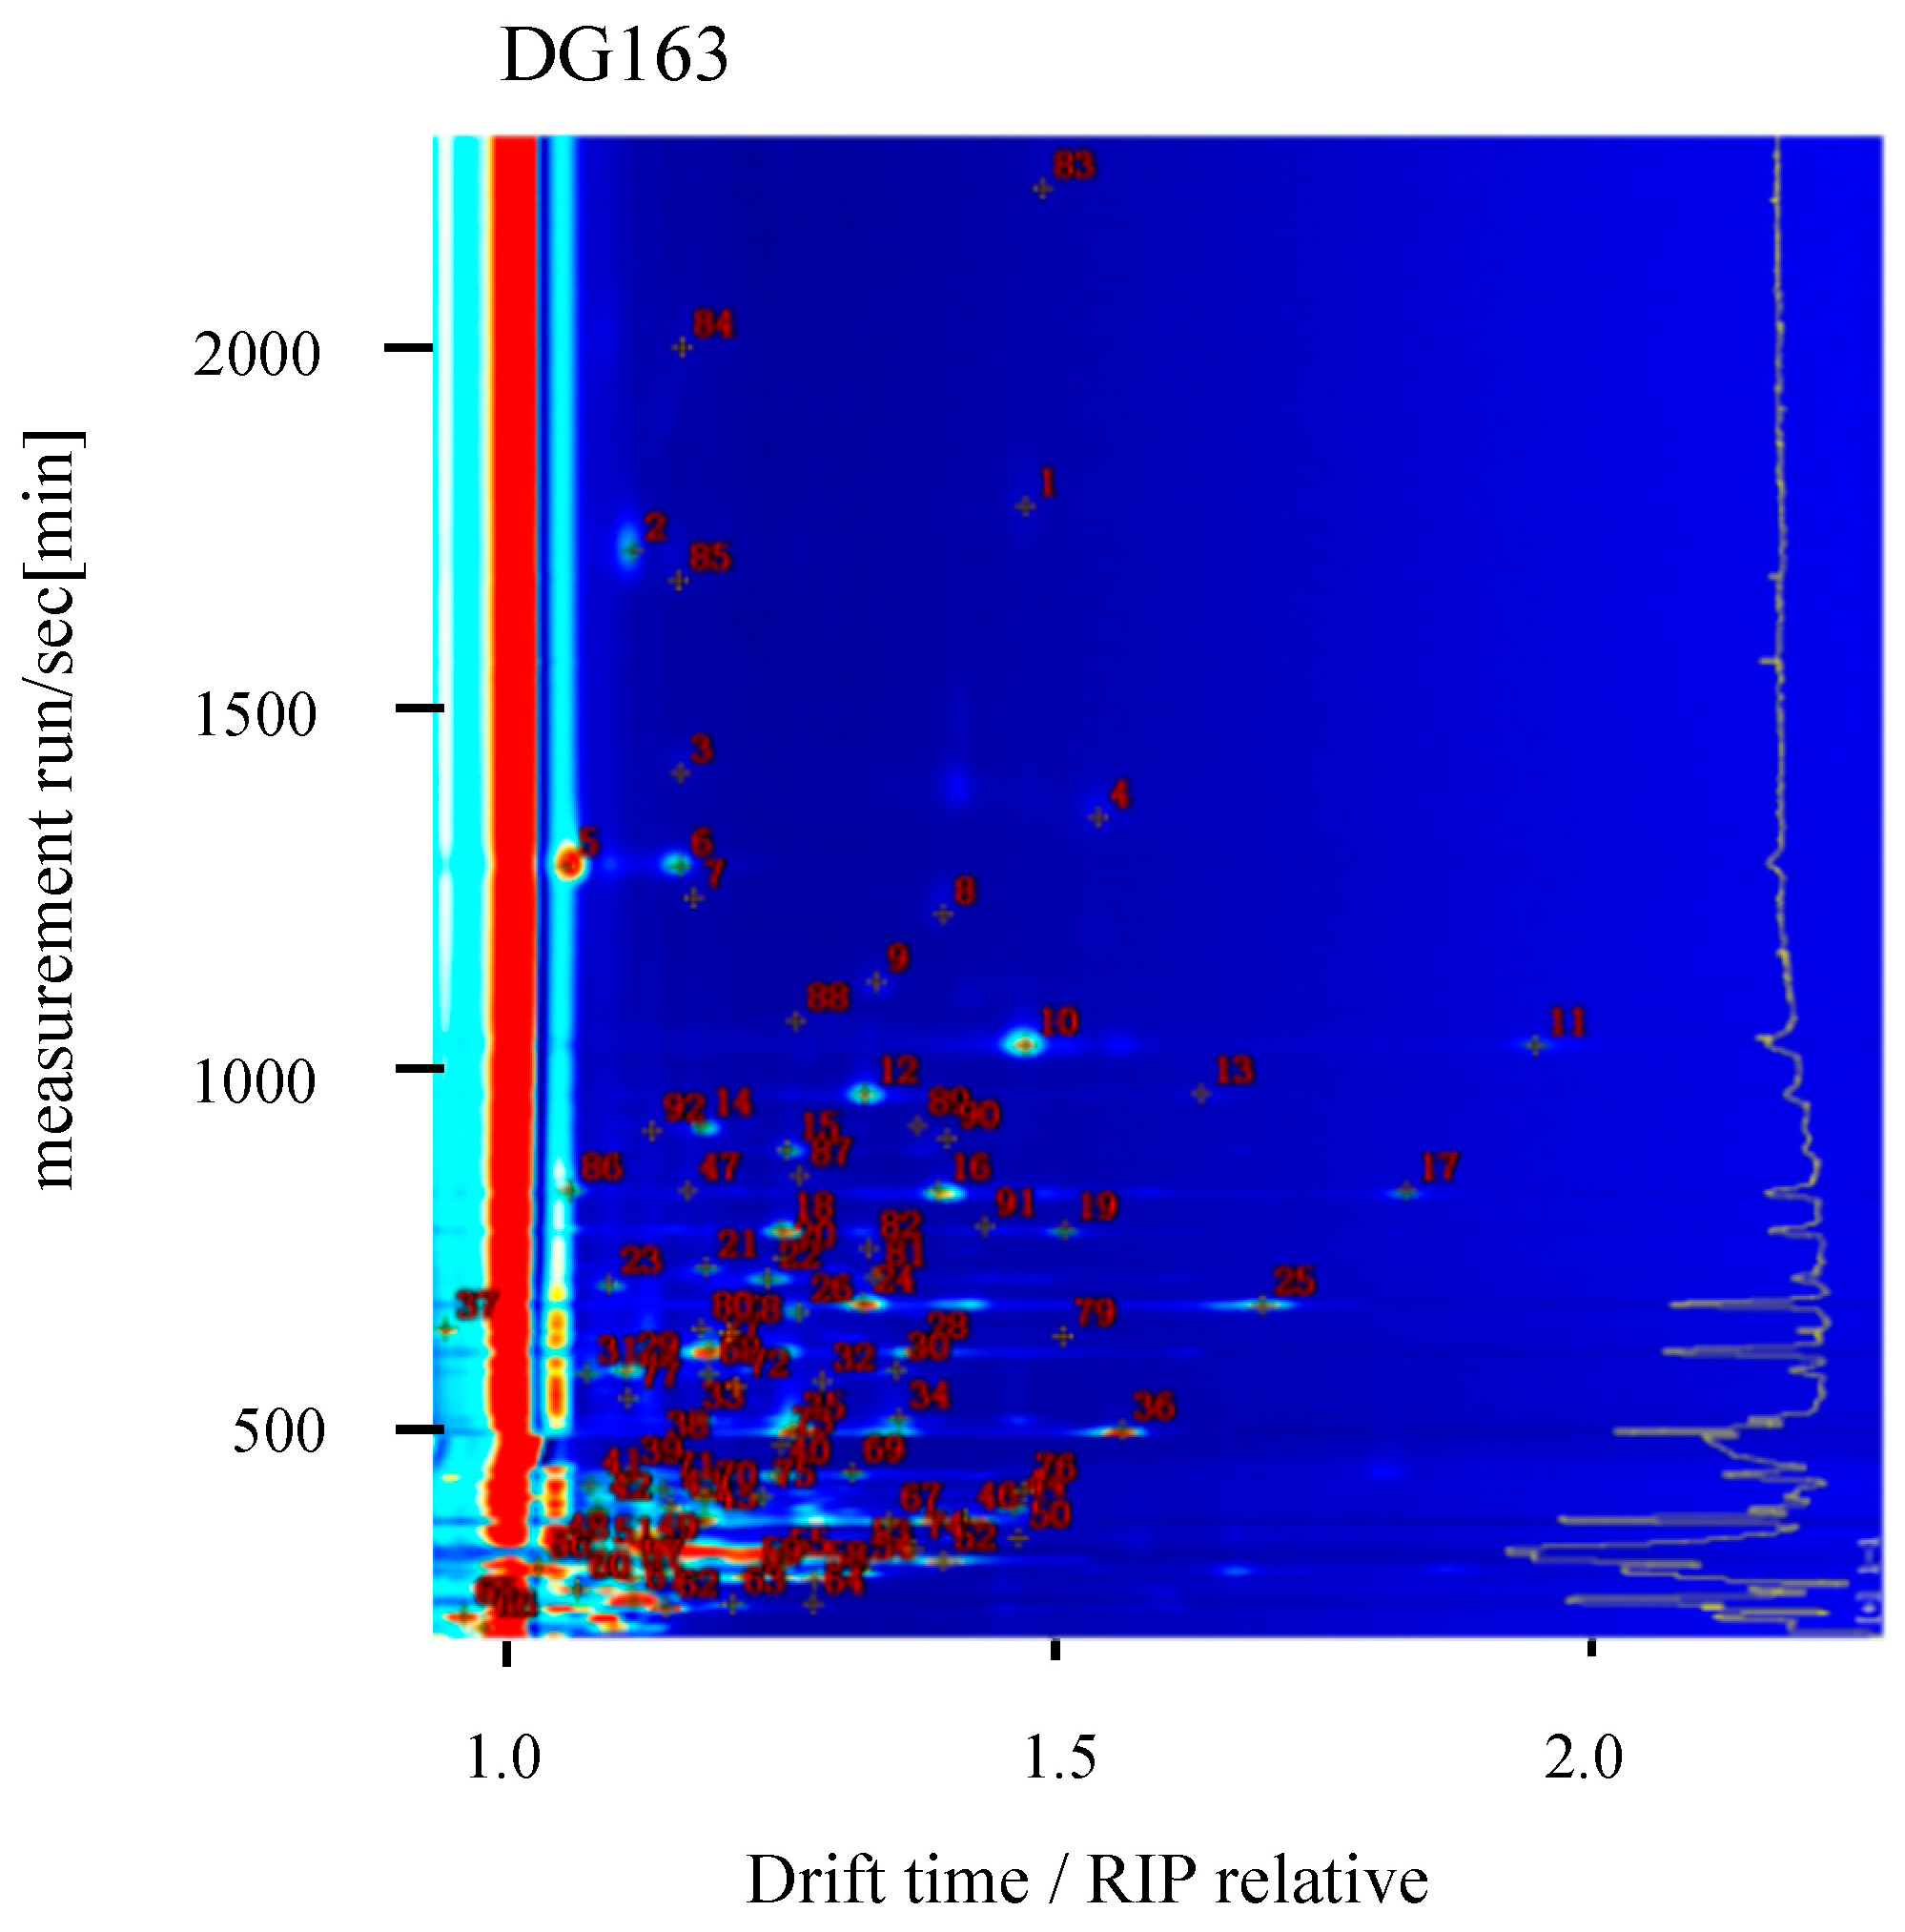
2.2. Qualitative Analysis of GC-IMS Spectra of Different Rice Varieties
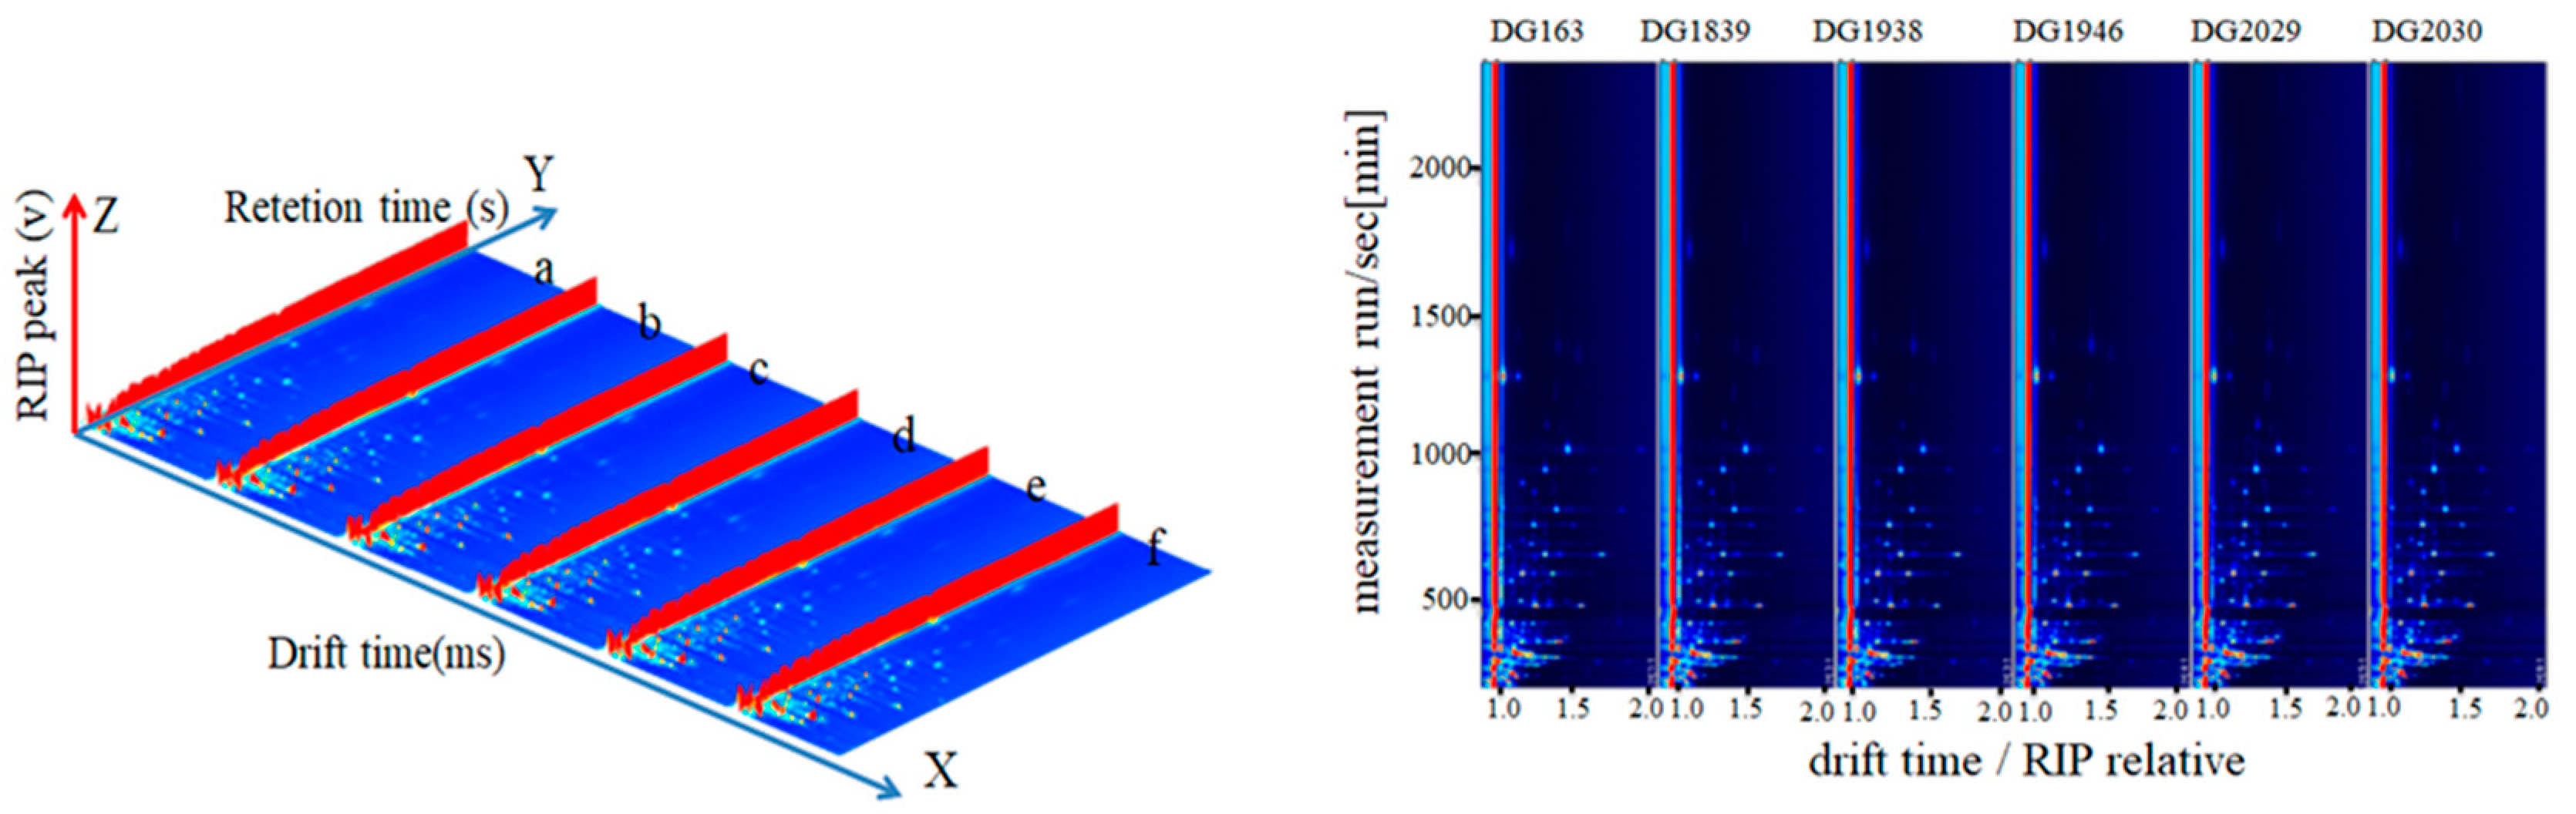
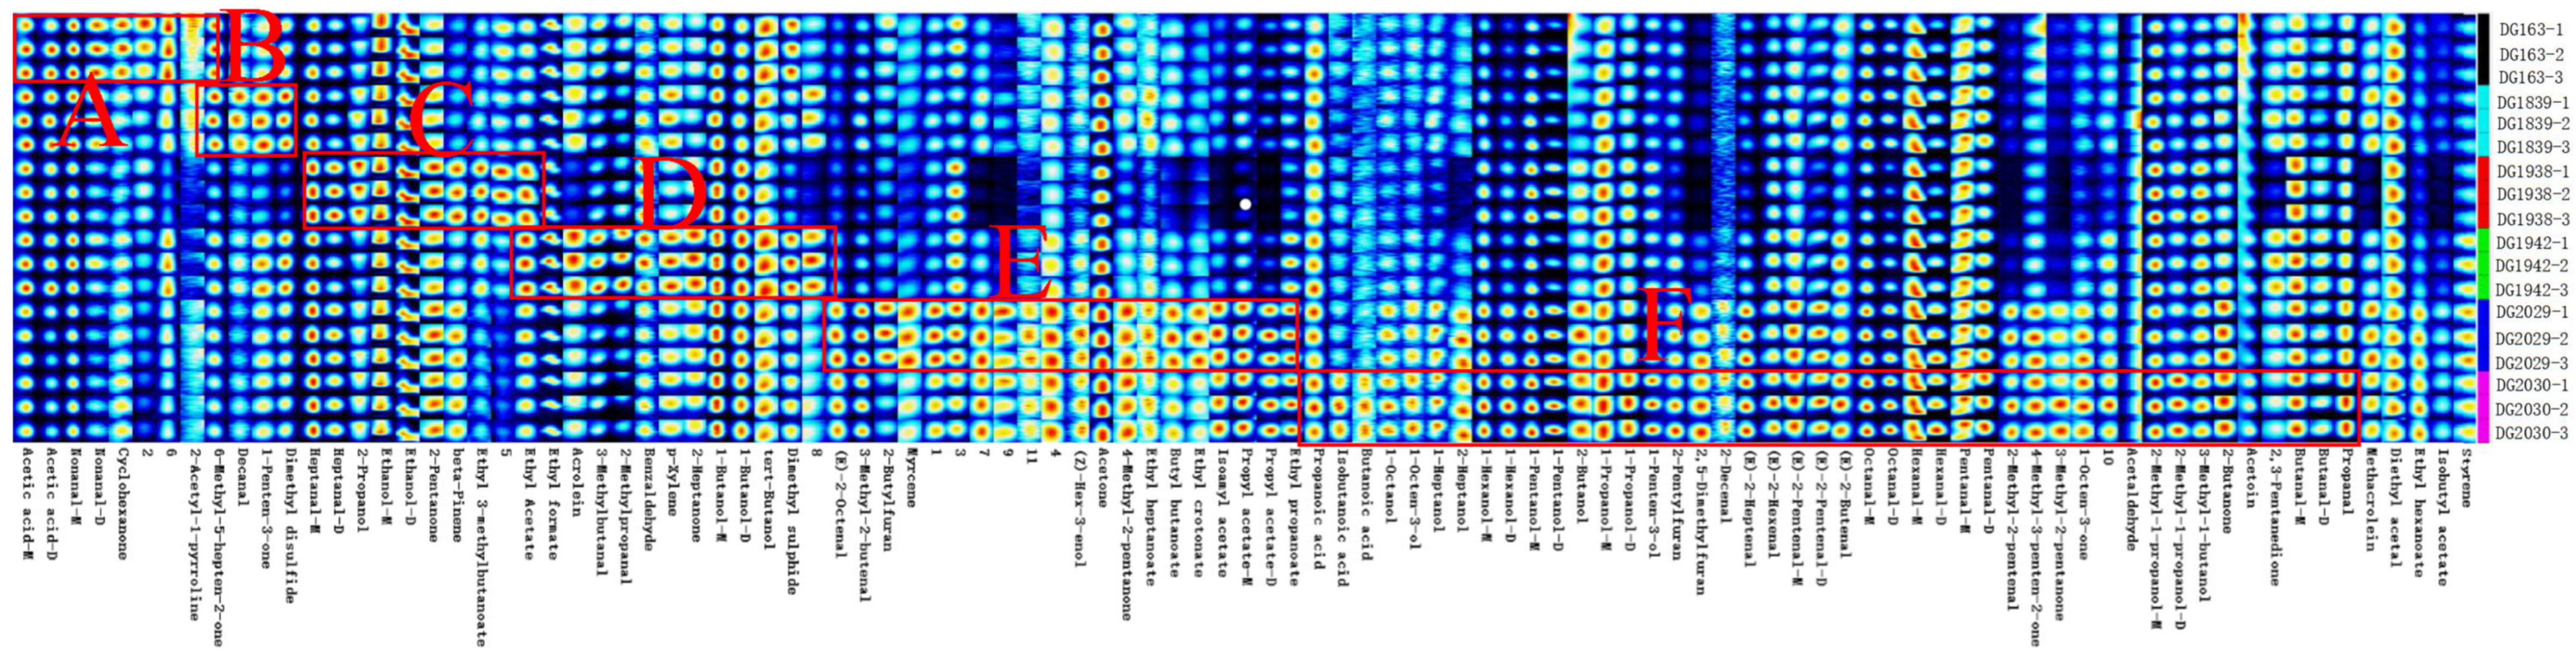
2.3. Comparison of GC-IMS Fingerprints of Different Rice Varieties
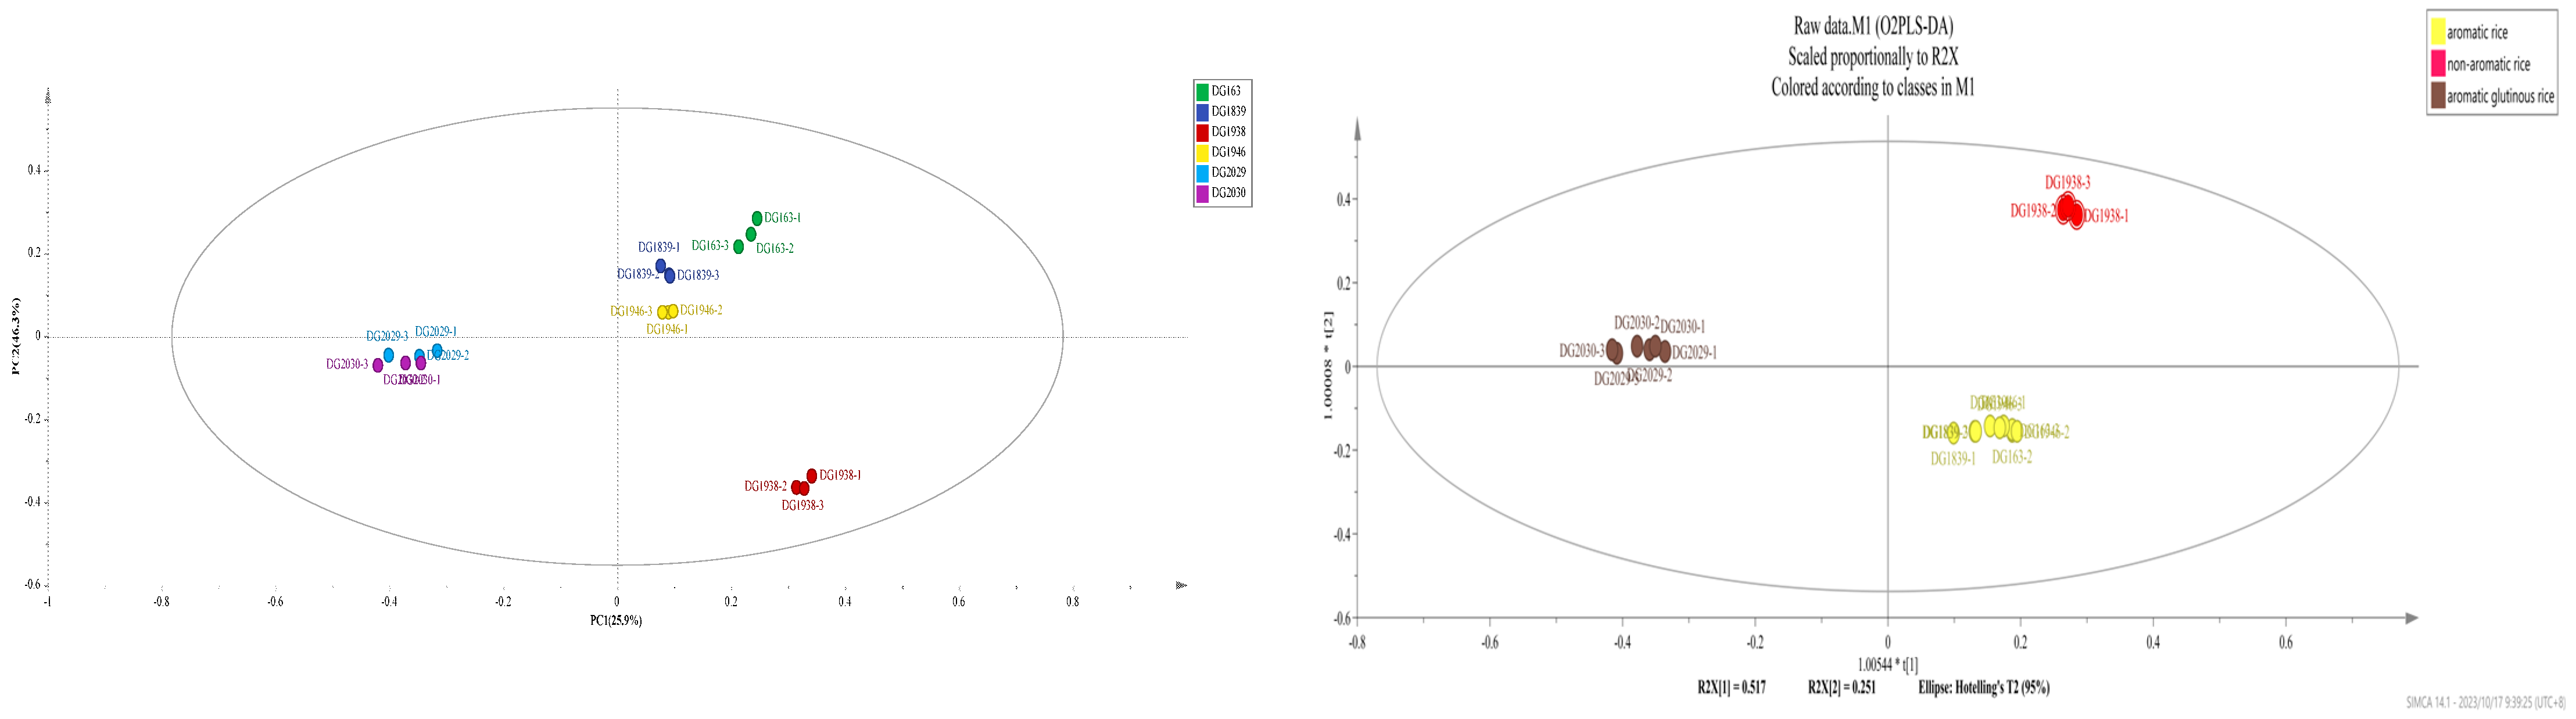
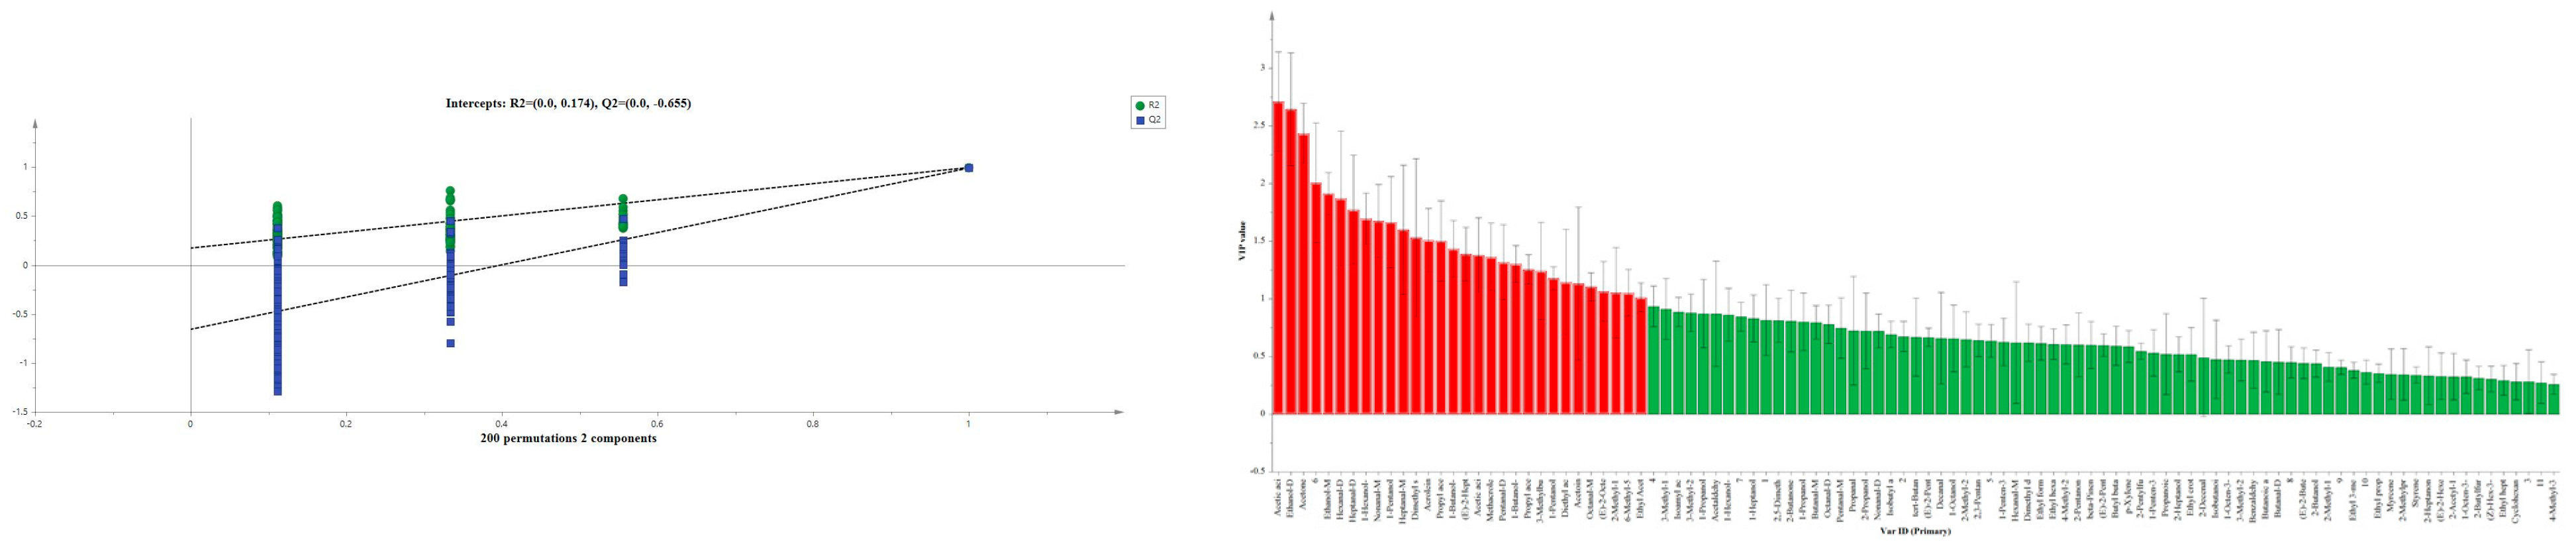
2.4. Principal Component and Orthogonal Least Squares Discriminant Analyses of the Volatile Components of Different Rice Varieties
3. Materials and Methods
3.1. Experimental Materials
3.2. Flavour-Gene-Specific Primer Analysis
3.3. Instruments and Equipment
3.4. Methods
3.4.1. Sample Preparation
3.4.2. HS-GC-IMS Analysis
3.5. Data Processing
4. Conclusions
Author Contributions
Funding
Institutional Review Board Statement
Informed Consent Statement
Data Availability Statement
Conflicts of Interest
References
- Sreenivasulu, N.; Zhang, C.; Tiozon, R.J.; Liu, Q. Post-genomics revolution in the design of premium quality rice in a high-yielding background to meet consumer demands in the 21st century. Plant Commun. 2022, 3, 100271. [Google Scholar] [CrossRef] [PubMed]
- Gondal, T.A.; Keast, R.S.J.; Shellie, R.A.; Jadhav, S.R.; Gamlath, S.; Mohebbi, M.; Liem, D.G. Consumer acceptance of brown and white rice varieties. Foods 2021, 10, 1950. [Google Scholar] [CrossRef] [PubMed]
- Peng, B.; Sun, Y.; Chen, B.; Sun, R.; Kong, D.; Pang, R.; Li, X.; Song, X.; Li, H.; Li, J. Research progress of fragrance gene and its application in rice breeding. Chin. Bull. Bot. 2017, 52, 797–807. [Google Scholar]
- Paramita, B.; Rekha, S.; Singhal, P.R. Basmati Rice: A review. Int. J. Food Sci. Technol. 2002, 37, 1–12. [Google Scholar]
- Verma, D.K.; Srivastav, P.P. A Paradigm of Volatile Aroma Compounds in Rice and Their Product with Extraction and Identification Methods: A Comprehensive Review. Food Res. Int. 2020, 130, 108924. [Google Scholar] [CrossRef]
- Deng, Y.; Zhong, Y.; Yu, W.; Yue, J.; Liu, Z.; Zheng, Y.; Zhao, Y. Effect of hydrostatic high pressure pretreatment on flavor volatile profile of cooked rice. J. Cereal Sci. 2013, 58, 479–487. [Google Scholar] [CrossRef]
- Champagne, E.T. Rice aroma and flavor: A literature review. Cereal Chem. 2008, 85, 445–454. [Google Scholar] [CrossRef]
- Hu, X.; Lu, L.; Guo, Z.; Zhu, Z. Volatile compounds, affecting factors and evaluation methods for rice aroma: A review. Trends Food Sci. Technol. 2020, 97, 136–146. [Google Scholar] [CrossRef]
- Hopfgartner, G. Current developments in ion mobility spectrometry. Anal. Bioanal. Chem. 2019, 411, 6227. [Google Scholar] [CrossRef]
- Yin, J.X.; Wu, M.F.; Lin, R.M.; Li, X.; Ding, H.; Han, L.F.; Yang, W.Z.; Song, X.B.; Li, W.L.; Qu, H.B. Application and development trends of gas chromatography–ion mobility spectrometry for traditional Chinese medicine, clinical, food and environmental analysis. Microchem. J. 2021, 168, 106527. [Google Scholar] [CrossRef]
- Sun, L.Q.Y.; Meng, M.; Cui, K. Comparative Study on the Volatile Organic Compounds and Characteristic Flavor Fingerprints of Five Varieties of Walnut Oil in Northwest China Using Using Headspace Gas Chromatography-Ion Mobility Spectrometry. Molecules 2023, 28, 2949. [Google Scholar] [CrossRef] [PubMed]
- Duan, S.; Tang, X.; Li, W.; Huang, X. Analysis of the Differences in Volatile Organic Compounds in Different Muscles of Pork by GC-IMS. Molecules 2023, 28, 1726. [Google Scholar] [CrossRef] [PubMed]
- Fang, C.; He, J.; Xiao, Q.; Chen, B.; Zhang, W. Development of the Volatile Fingerprint of Qu Aurantii Fructus by HS-GC-IMS. Molecules 2022, 27, 4537. [Google Scholar] [CrossRef] [PubMed]
- Li, Z.Y.; Shi, C.J.; Li, X.A. Breeding of fragrant soft rice Diantun 502. J. Yunnan Agric. Univ. 1999, 14, 28–32. [Google Scholar]
- Yu, Y.; Cheng, N.L.; Pu, S.H.; Li, W.C.; Tan, X.L.; Chen, L.J.; Zhang, J.L.; Wen, J.C. Analysis of volatile components of rice in Diantun 502 rejuvenation strain. J. Yunnan Agric. Univ. 2019, 34, 7. [Google Scholar]
- Zhang, J.L.; Li, J.; Zhang, C.L.; Zhang, C.L.; Zhang, L.; Tan, Y.L.; Luo, P.; Li, Z.H.; Luan, Y.F.; Yu, Y. Genetic analysis of aroma traits of Yunnan high-quality soft rice variety ‘Diantun 502’. Mol. Plant Breed. 2018, 16, 10. [Google Scholar]
- Mathure, S.V.; Jawali, N.; Thengane, R.J.; Nadaf, A.B. Comparative quantitative analysis of headspace volatiles and their association with BADH2 marker in non-basmati scented, basmati and non-scented rice (Oryza sativa L.) cultivars of India. Food Chem. 2014, 142, 383–391. [Google Scholar] [CrossRef]
- Bryant, R.J.; Mcclung, A.M. Volatile profiles of aromatic and non-aromatic rice cultivars using SPME/GC–MS. Food Chem. 2011, 124, 501–513. [Google Scholar] [CrossRef]
- Dai, Y.Q.; He, J.G.; Yuan, F. Analysis and evaluation of nutrient composition of colorful rice. J. Chin. Cereals Oils Assoc. 2006, 21, 20–23. [Google Scholar]
- Zhang, M.; Miao, J.; Su, H.M.; Wang, Z.Y. Rice flavor analysis of different varieties of rice. Food Sci. 2017, 38, 110–114. [Google Scholar]
- del Mar Contreras, M.; Jurado-Campos, N.; Arce, L.; Arroyo-Manzanares, N. A robustness study of calibration models for olive oil classification: Targeted and non-targeted fingerprint approaches based on GC-IMS. Food Chem. 2019, 288, 315–324. [Google Scholar] [CrossRef]
- Zhang, Q.; Ding, Y.C.; Gu, S.Q.; Zhu, S.C.; Zhou, X.X.; Ding, Y.T. Identification of changes in volatile compounds in dry-cured fish during storage using HS-GC-IMS. Food Res. Int. 2020, 137, 109339. [Google Scholar] [CrossRef] [PubMed]
- Widjaja, R.; Craske, J.D.; Wootton, M. Comparative studies on volatile components of non-fragrant and fragrant rices. J. Sci. Food Agric. 1996, 70, 151–161. [Google Scholar] [CrossRef]
- Lee, J.; Xiao, L.; Zhang, G.; Ebeler, S.E.; Mitchell, A.E. Influence of storage on volatile profiles in roasted almonds (Prunus dulcis). J. Agric. Food Chem. 2014, 62, 11236–11245. [Google Scholar] [CrossRef]
- Wang, Y.R.; Cui, C.; Zhao, M.M. Analysis of flavor components in Saqima by solid-phase microextraction and gas chroma. Mod. Food Sci. Technol. 2011, 27, 1406–1409. [Google Scholar]
- Iglesias, J.; Medina, I.; Bianchi, F.; Careri, M.; Mangia, A.; Musci, M. Study of the volatile compounds useful for the characterisation of fresh and frozen-thawed cultured gilthead sea bream fish by solid-phase microextraction gas chromatography–mass spectrometry. Food Chem. 2009, 115, 1473–1478. [Google Scholar] [CrossRef]
- Li, W.; Chen, Y.J.; Ren, J.H.; Guo, S. Effects of ripening method on volatile components of millet flour products. J. Chin. Cereals Oils Assoc. 2014, 29, 93–97. [Google Scholar]
- Miao, J.; Su, H.M.; Zhang, M. Analysis of the key flavor compounds in cooked rice. Food Sci. 2016, 37, 82–86. [Google Scholar]
- Zeng, Z.; Zhang, H.; Chen, J.Y.; Zhang, T.; Ryuji, M. Direct Extraction of Volatiles of Rice During Cooking Using Solid-Phase Microextraction. Cereal Chem. 2007, 84, 423–427. [Google Scholar] [CrossRef]
- Wang, J.; Xu, L.Y.; Zhang, J.H.; Wang, X.Y.; Ai, N.S.; Wang, B.; Cao, Y.P. Volatile aroma components and electronic nasal discrimination analysis in cheddar cheese at different ripening times. Food Sci. 2020, 41, 9. [Google Scholar]
- Lin, J.Y.; Gao, Y.N.; Wu, S.F.; Wang, S.X. Analysis of volatile components of rice by headspace solid phase microextraction-gas chromatography. Food Sci. 2009, 30, 277–282. [Google Scholar]
- Sun, X.R.; Bian, J.Y.; Liu, L.S.; Shao, K.; Liu, K.; Lai, Y.C.; Li, J.; Feng, P.; Che, Y. Comparison of volatile components of three kinds of Suijaponica rice based on gas chromatography-ion mobility spectroscopy. J. Food Saf. Qual. Detect. 2022, 13, 5452–5458. [Google Scholar]
- Bian, J.Y.; Sun, X.R.; Liu, L.S.; Shao, K.; Lai, Y.C.; Feng, P.; Che, Y.; Han, B.; Zhu, L. Fingerprint analysis of volatile organic compounds of different varieties of fragrant rice based on gas chromatography-ion mobility spectroscopy. J. Chin. Cereals Oils Assoc. 2023, 38, 133–140. [Google Scholar]
- Zhu, L.; Lin, X.D.; He, Y.; Shang, H.T.; Ling, J.G.; Tong, L.T. Analysis of volatile flavor components of Yongyou series indica japonica hybrid rice. J. Chin. Cereals Oils Assoc. 2022, 37, 154–160. [Google Scholar]
- Jiang, Y.H.; Yang, X.Y.; Zhang, Q.H. Analysis of volatile oil in Fructus Aurantii processed with Zhangband method by GC-MS. J. Chin. Med. Mater. 2010, 33, 1233–1236. [Google Scholar]
- Yu, H.; Ning, X.X.; Chen, Q.; Xiong, S.S.; Gong, Q.F. Analysis of volatile oil in processed Aurantii Fructus from Jiangxi Province by GC-MS. Chin. Tradit. Pat. Med. 2015, 37, 592–598. [Google Scholar]
- Yu, H.; Zhong, L.Y.; Ning, X.X.; Zhang, J.L.; Ning, L.X.; Gong, Q.F. Analysis on Volatile Oil in Different Processed Products of Aurantii Fructus Immaturus from Jiangxi by GC-MS. Chin. J. Exp. Tradit. Med. Formulae 2015, 21, 12–18. [Google Scholar]
- Arroyo-Manzanares, N.; García-Nicolás, M.; Castell, A.; Campillo, N.; Hernández-Córdoba, M. Untargeted headspace gas chromatography—Ion mobility spectrometry analysis for detection of adulterated honey. Talanta 2019, 205, 120123. [Google Scholar] [CrossRef]
- Ni, R.J.; Zhan, P.; Tian, H.L. Analysis of the effect of frying time on volatile substances of peppercorn seasoning oil based on GC-IMS combined with multivariate statistical methods. Food Sci. 2022, 43, 279–286. [Google Scholar]
- Yun, J.; Cui, C.J.; Zhang, S.H.; Zhu, J.J.; Peng, C.Y.; Cai, H.M.; Yang, X.G.; Hou, R.Y. Use of headspace GC/MS combined with chemometric analysis to identify the geographic origins of black tea. Food Chem. 2021, 360, 130033. [Google Scholar] [CrossRef]
- Yang, D.S.; Shewfelt, R.L.; Lee, K.S.; Kays, S.J. Comparison of odor-active compounds from six distinctly different rice flavor types. J. Agric. Food Chem. 2008, 56, 2780–2787. [Google Scholar] [CrossRef]
- Yiru, W.; Jaeho, H. Determination of hexanal in rice using an automated dynamic headspace sampler coupled to a gas chromatograph-mass spectrometer. J. Chromatogr. Sci. 2013, 51, 446–452. [Google Scholar]
- Ma, R.; Tian, Y.; Zhang, H.; Cai, C.; Chen, L.; Jin, Z. Interactions between rice amylose and aroma compounds and their effect on rice fragrance release. Food Chem. 2019, 289, 603–608. [Google Scholar] [CrossRef] [PubMed]
- Peng, Z.F.; Li, Y.H.; Lian, S.C.; Xie, Z.M.; Ye, H.X. Study on aroma components of rice and glutinous rice. Brew. Sci. Technol. 2014, 246, 42–46. [Google Scholar]
- Bradbury, L.M.; Fitzgerald, T.L.; Henry, R.J.; Jin, Q.; Waters, D.L. The gene for fragrance in rice. Plant Biotechnol. J. 2005, 3, 363–370. [Google Scholar] [CrossRef]
- Okpala, N.E.; Mo, Z.; Duan, M.; Tang, X. The genetics and biosynthesis of 2-acetyl-1-pyrroline in aromatic rice. Plant Physiol. Biochem. 2019, 135, 272–276. [Google Scholar] [CrossRef]
- Song, J.X.; Shao, Y.; Yan, Y.M.; Li, X.H.; Peng, J.; Li, G. Characterization of volatile profiles of three colored quinoas based on GC-IMS and PCA. LWT-Food Sci. Technol. 2021, 146, 111292. [Google Scholar] [CrossRef]


| No | Compounds | Retention Index (RI) | Retention Times (s) | Drift Times (ms) | Relative Content (%) | |||||
|---|---|---|---|---|---|---|---|---|---|---|
| DG163 | DG1839 | DG1938 | DG1946 | DG2029 | DG2030 | |||||
| 1 | 1-Octanol | 1655.8 | 1782.45 | 1.47798 | 0.0066 ± 0.0006 abc | 0.0065 ± 0.0001 bc | 0.0055 ± 0.0003 d | 0.0057 ± 0.0005 cd | 0.0075 ± 0.0007 a | 0.007 ± 0.0006 ab |
| 2 | Propanoic acid | 1639.9 | 1721.92 | 1.11696 | 0.0130 ± 0.0019 a | 0.0144 ± 0.0008 a | 0.0148 ± 0.0007 a | 0.0149 ± 0.0006 a | 0.0137 ± 0.0010 a | 0.0139 ± 0.0006 a |
| 3 | Benzaldehyde | 1547.8 | 1409.97 | 1.15925 | 0.0031 ± 0.0003 ab | 0.0030 ± 0.0003 b | 0.0035 ± 0.0001 a | 0.0034 ± 0.0002 a | 0.0028 ± 0.0003 bc | 0.0024 ± 0.0001 c |
| 4 | Decanal | 1526.8 | 1347.12 | 1.54628 | 0.0042 ± 0.0002 b | 0.0048 ± 0.0000 a | 0.0035 ± 0.0001 cd | 0.0038 ± 0.0001 c | 0.0025 ± 0.0002 e | 0.0033 ± 0.0004 d |
| 5 | Acetic acid-M | 1503.1 | 1279.61 | 1.05517 | 0.0742 ± 0.0017 a | 0.0706 ± 0.0010 b | 0.0695 ± 0.0012 b | 0.0641 ± 0.0016 c | 0.0496 ± 0.0024 d | 0.0491 ± 0.0010 d |
| 6 | Acetic acid-D | 1503.1 | 1279.61 | 1.15925 | 0.0126 ± 0.0014 a | 0.0127 ± 0.0002 a | 0.0111 ± 0.0006 b | 0.0111 ± 0.0008 b | 0.0067 ± 0.0009 c | 0.0066 ± 0.0002 c |
| 7 | 1-Octen-3-ol | 1486 | 1233.05 | 1.17226 | 0.0017 ± 0.0003 bc | 0.0016 ± 0.0002 c | 0.0016 ± 0.0000 c | 0.0017 ± 0.0001 bc | 0.0019 ± 0.0001 ab | 0.0021 ± 0.0000 a |
| 8 | 1-Heptanol | 1477.2 | 1209.77 | 1.40318 | 0.0050 ± 0.0003 cd | 0.0056 ± 0.0001 c | 0.0041 ± 0.0005 e | 0.0048 ± 0.0003 d | 0.0070 ± 0.0003 a | 0.0063 ± 0.0005 b |
| 9 | (E)-2-Octenal | 1440.3 | 1116.65 | 1.34138 | 0.0033 ± 0.0003 d | 0.0030 ± 0.0001 d | 0.0032 ± 0.0001 d | 0.0037 ± 0.0001 c | 0.0068 ± 0.0001 a | 0.0062 ± 0.0001 b |
| 10 | Nonanal-M | 1402.3 | 1028.19 | 1.47798 | 0.0293 ± 0.0004 a | 0.0283 ± 0.0004 a | 0.0255 ± 0.0006 b | 0.0260 ± 0.0019 b | 0.0191 ± 0.0008 c | 0.0207 ± 0.0002 c |
| 11 | Nonanal-D | 1402.3 | 1028.19 | 1.94958 | 0.0039 ± 0.0002 a | 0.0034 ± 0.0003 b | 0.0027 ± 0.0003 c | 0.0029 ± 0.0004 c | 0.0018 ± 0.0002 d | 0.0020 ± 0.0001 d |
| 12 | 1-Hexanol-M | 1370.8 | 960.16 | 1.33012 | 0.0153 ± 0.0008 e | 0.0175 ± 0.0002 d | 0.0226 ± 0.0002 b | 0.0184 ± 0.0001 c | 0.0230 ± 0.0001 b | 0.0241 ± 0.0007 a |
| 13 | 1-Hexanol-D | 1370.2 | 958.94 | 1.64097 | 0.0022 ± 0.0001 e | 0.0026 ± 0.0002 d | 0.0035 ± 0.0001 cd | 0.0028 ± 0.0001 d | 0.0042 ± 0.0001 b | 0.0048 ± 0.0003 a |
| 14 | 6-Methyl-5-hepten-2-one | 1348 | 913.84 | 1.17965 | 0.0082 ± 0.0002 a | 0.0082 ± 0.0002 a | 0.0052 ± 0.0001 d | 0.0067 ± 0.0001 b | 0.0058 ± 0.0001 c | 0.0051 ± 0.0001 d |
| 15 | (E)-2-Heptenal | 1331.1 | 880.92 | 1.25884 | 0.0059 ± 0.0002 c | 0.0052 ± 0.0001 d | 0.0040 ± 0.0000 e | 0.0070 ± 0.0001 b | 0.0108 ± 0.0003 a | 0.0107 ± 0.0002 a |
| 16 | Octanal-M | 1299.4 | 822.41 | 1.39744 | 0.0173 ± 0.0007 c | 0.0187 ± 0.0002 b | 0.0148 ± 0.0002 d | 0.0169 ± 0.0004 c | 0.0190 ± 0.0001 ab | 0.0195 ± 0.0003 a |
| 17 | Octanal-D | 1299.4 | 822.41 | 1.83104 | 0.0044 ± 0.0002 c | 0.0045 ± 0.0002 bc | 0.0028 ± 0.0002 e | 0.0037 ± 0.0002 d | 0.0048 ± 0.0002 ab | 0.0051 ± 0.0001 a |
| 18 | 1-Pentanol-M | 1266.3 | 767.56 | 1.2529 | 0.0164 ± 0.0006 d | 0.0184 ± 0.0002 c | 0.0242 ± 0.0003 a | 0.0181 ± 0.0001 c | 0.0220 ± 0.0001 b | 0.0225 ± 0.0003 b |
| 19 | 1-Pentanol-D | 1266.3 | 767.56 | 1.51425 | 0.0041 ± 0.0002 d | 0.0046 ± 0.0001 c | 0.0071 ± 0.0002 b | 0.0047 ± 0.0001 c | 0.0073 ± 0.0001 b | 0.0078 ± 0.0001 a |
| 20 | 2-Pentylfuran | 1241.9 | 729.77 | 1.25488 | 0.0019 ± 0.0001 c | 0.0018 ± 0.0000 c | 0.0013 ± 0.0000 d | 0.0023 ± 0.0001 b | 0.0023 ± 0.0000 b | 0.0025 ± 0.0002 a |
| 21 | (E)-2-Hexenal | 1232.9 | 716.36 | 1.18361 | 0.0029 ± 0.0001 b | 0.0033 ± 0.0003 a | 0.0035 ± 0.0001 a | 0.0034 ± 0.0001 a | 0.0034 ± 0.0002 a | 0.0035 ± 0.0002 a |
| 22 | 3-Methyl-1-butanol | 1222.1 | 700.51 | 1.24102 | 0.0076 ± 0.0002 d | 0.0079 ± 0.0003 d | 0.0107 ± 0.0002 a | 0.0095 ± 0.0002 b | 0.0084 ± 0.0001 c | 0.0086 ± 0.0004 c |
| 23 | 3-Methyl-2-butenal | 1217.1 | 693.20 | 1.09451 | 0.0038 ± 0.0002 d | 0.0050 ± 0.0002 c | 0.0030 ± 0.0001 e | 0.0039 ± 0.0000 d | 0.0063 ± 0.0002 a | 0.0055 ± 0.0001 b |
| 24 | Heptanal-M | 1198 | 666.38 | 1.32814 | 0.0204 ± 0.0008 d | 0.0208 ± 0.0004 d | 0.0277 ± 0.0006 a | 0.0212 ± 0.0001 cd | 0.0224 ± 0.0003 b | 0.0217 ± 0.0002 bc |
| 25 | Heptanal-D | 1196.2 | 663.94 | 1.69838 | 0.0130 ± 0.0003 d | 0.0116 ± 0.0005 e | 0.0206 ± 0.0011 a | 0.0118 ± 0.0003 e | 0.0152 ± 0.0002 b | 0.0142 ± 0.0002 c |
| 26 | 2-Heptanone | 1189.1 | 651.75 | 1.27072 | 0.0019 ± 0.0001 d | 0.0018 ± 0.0000 e | 0.0024 ± 0.0000 b | 0.0029 ± 0.0001 a | 0.0022 ± 0.0001 c | 0.0019 ± 0.0001 de |
| 27 | 1-Butanol-M | 1163.8 | 599.34 | 1.18757 | 0.0270 ± 0.0004 d | 0.0279 ± 0.0008 c | 0.0345 ± 0.0001 a | 0.0321 ± 0.0001 b | 0.0285 ± 0.0002 c | 0.0278 ± 0.0004 c |
| 28 | 1-Butanol-D | 1163.8 | 599.34 | 1.37764 | 0.0173 ± 0.0001 d | 0.0171 ± 0.0002 d | 0.0248 ± 0.0001 a | 0.0245 ± 0.0005 a | 0.0203 ± 0.0001 b | 0.0194 ± 0.0003 c |
| 29 | (E)-2-Pentenal-M | 1149.7 | 571.92 | 1.11043 | 0.0073 ± 0.0000 c | 0.0077 ± 0.0003 b | 0.0077 ± 0.0001 b | 0.0080 ± 0.0001 b | 0.0088 ± 0.0002 a | 0.0086 ± 0.0003 a |
| 30 | (E)-2-Pentenal-D | 1149.7 | 571.92 | 1.36044 | 0.0025 ± 0.0000 c | 0.0027 ± 0.0000 bc | 0.0018 ± 0.0001 d | 0.0027 ± 0.0002 b | 0.0034 ± 0.0001 a | 0.0035 ± 0.0002 a |
| 31 | p-Xylene | 1147 | 566.75 | 1.07323 | 0.0035 ± 0.0001 b | 0.0036 ± 0.0001 a | 0.0030 ± 0.0000 c | 0.0036 ± 0.0000 a | 0.0027 ± 0.0001 d | 0.0027 ± 0.0000 d |
| 32 | Isoamyl acetate | 1140.9 | 555.53 | 1.29049 | 0.0015 ± 0.0000 d | 0.0018 ± 0.0001 c | 0.0005 ± 0.0000 e | 0.0016 ± 0.0001 d | 0.0034 ± 0.0001 a | 0.0031 ± 0.0002 b |
| 33 | 2-Methyl-1-propanol-M | 1111.5 | 503.76 | 1.16996 | 0.0118 ± 0.0001 e | 0.0127 ± 0.0001 d | 0.0158 ± 0.0001 a | 0.0134 ± 0.0002 c | 0.0127 ± 0.0001 d | 0.0139 ± 0.0003 b |
| 34 | 2-Methyl-1-propanol-D | 1110.9 | 502.90 | 1.36192 | 0.0038 ± 0.0001 b | 0.0038 ± 0.0002 b | 0.0045 ± 0.0000 a | 0.0038 ± 0.0001 b | 0.0036 ± 0.0001 b | 0.0045 ± 0.0002 a |
| 35 | Hexanal-M | 1101 | 486.51 | 1.26371 | 0.0264 ± 0.0008 b | 0.0289 ± 0.0004 a | 0.0289 ± 0.0006 a | 0.0294 ± 0.0002 a | 0.0291 ± 0.0009 a | 0.0284 ± 0.0008 a |
| 36 | Hexanal-D | 1101.5 | 487.37 | 1.56877 | 0.0013 ± 0.0008 bc | 0.0019 ± 0.0011 b | 0.0010 ± 0.0006 c | 0.0008 ± 0.0004 b | 0.0039 ± 0.0023 a | 0.0037 ± 0.0021 a |
| 37 | 1-Penten-3-ol | 1177.9 | 628.01 | 0.94227 | 0.0068 ± 0.0001 c | 0.0063 ± 0.0001 e | 0.0080 ± 0.0001 b | 0.0069 ± 0.0001 c | 0.0066 ± 0.0001 d | 0.0083 ± 0.0001 a |
| 38 | Dimethyl disulfide | 1084.2 | 462.35 | 1.13722 | 0.0016 ± 0.0000 c | 0.0020 ± 0.0001 a | 0.0009 ± 0.0001 e | 0.0019 ± 0.0001 b | 0.0014 ± 0.0000 d | 0.0013 ± 0.0001 d |
| 39 | 1-Propanol-M | 1056 | 425.25 | 1.11341 | 0.0155 ± 0.0001 e | 0.0158 ± 0.0002 d | 0.0180 ± 0.0002 a | 0.0164 ± 0.0002 c | 0.0154 ± 0.0002 e | 0.0172 ± 0.0002 b |
| 40 | 1-Propanol-D | 1056 | 425.25 | 1.24883 | 0.0082 ± 0.0001 d | 0.0083 ± 0.0000 d | 0.0100 ± 0.0001 b | 0.0086 ± 0.0001 d | 0.0094 ± 0.0003 c | 0.0111 ± 0.0004 a |
| 41 | (E)-2-Butenal | 1042.4 | 408.41 | 1.07797 | 0.0028 ± 0.0001 a | 0.0028 ± 0.0002 a | 0.0023 ± 0.0001 c | 0.0029 ± 0.0001 a | 0.0024 ± 0.0002 bc | 0.0025 ± 0.0000 b |
| 42 | 1-Penten-3-one | 1014.2 | 375.677 | 1.08396 | 0.0019 ± 0.0002 d | 0.0029 ± 0.0000 a | 0.0017 ± 0.0000 e | 0.0027 ± 0.0001 b | 0.0021 ± 0.0001 c | 0.0020 ± 0.0000 cd |
| 43 | Propyl acetate-M | 1017.8 | 379.67 | 1.15094 | 0.0046 ± 0.0004 c | 0.0055 ± 0.0002 b | 0.0026 ± 0.0001 d | 0.0054 ± 0.0001 b | 0.0082 ± 0.0002 a | 0.0082 ± 0.0002 a |
| 44 | Propyl acetate-D | 1017.4 | 379.221 | 1.46822 | 0.0036 ± 0.0002 b | 0.0036 ± 0.0002 b | 0.0009 ± 0.0000 c | 0.0030 ± 0.0002 b | 0.0089 ± 0.0005 a | 0.0084 ± 0.0007 a |
| 45 | Pentanal-M | 1001 | 361.265 | 1.18176 | 0.0154 ± 0.0006 d | 0.0176 ± 0.0007 b | 0.0184 ± 0.0001 a | 0.0176 ± 0.0001 b | 0.0163 ± 0.0002 c | 0.0165 ± 0.0002 c |
| 46 | Pentanal-D | 1001.9 | 362.163 | 1.42371 | 0.0224 ± 0.0004 d | 0.0274 ± 0.0008 b | 0.0218 ± 0.0006 d | 0.0242 ± 0.0002 c | 0.0276 ± 0.0009 b | 0.0293 ± 0.0017 a |
| 47 | Cyclohexanone | 1300.3 | 823.935 | 1.1666 | 0.0019 ± 0.0000 a | 0.0015 ± 0.0001 b | 0.0015 ± 0.0000 b | 0.0016 ± 0.0001 b | 0.0013 ± 0.0001 c | 0.0015 ± 0.0001 b |
| 48 | Ethanol-M | 946.6 | 318.44 | 1.04367 | 0.0468 ± 0.0018 b | 0.0440 ± 0.0007 c | 0.0499 ± 0.0003 a | 0.0407 ± 0.0005 d | 0.0370 ± 0.0000 e | 0.0363 ± 0.0006 e |
| 49 | Ethanol-D | 946 | 317.955 | 1.12702 | 0.1008 ± 0.0030 a | 0.0925 ± 0.0017 b | 0.1017 ± 0.0009 a | 0.0848 ± 0.0015 c | 0.0799 ± 0.0013 d | 0.0747 ± 0.0011 e |
| 50 | Ethyl propanoate | 969 | 334.926 | 1.47248 | 0.0010 ± 0.0000 b | 0.0009 ± 0.0001 b | 0.0008 ± 0.0000 c | 0.0012 ± 0.0000 a | 0.0013 ± 0.0000 a | 0.0012 ± 0.0001 a |
| 51 | 2-Propanol | 936.4 | 311.167 | 1.08715 | 0.0026 ± 0.0001 d | 0.0034 ± 0.0001 b | 0.0045 ± 0.0002 a | 0.0025 ± 0.0000 d | 0.0027 ± 0.0001 cd | 0.0029 ± 0.0001 c |
| 52 | 3-Methylbutanal | 928 | 305.348 | 1.40363 | 0.0135 ± 0.0006 b | 0.0100 ± 0.0004 c | 0.0093 ± 0.0007 cd | 0.0151 ± 0.0010 a | 0.0087 ± 0.0002 d | 0.0085 ± 0.0001 d |
| 53 | Tert-Butanol | 934.3 | 309.712 | 1.32512 | 0.0129 ± 0.0008 a | 0.0109 ± 0.0005 bc | 0.0113 ± 0.0002 b | 0.0114 ± 0.0007 b | 0.0101 ± 0.0002 c | 0.0105 ± 0.0008 bc |
| 54 | Ethyl Acetate | 905.6 | 290.317 | 1.32632 | 0.0051 ± 0.0002 c | 0.0044 ± 0.0000 e | 0.0081 ± 0.0000 a | 0.0067 ± 0.0002 b | 0.0048 ± 0.0001 d | 0.0043 ± 0.0001 e |
| 55 | 2-Butanone | 915.8 | 297.106 | 1.25022 | 0.0075 ± 0.0003 b | 0.0073 ± 0.0005 b | 0.0069 ± 0.0001 b | 0.0071 ± 0.0006 b | 0.0093 ± 0.0002 a | 0.0088 ± 0.0003 a |
| 56 | Diethyl acetal | 910.7 | 293.711 | 1.02917 | 0.0314 ± 0.0001 bc | 0.0334 ± 0.0015 ab | 0.0362 ± 0.0004 a | 0.0336 ± 0.0003 ab | 0.0298 ± 0.0022 c | 0.0314 ± 0.0035 bc |
| 57 | Butanal-M | 890.5 | 280.62 | 1.11252 | 0.0063 ± 0.0004 c | 0.0065 ± 0.0002 c | 0.0086 ± 0.0000 a | 0.0078 ± 0.0002 b | 0.0067 ± 0.0002 c | 0.0064 ± 0.0003 c |
| 58 | Butanal-D | 889 | 279.65 | 1.28405 | 0.0057 ± 0.0000 bc | 0.0044 ± 0.0002 d | 0.0061 ± 0.0001 b | 0.0066 ± 0.0002 a | 0.0052 ± 0.0002 c | 0.0047 ± 0.0005 d |
| 59 | Methacrolein | 895.8 | 284.014 | 1.22365 | 0.0069 ± 0.0002 b | 0.0084 ± 0.0001 a | 0.0023 ± 0.0001 d | 0.0061 ± 0.0001 c | 0.0084 ± 0.0005 a | 0.0081 ± 0.0008 a |
| 60 | Acrolein | 867.7 | 266.558 | 1.0642 | 0.0084 ± 0.0003 c | 0.0092 ± 0.0002 b | 0.0037 ± 0.0001 e | 0.0110 ± 0.0009 a | 0.0066 ± 0.0001 d | 0.0065 ± 0.0002 d |
| 61 | Acetone | 837.6 | 249.102 | 1.11614 | 0.0913 ± 0.0019 c | 0.0949 ± 0.0006 b | 0.0812 ± 0.0003 d | 0.0910 ± 0.0006 c | 0.1015 ± 0.0008 a | 0.1033 ± 0.0013 a |
| 62 | Propanal | 819.1 | 238.92 | 1.14634 | 0.0211 ± 0.0005 bc | 0.0215 ± 0.0002 b | 0.0200 ± 0.0004 d | 0.0204 ± 0.0002 cd | 0.0214 ± 0.0004 b | 0.0229 ± 0.0007 a |
| 63 | Ethyl formate | 829.8 | 244.738 | 1.20795 | 0.0048 ± 0.0002 a | 0.0038 ± 0.0001 c | 0.0044 ± 0.0001 b | 0.0048 ± 0.0001 a | 0.0033 ± 0.0001 d | 0.0033 ± 0.0000 d |
| 64 | 2-Methylpropanal | 830.6 | 245.223 | 1.28163 | 0.0009 ± 0.0001 b | 0.0006 ± 0.0000 c | 0.0008 ± 0.0001 b | 0.0012 ± 0.0001 a | 0.0006 ± 0.0000 cd | 0.0005 ± 0.0001 d |
| 65 | Dimethyl sulphide | 797.9 | 227.768 | 0.96032 | 0.0162 ± 0.0004 a | 0.0111 ± 0.0003 d | 0.0071 ± 0.0002 e | 0.0154 ± 0.0005 b | 0.0109 ± 0.0002 d | 0.0119 ± 0.0003 c |
| 66 | Acetaldehyde | 764.5 | 211.282 | 0.97965 | 0.0200 ± 0.0025 b | 0.0246 ± 0.0057 ab | 0.0257 ± 0.0007 a | 0.0237 ± 0.0012 ab | 0.0225 ± 0.0017 ab | 0.0210 ± 0.0004 ab |
| 67 | 2-Pentanone | 1000.4 | 360.625 | 1.3529 | 0.0068 ± 0.0001 d | 0.0075 ± 0.0003 bc | 0.0083 ± 0.0000 a | 0.0072 ± 0.0002 cd | 0.0077 ± 0.0002 b | 0.0072 ± 0.0002 c |
| 68 | 2-Butylfuran | 1147.1 | 567.018 | 1.18523 | 0.0022 ± 0.0002 a | 0.0017 ± 0.0001 b | 0.0015 ± 0.0001 bc | 0.0013 ± 0.0000 c | 0.0022 ± 0.0001 a | 0.0013 ± 0.0000 c |
| 69 | 2,3-Pentanedione | 1057.9 | 427.626 | 1.31919 | 0.0015 ± 0.0001 b | 0.0019 ± 0.0001 a | 0.0007 ± 0.0000 d | 0.0020 ± 0.0001 a | 0.0014 ± 0.0001 bc | 0.0012 ± 0.0002 c |
| 70 | 4-Methyl-2-pentanone | 1027.8 | 391.09 | 1.1818 | 0.0021 ± 0.0001 c | 0.0026 ± 0.0004 b | 0.0017 ± 0.0000 d | 0.0016 ± 0.0001 d | 0.0031 ± 0.0001 a | 0.0030 ± 0.0001 a |
| 71 | 2-Butanol | 1039.8 | 405.311 | 1.14473 | 0.0020 ± 0.0002 b | 0.0016 ± 0.0001 c | 0.0022 ± 0.0001 a | 0.0016 ± 0.0000 c | 0.0020 ± 0.0001 ab | 0.0021 ± 0.0001 ab |
| 72 | Beta-Pinene | 1136.2 | 546.908 | 1.21146 | 0.0007 ± 0.0001 f | 0.0008 ± 0.0001 e | 0.0018 ± 0.0001 a | 0.0011 ± 0.0000 d | 0.0014 ± 0.0000 b | 0.0012 ± 0.0000 c |
| 73 | Ethyl 3-methylbutanoate | 1087.3 | 466.525 | 1.25223 | 0.0007 ± 0.0000 c | 0.0007 ± 0.0001 c | 0.0011 ± 0.0000 a | 0.0009 ± 0.0000 b | 0.0006 ± 0.0000 d | 0.0005 ± 0.0000 d |
| 74 | 2,5-Dimethylfuran | 949.6 | 320.601 | 1.3758 | 0.0004 ± 0.0000 c | 0.0005 ± 0.0000 c | 0.0002 ± 0.0000 d | 0.0009 ± 0.0000 b | 0.0023 ± 0.0001 a | 0.0024 ± 0.0002 a |
| 75 | Isobutyl acetate | 1030.4 | 394.181 | 1.23494 | 0.0016 ± 0.0000 c | 0.0017 ± 0.0000 b | 0.0009 ± 0.0001 d | 0.0016 ± 0.0000 c | 0.0026 ± 0.0001 a | 0.0026 ± 0.0001 a |
| 76 | 3-Methyl-2-pentanone | 1036.7 | 401.601 | 1.47712 | 0.0004 ± 0.0000 b | 0.0003 ± 0.0000 bc | 0.0002 ± 0.0000 c | 0.0003 ± 0.0000 bc | 0.0009 ± 0.0000 a | 0.0009 ± 0.0002 a |
| 77 | 4-Methyl-3-penten-2-one | 1127.9 | 532.068 | 1.11137 | 0.0010 ± 0.0001 a | 0.0008 ± 0.0000 b | 0.0008 ± 0.0001 b | 0.0008 ± 0.0000 b | 0.0010 ± 0.0001 a | 0.0010 ± 0.0000 a |
| 78 | Myrcene | 1176.1 | 624.198 | 1.20404 | 0.0010 ± 0.0000 b | 0.0009 ± 0.0000 c | 0.0008 ± 0.0000 c | 0.0008 ± 0.0001 c | 0.0015 ± 0.0001 a | 0.0011 ± 0.0001 b |
| 79 | 2-Methyl-2-pentenal | 1173.7 | 619.252 | 1.51296 | 0.0005 ± 0.0000 b | 0.0005 ± 0.0000 b | 0.0004 ± 0.0000 b | 0.0004 ± 0.0000 b | 0.0016 ± 0.0001 a | 0.0016 ± 0.0003 a |
| 80 | Ethyl crotonate | 1178.4 | 629.145 | 1.17933 | 0.0014 ± 0.0001 e | 0.0016 ± 0.0001 d | 0.0012 ± 0.0000 f | 0.0018 ± 0.0001 c | 0.0026 ± 0.0001 a | 0.0020 ± 0.0000 b |
| 81 | Butyl butanoate | 1223 | 701.753 | 1.3399 | 0.0017 ± 0.0001 c | 0.0018 ± 0.0001 bc | 0.0008 ± 0.0000 d | 0.0016 ± 0.0001 c | 0.0024 ± 0.0002 a | 0.0019 ± 0.0000 b |
| 82 | Ethyl hexanoate | 1249.3 | 741.113 | 1.33342 | 0.0013 ± 0.0001 c | 0.0015 ± 0.0001 b | 0.0011 ± 0.0001 d | 0.0015 ± 0.0001 b | 0.0024 ± 0.0001 a | 0.0022 ± 0.0001 a |
| 83 | 2-Decenal | 1758.5 | 2227.265 | 1.49379 | 0.0060 ± 0.0009 a | 0.0055 ± 0.0005 a | 0.0057 ± 0.0013 a | 0.0055 ± 0.0008 a | 0.0071 ± 0.0008 a | 0.0063 ± 0.0004 a |
| 84 | Butanoic acid | 1710.1 | 2005.275 | 1.16111 | 0.0033 ± 0.0001 c | 0.0032 ± 0.0001 c | 0.0040 ± 0.0001 b | 0.0034 ± 0.0003 c | 0.0033 ± 0.0001 c | 0.0046 ± 0.0003 a |
| 85 | Isobutanoic acid | 1628.5 | 1679.983 | 1.15864 | 0.0053 ± 0.0001 bc | 0.0043 ± 0.0006 d | 0.0058 ± 0.0005 b | 0.0051 ± 0.0003 c | 0.0047 ± 0.0003 cd | 0.0066 ± 0.0002 a |
| 86 | Acetoin | 1299.4 | 822.47 | 1.05843 | 0.0151 ± 0.0017 a | 0.0104 ± 0.0009 b | 0.0103 ± 0.0004 b | 0.0103 ± 0.0002 b | 0.0079 ± 0.0003 c | 0.0091 ± 0.0002 bc |
| 87 | 1-Octen-3-one | 1310.7 | 842.906 | 1.26942 | 0.0013 ± 0.0001 bc | 0.0013 ± 0.0001 bc | 0.0012 ± 0.0001 c | 0.0014 ± 0.0000 b | 0.0020 ± 0.0002 a | 0.0019 ± 0.0000 a |
| 88 | (Z)-Hex-3-enol | 1416.7 | 1060.894 | 1.26747 | 0.0012 ± 0.0000 c | 0.0012 ± 0.0001 bc | 0.0010 ± 0.0001 d | 0.0012 ± 0.0001 c | 0.0014 ± 0.0001 a | 0.0014 ± 0.0001 ab |
| 89 | 2-Heptanol | 1348.5 | 914.92 | 1.37883 | 0.0011 ± 0.0001 b | 0.0011 ± 0.0001 b | 0.0005 ± 0.0002 c | 0.0010 ± 0.0001 b | 0.0015 ± 0.0001 a | 0.0015 ± 0.0001 a |
| 90 | Ethyl heptanoate | 1339.1 | 896.43 | 1.40618 | 0.0008 ± 0.0001 c | 0.0010 ± 0.0001 ab | 0.0006 ± 0.0001 d | 0.0009 ± 0.0000 bc | 0.0010 ± 0.0000 a | 0.0009 ± 0.0000 abc |
| 91 | Styrene | 1269.3 | 772.356 | 1.44107 | 0.0017 ± 0.0000 d | 0.0018 ± 0.0000 d | 0.0020 ± 0.0001 c | 0.0026 ± 0.0001 a | 0.0026 ± 0.0001 a | 0.0022 ± 0.0001 b |
| 92 | 2-Acetyl-1-pyrroline | 1344.5 | 907.058 | 1.13317 | 0.0009 ± 0.0002 a | 0.0009 ± 0.0001 a | 0.0005 ± 0.0001 b | 0.0008 ± 0.0001 a | 0.0005 ± 0.0001 b | 0.0005 ± 0.0000 b |
| 93 | 1 | 1054 | 422.658 | 0.94674 | 0.0053 ± 0.0002 cd | 0.0055 ± 0.0002 c | 0.0051 ± 0.0000 d | 0.0046 ± 0.0001 e | 0.0077 ± 0.0002 a | 0.0065 ± 0.0002 b |
| 94 | 2 | 1031.1 | 394.929 | 1.08516 | 0.0036 ± 0.0011 a | 0.0031 ± 0.0017 a | 0.0033 ± 0.0012 a | 0.0025 ± 0.0015 a | 0.0030 ± 0.0032 a | 0.0025 ± 0.0028 a |
| 95 | 3 | 971.6 | 336.866 | 1.4145 | 0.0019 ± 0.0001 bc | 0.0014 ± 0.0001 d | 0.0021 ± 0.0001 a | 0.0020 ± 0.0001 b | 0.0021 ± 0.0000 a | 0.0017 ± 0.0000 c |
| 96 | 4 | 950 | 320.865 | 1.24056 | 0.0126 ± 0.0002 d | 0.0123 ± 0.0001 d | 0.0116 ± 0.0001 e | 0.0129 ± 0.0003 c | 0.0151 ± 0.0001 a | 0.0144 ± 0.0000 b |
| 97 | 5 | 851.2 | 256.86 | 1.15842 | 0.0019 ± 0.0001 b | 0.0016 ± 0.0001 c | 0.0025 ± 0.0001 a | 0.0015 ± 0.0001 c | 0.0010 ± 0.0001 d | 0.0011 ± 0.0001 d |
| 98 | 6 | 790.3 | 223.889 | 1.09199 | 0.0223 ± 0.0006 a | 0.0175 ± 0.0005 c | 0.0099 ± 0.0001 f | 0.0188 ± 0.0003 b | 0.0134 ± 0.0004 d | 0.0116 ± 0.0002 e |
| 99 | 7 | 1015.1 | 376.626 | 1.39759 | 0.0020 ± 0.0001 d | 0.0025 ± 0.0001 c | 0.0005 ± 0.0000 e | 0.0020 ± 0.0001 d | 0.0031 ± 0.0002 a | 0.0029 ± 0.0002 b |
| 100 | 8 | 1056.7 | 426.084 | 1.44228 | 0.0006 ± 0.0000 b | 0.0009 ± 0.0001 a | 0.0003 ± 0.0000 c | 0.0009 ± 0.0001 a | 0.0006 ± 0.0000 b | 0.0006 ± 0.0001 b |
| 101 | 9 | 1029.9 | 393.563 | 1.50307 | 0.0002 ± 0.0000 c | 0.0004 ± 0.0000 b | 0.0001 ± 0.0000 d | 0.0002 ± 0.0000 c | 0.0007 ± 0.0000 a | 0.0007 ± 0.0001 a |
| 102 | 10 | 1135.2 | 545.053 | 1.09036 | 0.0010 ± 0.0001 a | 0.0009 ± 0.0002 a | 0.0005 ± 0.0000 b | 0.0010 ± 0.0000 a | 0.0009 ± 0.0000 a | 0.0010 ± 0.0001 a |
| 103 | 11 | 1395.5 | 1013.209 | 1.27333 | 0.0009 ± 0.0000 b | 0.0010 ± 0.0001 b | 0.0008 ± 0.0001 c | 0.0009 ± 0.0001 b | 0.0013 ± 0.0001 a | 0.0010 ± 0.0000 b |
| Abbreviation | Plant Height | Effective Spikelet | Waxy | Aromatic | Genotype |
|---|---|---|---|---|---|
| DT502 | 101.0 | 8.3 | s | a | badh2/badh2 |
| DG163 | 137.7 | 10.4 | s | a | badh2/badh2 |
| DG1839 | 108.4 | 9.2 | s | a | badh2/badh2 |
| DG1946 | 109.2 | 11.0 | s | a | badh2/badh2 |
| DG1938 | 129.4 | 9.7 | s | n | badh2/badh2 |
| DG2029 | 118.6 | 10.1 | g | a | badh2/badh2 |
| DG2030 | 122.2 | 8.6 | g | a | badh2/badh2 |
| Marker | Primer Sequence (5′-3′) | Source of Primer |
|---|---|---|
| ESP | P1:TTGTTTGGAGCTTGCTGATG | Bradbury et al. (2005) [45] |
| IFAP | P2:CATAGGAGCAGCTGAAATATATACC | |
| INSP | P3:CTGGTAAAAAGATTATGGCTTCA | |
| EAP | P4:AGTGCTTTACAAAGTCCCGC |
Disclaimer/Publisher’s Note: The statements, opinions and data contained in all publications are solely those of the individual author(s) and contributor(s) and not of MDPI and/or the editor(s). MDPI and/or the editor(s) disclaim responsibility for any injury to people or property resulting from any ideas, methods, instructions or products referred to in the content. |
© 2023 by the authors. Licensee MDPI, Basel, Switzerland. This article is an open access article distributed under the terms and conditions of the Creative Commons Attribution (CC BY) license (https://creativecommons.org/licenses/by/4.0/).
Share and Cite
Chen, J.; Liu, Y.; Yang, M.; Shi, X.; Mei, Y.; Li, J.; Yang, C.; Pu, S.; Wen, J. Analysis of the Differences in Volatile Organic Compounds in Different Rice Varieties Based on GC-IMS Technology Combined with Multivariate Statistical Modelling. Molecules 2023, 28, 7566. https://doi.org/10.3390/molecules28227566
Chen J, Liu Y, Yang M, Shi X, Mei Y, Li J, Yang C, Pu S, Wen J. Analysis of the Differences in Volatile Organic Compounds in Different Rice Varieties Based on GC-IMS Technology Combined with Multivariate Statistical Modelling. Molecules. 2023; 28(22):7566. https://doi.org/10.3390/molecules28227566
Chicago/Turabian StyleChen, Jin, Ying Liu, Mi Yang, Xinmin Shi, Yuqin Mei, Juan Li, Chunqi Yang, Shihuang Pu, and Jiancheng Wen. 2023. "Analysis of the Differences in Volatile Organic Compounds in Different Rice Varieties Based on GC-IMS Technology Combined with Multivariate Statistical Modelling" Molecules 28, no. 22: 7566. https://doi.org/10.3390/molecules28227566
APA StyleChen, J., Liu, Y., Yang, M., Shi, X., Mei, Y., Li, J., Yang, C., Pu, S., & Wen, J. (2023). Analysis of the Differences in Volatile Organic Compounds in Different Rice Varieties Based on GC-IMS Technology Combined with Multivariate Statistical Modelling. Molecules, 28(22), 7566. https://doi.org/10.3390/molecules28227566