Abstract
Urtica laetevirens Maxim. is used extensively in traditional Chinese medicine (TCM) for its potent antioxidative properties. In this study, three antioxidants were purified from U. laetevirens. using HSCCC guided by online DPPH-HPLC analysis. Firstly, the online DPPH-HPLC analysis was performed to profile out the antioxidant active molecules in U. laetevirens. The ultrasonic-assisted extraction conditions were optimized by response surface methodology and the results showed the targeted antioxidant active molecules could be well enriched under the optimized extraction conditions. Then, the antioxidant active molecules were separated by high-speed countercurrent chromatography ethyl acetate/n-butanol/water (2:3:5, v/v/v) as the solvent system. Finally, the three targets including 16.8 mg of Isovitexin, 9.8 mg of Isoorientin, and 26.7 mg of Apigenin-6,8-di-C-β-d-glucopyranoside were obtained from 100 mg of sample. Their structures were identified by 1H NMR spectroscopy.
1. Introduction
Urtica laetevirens Maxim. (U. laetevirens) holds a distinguished place both in culinary traditions and in the field of natural medicinal plants, attributed to its potent antioxidative attributes [1]. Recognized as a rich repository of diverse nutritional and bioactive compounds, U. laetevirens aligns well with the burgeoning demand for antioxidant-rich foods, a demand propelled by a health-centric approach prevalent in contemporary dietary practices [2]. In this milieu, it is observed that the chemical constituents in U. laetevirens function effectively as free radical inhibitors, presenting themselves as primary antioxidants capable of reacting with free radicals [3]. This interactivity not only establishes a protective barrier against free-radical-induced damage within the human body but also augments the health benefits attributable to the consumption of U. laetevirens [4]. Consequently, there is an emergent imperative for the free radical inhibitors within U. laetevirens to be identified and segregated. In this study, an effort is made to locate and isolate the active constituents that exhibit significant antioxidative properties in U. laetevirens. Through such a systematic approach, the comprehensive antioxidant potential of U. laetevirens is envisioned to be revealed, paving the way for a wider and better U. laetevirens application in traditional herbs and dietary paradigms.
Diseases triggered by oxidative stress are notably linked with an extensive variety of severe health issues, encompassing cardiovascular ailments and various forms of cancer, consequently presenting a considerable menace to human health [5]. Within the rich molecules of U. laetevirens, bioactive constituents have been discovered to act as free radical inhibitors or scavengers, engaging actively with free radicals [6]. This interaction is critical in reducing the detrimental effects induced by oxidative stress in the human body. Leveraged for its reliability and effectiveness, the DPPH (1,1-diphenyl-2-trinitrophenylhydrazine radical) neutralization test facilitates the determination of the antioxidative potency of various agents, providing a further understanding of the role U. laetevirens plays in mitigating the risks associated with oxidative stress diseases [7]. The online HPLC (high-performance liquid chromatography)–DPPH screening system has emerged as a pivotal tool in the rapid identification of compounds with DPPH radical elimination potential in extracts [8]. The introduction of this online HPLC-DPPH technique has greatly streamlined the identification of active antioxidant constituents derived from natural sources, marking a substantial stride in the ongoing efforts to harness the potential of natural derivatives for antioxidative applications [9]. Furthermore, this technology has been demonstrated to be effective in the precise identification of antioxidants, asserting its utility and efficiency in the field of antioxidant research [10].
Response surface methodology (RSM) is acknowledged as a powerful instrument in fine-tuning the extraction procedures for active substances [11]. Leveraging precise mathematical and statistical techniques, it allows for the streamlined delineation of optimal conditions for extraction [12]. Moreover, it is extensively utilized to pinpoint the ideal conditions for operation [13,14,15,16]. Consequently, we utilized RSM in this study to refine the conditions for ultrasonic-assisted extraction.
Traditional methods of separation are often beset with constraints pertaining to yield purity and efficiency [17]. In comparison, high-speed countercurrent chromatography (HSCCC) stands out as a sophisticated alternative to traditional techniques, unencumbered by similar constraints, thereby offering enhanced accuracy and efficacy in segregating desired molecules [18]. Characterized by the employment of a liquid stationary phase rather than a solid one, it enables superior recovery rates and purity, representing a significant advancement in the realm of separation science [19].
In the present work, a framework has been meticulously devised for the swift and proficient delineation, isolation, and refinement of DPPH inhibitors in U. laetevirens using an integrated approach of online HPLC-DPPH analysis combined with HSCCC separation. This method not only showcases a strategic advancement in the rapid identification and isolation of antioxidative constituents but also fosters the discovery and application of antioxidants present in U. laetevirens, marking a pivotal step forward in the field of U. laetevirens chemical diversity and its health promotion effect.
2. Results and Discussion
2.1. Screening Target Antioxidants via the Online DPPH-HPLC System
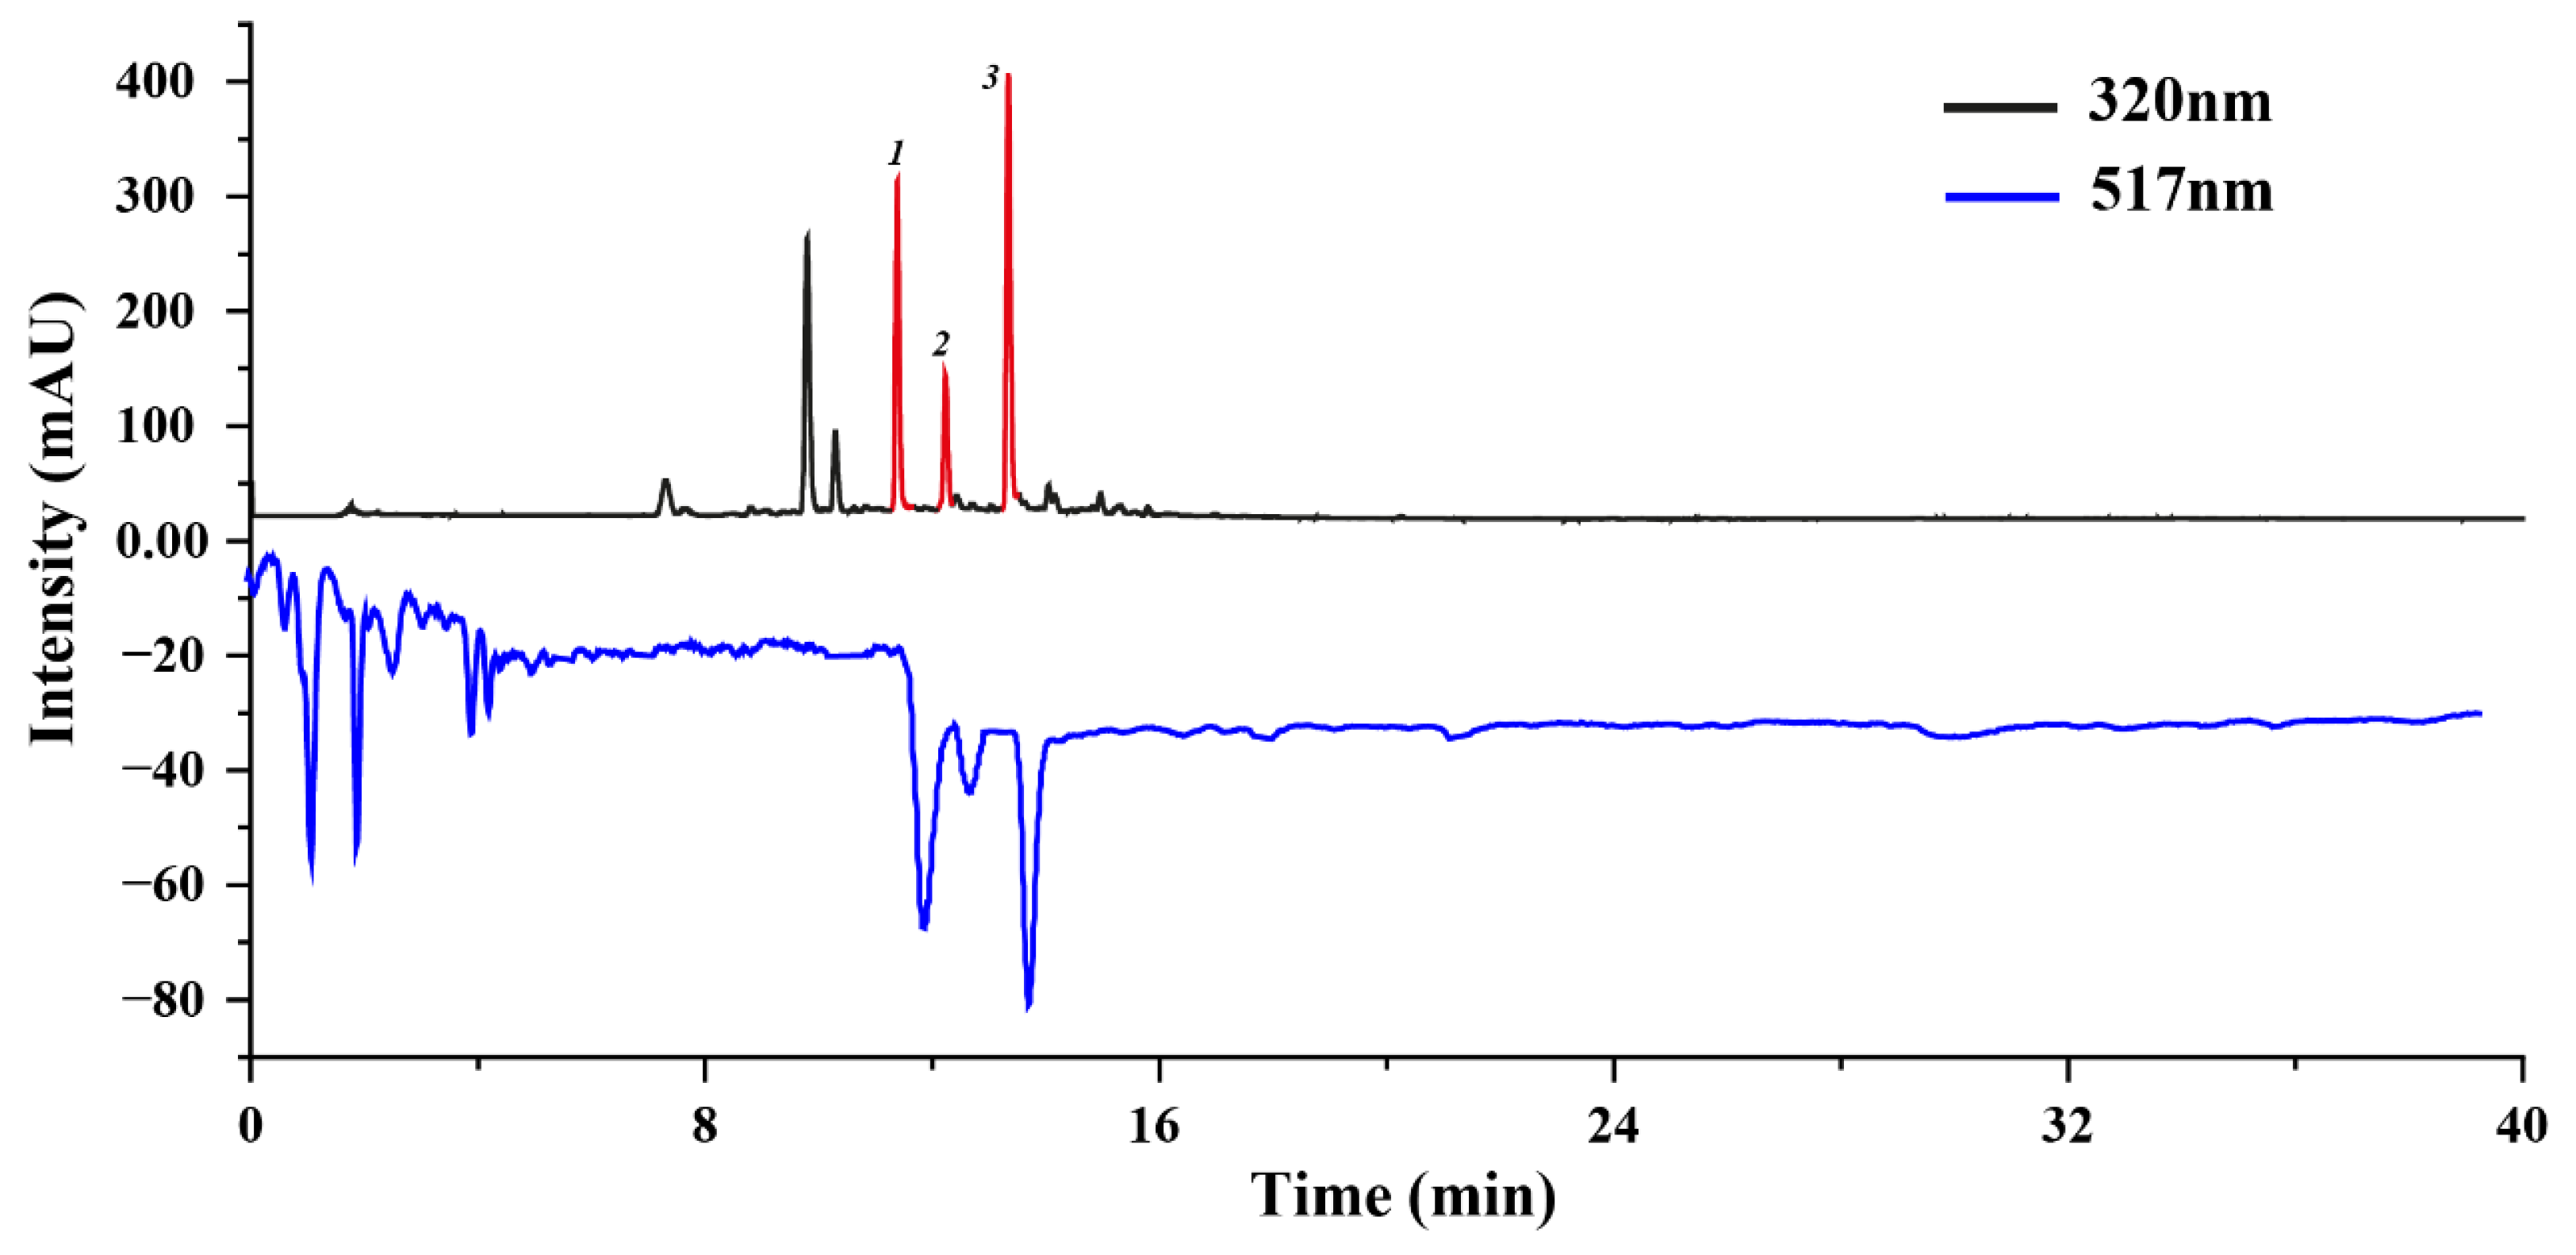
We employed an online HPLC-DPPH approach to screen the antioxidant active molecules of U. laetevirens. This screening approach is highly regarded for its sensitivity and user-friendly operational characteristics, particularly well-suited for detecting antioxidant active molecules within a complex mixture [20]. The most salient advantage of the online post-column HPLC-DPPH system is its dual capacity to not only screen active molecules via UV detection but also simultaneously gauge the free radical scavenging activity [21]. Compounds exhibiting potential antioxidant activity manifest as corresponding negative peaks in the HPLC chromatogram at 517 nm after undergoing a DPPH reaction, while compounds devoid of antioxidant activity display minimal variations in peak areas [22].
To initiate the analytical process, we utilized a Phenomenex Luna C18 chromatographic column within the online HPLC-DPPH system to profile DPPH inhibitors within the sample. Significantly, three well-resolved active peaks were discerned at 517 nm, precisely corresponding to the three chromatographic peaks detected at 320 nm in the HPLC chromatogram (Figure 1). Conversely, no other peaks exhibited commensurate active features. This observation substantiates the premise that these three peaks (Peak 1, 2, 3) are indicative of the target compounds, exhibiting potent antioxidant activity. Further experiments were performed to optimize the extraction efficiency of these target antioxidants through ultrasound-assisted extraction techniques, followed by the separation of these target antioxidants via HSCCC.
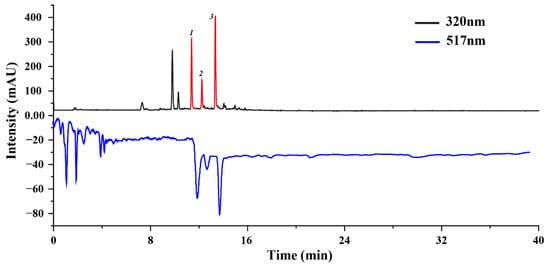
Figure 1.
DPPH-HPLC analysis for antioxidant active molecule screen. Peak 1, 2, 3 were identified as target antioxidation active molecules. The HPLC settings were as follows: the analyses utilized a Phenomenex Luna C18 chromatographic column with dimensions of 250 mm × 4.6 mm and a particle size of 5 μm. The mobile phase was structured with component A (0.4% acetic acid dispersed in water) and component B (acetonitrile), following a pre-defined schedule: a time frame from 0 to 40 min was designated to facilitate a gradient increase from 5% to 95% of component B. The system operated at a steady flow rate of 1 mL/min. Detection was dual-wavelength, set at 320 nm and 517 nm, under a column thermostat maintained at 35 °C.
2.2. Refinement of Ultrasonic-Assisted Extraction Parameters
In adherence to the devised blueprint, a series of 17 experiments were executed twice to ensure reliability, with the garnered data illustrated in Table 1. The calculated values of R2, R2-adjusted, and R2-predicted were determined to be 95.64, 90.03, and 68.98, respectively, demonstrating that the comprehensive quadratic models offered superior efficacy in delineating the response variable Y compared to alternative models. The representative mathematical formulation is presented as:

Table 1.
Box–Behnken design matrix and experimental response.
To scrutinize the substantiality of the model, an analysis of variance (ANOVA) was undertaken, the details of which are delineated in Table 2. In evaluating individual terms within the model, a heightened F-value paired with a diminished p-value signified a marked influence on the corresponding response element. Consequently, the linear constituents X1 and X2, the interactive term X1×2, along with the quadratic components X12 and X22, exhibited a considerable impact (p < 0.05) on the cumulative concentration of the three targets [23].

Table 2.
The analysis of variance.
Contrastingly, the linear component X3, coupled with the interaction terms X1×3, and X2×3, and the quadratic element X32, remained inconsequential in affecting the response, evincing a p-value greater than 0.05. The model’s predictive accuracy was confirmed by conducting a lack-of-fit assessment (p > 0.05), thus validating its capability to precisely predict encountered variances.
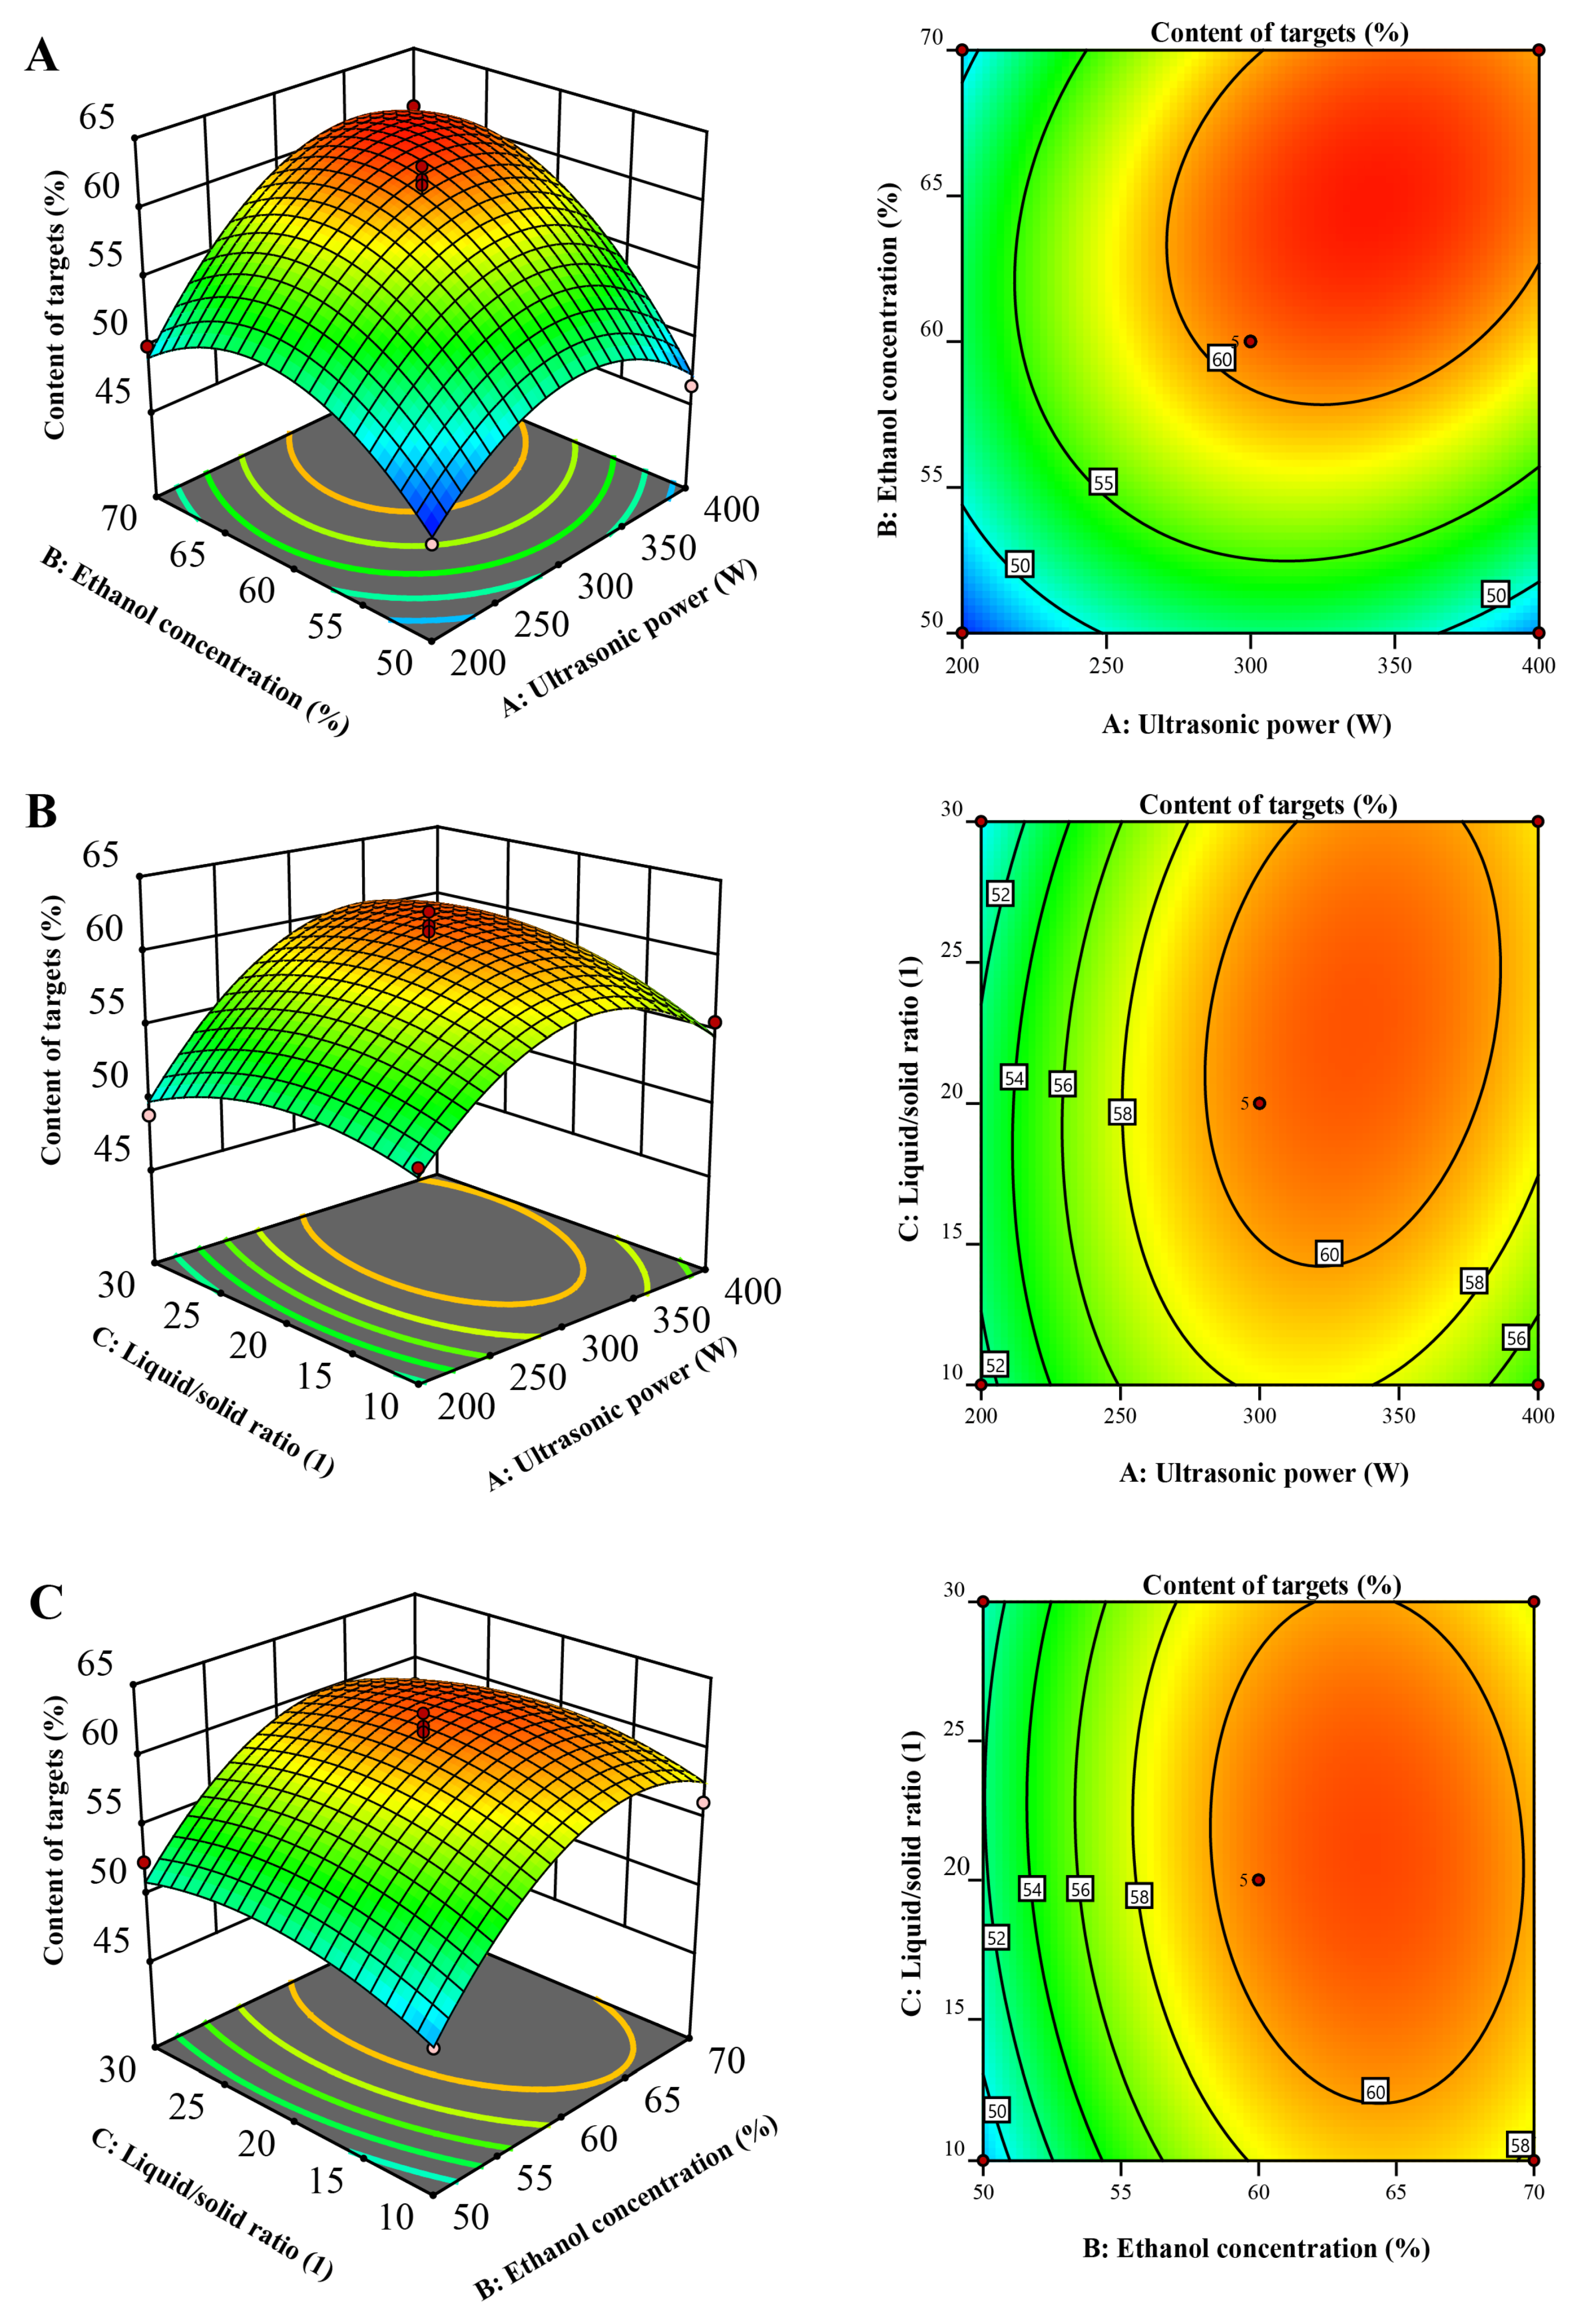
The 3D diagrams serve as visual embodiments of the regression equations, facilitating the discernment of the associations between the outcomes and the experimental tiers of every variable, as well as delineating the interplays between a pair of testing parameters. These connections between independent and reliant variables have been graphically portrayed through three-dimensional renderings of the response surfaces designated for Y (illustrated in Figure 2). Each 3D surface plot illustrates two variables, with the remaining parameter maintained at a neutral level.
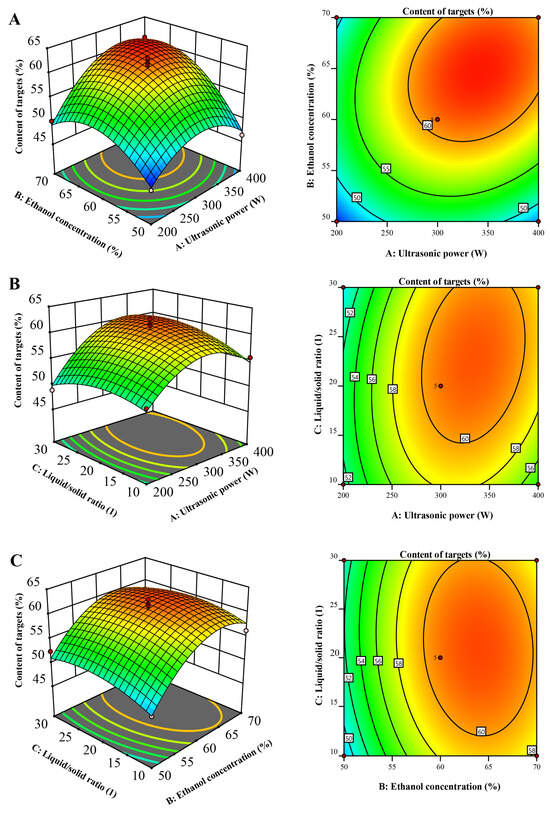
Figure 2.
Response surface showing the interaction of variable factors on Y: (A) interaction between ultrasonic power and ethanol concentration; (B) ultrasonic potency in correlation with the liquid-to-solid ratio; (C) between ethanol concentration and the liquid-to-solid ratio.
Figure 2A illustrates the correlation between ethanol concentration and ultrasonic power. Initially, there was an increase in Y with rising ethanol concentration, followed by a subsequent decrease. This phenomenon can be attributed to the disparity in polarities between the target compounds and other constituents. Within the optimal ethanol concentration range, the target compounds exhibited effective enrichment, similar to the performance of liquid–liquid extraction or macroporous resin chromatography. Consequently, Y exhibited an initial increase with a higher ethanol concentration. However, as the ethanol concentration continued to rise beyond the suitable range, the content of target compounds declined, leading to a subsequent decrease in W.
Figure 2B portrays the interaction between the liquid-to-solid ratio and ultrasonic power. Initially, there was an uptick in Y with the rising liquid-to-solid ratio, but subsequently, it commenced a descent. This phenomenon can be elucidated by considering the wide range of polarities within the sample. With an increase in the liquid-to-solid ratio, both the content of other compounds and target compounds simultaneously escalated. However, once the liquid-to-solid ratio exceeded 23, the relative growth rate of ΣCj (where j denotes the other compounds) outpaced that of ΣCi (where i represents the target compounds). Consequently, Y witnessed a decline.
The optimal conditions for the UAE process were determined to be an ultrasonic power of 344.16 W, an ethanol concentration of 64.89%, and a liquid/solid ratio of 23.64. The predicted Y under these conditions was 62.53%. Subsequently, the actual experimental parameters were set to a power of 345 W, an ethanol concentration of 65%, and a liquid/solid ratio of 23. These conditions were tested in triplicate, resulting in an achieved Y value of 61.63%. This outcome underscores the effectiveness of response surface methodology (RSM) with a well-designed experimental setup for optimizing the UAE process. These findings affirm that UAE is a viable choice for the extraction and concentration of the target compounds.
2.3. Determining the Appropriate Conditions for High-Speed Counter-Current Chromatography (HSCCC) Experiments
The initial stage of an HSCCC experiment involves carefully choosing a suitable solvent system that can provide the desired partition coefficient (K) for the target compounds, guided by their chemical properties [24]. Several crucial factors require examination, including the polarity of the sample (determined by K values), its solubility, ionic state, and potential for forming complexes [24]. Typically, an optimal K value falls within the range of 0.2 to 5, while the separation factor between two compounds (α = K2/K1, where K2 > K1) should exceed 1.5 [25]. Smaller K values orchestrate solutes to approach the solvent frontier, resulting in a lower resolution, whereas enlarged K values tend to offer superior resolution albeit with dilated and attenuated peaks due to protracted elution periods [26]. The prerequisite is the stability and solubility of target compounds, with a solvent system delineating briskly and distinctly into biphasic portions.
Heeding the stipulated principles, we streamlined the solvent scheme for HSCCC separation. We evaluated a range of two-phase solvent systems consisting of ethyl acetate/n-butanol/water (4:1:5, 3:1:5, 2:1:5, 3:2:5, 2:3:5, 1:4:5, v/v/v). We measured the K-values of the target compounds and have summarized the results in Table 3. Initially, a particular ratio of ethyl acetate/butanol/water (4:1:5, v/v/v) was leveraged to gauge the distribution of compounds. This revealed a predominant distribution in the lower phase, indicating a polarity less than what was necessitated by the sample. Consequently, adjustments were implemented on the ethyl acetate/butanol ratio to heighten the system’s polarity. The K values of the three targets exhibited a decline as the ratio of ethyl acetate to butanol decreased. Ultimately, we opted for the ethyl acetate/n-butanol/water system (2:3:5, v/v/v) due to its favorable K values and α-values.

Table 3.
K-values of target compounds.
Additionally, an array of flow rates was experimented with to unveil their repercussions on separation duration and peak discernment attributes. This revealed that diminished flow rates entailed extended separation times albeit with a commendable peak resolutions, the reverse being true for escalated flow rates. The ensuing choice was a 1.5 mL/min flow rate for ensuing HSCCC undertakings. Moreover, the rotational speed exhibited a conspicuous influence over stationary phase retention, with heightened speeds inciting emulsification, and elevated temperatures facilitating a higher retention in butanol inclusive solvent systems. A 900 rpm speed was hence adopted, attaining a 48% retention rate in the stationary phase.
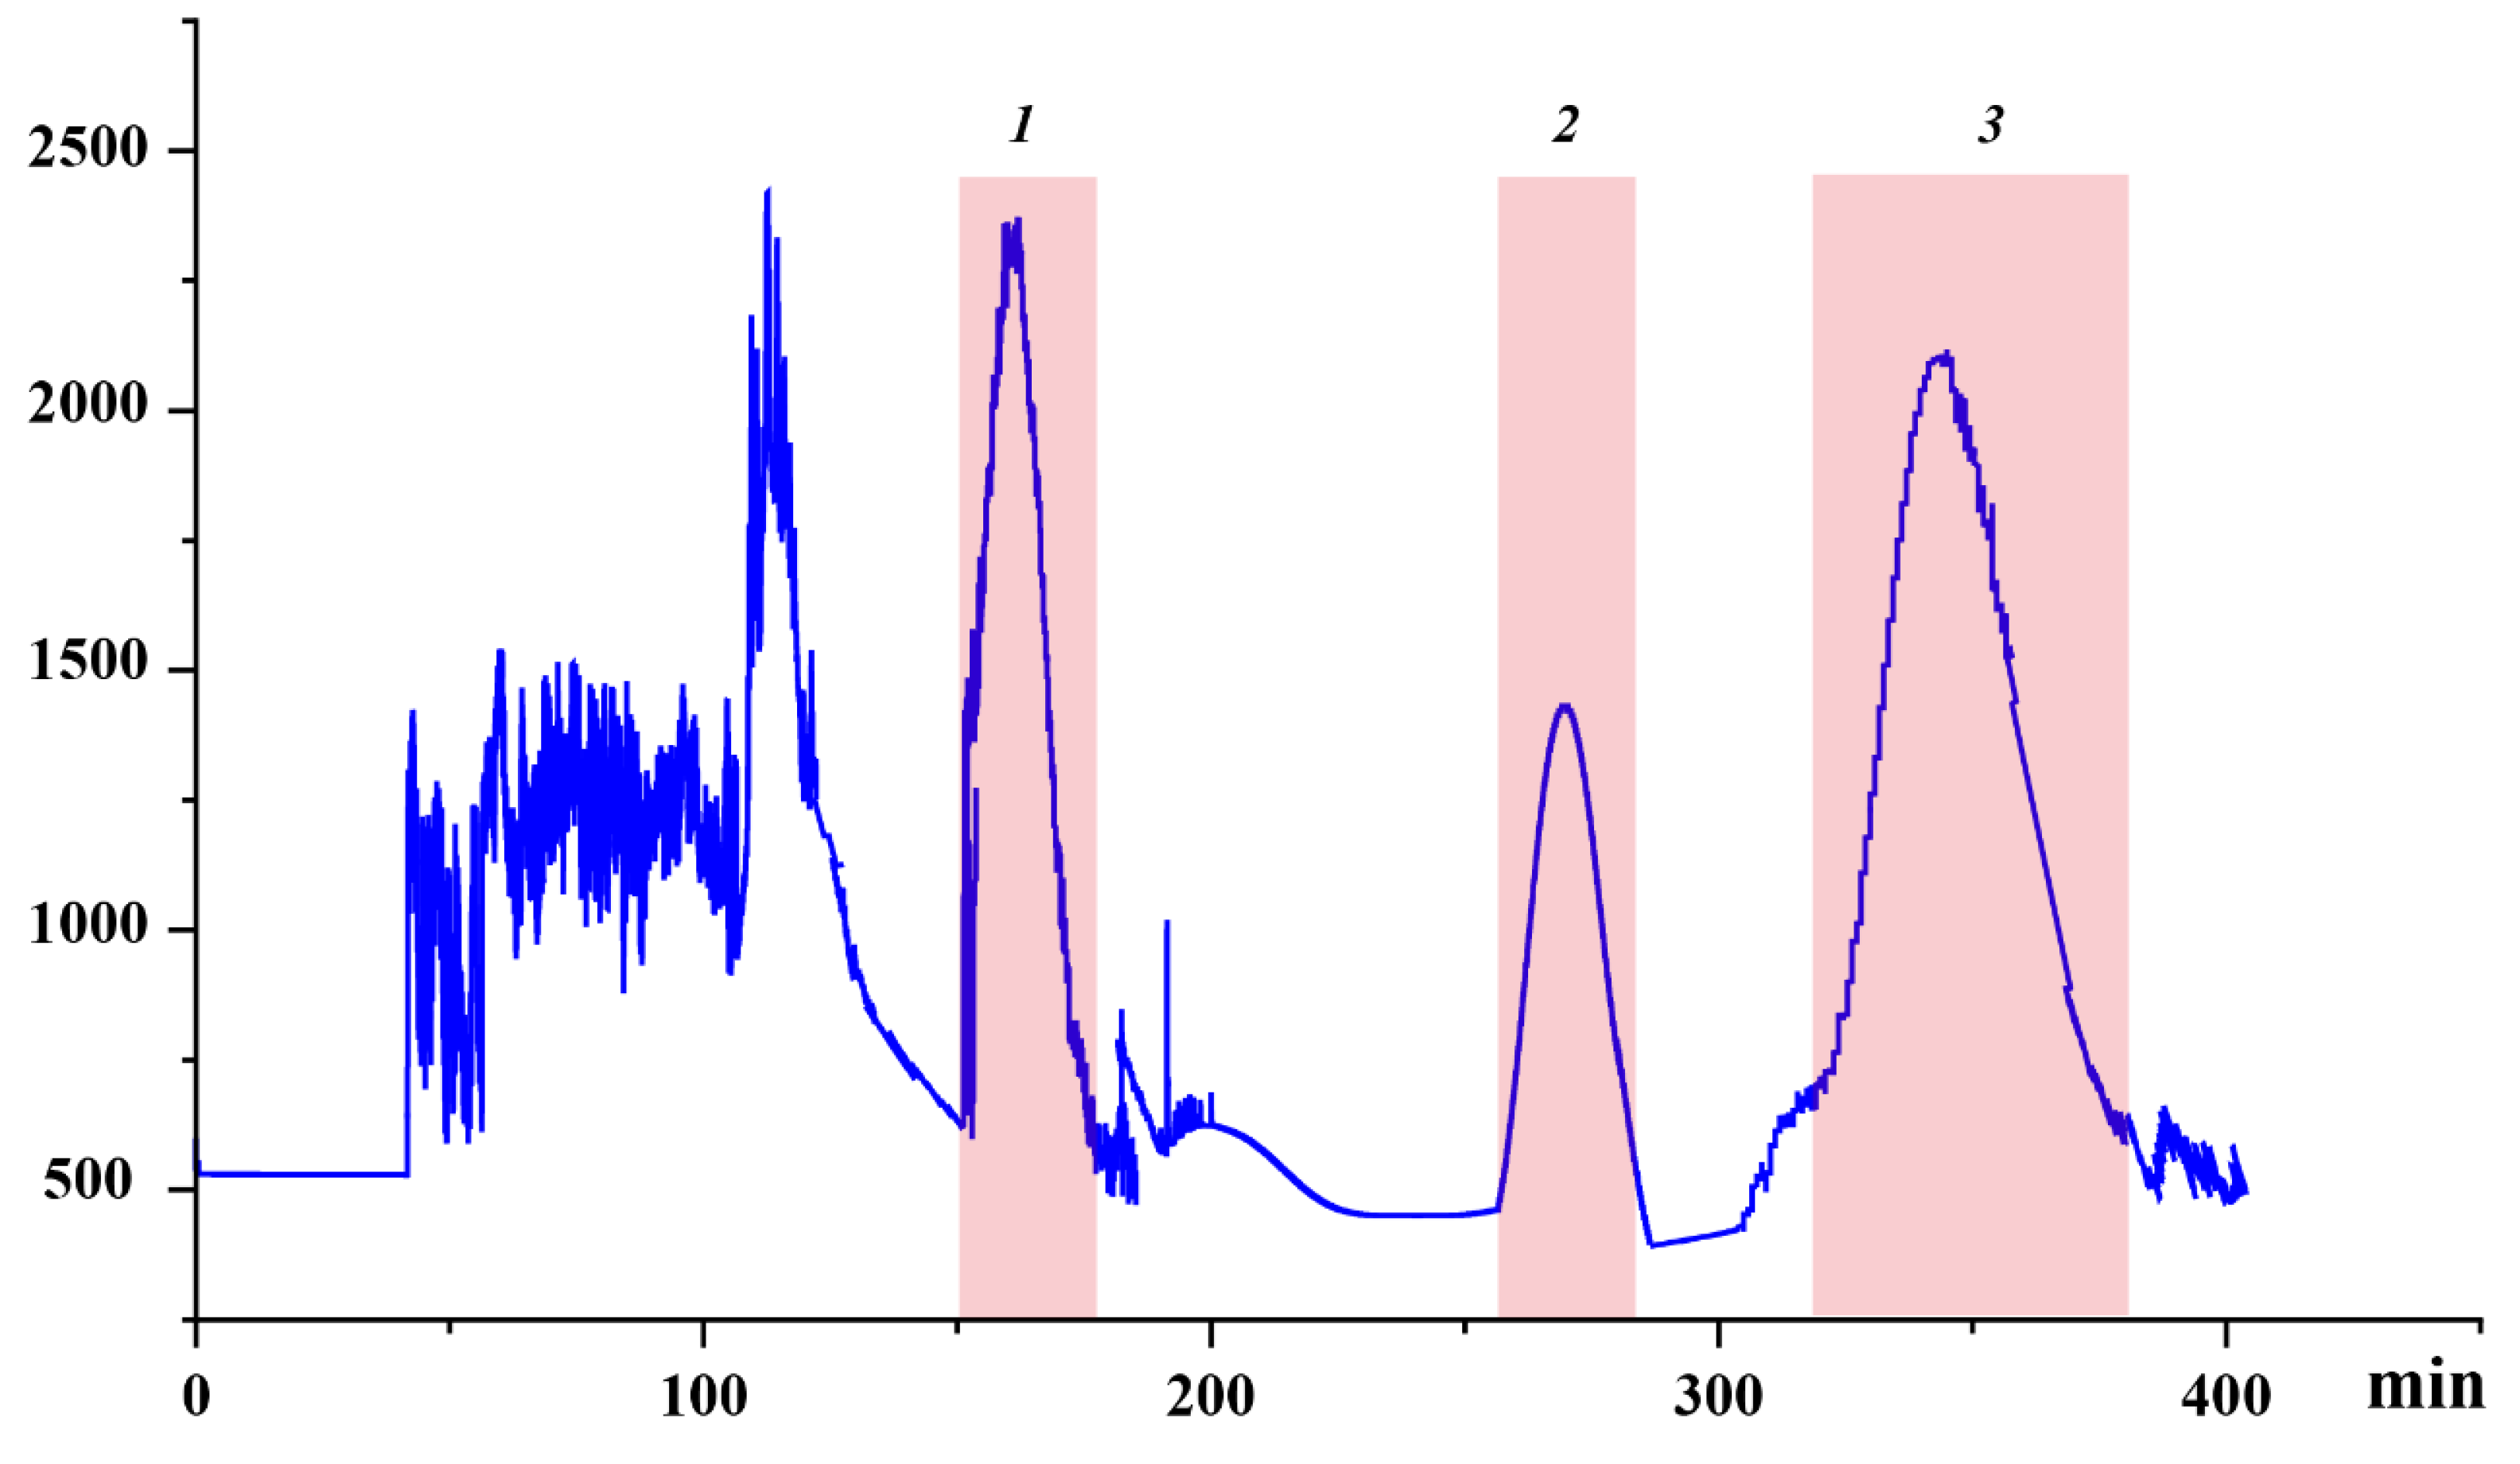
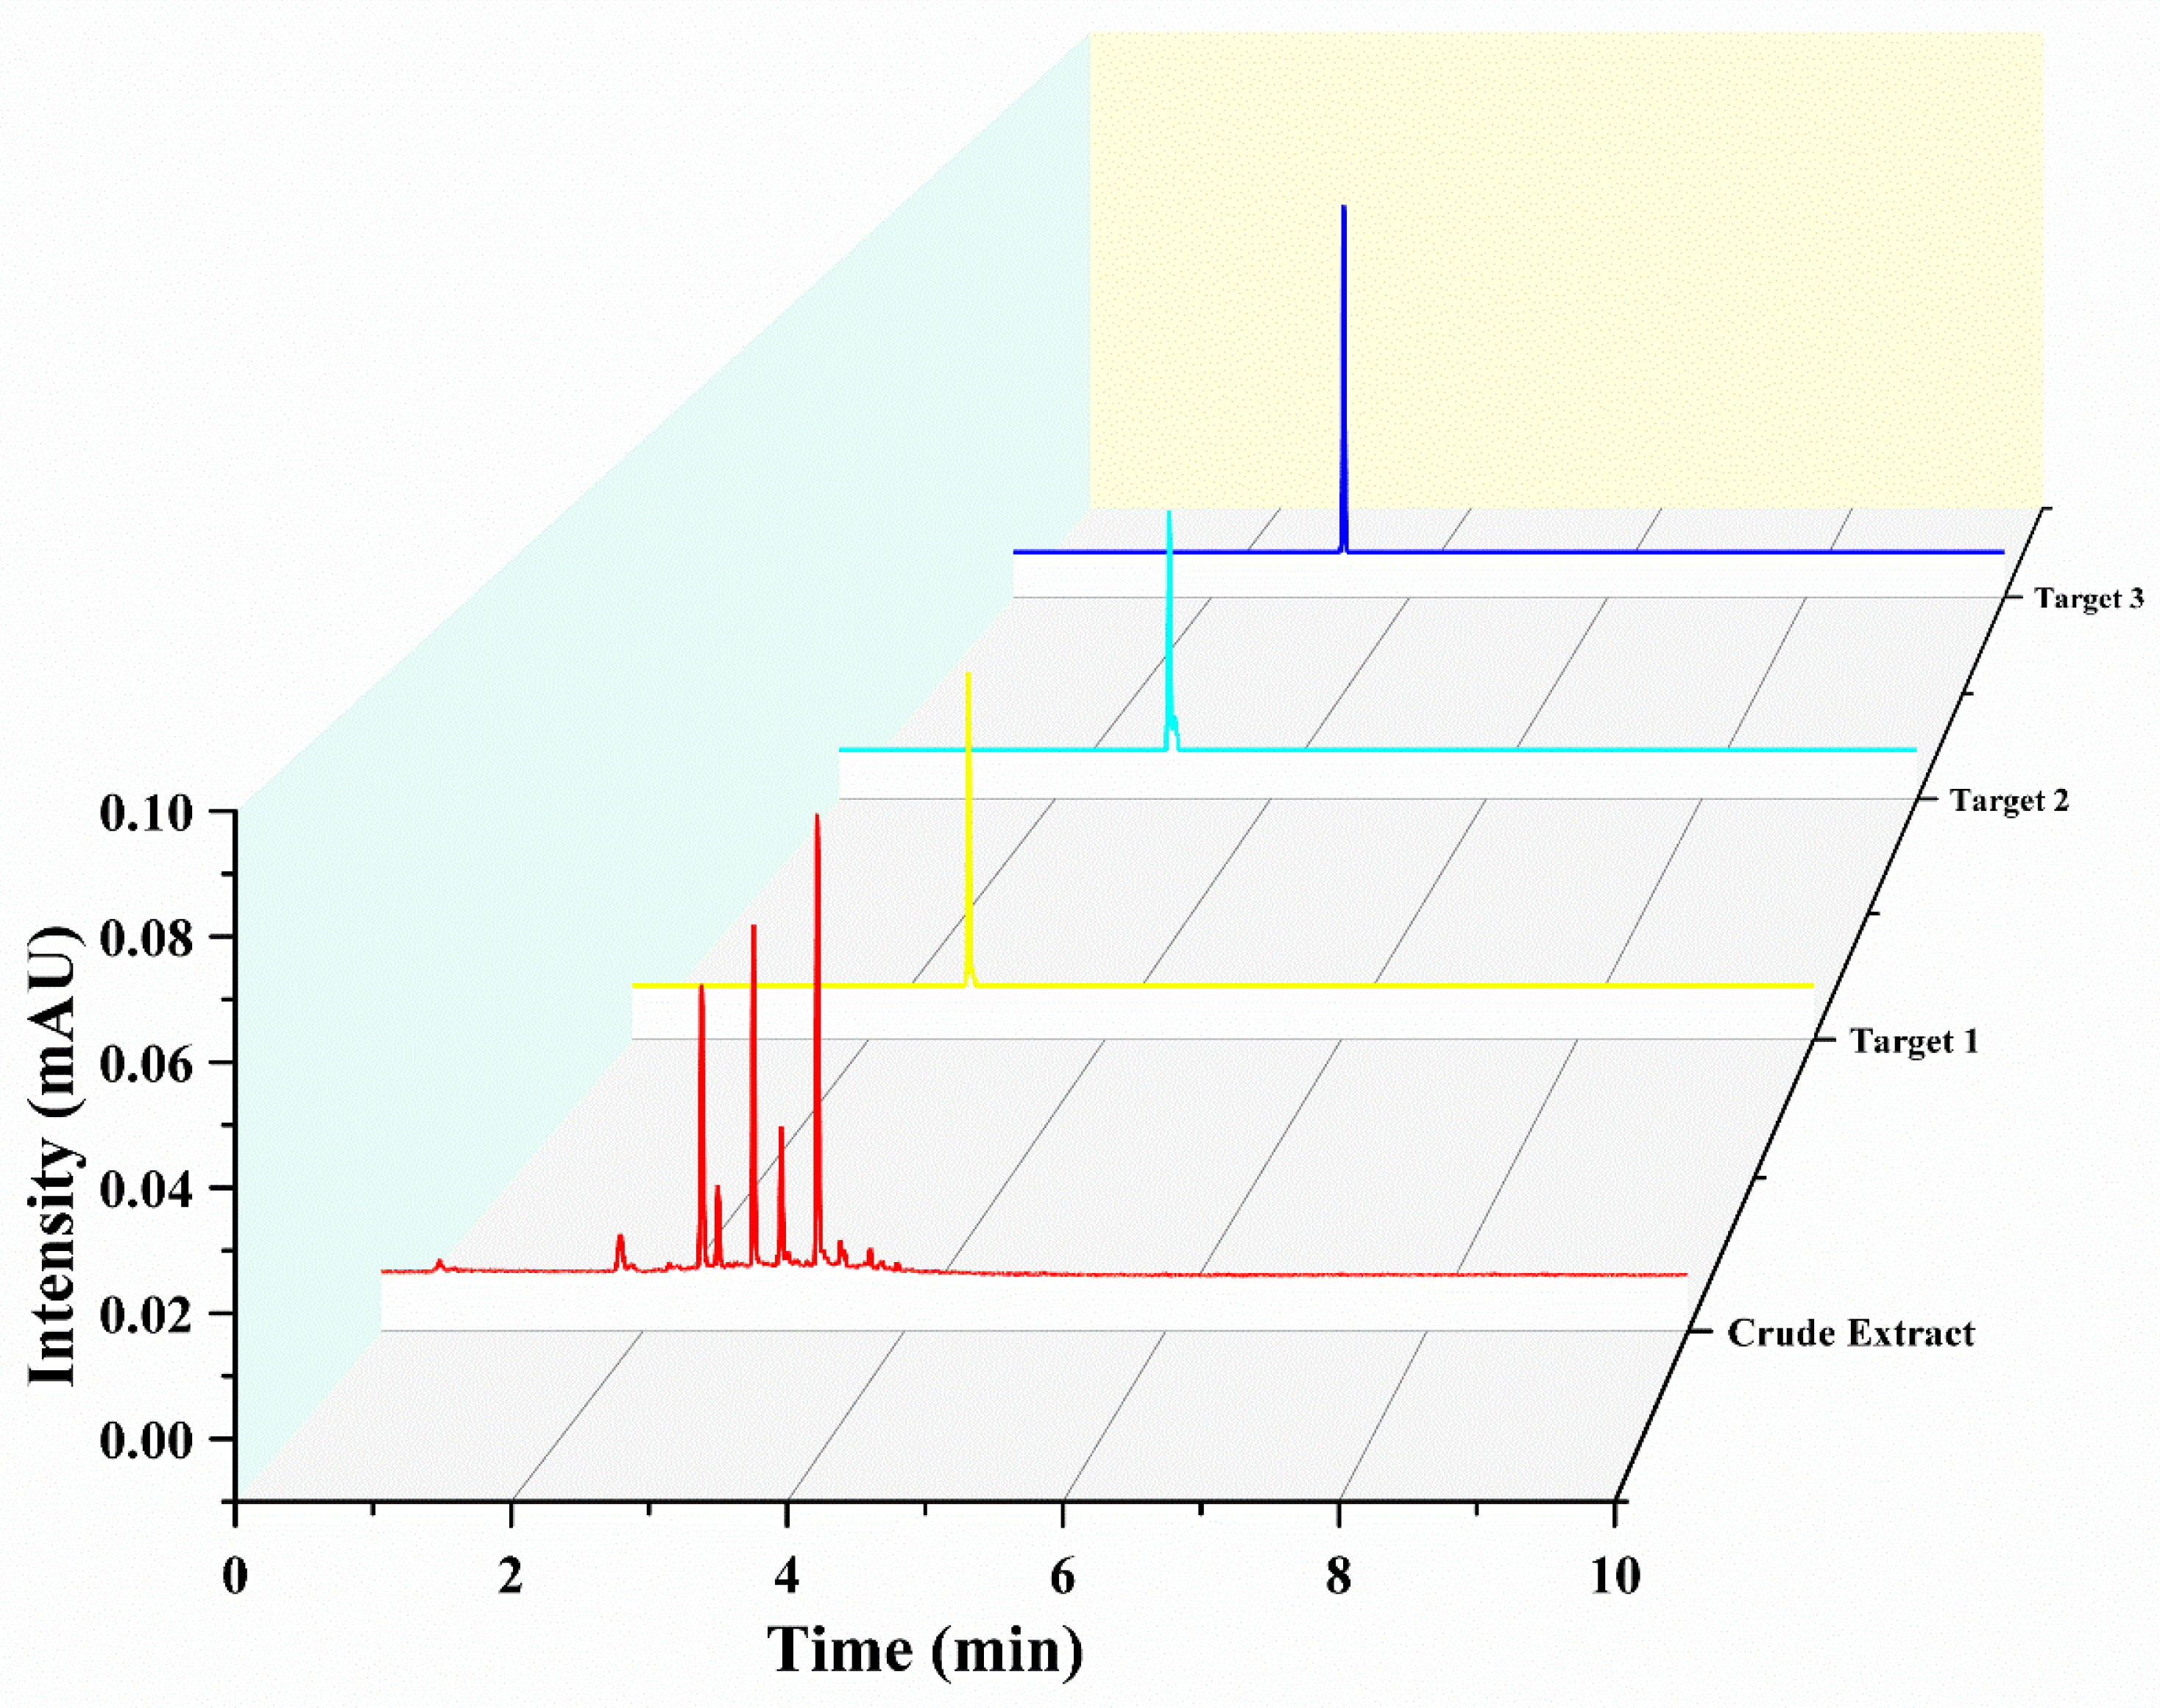
Under delineated parameters, a single run extracting from a defined quantity of rough extract in approximately 400 min yielded three principal antioxidants, as exhibited in Figure 3. Their quantities were detailed as 16.8 mg of Target 1, 9.8 mg of Target 2, and 26.7 mg of Target 3. UPLC analysis corroborated the purity of these entities to exceed 93%, as demonstrated in Figure 4.
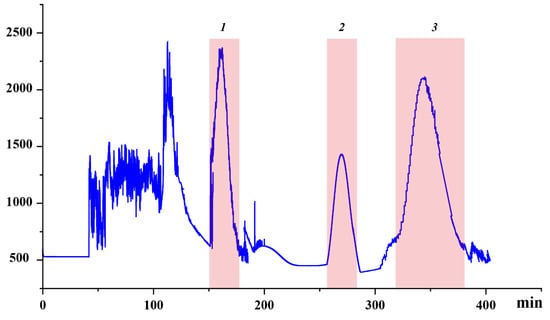
Figure 3.
High-speed countercurrent chromatography (HSCCC) chromatogram of the sample using the ethyl acetate/n-butanol/water (2:3:5, v/v/v). Conditions: stationary phase, upper phase; flow rate, 1.5 mL/min; revolution speed, 900 rpm; sample amount, 100 mg; separation temperature, 40 °C; detection wavelength, 320 nm; retention of the stationary phase: 48%.
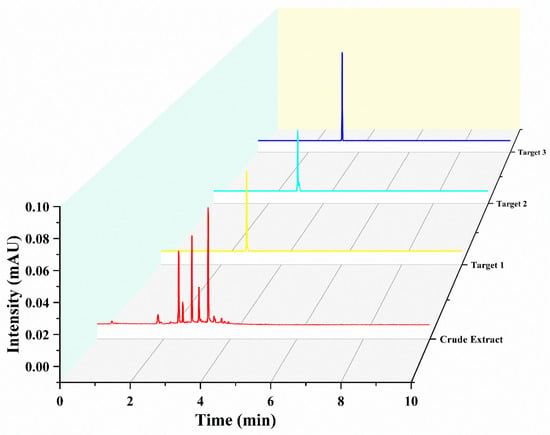
Figure 4.
Ultra-high-performance liquid chromatography (UHPLC) chromatograms of both the raw extract and the fractions obtained through high-speed counter-current chromatography (HSCCC). Conditions: Separation was carried out using an Acquity UHPLCHSS T3 column (2.1 × 100 mm, 1.8 μm; Waters) at a maintained temperature of 35 °C. The delineated mobile phases included water supplemented with 0.1% formic acid (A) and acetonitrile (B). A gradient elution strategy was adopted, implementing a 5% to 95% B range over a span of 0–10 min, operating at a flow rate of 0.3 mL/min. The procedure involved an injection volume set at 1.0 μL. Throughout the process, a consistent column temperature of 35 °C was upheld, coupled with a detection wavelength pinpointed at 320 nm.
2.4. Structural Identification
The chemical structures (Figure 5) of the target compounds were determined through 1H NMR analysis, and the findings are outlined below (Figures S1–S6, Supplementary Materials):

Figure 5.
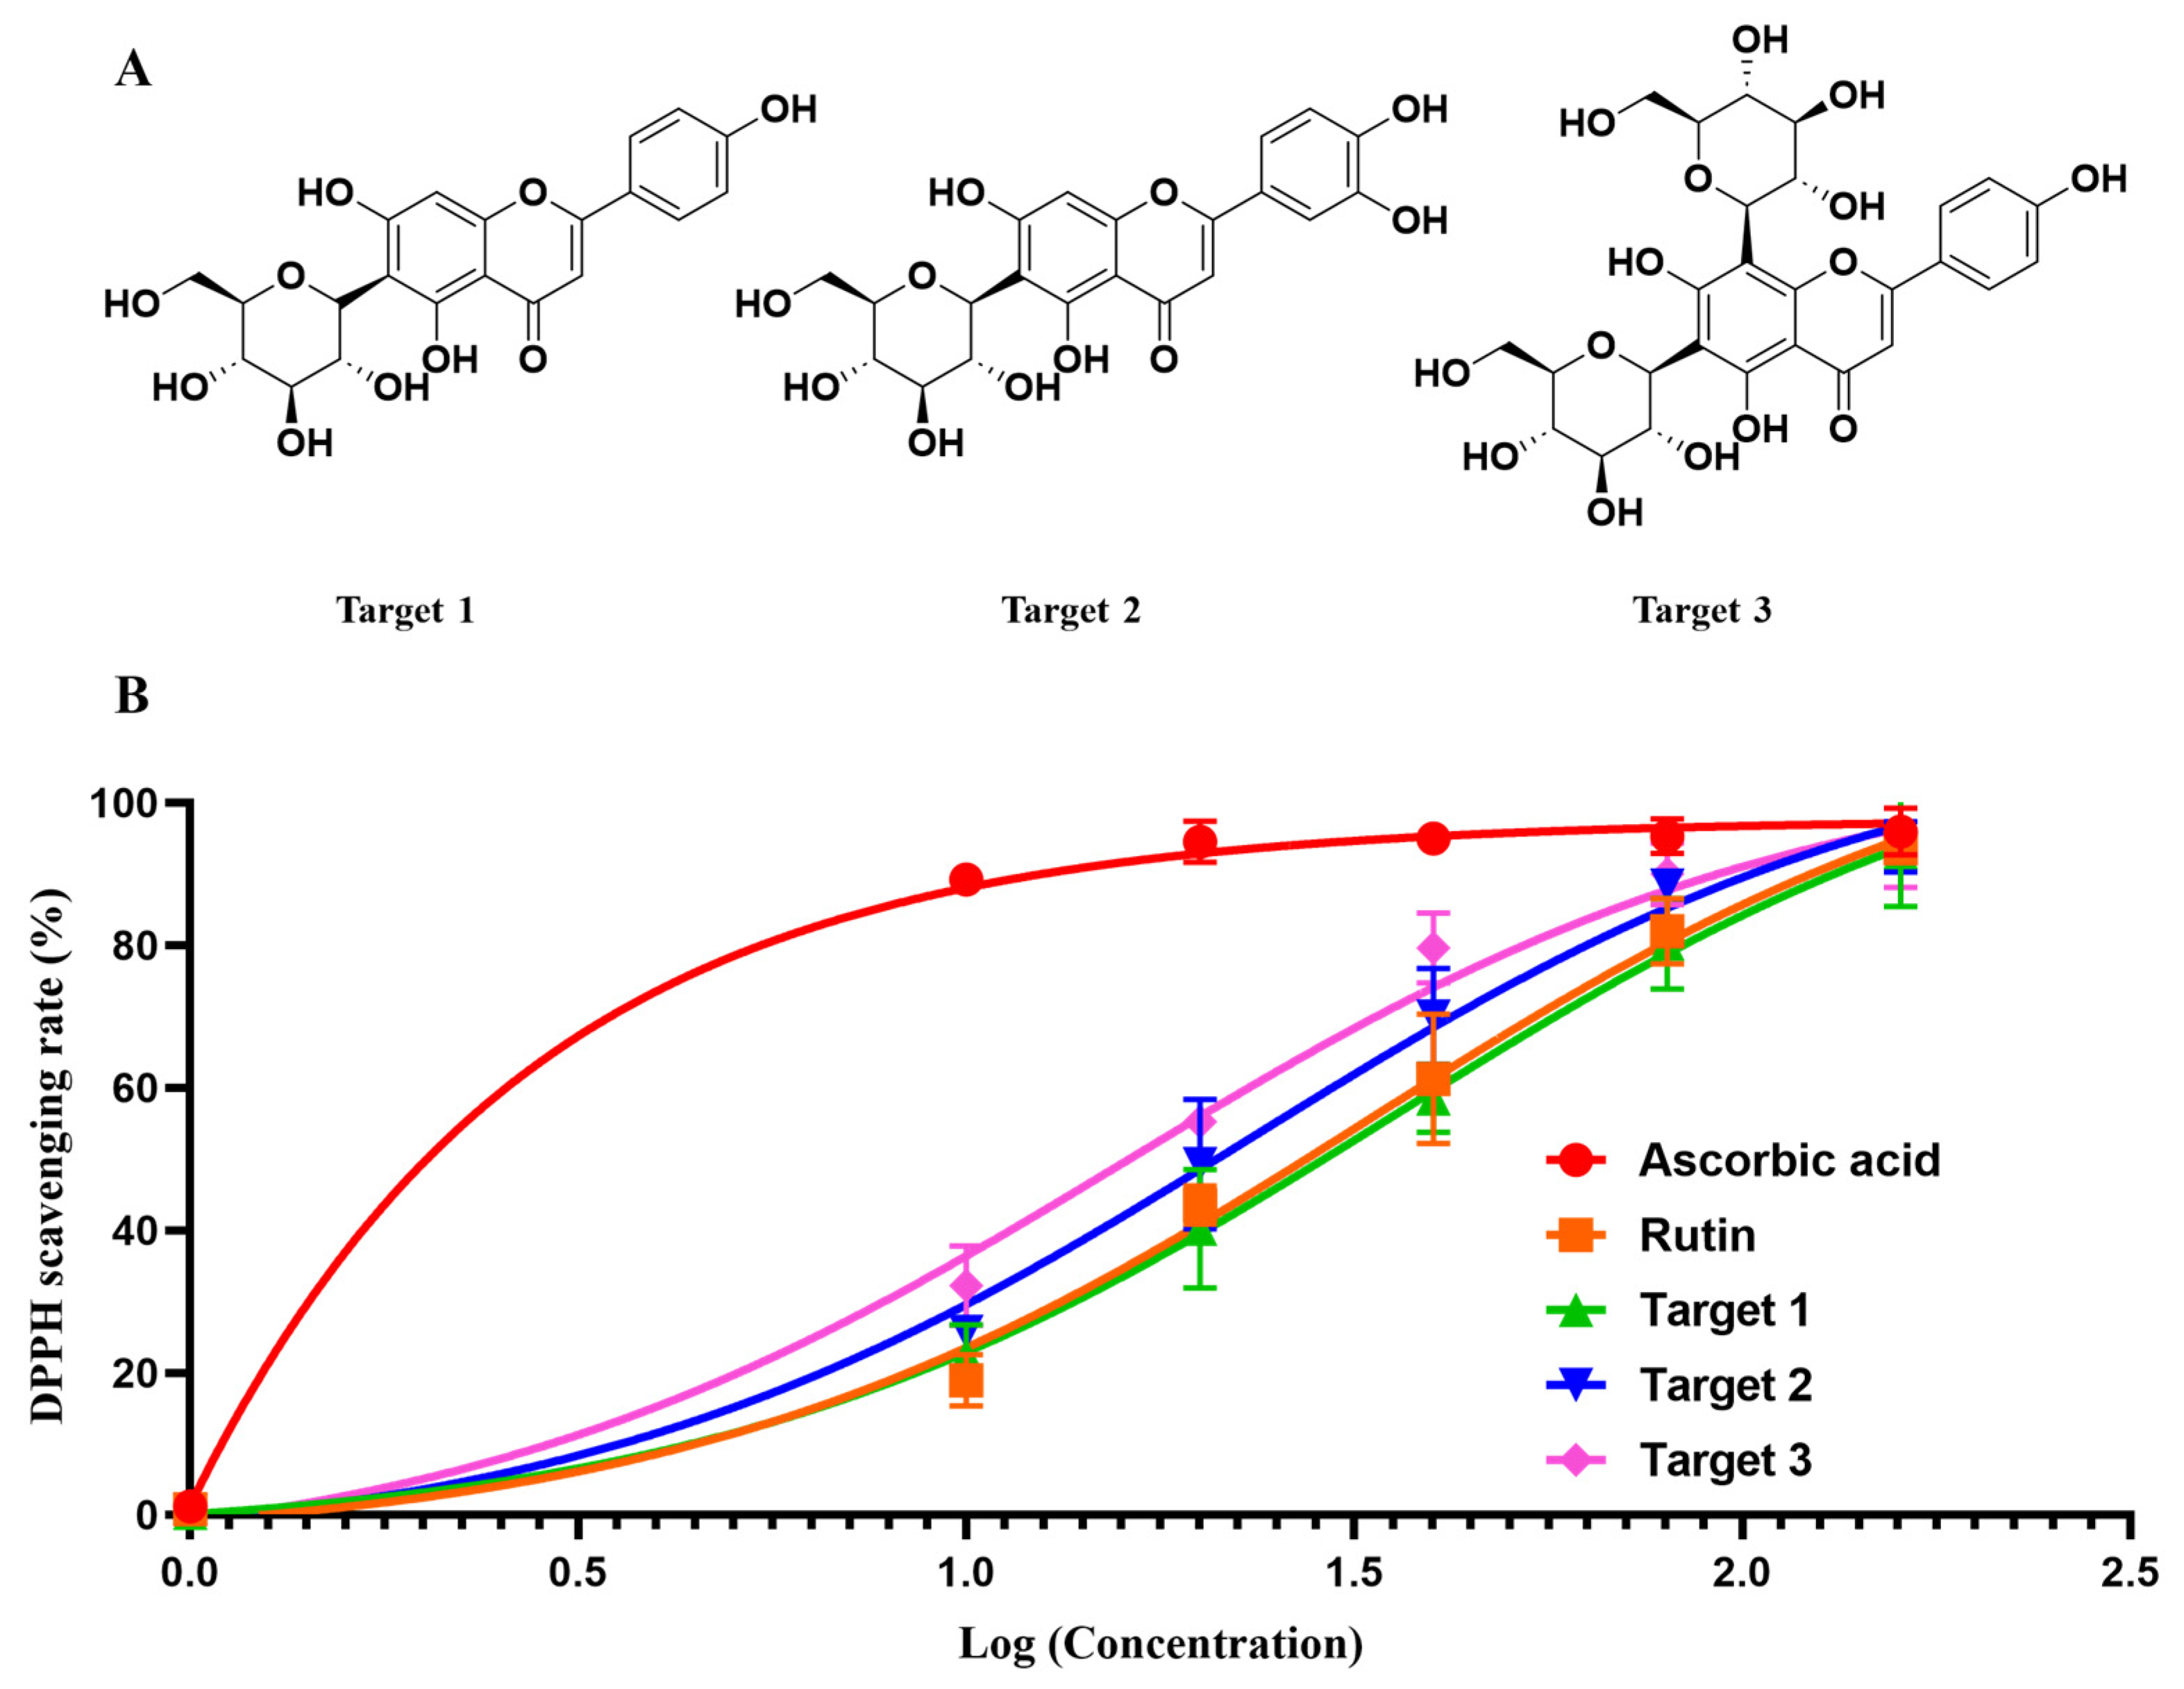
The chemical structures (A) and DPPH scavenging activity of the three targets (B): Isovitexin (Target 1), Isoorientin (Target 2), and apigenin-6,8-di-C-β-d-glucopyranoside (Target 3).
Target I: The compound was isolated as a pale yellow solid powder. Through meticulous nuclear magnetic resonance (NMR) spectroscopic analyses, its structure was elucidated. The 1H NMR (500 MHz, CD3OD) presented characteristic signals at δH: 4.59 (1H, t, J = 5.4 Hz, H-glc-1″), 6.51 (1H, s, H-3), 6.60 (1H, s, H-8), 6.93 (2H, d, J = 8.4 Hz, H-3′, 5′), and 7.83 (2H, d, J = 8.4 Hz, H-2′, 6′). The 13C NMR (500 MHz, CD3OD) provided additional data with δC values at: 62.84 (Glc-6″), 71.77 (Glc-4″), 72.56 (Glc-1″), 75.28 (Glc-3″), 80.12 (Glc-2″), 82.61 (Glc-5″), 95.25 (C-8), 103.87 (C-3), 105.19 (C-10), 109.20 (C-6), 117.06 (C-5′), 123.11 (C-1′), 129.46 (C-2′, 6′), 158.71 (C-9, C-3′), 162.04 (C-5), 162.79 (C-4′), 164.95 (C-2), 166.22 (C-7), and 184.06 (C-4). Comparisons of these spectroscopic data with literature values confirmed the identification of the compound as Isovitexin [27,28].
Target II: The compound, presenting as a pale yellow solid powder, was delineated through meticulous spectroscopic analyses. 1H NMR spectroscopy (500 MHz, CD3OD) divulged distinct resonances: δH 4.19 (d, J = 10.0 Hz, Glc-H-1″), 6.42 (s, H-3), 6.53 (s, H-8), 6.89 (d, J = 8.2 Hz, H-5′), 7.40 (dd, J = 8.2, 2.0 Hz, H-6′), and 7.44 (d, J = 2.0 Hz, H-2′). Concurrently, 13C NMR (500 MHz, CD3OD) featured δC values revealing the structural intricacies; notable peaks included: 62.83 (C-6″), 71.75 (C-4″), 72.48 (C-2″), 75.24 (C-1″), 80.01 (C-3″), 82.63 (C-5″), alongside others delineating the aromatic region and distinguishing the core structure. When juxtaposed with established literature, a notable consistency in the spectral data affirmed the compound’s identity as Isoorientin [20,29].
Target III: The compound manifested as a yellow powder was analyzed using high-resolution NMR spectroscopy. 1H NMR (500 MHz, DMSO-d6) revealed signals at δ: 8.01 (2H, d, J = 8.1 Hz, H-2′, 6′), 6.90 (2H, d, J = 8.3 Hz, H-3′, 5′), 6.80 (1H, s, H-3), in addition to resonances corresponding to the protons of 6-C-β-Glu and 8-C-β-Glu moieties at δ 4.78 (1H, d, J = 10.2 Hz, H-1′) and δ 4.81 (1H, d, J = 9.2 Hz, H-1′), respectively, and a multiplet spanning δ 3.22 to 3.87 associated with sugar protons. Further, 13C NMR (125 MHz, DMSO-d6) furnished characteristic carbon resonances for the aromatic ring at δ 164.7 (C-2), 104.2 (C-3), 183.5 (C-4), 158.9 (C-5), 107.8 (C-6), 161.1 (C-7), 106.1 (C-8), 156.5 (C-9), and 104.0 (C-10), coupled with the signals for the substituent groups which are illustrated in the 1H NMR data. Upon rigorous comparison with the existing literature data, the spectral details exhibited a congruence, thereby substantiating the identification of the compound as Apigenin-6,8-di-C-β-d-glucopyranoside [30,31].
2.5. DPPH Scavenging Activity Confimation
As shown in Figure 5B, the three targets exhibited satisfied DPPH scavenging activity, with IC50 values of 35.49 μg/mL, 23.36 μg/mL and 16.02 μg/mL, respectively. For the control, ascorbic acid gave an IC50 of 3.02 μg/mL and rutin afforded an IC50 of 33.03 μg/mL. Although the three targets gave a relatively higher IC50 than ascorbic acid, it was comparable to the known antioxidant rutin. The confirmation of the DPPH scavenging activity of the three targets revealed the effectiveness and applicability of our strategy for antioxidants’ identification and purification.
3. Materials and Methods
3.1. Equipment
The HPLC assessment was carried out utilizing the Agilent 1200 apparatus (Agilent Technologies Co., Ltd., Santa Clara, CA, USA), outfitted with components including a solvent distribution mechanism, a UV-VIS DAD sensor, column temperature controller, an automatic sample loader, and a chemstation. For the HSCCC experiments, we utilized the TBE-300B high-speed counter-current chromatography instrument (Shanghai Tauto Biotech, Shanghai, China). The apparatus featured a trio of preparative coils constructed from polytetrafluoroethylene, each boasting a capacity of 280 mL and an inner diameter measuring 1.6 mm. The setup also incorporated a 20 mL sampling loop for injecting samples. Positioned at various β values from 0.5 to 0.8, from the inner to the outer terminals respectively, the multi-tiered coil had a revolution radius of 5 cm. To manage the revolution speed ranging between 0 and 1000 rpm, a speed modulation device was integrated into the system. Further augmenting the setup were a steady-flow pump and a detection unit functioning at 320 nm, coupled with a N2000 workstation. The experiment utilized a thermal circulation system to maintain a consistent temperature throughout the process. Ultrasonic-assisted extraction research was conducted using a KQ-500E ultrasonic bath, which was procured from Kun Shan Ultrasonic Instruments Co., Ltd. (Jiangsu, China). The HPLC-DPPH analyses were effectuated through an Agilent 1200 mechanism provided by Agilent Technologies, outfitted with a collection of elements including a DAD detector, an automatic sampler, and a solvent distribution unit. The system operates under the guidance of ChemStation software (Version No. Rev. B. 04. 02 SP1) and utilizes a Phenomenex Luna C18 chromatography column (250 mm × 4.6 mm, 5 μm) to accomplish separation procedures. In regard to spectral analyses, a Bruker 400 MHz NMR spectrometer was engaged to facilitate the study.
3.2. Reagents and Plant Material
Every chemical agent used during the extraction and purification processes was of analytical quality, sourced from Jinan Reagent Factory. For the HPLC assessments, we employed chromatographically pure acetonitrile and formic acid, both obtained from CNW (Anpel Laboratory Technologies Inc., Shanghai, China). The investigations consistently employed deionized water at every stage. The DPPH was sourced from Sigma-Aldrich, a subsidiary of the Merck Group based in Germany. U. laetevirens incorporated in the analysis were acquired from a reliable supplier, following which they were subjected to drying and pulverization to a fine powder to streamline subsequent analytical processes.
3.3. HPLC and On-Line HPLC-DPPH Analysis
High-performance liquid chromatography (HPLC), alongside online HPLC-DPPH evaluations, were carried out utilizing a Phenomenex Luna C18 analytical column (250 mm × 4.6 mm, 5 μm). The flowing phase involved a mixture of water infused with 0.1% formic acid (component A) and acetonitrile (component B), following a specific gradient elution schedule detailed below: a time span from 0 to 40 min guided by a 5–95% B gradient, all while sustaining a 1 mL/min flow velocity. We designated a 10 μL quantity for injection, preserving a steady column warmth of 35 °C and establishing the detection wavelength at 320 nm.
For the online HPLC-DPPH analysis, the conditions remained largely consistent with the HPLC parameters described. For the subsequent column alteration process, a methanol-dissolved DPPH solution with a concentration of 50 μg/mL was utilized, maintaining a flow velocity of 0.5 mL/min, while tracking the absorbance at a wavelength of 517 nm.
3.4. Optimization of Ultrasound-Assisted Extraction Conditions
The optimization of ultrasonic-assisted extraction (UAE) parameters for the retrieval of desired compounds was conducted using response surface methodology (RSM). This approach leveraged a Box–Behnken experimental layout, considering three autonomous variables.
In common practice for UAE extraction optimization through RSM, several factors including ultrasonic power, solvent concentration, the liquid-to-solid ratio, and extraction time are taken into consideration. The extraction time poses a particular challenge; although longer durations potentially yield higher extraction rates, identifying the optimal time point—where the majority of targets are extracted and subsequent extraction offers diminishing returns—is non-trivial. This led to the choice of three critical variables for this study: ultrasonic power (X1), ethanol concentration (X2), and liquid-to-solid ratio (X3).
The aggregated concentration of the target elements, denoted by Y (where Y equals the total of Ci, with Ci signifying the percentage of the peak area corresponding to each targeted component), was selected as the response metric. The scheme of experimentation comprised 17 iterations, incorporating 12 factorial coordinates along with 5 core coordinates to enable experiment replication, elucidated in Table 1. In order to mitigate the influences of unpredicted fluctuations stemming from systematic inaccuracies, a randomized order was employed for conducting the experiments.
To analyze the relationships between the independent and dependent variables, a multiple regression analysis employing the least squares method was conducted. This facilitated the fitting of the experimental data to a second-order polynomial equation, the form of which is presented below:
Within this framework, “Y” signifies the projected outcome, while β0 is the model’s intercept. The coefficients β1, β2, β3 pertain to the linear elements, β11, β22, β33 are linked with quadratic elements, and β12, β13, β23 are indicative of the interactive elements concerning the independent variables denoted as X1, X2, and X3 in the evaluation [12].
The effectiveness and suitability of the formulated models were evaluated through comprehensive analysis employing various metrics: the determination coefficient (R2), along with its modified (R2-adj) and forecasted (R2-pred) variants.
The R2 metric, fluctuating in a range from 0 to 1, functions as a tool to measure the precision of the model, demonstrating greater reliability as it nears 1. This figure is derived from the ratio of the regression sum of squares to the complete sum of squares, illustrating the percentage of data fluctuation represented by the model.
Moreover, the elevated figures of both the adjusted and forecasted determinants of coefficient (R2-adj and R2-pred) indicate a commendable alignment of the model with the acquired data set.
To guarantee the selection of the most precise model, a careful choice was pursued, succeeded by an examination employing the ANOVA technique, which evaluated the regression coefficients for statistical relevance using Fisher’s F-test with a 95% confidence interval.
Finally, to visualize the interactive implications of the variables, surface plots were generated based on the selected model, serving to delineate the intricate relationships among the influential factors.
3.5. Ultrasonic-Assisted Extraction
Dried U. laetevirens weighing 1 kg was pulverized into a fine powder and subjected to three UAE extraction processes utilizing 65% ethanol at a power setting of 345 W and a liquid-to-material ratio of 23. Following the extraction, all the filtrates were amalgamated and desiccated under vacuum conditions, yielding 112 g of crude extract, and the final target yield was 61.63%.
3.6. Determining the Two-Phase Solvent System
The suitable biphasic solvent framework was determined in consideration of the partition coefficient (K) pertaining to the distinct components targeted in the specimen. To ascertain the K metric, a standardized HPLC technique was utilized: a sufficient amount of raw sample dust was diluted in a beforehand balanced biphasic solvent environment, followed by its transfer to a segregation flask. Following a robust agitation ensuring a full balance of the biphasic specimen, a 2 mL portion from every phase was dried to remove all moisture. Afterwards, the remnants were reconstituted in 1 mL of methanol for subsequent HPLC scrutiny [32]. The K metric was defined as the proportion of the peak area associated with the target compound in stationary phase to that in mobile phase [22].
3.7. Preparation of Biphasic Solvent System and Sample Solution
The biphasic solvent system utilized in this experiment was formulated using a mixture of ethyl acetate/n-butanol/water, following a volumetric ratio of 2:3:5, respectively. This mixture was transferred into a separating funnel where it was allowed to reach a state of equilibrium at ambient temperature. Subsequent to this, the upper and lower phases were distinctly isolated. To remove any dissolved gases, both phases underwent a degassing process in an ultrasonic bath for a duration of 30 min, executed shortly before initiating the experiment.
To ready the test liquid for HSCCC separation, 100 mg of the crude extract in its desiccated powdered state was utilized. It was then evenly dispersed in 10 mL of a solvent blend constituted of equal portions (5 mL each) of the upper and lower layers derived from the dual-phase solvent framework.
3.8. High-Speed Counter-Current Chromatography (HSCCC) Isolation Process
Prior to the addition of the stationary phase into the chromatographic column for distinct trials, the column underwent a thorough cleaning process utilizing methanol to rid it of any residual substances. In each separation venture, the multi-tiered column was initially charged to its full capacity with the upper phase, which served as the stationary phase. Subsequently, the lower phase, functioning as the mobile phase, was fed into the column at a flow rate of 1.5 mL/min while simultaneously rotating the device at a rate of 900 revolutions per minute.
As soon as the solvent front became visible and the system reached a hydrodynamic balance in a steady condition, the corresponding sample solutions were channeled into the separation column through the sample inlet, drawn from the sample loop. Data acquisition was initiated promptly following this injection procedure. Fraction collection was undertaken manually, guided by the readings on the chromatogram, followed by evaporation under diminished pressure conditions. The residues were then reconstituted in methanol, setting the stage for purity evaluations through UPLC analysis.
3.9. Determination of Target Constituents
The 1H NMR spectroscopic data were collected using a Bruker 600 MHz NMR spectrometry device with tetramethylsilane functioning as the intrinsic reference benchmark, all undertaken in a CDCl3 solvent setting.
3.10. DPPH Scavenging Activity Evaluation
Appropriate amounts of the three targets were prepared as sample solutions over a range of (0, 10, 20, 40, 80, 160 μg/mL). DPPH was prepared with ethanol to 25 μg/mL concentration. The 96-well plate was added with a ratio of 3:7 sample solution and DPPH solution and incubated for 30 min in the dark, followed by the determination of the absorbance at 517 nm on a microplate reader. As a positive standard control, ascorbic acid and rutin were employed. The rate of DPPH radical scavenging was estimated as follows:
where A and A0 were the experimental and blank groups’ absorbance, respectively.
DPPH scavenging rate (%) = [1 − (A/A0)] × 100%
4. Conclusions
In this study, the online HPLC-DPPH system was successfully utilized for the screening of antioxidants in U. laetevirens extracts. Through this system, three target compounds exhibiting significant antioxidant activity were identified. The utilization of ultrasonic-assisted extraction techniques along with HSCCC chromatography facilitated the isolation and purification of these target antioxidants.
Our research demonstrates that HSCCC combined with DPPH-HPLC is a powerful strategy for antioxidant active molecules’ screening and separation. This work not only provides robust evidence of the antioxidant properties of U. laetevirens extracts but also lays a foundational platform for the further development and utilization of these active compounds in the future. This endeavor opens a promising pathway in the exploration of natural antioxidants, presenting an opportunity to bolster the utilization of U. laetevirens extracts in pharmaceutical and nutraceutical applications.
Supplementary Materials
The following supporting information can be downloaded at: https://www.mdpi.com/article/10.3390/molecules28217332/s1, Figures S1–S6: the 1H and 13C NMR spectra of the three targets.
Author Contributions
Conceptualization, D.Z. and H.W.; methodology, A.L.; software, M.L.; validation, A.L., M.L. and J.Z.; formal analysis, Y.W. (Yao Wang); investigation, R.M.; resources, F.H.; data curation, Y.W. (Yuhan Wang) and T.Y.; writing—original draft preparation, A.L.; writing—review and editing, M.L.; visualization, H.W.; supervision, D.Z.; project administration, D.Z.; funding acquisition, D.Z. All authors have read and agreed to the published version of the manuscript.
Funding
This work was financially supported by the National Natural Science Foundation of China (32260129, 82304892) and General Program of Natural Science Foundation of Qinghai Province (2021-ZJ-976Q).
Institutional Review Board Statement
Not applicable.
Informed Consent Statement
Not applicable.
Data Availability Statement
The data presented in this study are available on request from the corresponding author.
Conflicts of Interest
The authors declare no conflict of interest.
Sample Availability
The samples are available from the authors.
References
- Gülçin, İ.; Küfrevioǧlu, Ö.İ.; Oktay, M.; Büyükokuroǧlu, M.E. Antioxidant, antimicrobial, antiulcer and analgesic activities of nettle (Urtica dioica L.). J. Ethnopharmacol. 2004, 90, 205–215. [Google Scholar] [CrossRef] [PubMed]
- Maietti, A.; Tedeschi, P.; Catani, M.; Stevanin, C.; Pasti, L.; Cavazzini, A.; Marchetti, N. Nutrient Composition and Antioxidant Performances of Bread-Making Products Enriched with Stinging Nettle (Urtica dioica) Leaves. Foods 2021, 10, 938. [Google Scholar] [CrossRef] [PubMed]
- Bhusal, K.K.; Magar, S.K.; Thapa, R.; Lamsal, A.; Bhandari, S.; Maharjan, R.; Shrestha, S.; Shrestha, J. Nutritional and pharmacological importance of stinging nettle (Urtica dioica L.): A review. Heliyon 2022, 8, e09717. [Google Scholar] [CrossRef] [PubMed]
- Dhouibi, R.; Affes, H.; Ben Salem, M.; Hammami, S.; Sahnoun, Z.; Zeghal, K.M.; Ksouda, K. Screening of pharmacological uses of Urtica dioica and others benefits. Prog. Biophys. Mol. Biol. 2020, 150, 67–77. [Google Scholar] [CrossRef] [PubMed]
- Valko, M.; Leibfritz, D.; Moncol, J.; Cronin, M.T.D.; Mazur, M.; Telser, J. Free radicals and antioxidants in normal physiological functions and human disease. Int. J. Biochem. Cell Biol. 2007, 39, 44–84. [Google Scholar] [CrossRef] [PubMed]
- Upton, R. Stinging nettles leaf (Urtica dioica L.): Extraordinary vegetable medicine. J. Herb. Med. 2013, 3, 9–38. [Google Scholar]
- Chrubasik, J.E.; Roufogalis, B.D.; Wagner, H.; Chrubasik, S.A. A comprehensive review on nettle effect and efficacy profiles, Part I: Herba urticae. Phytomedicine 2007, 14, 423–435. [Google Scholar] [CrossRef]
- Zhang, M.; Cheng, S.; Liang, Y.; Mu, Y.; Yan, H.; Liu, Q.; Geng, Y.; Wang, X.; Zhao, H. Rapid purification of antioxidants from Magnolia officinalis by semi-prep-HPLC with a two-step separation strategy guided by on-line HPLC-radical scavenging detection. J. Chromatogr. B 2018, 1100–1101, 140–147. [Google Scholar] [CrossRef]
- Bandonienė, D.; Murkovic, M. On-line HPLC-DPPH screening method for evaluation of radical scavenging phenols extracted from apples (Malus domestica L.). J. Agric. Food Chem. 2002, 50, 2482–2487. [Google Scholar] [CrossRef]
- Geng, D.; Chi, X.; Dong, Q.; Hu, F. Antioxidants screening in Limonium aureum by optimized on-line HPLC–DPPH assay. Ind. Crops Prod. 2015, 67, 492–497. [Google Scholar] [CrossRef]
- Liu, Z.; Dang, J.; Wang, Q.; Yu, M.; Jiang, L.; Mei, L.; Shao, Y.; Tao, Y. Optimization of polysaccharides from Lycium ruthenicum fruit using RSM and its anti-oxidant activity. Int. J. Biol. Macromol. 2013, 61, 127–134. [Google Scholar] [CrossRef] [PubMed]
- Li, J.; Wang, Q.; Wang, Y.; La, M.; Mian, R.; He, L.; Suonan, J.; Zou, D. An efficient strategy for large-scale preparation of low polarity gingerols directly from ginger crude extract by high-speed countercurrent chromatography with different rotation mode. J. Sep. Sci. 2023, 46, 2300320. [Google Scholar] [CrossRef] [PubMed]
- Xie, J.-H.; Shen, M.-Y.; Xie, M.-Y.; Nie, S.-P.; Chen, Y.; Li, C.; Huang, D.-F.; Wang, Y.-X. Ultrasonic-assisted extraction, antimicrobial and antioxidant activities of Cyclocarya paliurus (Batal.) Iljinskaja polysaccharides. Carbohydr. Polym. 2012, 89, 177–184. [Google Scholar] [CrossRef]
- Lai, J.; Xin, C.; Zhao, Y.; Feng, B.; He, C.; Dong, Y.; Fang, Y.; Wei, S. Optimization of Ultrasonic Assisted Extraction of Antioxidants from Black Soybean (Glycine max var) Sprouts Using Response Surface Methodology. Molecules 2013, 18, 1101–1110. [Google Scholar] [CrossRef]
- Gunalan, S.; Thangaiah, A.; Rathnasamy, V.K.; Janaki, J.G.; Thiyagarajan, A.; Kuppusamy, S.; Arunachalam, L. Microwave-assisted extraction of biomolecules from moringa (Moringa oleifera Lam.) leaves var. PKM 1: A optimization study by response surface methodology (RSM). Kuwait J. Sci. 2023, 50, 339–344. [Google Scholar] [CrossRef]
- El Baakili, A.; Fadil, M.; Es-Safi, N.E. Ultrasonic-assisted extraction for phenolic compounds and antioxidant activity of Moroccan Retama sphaerocarpa L. leaves: Simultaneous optimization by response surface methodology and characterization by HPLC/ESI-MS analysis. Heliyon 2023, 9, e17168. [Google Scholar] [CrossRef]
- Wu, X.; Li, R.; Zhao, Y.; Liu, Y. Separation of polysaccharides from Spirulina platensis by HSCCC with ethanol-ammonium sulfate ATPS and their antioxidant activities. Carbohydr. Polym. 2017, 173, 465–472. [Google Scholar] [CrossRef]
- Marques, A.M.; Fingolo, C.E.; Kaplan, M.A.C. HSCCC separation and enantiomeric distribution of key volatile constituents of Piper claussenianum (Miq.) C. DC. (Piperaceae). Food Chem. Toxicol. 2017, 109, 1111–1117. [Google Scholar] [CrossRef]
- Gao, Q.; Ma, R.; Chen, L.; Shi, S.; Cai, P.; Zhang, S.; Xiang, H. Antioxidant profiling of vine tea (Ampelopsis grossedentata): Off-line coupling heart-cutting HSCCC with HPLC–DAD–QTOF-MS/MS. Food Chem. 2017, 225, 55–61. [Google Scholar] [CrossRef]
- Dawa, Y.; Du, Y.; Wang, Q.; Chen, C.; Zou, D.; Qi, D.; Ma, J.; Dang, J. Targeted isolation of 1,1-diphenyl-2-picrylhydrazyl inhibitors from Saxifraga atrata using medium- and high-pressure liquid chromatography combined with online high performance liquid chromatography–1,1-diphenyl-2-picrylhydrazyl detection. J. Chromatogr. A 2021, 1635, 461690. [Google Scholar] [CrossRef]
- Yan, R.; Cao, Y.; Yang, B. HPLC-DPPH Screening Method for Evaluation of Antioxidant Compounds Extracted from Semen Oroxyli. Molecules 2014, 19, 4409–4417. [Google Scholar] [CrossRef] [PubMed]
- Dai, X.; Huang, Q.; Zhou, B.; Gong, Z.; Liu, Z.; Shi, S. Preparative isolation and purification of seven main antioxidants from Eucommia ulmoides Oliv. (Du-zhong) leaves using HSCCC guided by DPPH-HPLC experiment. Food Chem. 2013, 139, 563–570. [Google Scholar] [CrossRef] [PubMed]
- Zou, D.-L.; Chen, T.; Li, H.-M.; Chen, C.; Zhao, J.-Y.; Li, Y.-L. Separation of three phenolic high-molecular-weight compounds from the crude extract of Terminalia Chebula Retz. by ultrasound-assisted extraction and high-speed counter-current chromatography. J. Sep. Sci. 2016, 39, 1278–1285. [Google Scholar] [CrossRef]
- Yi, T.; Zhu, L.; Zhu, G.-Y.; Tang, Y.-N.; Xu, J.; Fan, J.-Y.; Zhao, Z.-Z.; Chen, H.-B. HSCCC-based strategy for preparative separation of in vivo metabolites after administration of an herbal medicine: Saussurea laniceps, a case study. Sci. Rep. 2016, 6, 33036. [Google Scholar] [CrossRef]
- Li, Y.; Li, L.; Cui, Y.; Zhang, S.; Sun, B. Separation and purification of polyphenols from red wine extracts using high speed counter current chromatography. J. Chromatogr. B 2017, 1054, 105–113. [Google Scholar] [CrossRef]
- Liu, Y.; Kuang, P.; Guo, S.; Sun, Q.; Xue, T.; Li, H. An overview of recent progress in solvent systems, additives and modifiers of counter current chromatography. New J. Chem. 2018, 42, 6584–6600. [Google Scholar] [CrossRef]
- Abdallah, H.M.; Esmat, A. Antioxidant and anti-inflammatory activities of the major phenolics from Zygophyllum simplex L. J. Ethnopharmacol. 2017, 205, 51–56. [Google Scholar] [CrossRef]
- Wei, Y.; Xie, Q.; Fisher, D.; Sutherland, I.A. Separation of patuletin-3-O-glucoside, astragalin, quercetin, kaempferol and isorhamnetin from Flaveria bidentis (L.) Kuntze by elution-pump-out high-performance counter-current chromatography. J. Chromatogr. A 2011, 1218, 6206–6211. [Google Scholar] [CrossRef]
- Peng, J.; Fan, G.; Hong, Z.; Chai, Y.; Wu, Y. Preparative separation of isovitexin and isoorientin from Patrinia villosa Juss by high-speed counter-current chromatography. J. Chromatogr. A 2005, 1074, 111–115. [Google Scholar] [CrossRef]
- Disadee, W.; Mahidol, C.; Sahakitpichan, P.; Sitthimonchai, S.; Ruchirawat, S.; Kanchanapoom, T. Unprecedented furan-2-carbonyl C-glycosides and phenolic diglycosides from Scleropyrum pentandrum. Phytochemistry 2012, 74, 115–122. [Google Scholar] [CrossRef]
- Chen, Y.; Yan, X.; Lu, F.; Jiang, X.; Friesen, J.B.; Pauli, G.F.; Chen, S.-N.; Li, D.-P. Preparation of flavone di-C-glycoside isomers from Jian-Gu injection (Premna fulva Craib.) using recycling counter-current chromatography. J. Chromatogr. A 2019, 1599, 180–186. [Google Scholar] [CrossRef] [PubMed]
- Zhao, J.; Mou, Y.; Shan, T.; Li, Y.; Lu, S.; Zhou, L. Preparative separation of helvolic acid from the endophytic fungus Pichia guilliermondii Ppf9 by high-speed counter-current chromatography. World J. Microbiol. Biotechnol. 2012, 28, 835–840. [Google Scholar] [CrossRef] [PubMed]
Disclaimer/Publisher’s Note: The statements, opinions and data contained in all publications are solely those of the individual author(s) and contributor(s) and not of MDPI and/or the editor(s). MDPI and/or the editor(s) disclaim responsibility for any injury to people or property resulting from any ideas, methods, instructions or products referred to in the content. |
© 2023 by the authors. Licensee MDPI, Basel, Switzerland. This article is an open access article distributed under the terms and conditions of the Creative Commons Attribution (CC BY) license (https://creativecommons.org/licenses/by/4.0/).

