Abstract
Potato peel waste (PPW) was utilized as a bio-template for the production of valuable compounds such as reducing sugars (RS), total sugar (TS) and total phenolic compounds (TPC). Two methods of alkali treatments, i.e., chemical (NaOH) and thermochemical (NaOH assisted with autoclaving) processes, were employed for the deconstruction of PPW. Response surface methodology (RSM) was used to study the effects of alkali concentration (0.6–1.0 w/v), substrate concentration (5–15 g) and time (4–8 h) on the extraction of RS, TS and TP from PPW. The application of alkali plus steam treatment in Box-Behnken design (BBD) with three levels yielded the optimum releases of RS, TS and TP as 7.163, 28.971 and 4.064 mg/mL, respectively, corresponding to 10% substrate loading, in 0.6% NaOH for 8 h. However, the alkali treatment reported optimum extractions of RS, TS and TP as 4.061, 17.432 and 2.993 mg/mL, respectively. The thermochemical pretreatment was proven a beneficial process as it led to higher productions of TP. FTIR and SEM were used to analyze the deterioration levels of the substrate. The present work was used to explore the sustainable management of PPW, which is a highly neglected substrate bioresource but is excessively dumped in open environment, raising environmental concerns. The cost-effective methods for the breakdown of PPW starch into fermentable sugars might be utilized to extract valuable compounds.
1. Introduction
Due to severe environmental concerns related to the dumping of food wastes, such as microbial spoilage and the emission of harmful gases, such practices are being strongly discouraged. The exploitation of food wastes for alternative and sustainable applications are being investigated. PPW can be transformed into various valuable products such as biofuel, biogas, bio-fertilizers, bio-absorbents, reducing sugar, enzymes and antioxidants [1,2,3]. About one-third of the total food produced for human consumption is estimated to be wasted [4], and these losses were estimated to cost 1 trillion USD [5]. Potato (Solanum tuberosum) is a major vegetable crop with annual production of 370 million tons [6]. A major part of potato production is as a fresh product, whereas the remaining part is used to meet the demands of fast food consumption such as frozen fries, crisps, starch and dried potatoes. During potato processing, 15 to 40% of the initial weight is descaled and is termed as PPW [7,8].
PPW is the major neglected by-product in the potato-processing industry, whilst it represents a potential source of valuable compounds. Among them, polyphenols are important precursors for natural antioxidants and offer tremendous application potential owing to their antioxidant and antimicrobial properties. Approximately 50% of these molecules are present in the peel and adjacent sections [9,10]. Synthetic antioxidants are extensively used in food and pharmaceutical applications and have been reported to induce various chronic diseases. Natural antioxidants are highly appealing to various industrial sectors and offer protective applications such as the prevention of oxidative damage and cardiovascular diseases [11]. PPW has an important nutritious profile, containing starch, dietary fibre and protein. The most abundant nutrients in PPW are carbohydrates, accounting for up to 88 g/100 g dry weight. The amount of starch accounts for up to 52% of total carbohydrate content. PPW also has a considerable amount of dietary fibre, which can regulate intestinal health by lowering the cholesterol effect [8,12,13,14,15]. Vázquez et al. [16] have recently documented the promising potential of utilizing waste materials, specifically Garnacha Tintorera bagasse and potato residues, as sustainable substrates for the co-production of valuable bioproducts, such as bacterial cellulose and gluconic acid.
Unprecedented rapid urbanization and continuously increasing standards of living in modern society lead to the production of huge quantities of solid food wastes. Consequently, additional management practices for the management of this waste exerts strong pressure on the economy and society [17,18]. There are different waste management practices for the disposal of food waste, but they have many problems such as the production of toxic compounds, high costs and environmental pollution [19]. The familiar waste disposal methods are landfills, incineration, composting and thermochemical processes [19,20]. The most common method of waste disposal is landfill, which produces greenhouse gases and toxic heavy metal compounds that contaminate land and ground water. This approach also requires large land area and a long time for disposal [21,22,23,24].
Incineration is a relatively rapid method for waste management and requires small land area but leads to the production of combustion residuals including bottom and fly ash. The elements contained in ash cannot be degraded and are eventually enriched in living organisms [25,26]. Composting is an effective method of degrading wastes into products that can be used safely as biofertilizers and soil improvements [27,28,29]. However, various challenges are also associated with this practice, including the release of CO2, the depletion of O2, climate change and offensive smells [30]. Biotechnological upgradation appears promising for the concomitant provision of low-cost substrates and safe solid food waste management. The application of PPW for microbial mediated saccharification and the provision of other useful products is representative of such efforts.
Fermentable sugars can be obtained from PPW which can boost biofuel production. PPW is a rich source of primary metabolites, which principally include carbohydrates, which are prone to undergo fermentation to produce ethanol, lactic and acetic acid [31]. The breakdown of complex starch polymers into small monomeric sugars makes it more accessible to improve the production of biofuel. PPW conversion into biofuel and biogas offers excellent alternatives to fossil fuels. There are many previous research reports which have confirmed the conversion of PPW to biofuels [32,33,34,35].
A few new methods such as ultrasonic and microwave assisted extractions [36,37], pressurized liquid-based removal [38] and acidified solvents-based extraction [39] have been documented to isolate the valuable compounds from PPW. These are, however, highly complex and expensive methods; therefore, the need for simple, low cost and time saving methods cannot be over-emphasized. Alkali hydrolysis offers a number of advantages such as a simple pretreatment for substrate, easily available and cost-effective NaOH and low reaction temperature. Little information is available about the kinetics and efficiency of the alkali hydrolysis of PPW into sugars. In the present work, the efficacy of alkali and alkali-assisted autoclaving was clearly observed.
Alkali and alkali-assisted steam treatment to extract useful compounds from different plant biowastes are methods of choice in select situations to obtain value added products [40,41,42,43]. The treated substrates are compared with their respective controls by SEM to assess the level of polymeric destruction [44,45,46].
The present study aimed to optimize the alkali treatment of PPW for yielding RS, TS and TPC using a Box–Behnken design with three levels. The model developed in this study is cost-effective for the bioconversion of PPW into value added products such as fermentable sugars and phenolic compounds. As regards the optimum concentrations of fermentable sugars for bioethanol fermentation, they can easily be adjusted either by the evaporation of the treated fluid or by its dilution to correspond to the requirements of ethanologenic microbe(s). Evaporation is economically affordable in country such as Pakistan, where solar insolation is available throughout the year. However, other means to improve the saccharification efficiencies of the procedures reported here, such as varying steam pressures, might be employed to increase the yields. Soni et al. [47] have explored various conditions by using different alkali and acid concentrations to treat PPW and assessing their potential to produce bioethanol. They reported 368.53 mg/g of RS after 72 h using alkali-treated PPW, and after enzymatic hydrolysis ethanol concentration was recorded as 19.9g/L. Another research reported 88.2 g/L RS after enzymatic hydrolysis with 20% PPW. The maximum ethanol concentration of 23.3 g/L was produced under optimum conditions [48]. This effort is promising for the provision of cheaper substrates for various biotechnological processes such as the production of second-generation bioethanol. Accessory benefits include urban food waste management and the utilization of single-cell enriched fermentation residues as animal feed supplement.
2. Results and Discussion
The pretreatment of the substrates rich in carbohydrates is performed to breakdown the highly branched polymers and yield the maximum sugars. The present work was designed, as described below, to release maximum RS, TS and TP.
2.1. RSM Optimization and Validation
In this study RSM was used to optimize the pretreatment conditions using PPW as cheap biowaste. BBD was conducted using substrate concentration, NaOH concentration and time as independent variables. The alkali and alkali-plus-steam treatment of PPW was carried out with three variable factors as presented in Table 1. The experimental runs were performed according to the BBD, and all experiments were run in triplicates. The observed and predicted values of RS, TS and TP after alkali and alkali-assisted autoclave treatment are shown in Table 2 and Table 3. Multiple regression analysis was applied, and second-order polynomial regression equations (Equations (1)–(6) revealed the influence of three variable factors (X1, X2 and X3) on the extraction yield of useful compounds from PPW.

Table 1.
Codes and levels of the parameters used for BBD.

Table 2.
Results of BBD on yields of RS, TS and TP (mg/mL) after alkali treatment of PPW.

Table 3.
Results of BBD on yields of RS, TS and TP (mg/mL) after alkali-plus-steam-treated PPW.
In the case of alkali hydrolysis, the maximum extraction of RS, TS and TP was measured as 4.061, 17.432 and 2.993 mg/mL, respectively, corresponding to 10 g of PPW, 0.8% of alkali concentration and 8 h (Table 2). In the case of alkali-plus-steam hydrolysis, maximum extraction of RS, TS and TPs was measured as 7.163, 28.971 and 4.064 mg/mL, respectively. The experimental conditions for optimum yield were observed at run No. 9, 7 and 14 (Table 3). The thermochemical treatment proved more effective in the monomerization of polymeric sugars of PPW. Several studies have indicated higher yields of useful compounds from the alkali and alkali-plus-steam treatment of PPW [47,49,50,51,52].
2.1.1. Significance by ANOVA
The linear and the quadratic effects of the variables studied and their interaction on the response yield was observed using analyses of variance (ANOVA). The significance was revealed by Fisher’s F-test and the probability value. In the case of alkali hydrolysis, F-test values of 31.64, 16.33 and 10.79 and p-values of 0.002, 0.010 and 0.022 were observed for RS, TS and TP, respectively. The results revealed that the concentration of the substrate and time were the most significant parameters during the pretreatment process. For RS production, X1, X3, X12 and X32 were found to be significant as their p-values were calculated as 0.006, 0.014,0.013 and 0.002, respectively, while for TS production, X12 and X32 were significant as their p-values were calculated as 0.056 and 0.010, respectively. In the case of TPC, the factors X2, X32 and X1 × X3 were found to be the most significant variables as their p-values were noted as 0.032, 0.031 and 0.022, respectively (Table 4).

Table 4.
ANOVA of RS, TS and TP after alkali treatment.
The regression equations for chemical treatment are as follows:
Y (RS mg/mL) = 5.4990 − 0.4874X1 − 6.526X2 + 1.1359X3 + 0.0125X12 + 4.6760X22 − 0.1172X32 + 0.0765X1X2 + 0.0132X1X3 − 0.0593X2X3
Y (TS mg/mL) = 0.678 − 3.485X1 + 119.314X2 − 9.209X3 + 0.122X12 − 59.602X22 − 1.244X32 + 0.759X1X2 − 0.011X1X3 − 5.421X2X3
Y (TP mg/mL) = −2.9351 + 0.0734X1 + 12.326X2 − 0.3487X3 + 0.0090X12 − 4.8771X22 − 0.0770X32 − 0.0968X1X2 − 0.0326X1X3 − 0.4325X2X3
In the case of alkali-plus-steam hydrolysis, F-test values of 17.99, 42.1461 and 24.08 and probability values of 0.008, 0.030 and 0.004 were observed for RS, TS and TP, respectively. The interactive effect of X2 × X3 and X1 × X3 on the response yield was found to be very significant. The results revealed that the concentration of PPW and time (h) were the most significant parameters during the pretreatment process. For RS yield, X2 and X2 × X3 were found to be significant factors as their p-values were recorded as 0.034 and 0.008, respectively, while X1 × X3 (0.030) was significant for the production of TS. In the case of TPC, the factors X32 and X2 × X3 were found to be the most significant variables as their p-values were measured as 0.010 and 0.004, respectively (Table 5).

Table 5.
ANOVA of RS, TS and TP after alkali plus steam treatment.
The regression equations for thermochemical treatment are as follows:
Y (RS mg/mL) = 28.8530 − 0.1261X1 − 43.260X2 − 2.019X3 − 0.0039X12 − 13.4156X22 − 0.0972X32 + 0.2490X1X2 + 0.0197X1X3 + 3.4856X2X3
Y (TS mg/mL) = 13.540 + 0.1115X1 − 44.222X2 + 7.4944X3 + 0.0598X12+ 26.4677X22 − 0.0299X32 + 0.3935X1X2− 0.3246X1X3 − 2.8856X2X3
Y (TP mg/mL) = 0.8233 + 0.0777X1 − 1.3983X2 + 0.6086X3 − 0.00384X12 − 07.3541X22 − 0.1671X32 + 0.1747X1X2 − 0.00150X1X3 + 1.9293X2X3
The model’s goodness of fit was determined by the coefficient of determination (R2 value).The R2 values in the case of alkali hydrolysis were measured as 97.52%, 90.76% and 93.61% for RS, TS and TP, respectively, while in the case of alkali-assisted autoclave treatment these values were measured as 87.14%, 93.25% and 94.45% for RS, TS and TP, respectively. The adjusted R2 values were measured as 74.12%, 93.05% and 82.11% for chemical treatment, while for thermochemical treatment the same values were measured as 64.00%, 81.11% and 84.46% for RS, TS and TPC, respectively, explaining the credibility of the model. Furthermore, the predicted R2 values were measured as 0.71, 0.79 and 0.80 for chemical treatment, while for thermochemical treatment same values were measured as 0.68, 0.76 and 0.75 for RS, TS and TPC, respectively, explaining the credibility of the model.
2.1.2. Contour Plots
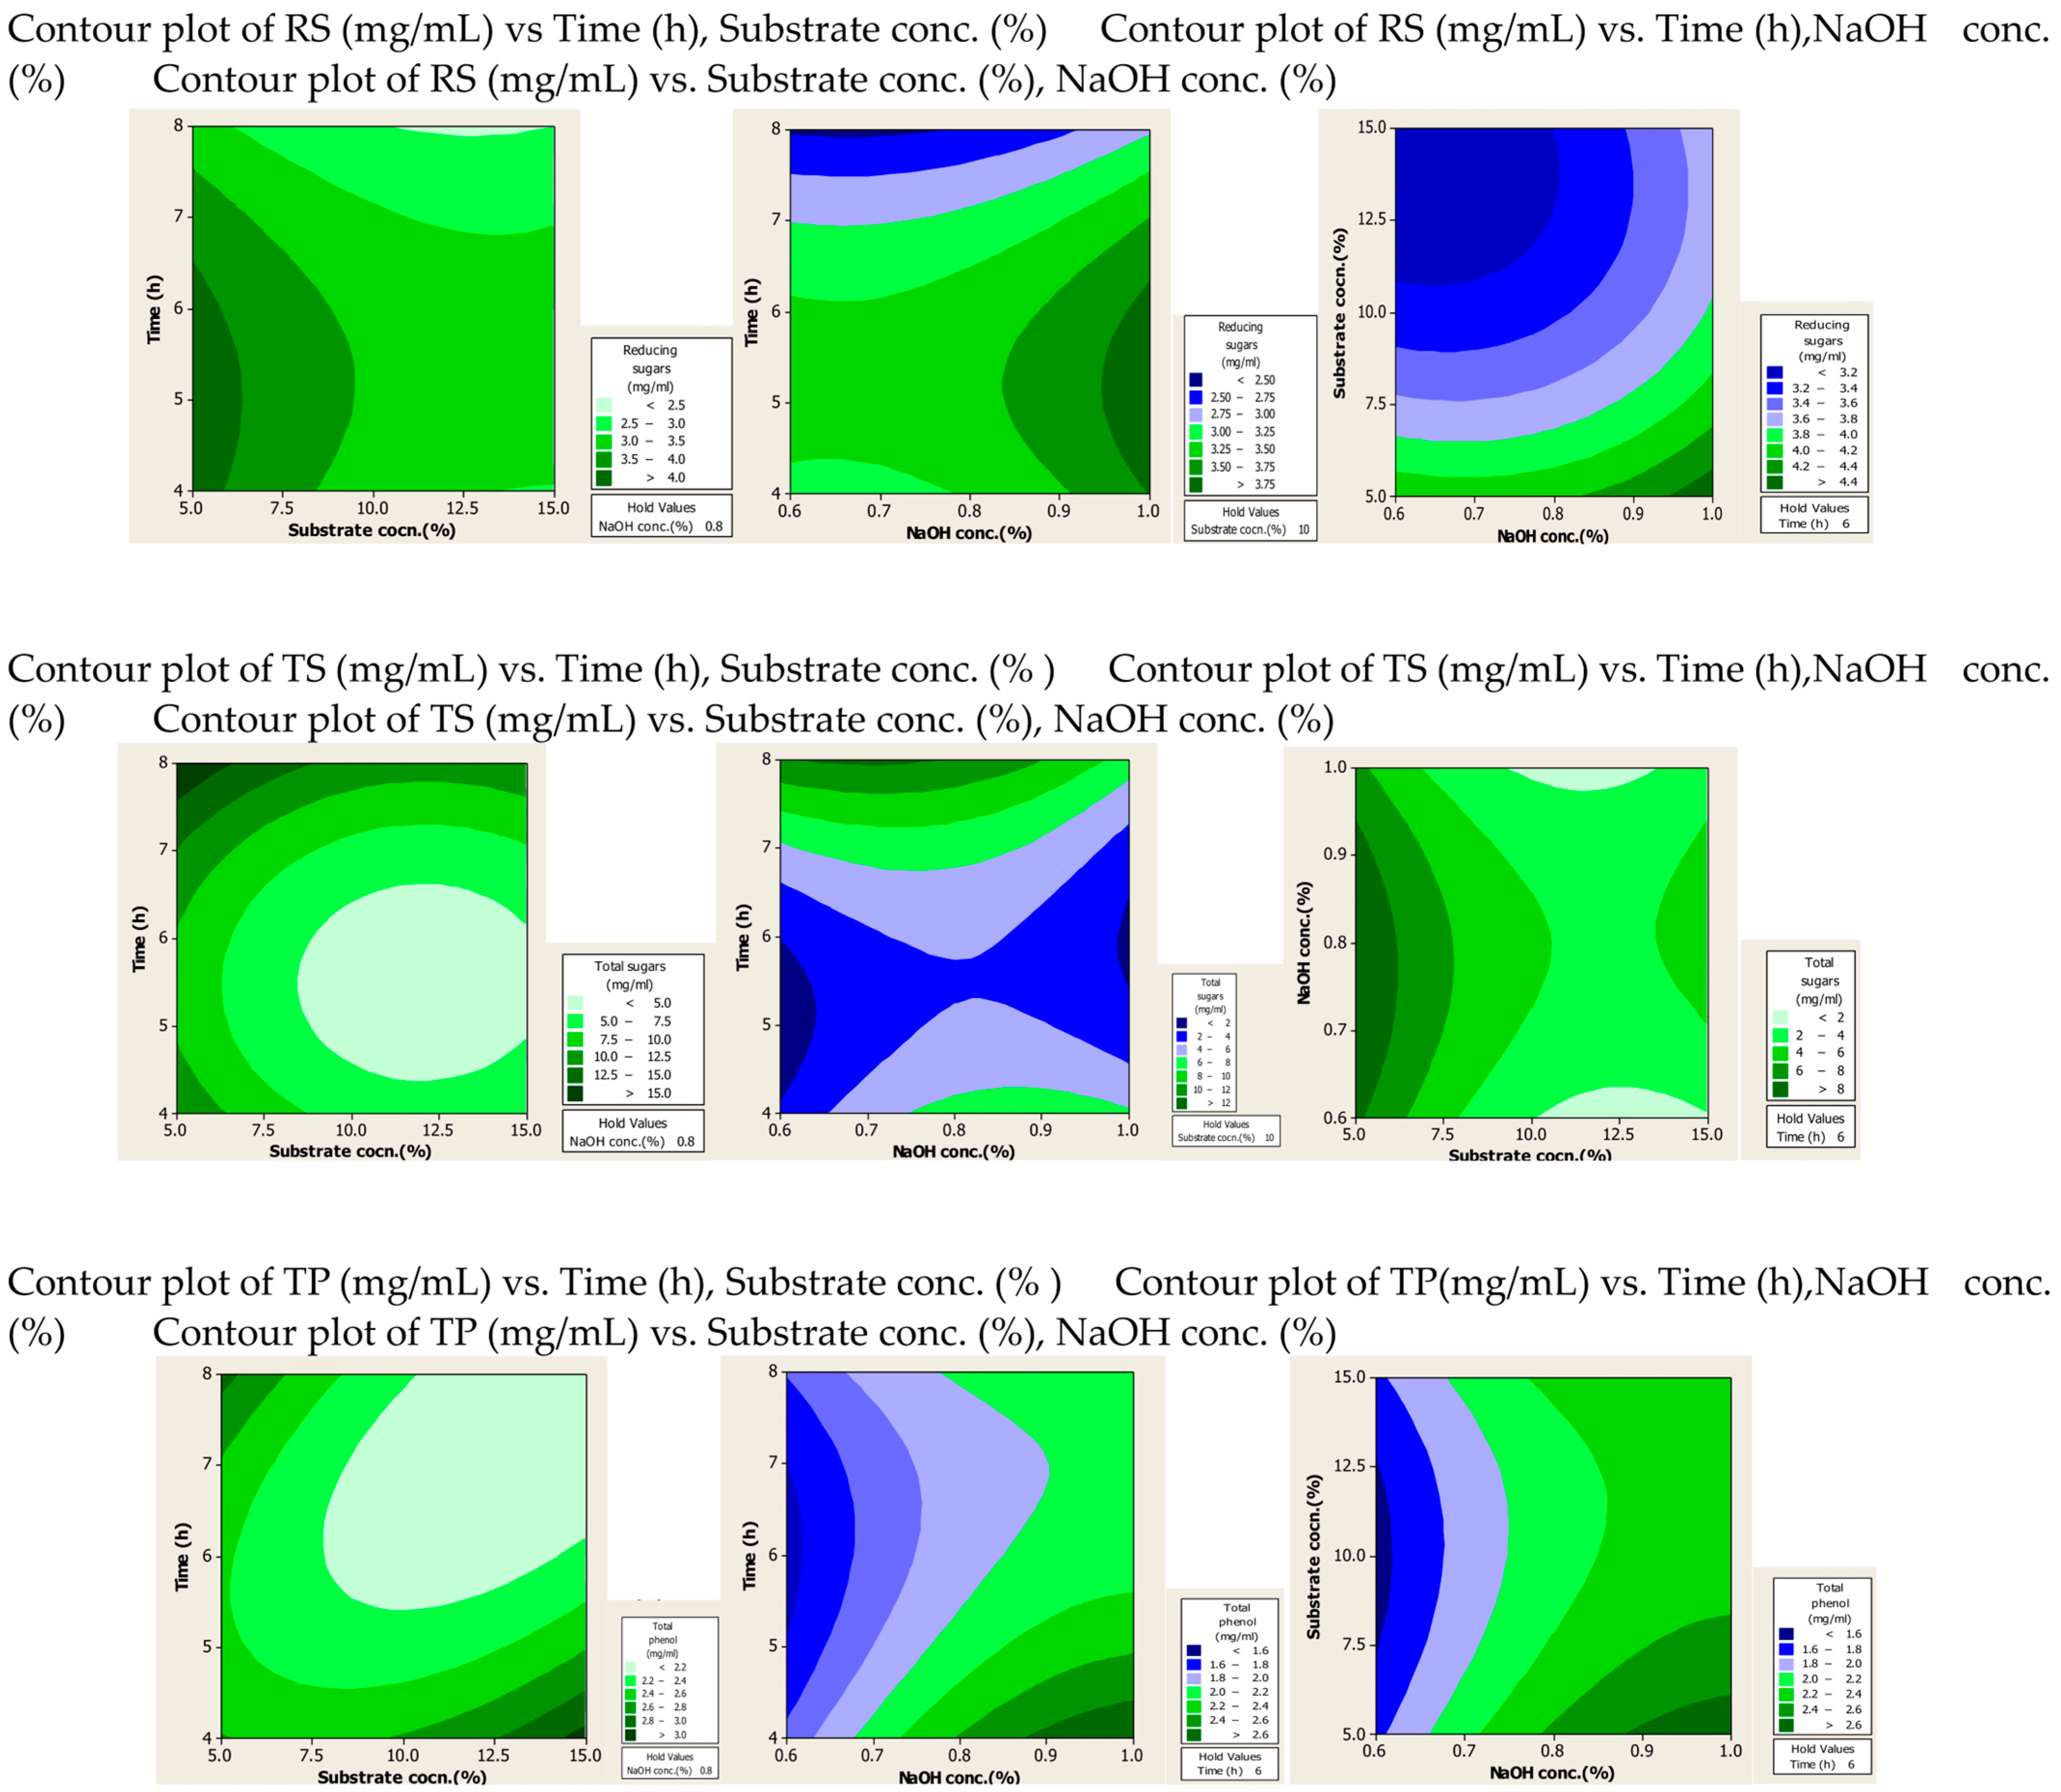
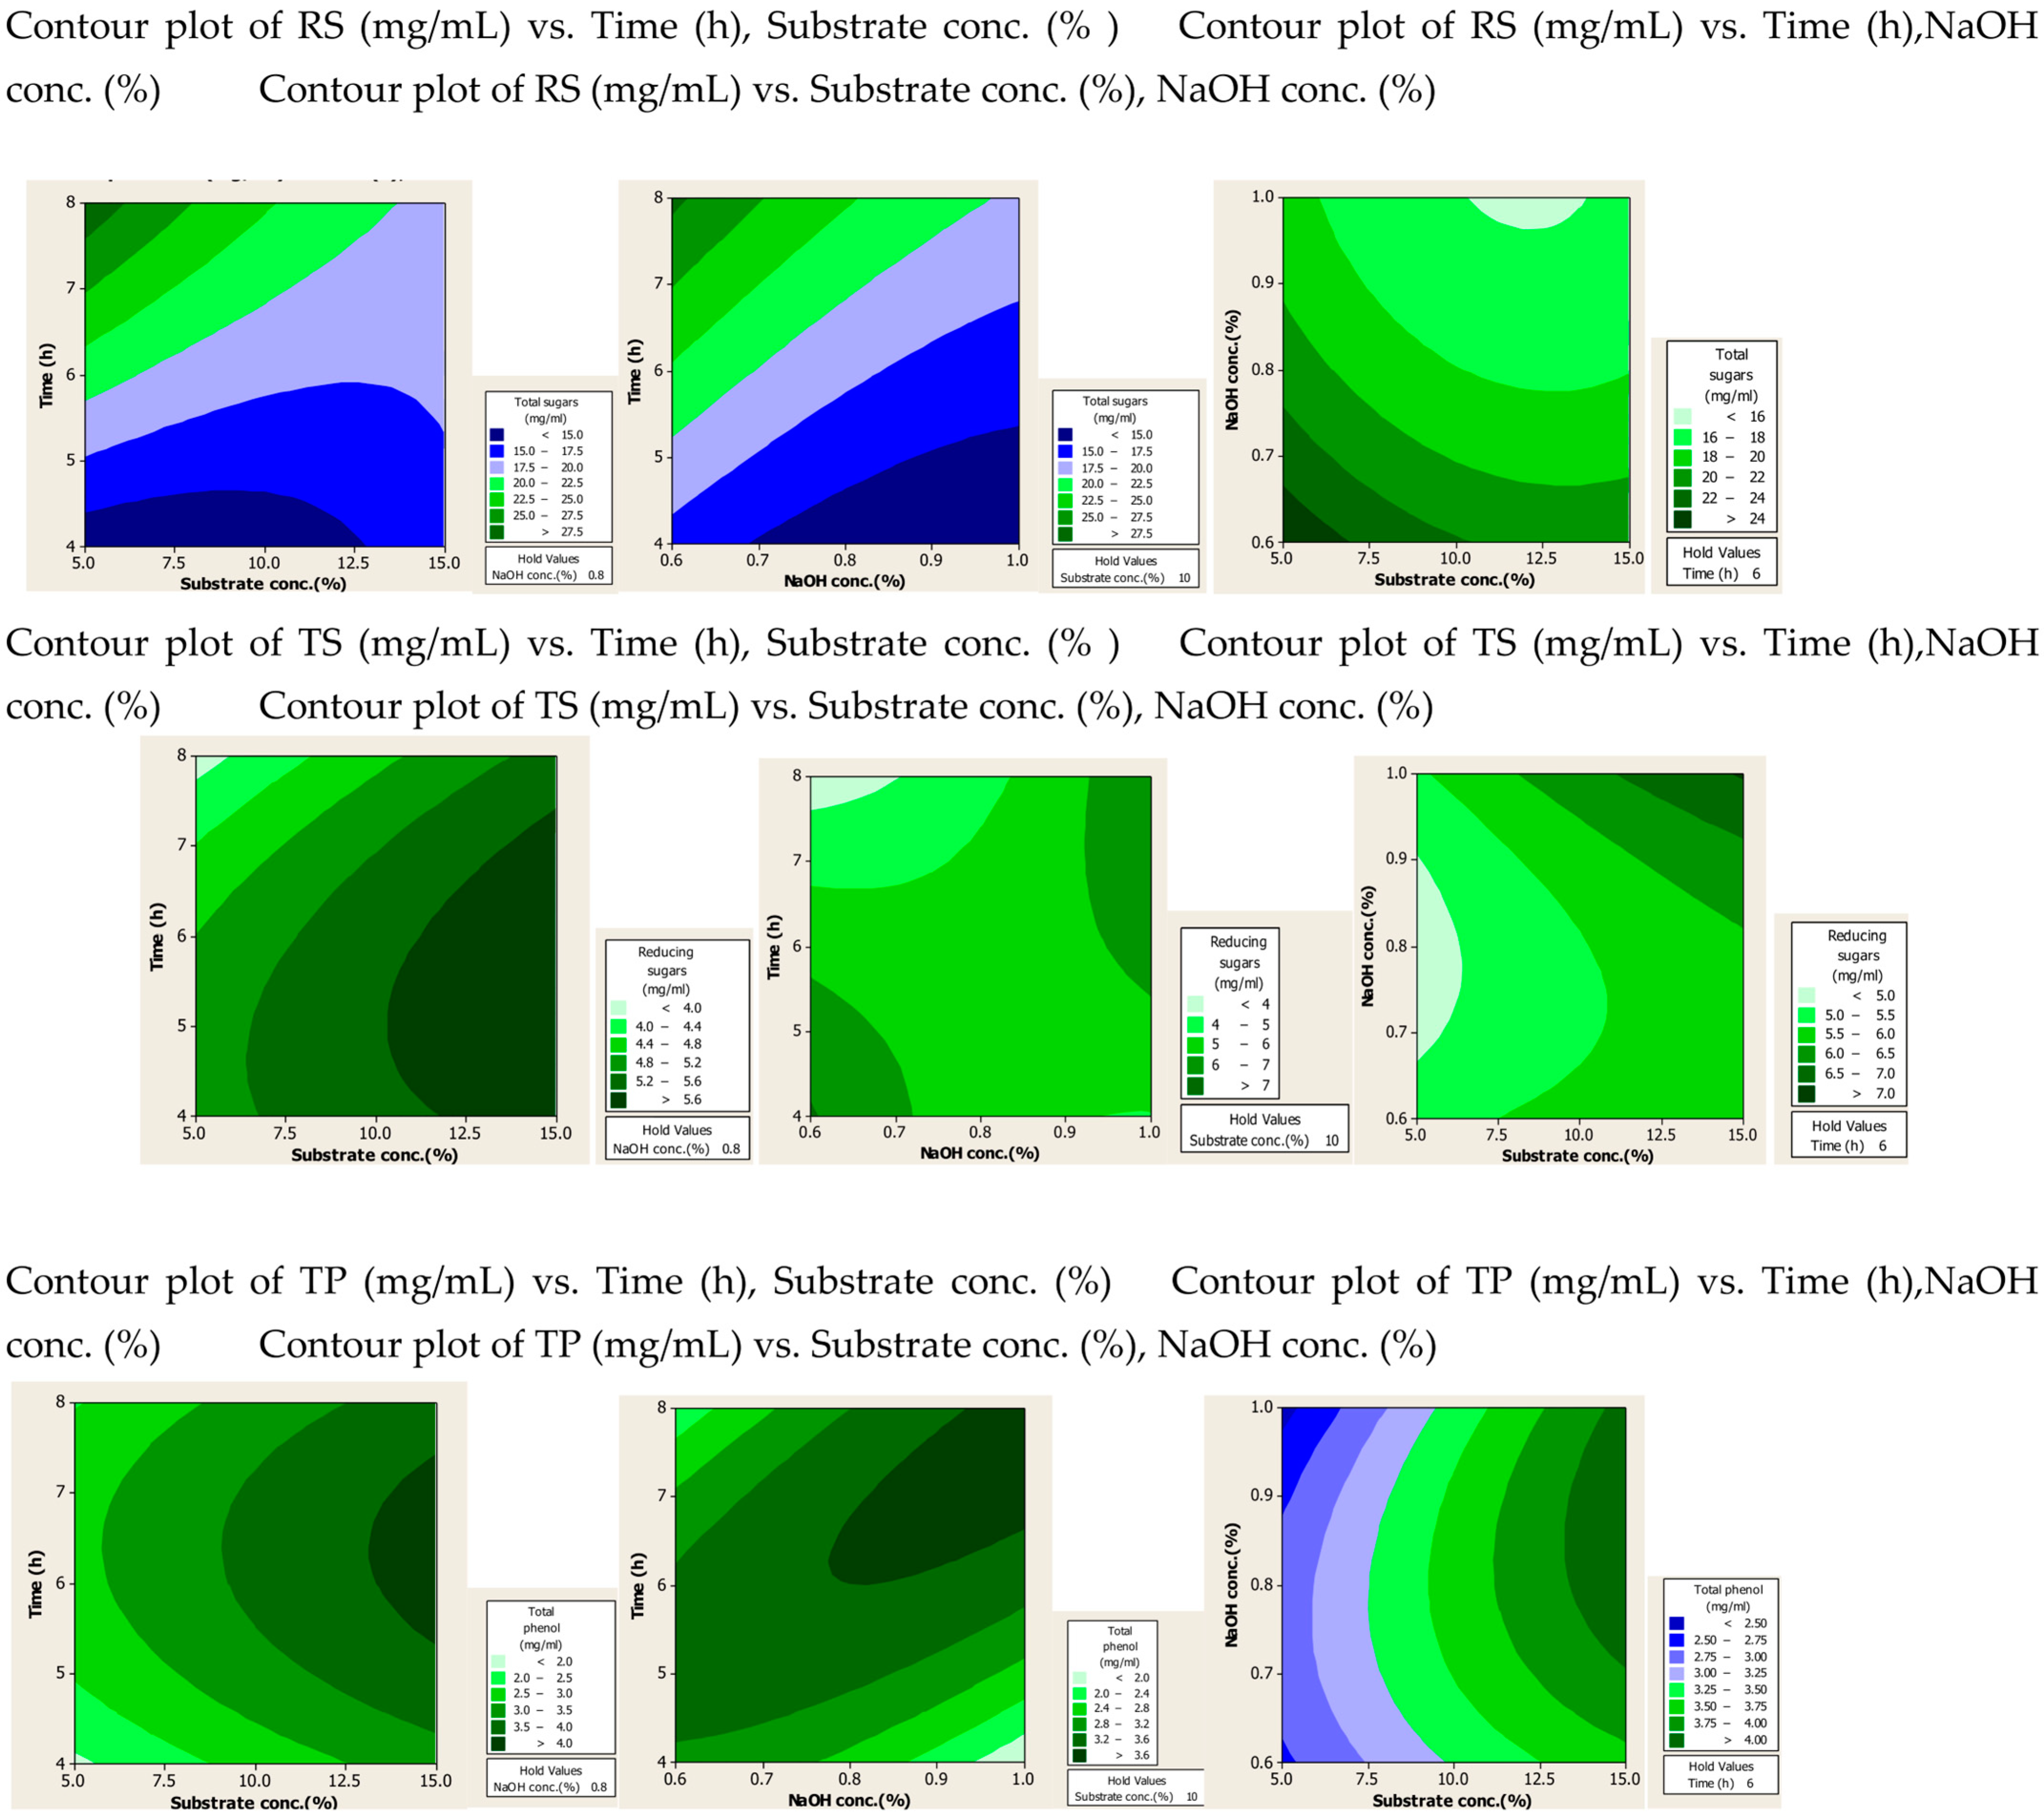
The effect of the interaction of different factors on the extraction of RS, TS and TPC after alkali and alkali-assisted autoclave treatment was illustrated by 2D contour plots, as shown in Figure 1 and Figure 2. In these plots three main colours are shown: light green and blue represent the lowest yield, while dark green represents the highest yield. From the alkali-treated contour plots it can be observed that substrate and alkali concentration had a direct relation to the production of RS, whereas time had an inverse relation to the production of RS. For TS production, optimum values were observed at high values of substrate and alkali concentration and time. High concentrations of substrate and alkali were favourable for the production of phenolic compounds, whereas time did not significantly affect the yield of phenolic compounds.
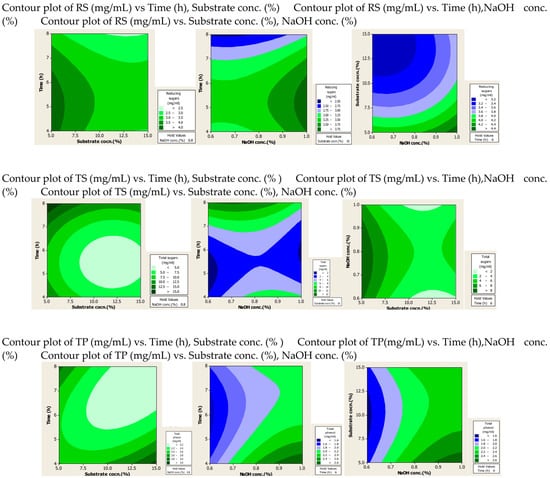
Figure 1.
Contour plots after alkali treatment of PPW.
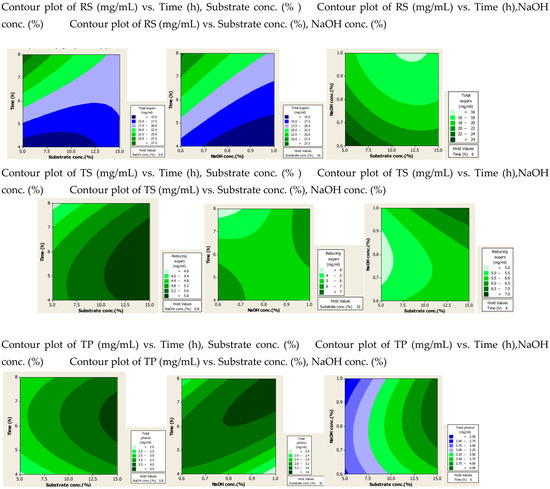
Figure 2.
Contour plots after alkali assisted autoclave treatment of PPW.
From the alkali-plus-steam-treated contour plots it is evident that high RS production occurred at lower values of three parameters. For TS and TP production none of the three parameters was found significant, but increased production was observed with high values of substrate and alkali concentration.
2.2. FTIR Analysis
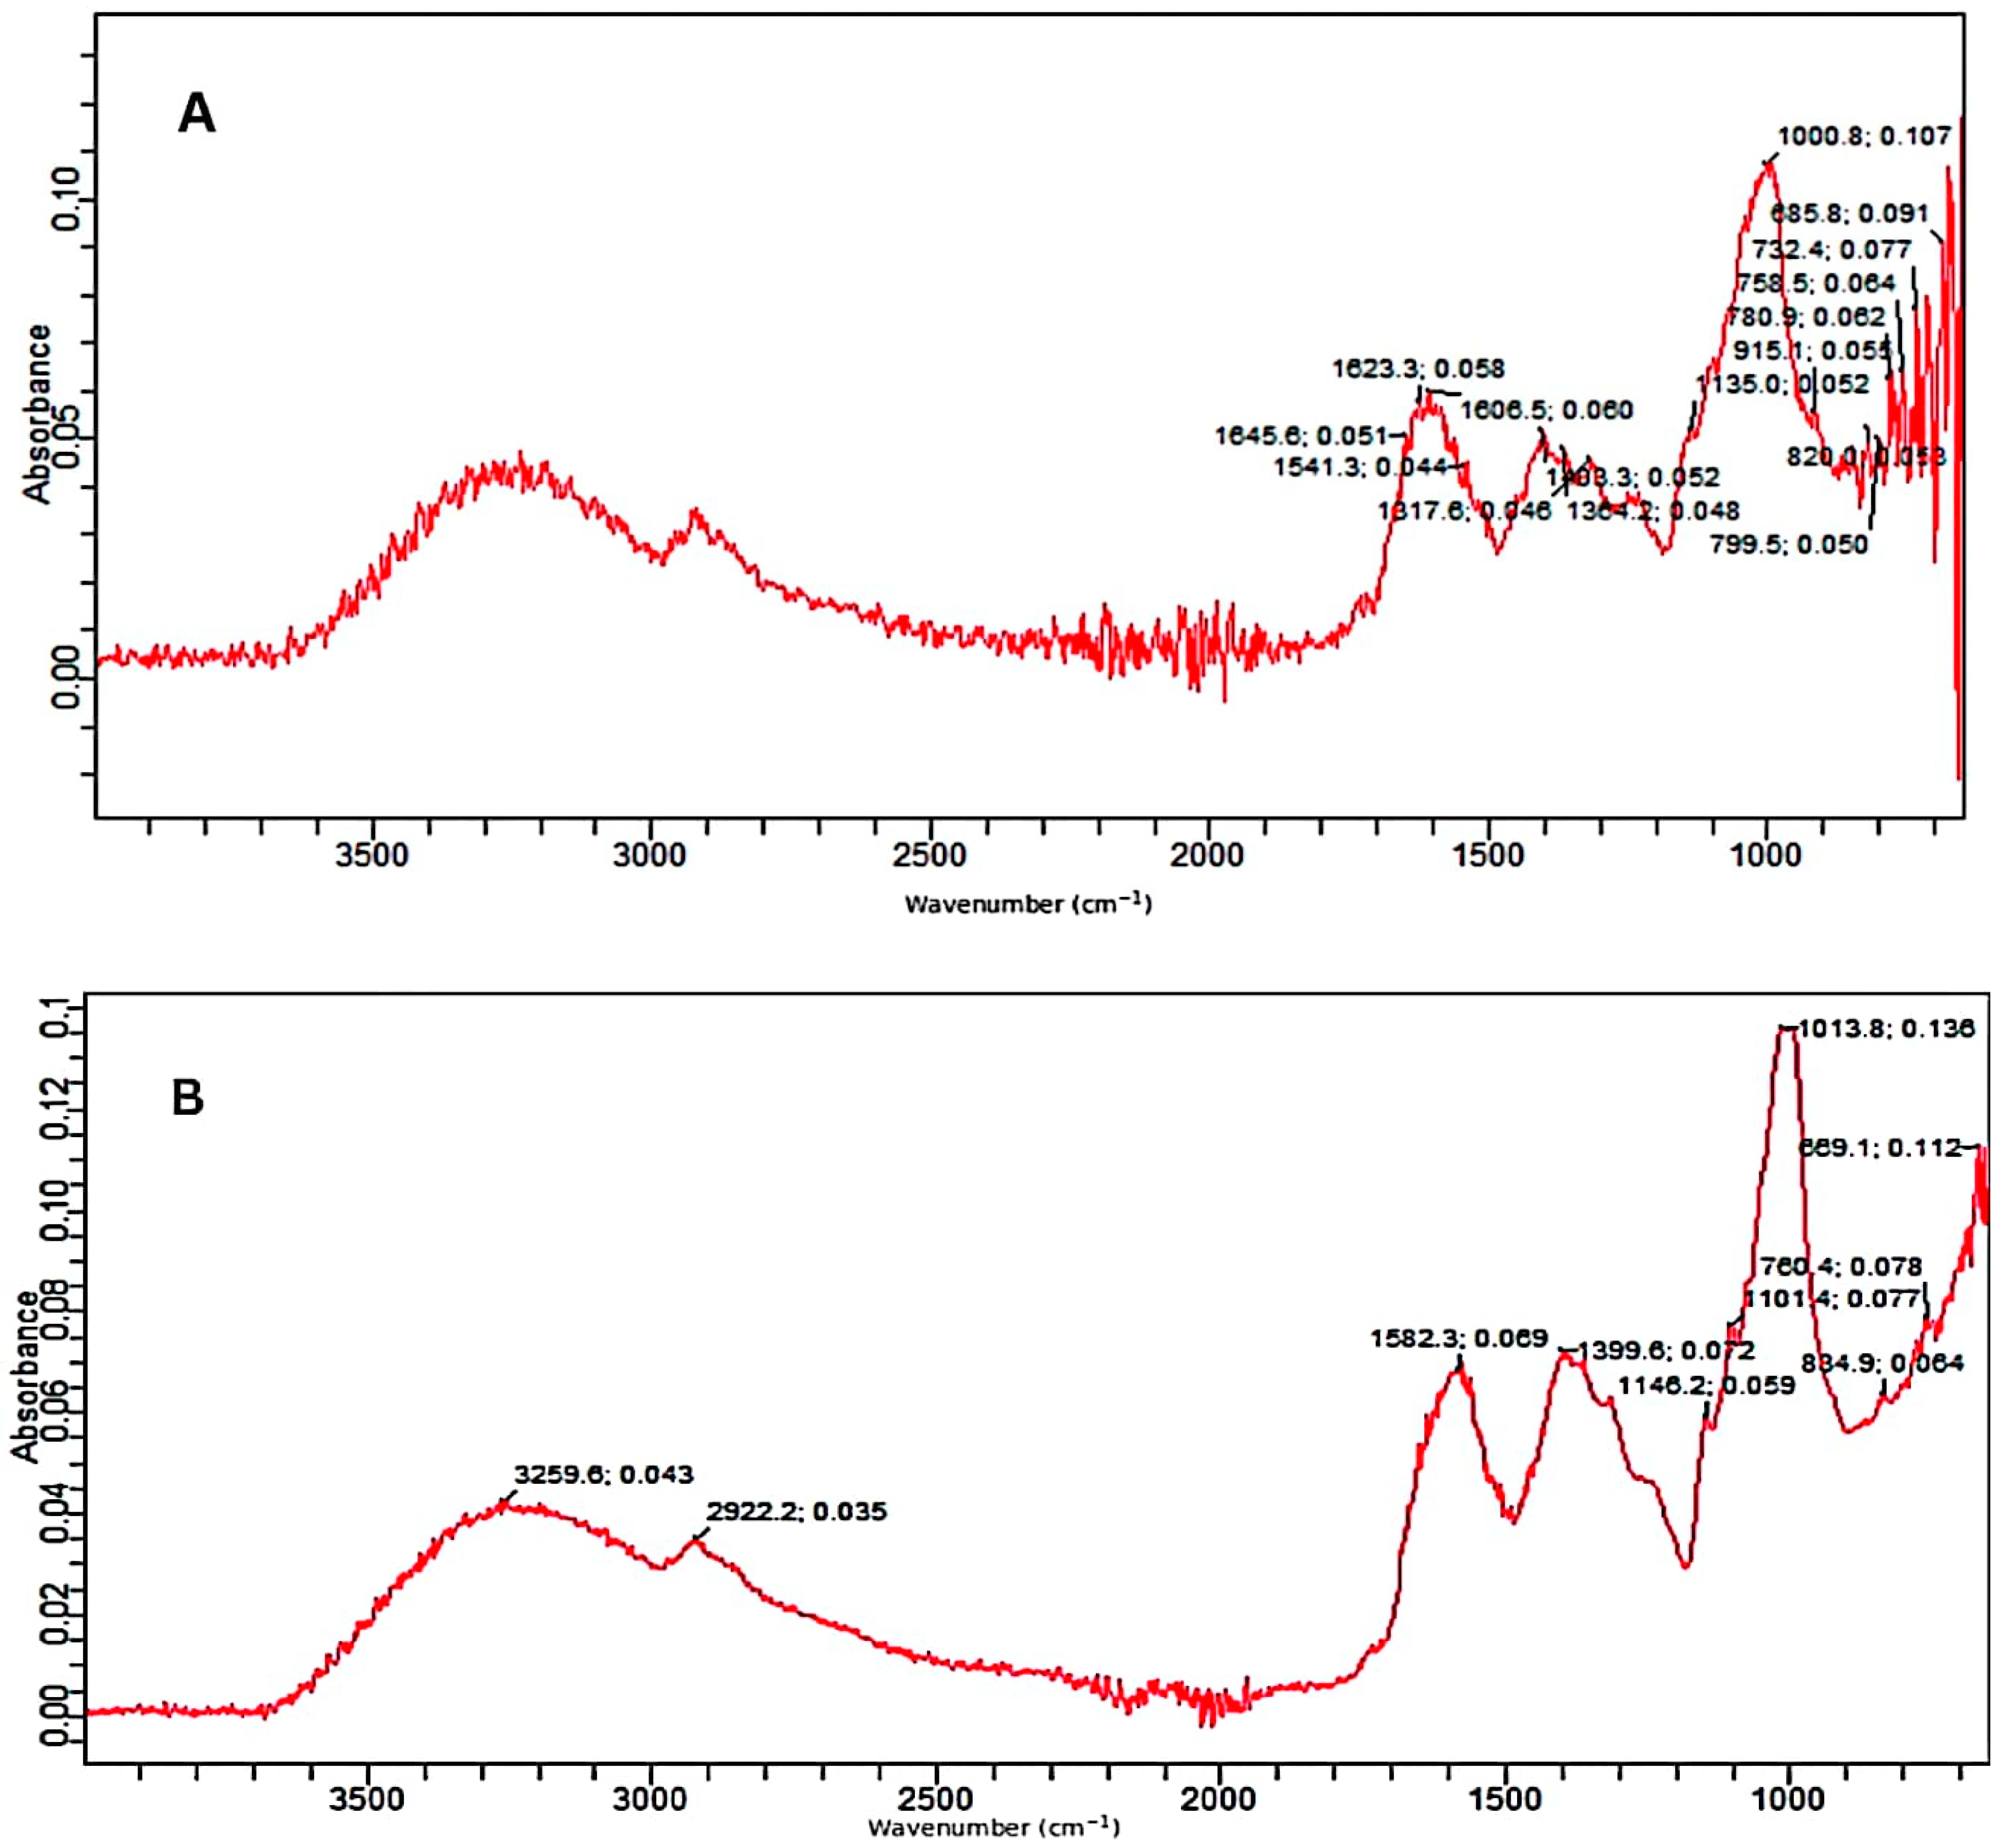
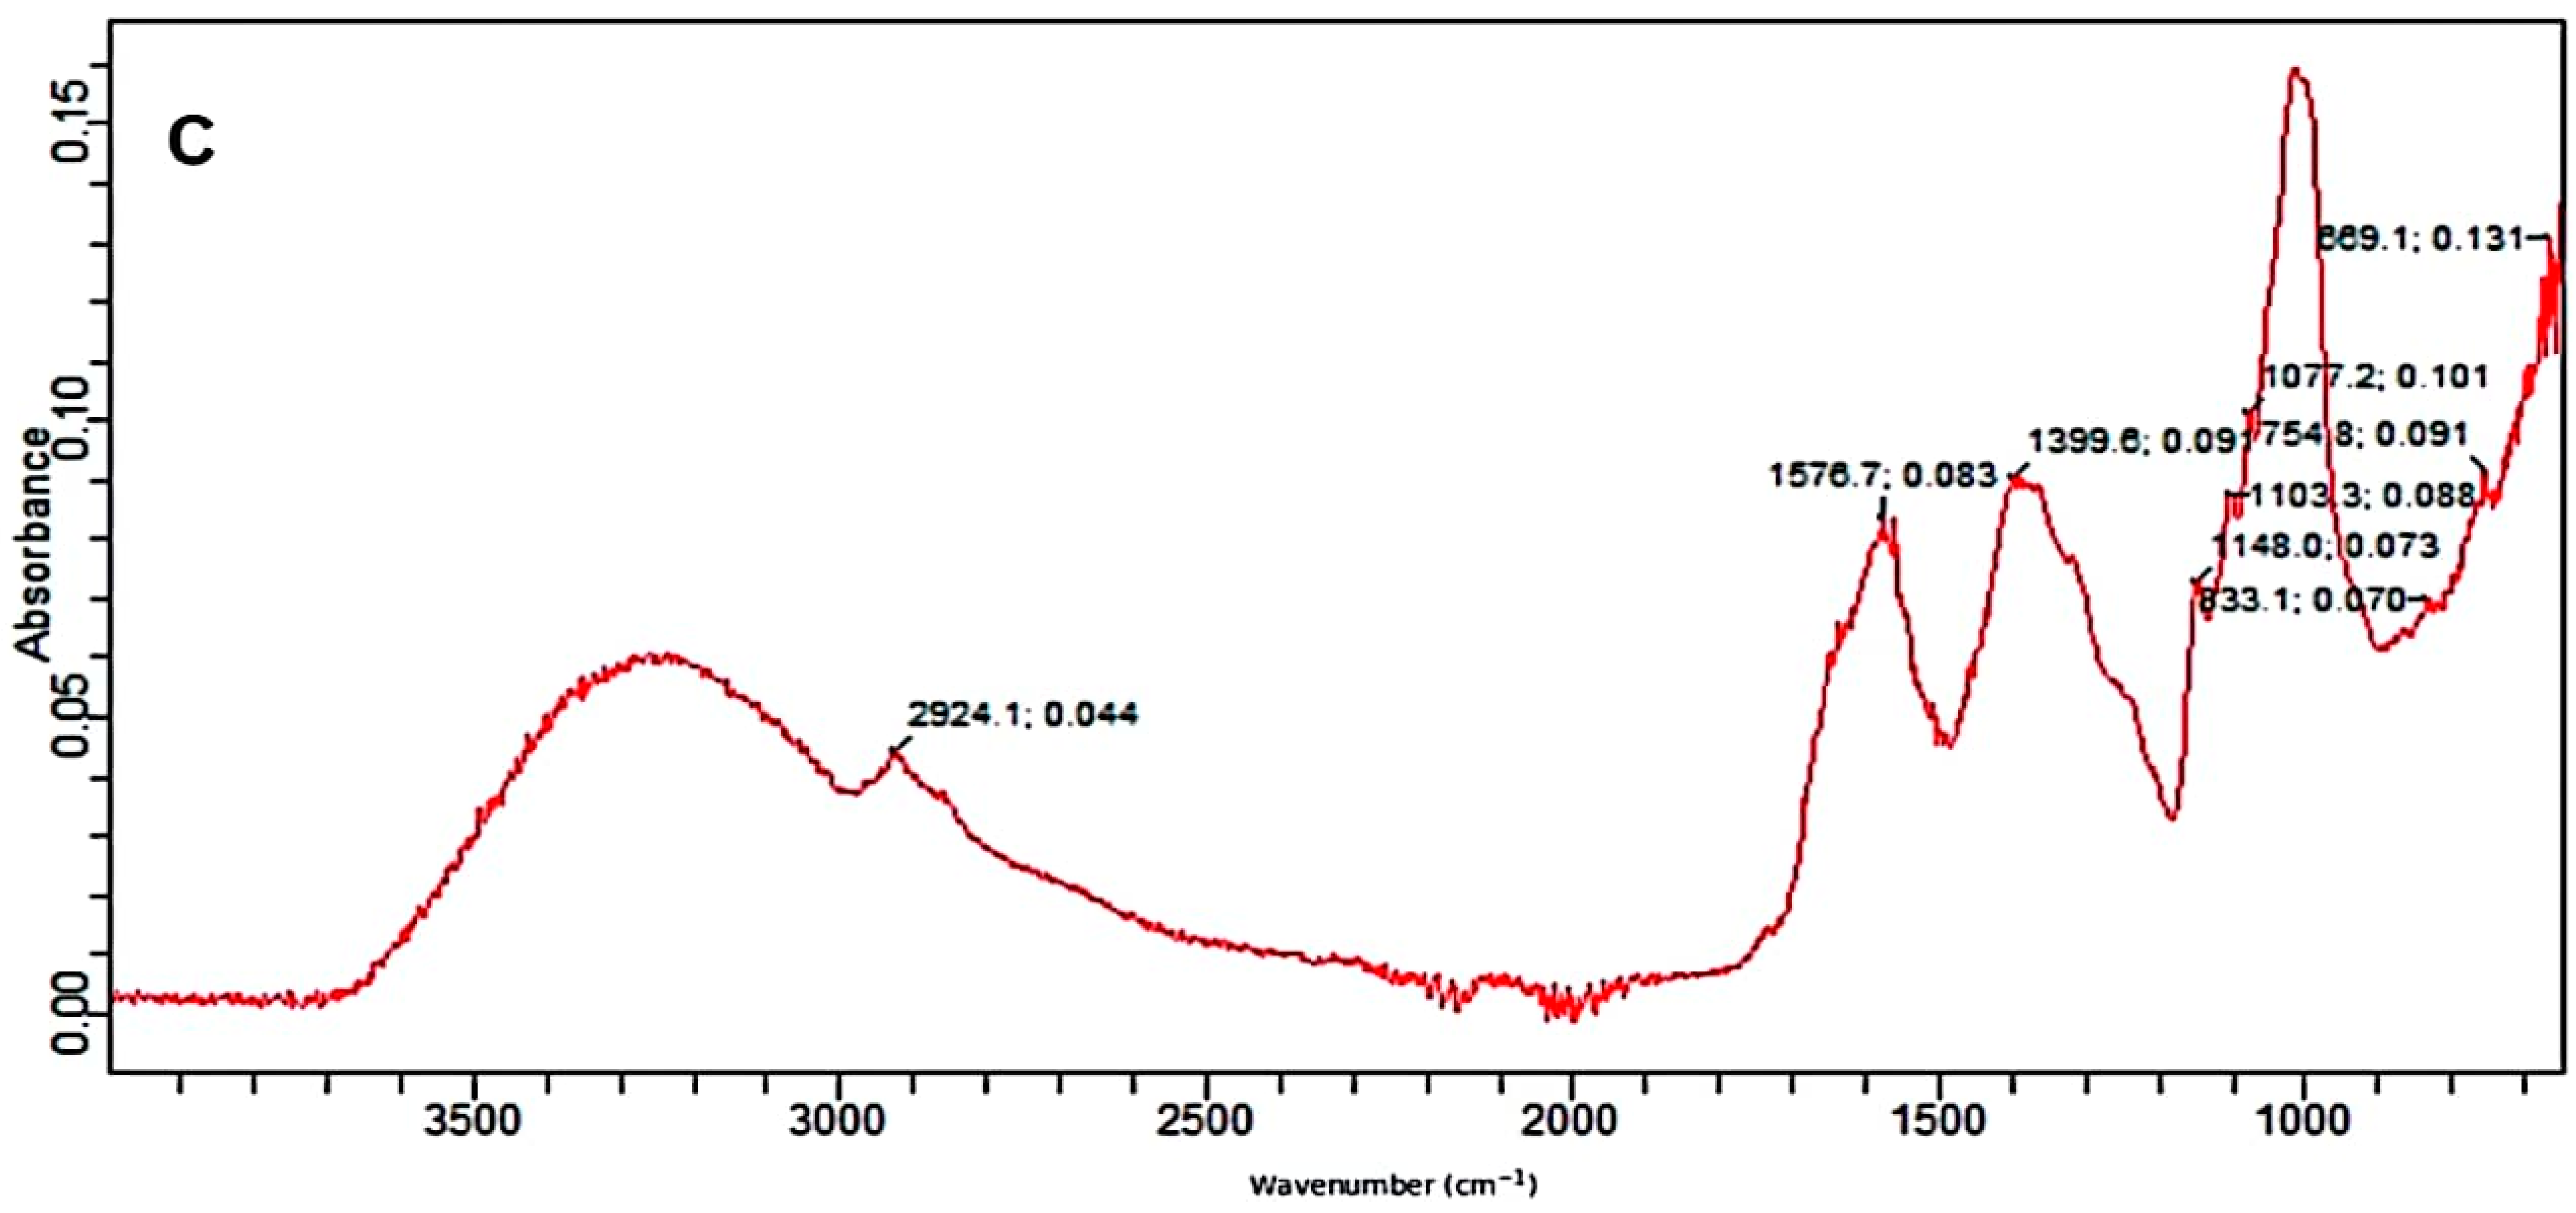
The control as well as the pretreated substrates were analyzed by the FTIR facility. The FTIR (Figure 3A–C) confirmed the deterioration of various bonds in treated samples of PPW. FTIR spectra of alkali and alkali-assisted autoclave-treated PPW ranged from 4000 to 500 cm−1. Both spectra revealed a band between 3000 and 3300 cm−1, which confirmed the presence of a free and bounded -OH stretching vibration derived from degraded polymers such starch, cellulose and lignin. In the control sample, there were more peaks, reflecting the complexity of different polymers and bonds which apparently deteriorated in the treated samples. The intensity of different peaks was also high in the control sample (Figure 3A).
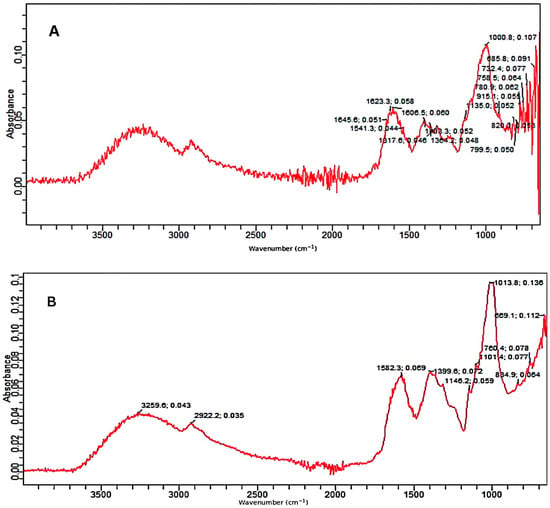
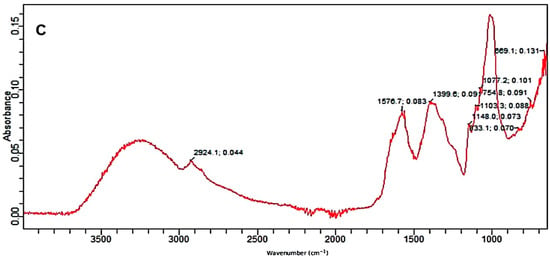
Figure 3.
FTIR absorption spectra; (A) control, (B) alkali-treated and (C) alkali-plus-steam-treated PPW.
In the alkali-treated PPW, the spectrum displayed the characteristic peak at 2922 cm−1 which can be attributed to the carbon hydrogen (C–H) bond stretching of methyl and methylene groups in the polymers present in PPW. The absorption peak at 1582/1541 is attributed to C–H bond deformation in polymers such as starch and lignin present in PPW which could be highly increased in alkali-treated PPW as compared to untreated substrate. The peaks at 1399/1317 cm−1 revealed C–H deformation in various polymers such as starch, lignin and cellulose which was significantly increased in treated PPW as compared to untreated PPW. The bands at 1146 and 1101 cm−1 reflected carbon oxygen bond (C–O–C) stretching in different polymers (starch and non-starch polysaccharides) existing in PPW (Figure 3B).The bands at 1013, 834 and 760 cm−1 depicted the deformation of various compounds such as polysaccharides and aromatic and halogen compounds [53].
The FTIR spectrum of alkali-assisted autoclaved PPW showed a very broad band between 2700 and 3300 cm−1, which can be assigned to aldehydes or acids formation (benzoic or carboxylic acid). The absorption peak at 1576/1541 cm−1 is attributed to the C–H bond deformation of polymers existing in PPW, which increased in alkali-plus-autoclave treatment as compared to untreated substrate. The peak at 1399/1346 cm−1 depicted the C–O deformation and confirmed more degradation in alkali-assisted autoclaving treatment. The bands at 1148 and 1103 cm−1 described the C–O–C vibrations in various components of PPW (Figure 3C). The band at 1077 denoted the C–O vibrations in various alcoholic groups of cellulose. The bands at 833, 754 and 699 cm−1 reflected the C–H deformation of lignin component [54,55]. Similar recordings of band patterns have been reported by several research reports [56,57].
2.3. Morphological Changes in Untreated and Alkali plus Steam Treated PPW
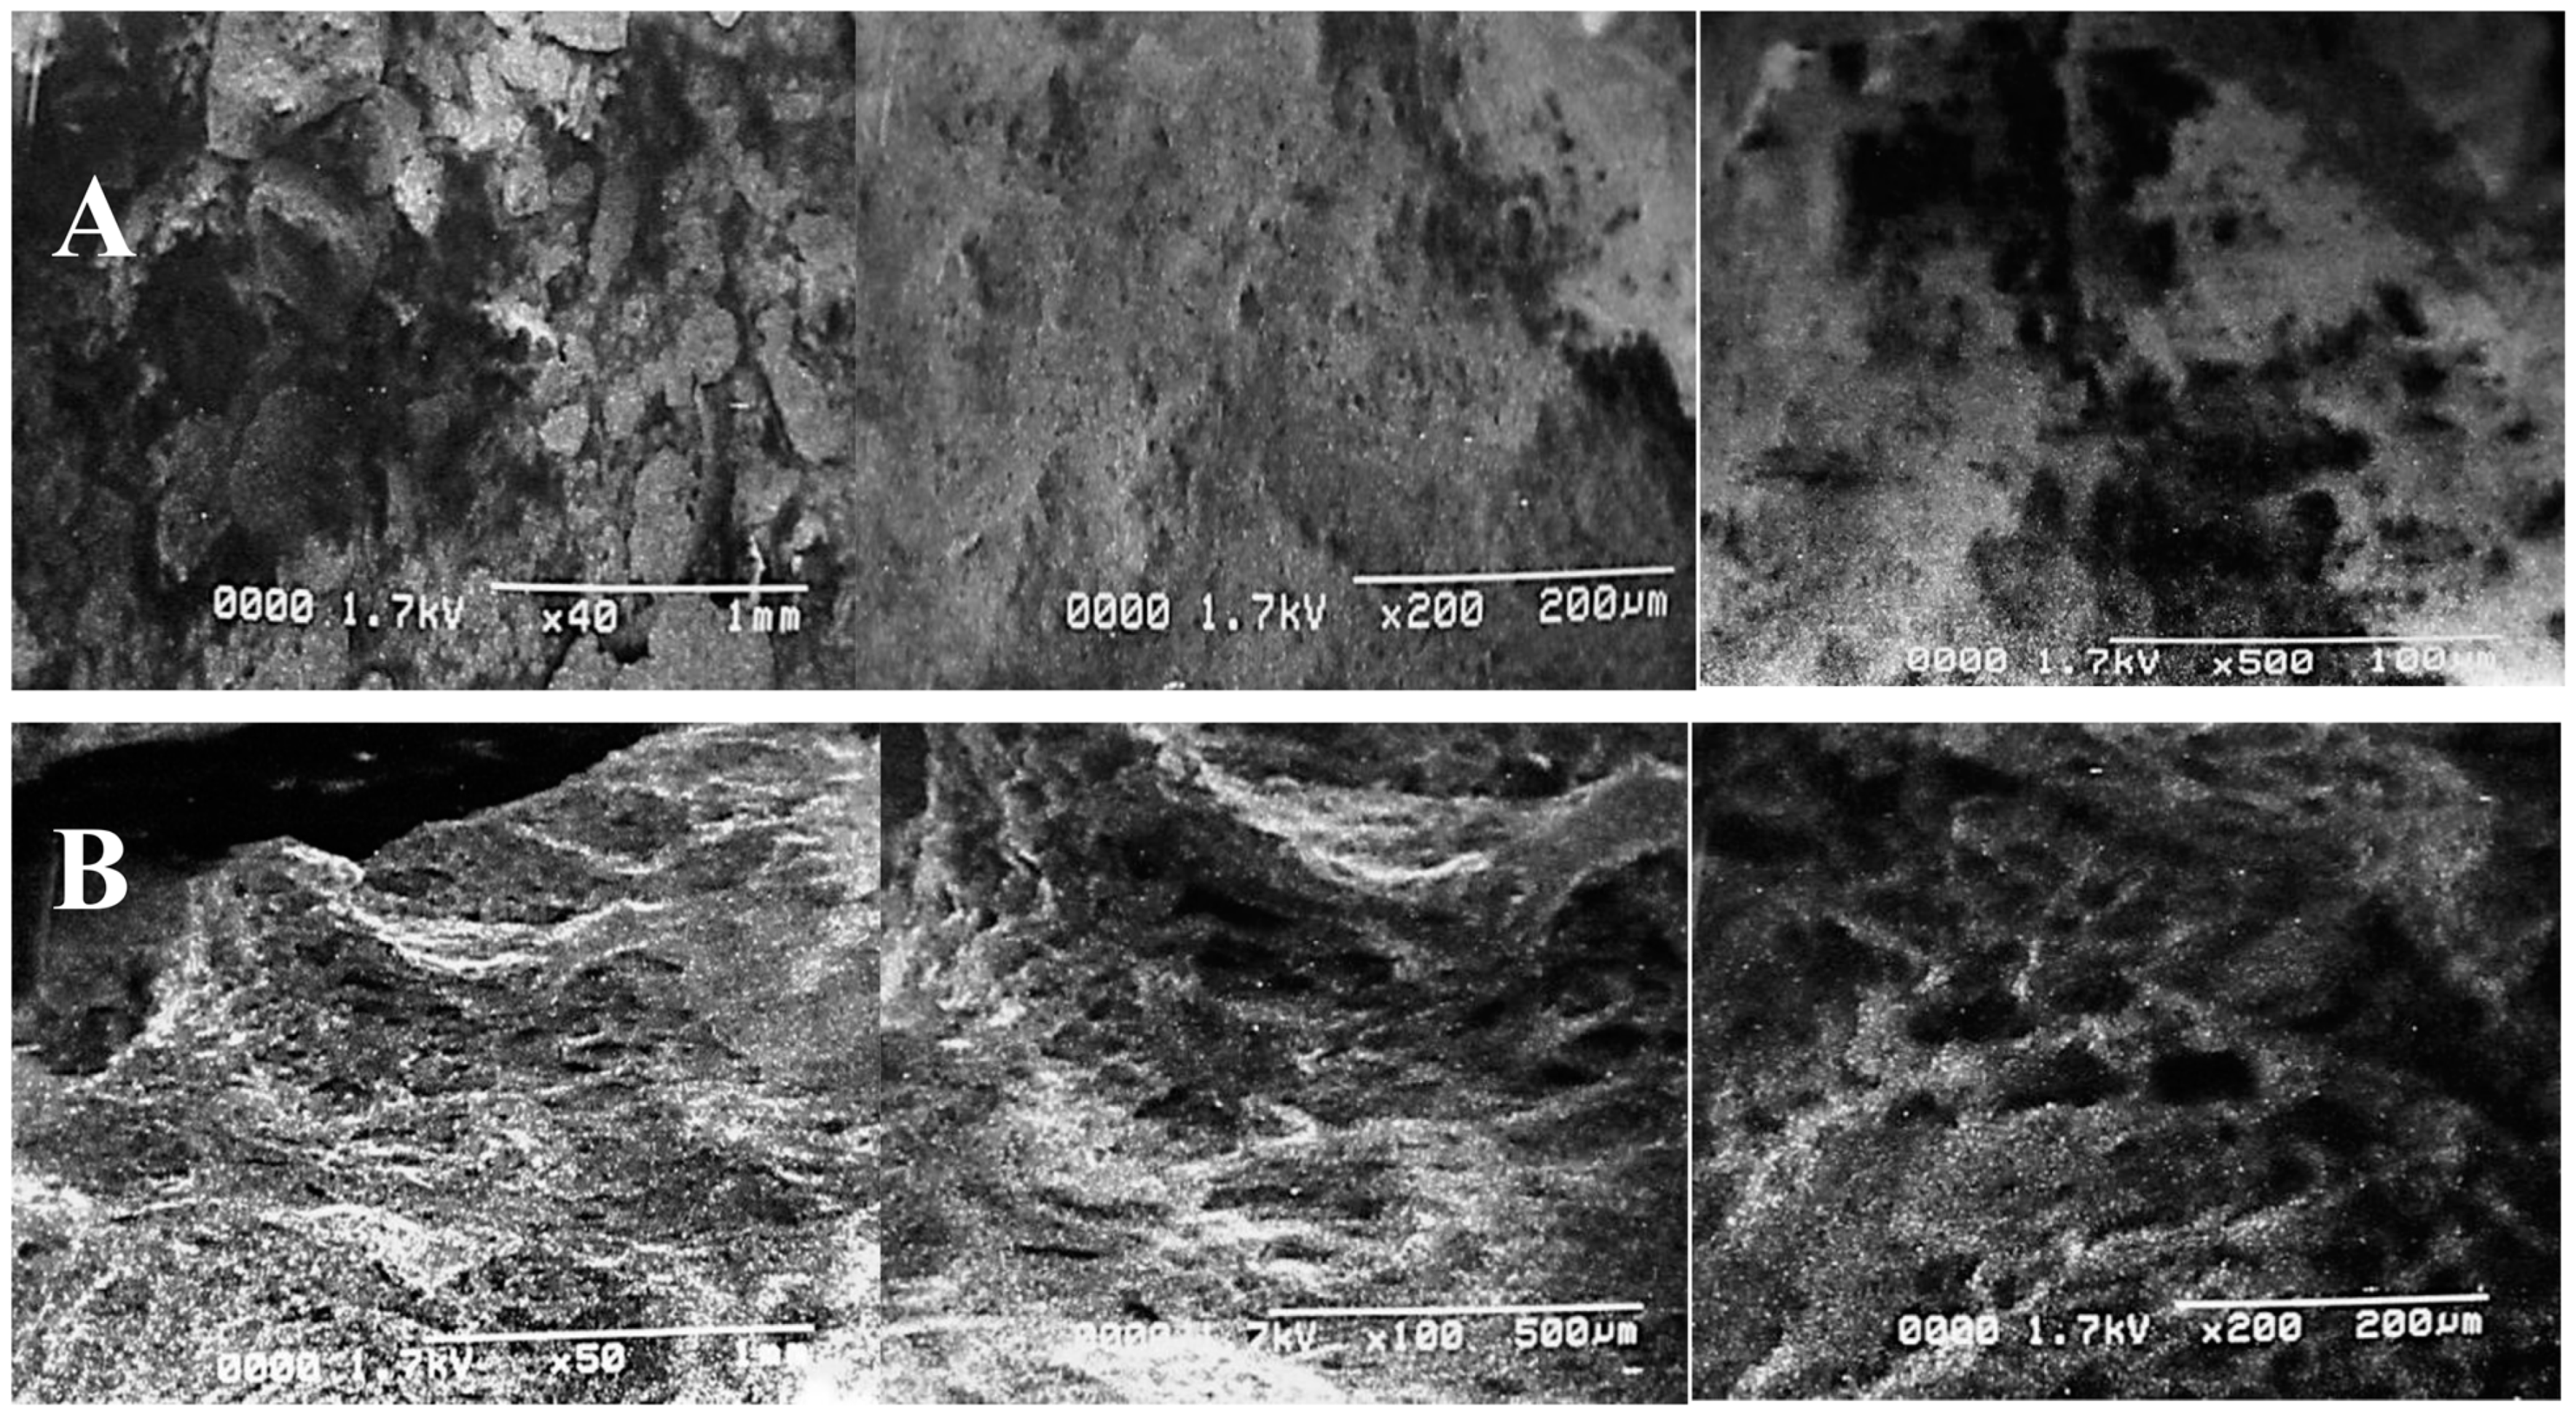
The structural variations and deformations in PPW after both treatments were clearly revealed by SEM, as shown in Figure 4. The alkali reaction destroyed the structural bonding by creating some irregular pores and cracks. Electron micrographs depicted a significant difference between the surface structures of the control and treated samples. The untreated PPW structure displayed a complex and intact order without any evident fragmentation (Figure 4A). However, alkali-assisted steam treatment deteriorated the compactness of the structure, resulting in cracks, pores and damage to biomass (Figure 4B). Similar findings and observations have been reported in the study by [56]. They have confirmed the production of deformations, porosity, cracks and crevices in the SEM images of nanoparticle pre-treated (NAAP) PPW. Ghazanfar et al. [58] have reported a disrupted and perforated biomass structure after NaOH treatment using SEM images. Goyi et al. [59] have also reported a perforated structure of PPW after using the hydrothermal carbonization (HTC) extraction technique while evaluating its potential for water treatment. Similar findings have also been reported in research reports while evaluating the potential of PPW for different applications [60,61].
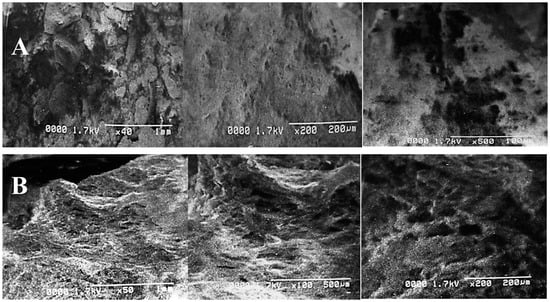
Figure 4.
Scanning electron micrographs of PPW of control (A) and alkali-plus-steam-treated PPW (B).
2.4. Degradation Index of Raw and Treated PPW
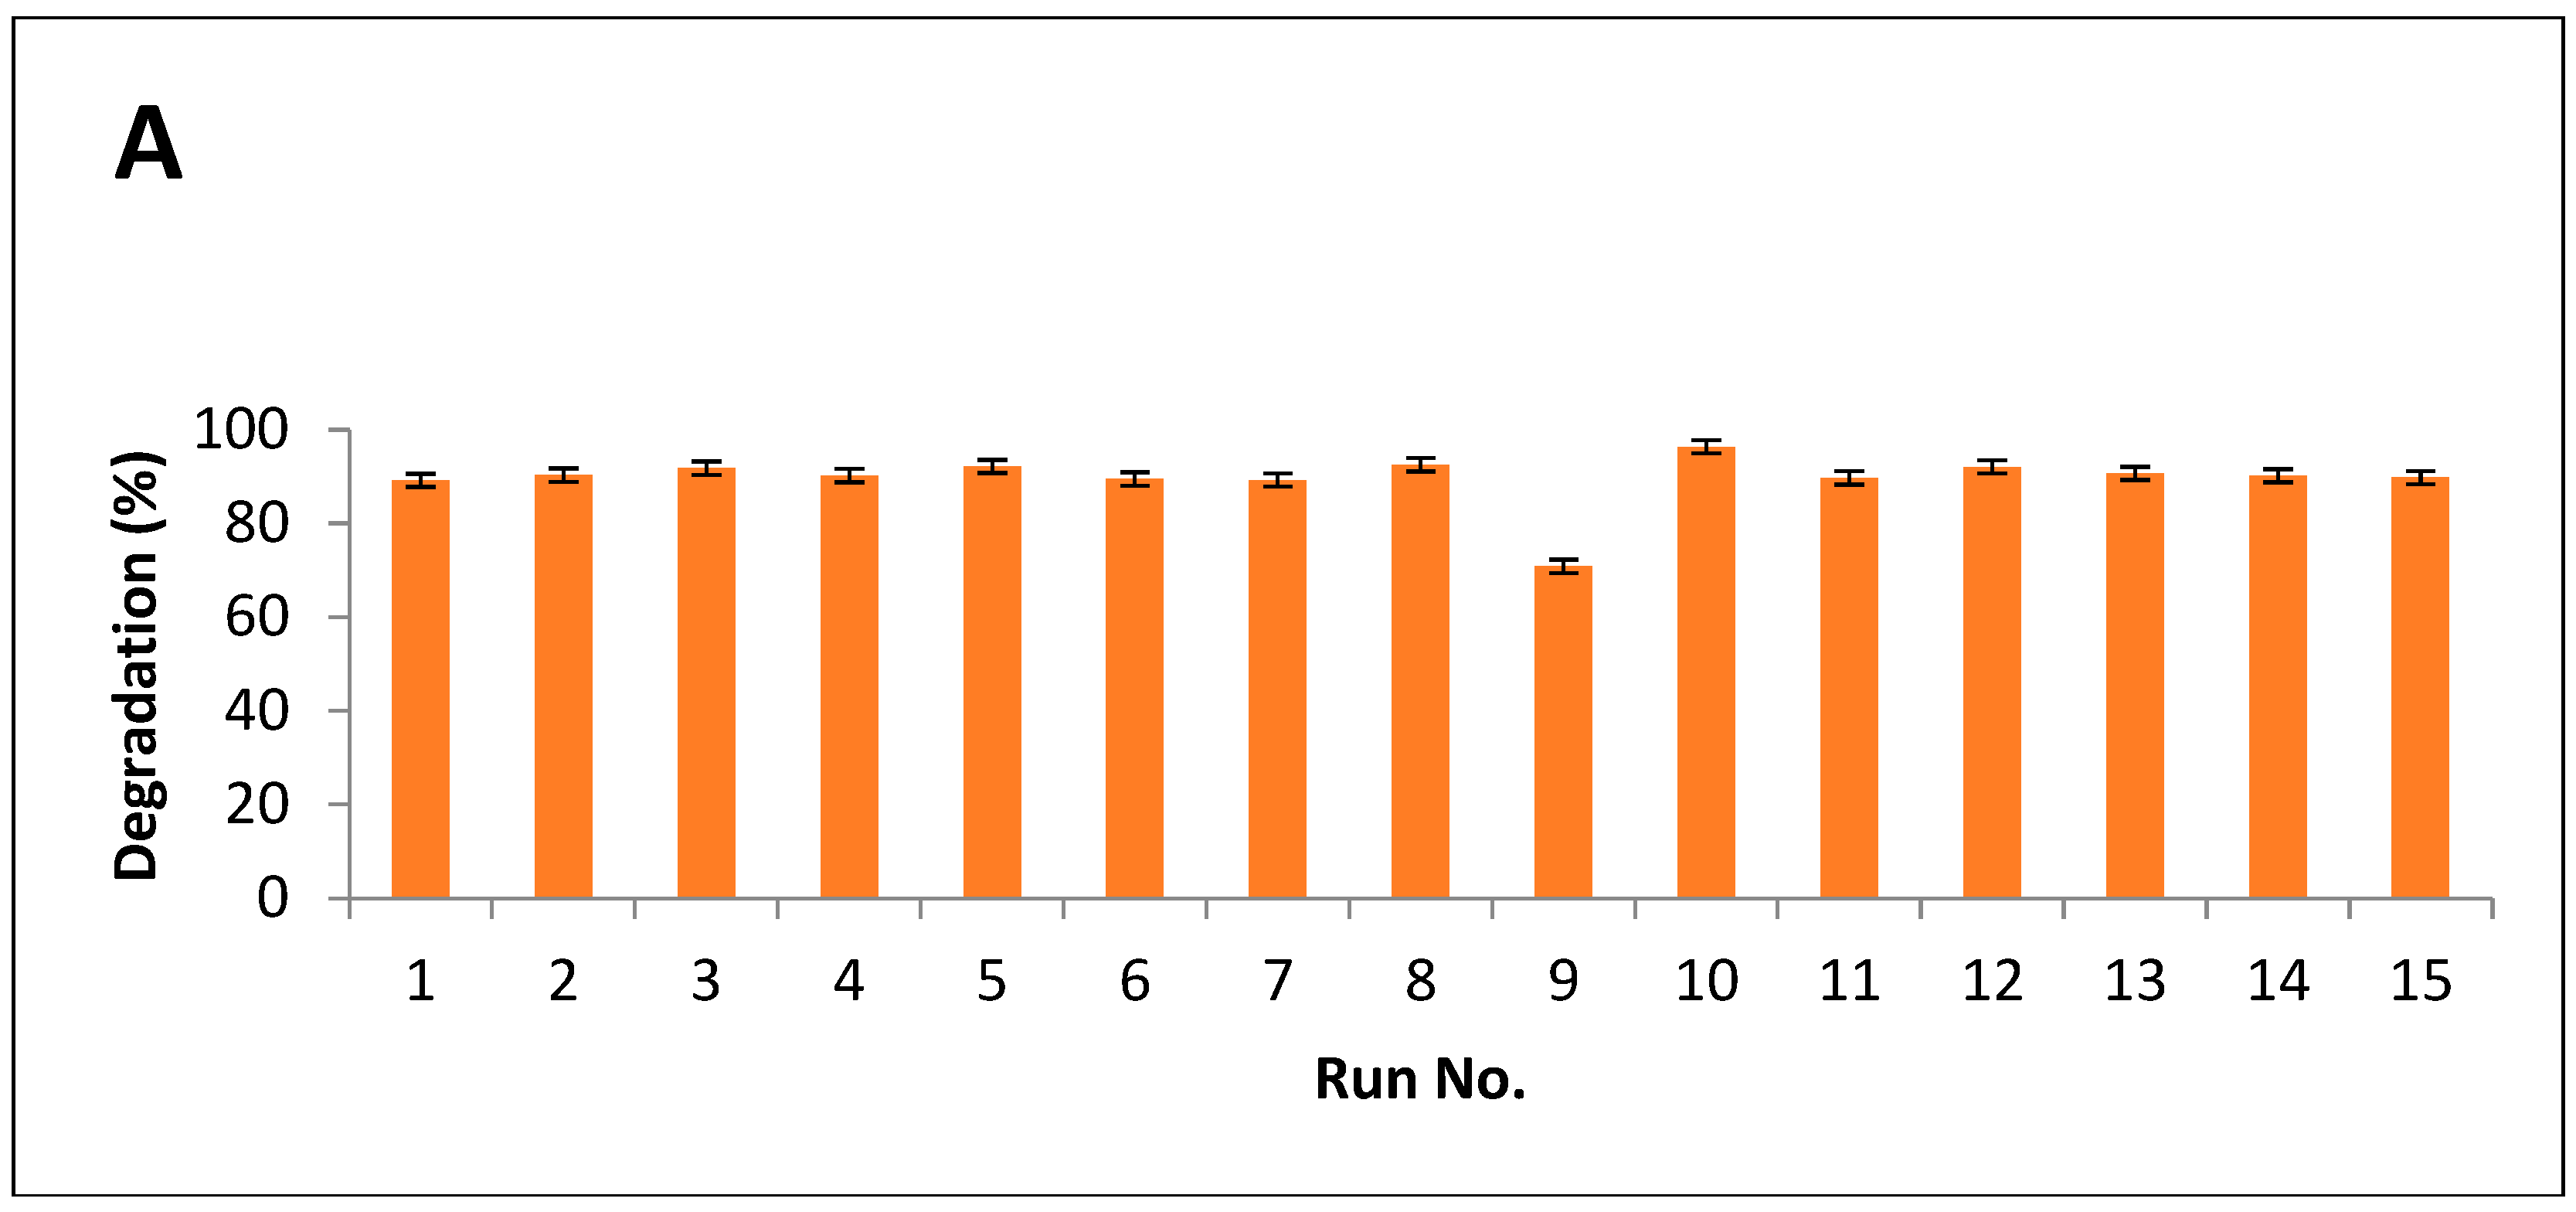
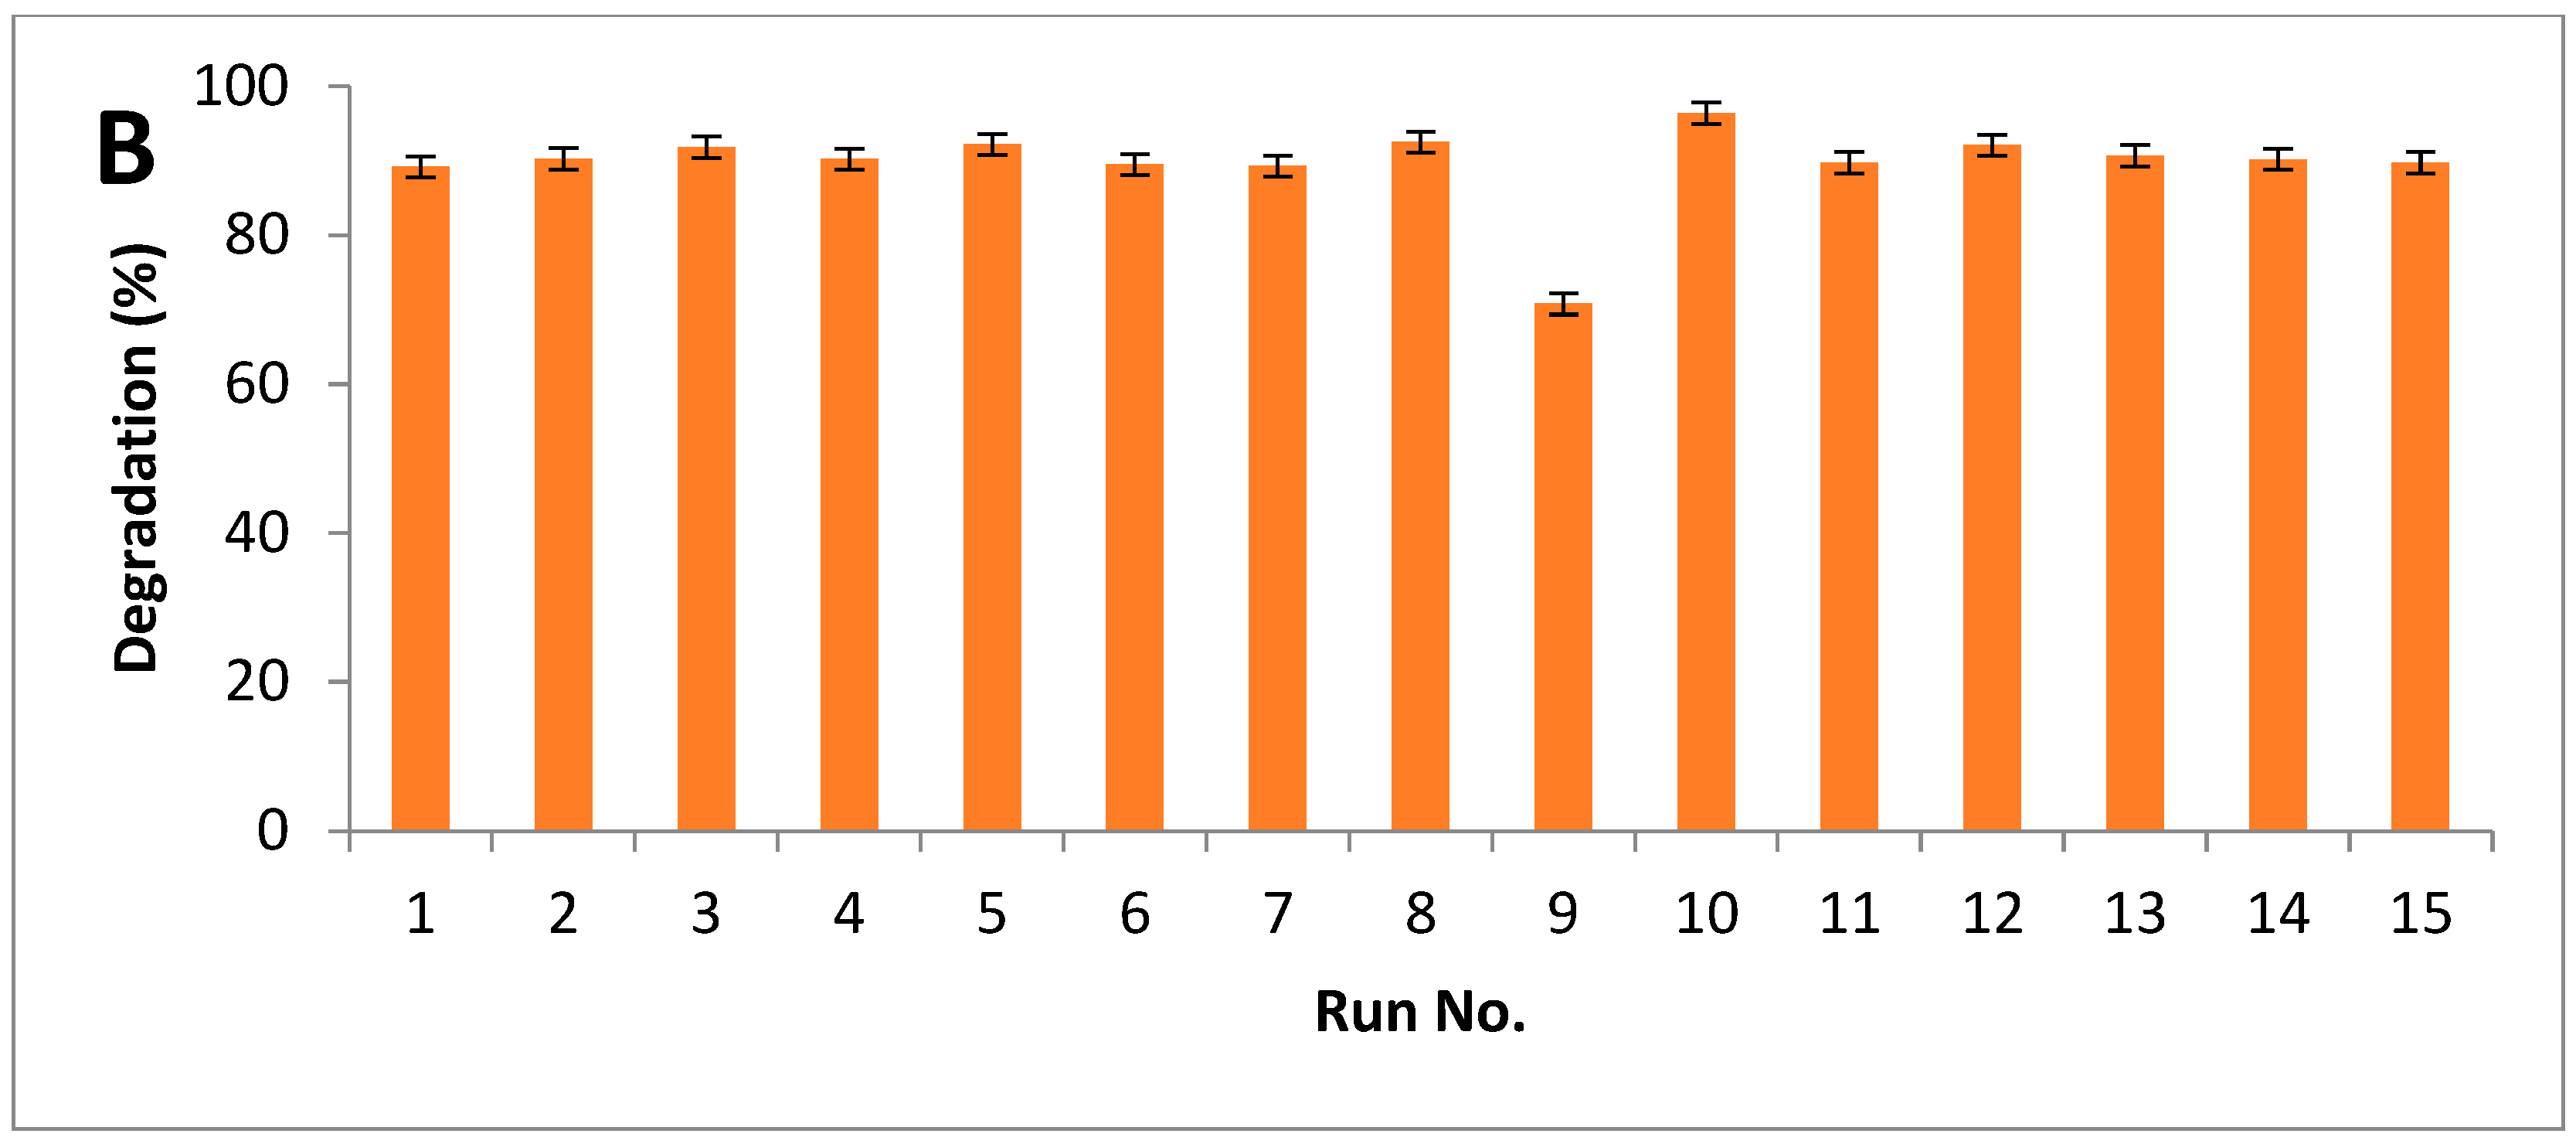
Results indicated that maximum breakdown after alkali hydrolysis was measured as 94%, while 96% of degradation was observed after alkali-plus-steam treatment (Figure 5A,B).
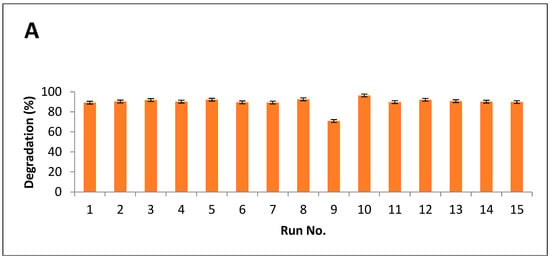
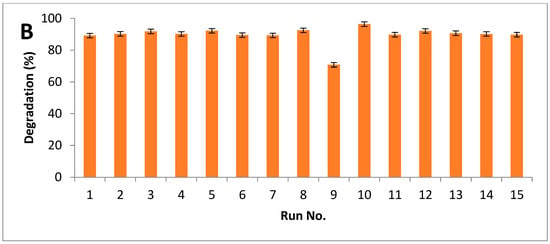
Figure 5.
Degradation index of PPW (A) alkali treatment (B) alkali plus steam treatment.
2.5. Alkali Saccharification of PPW
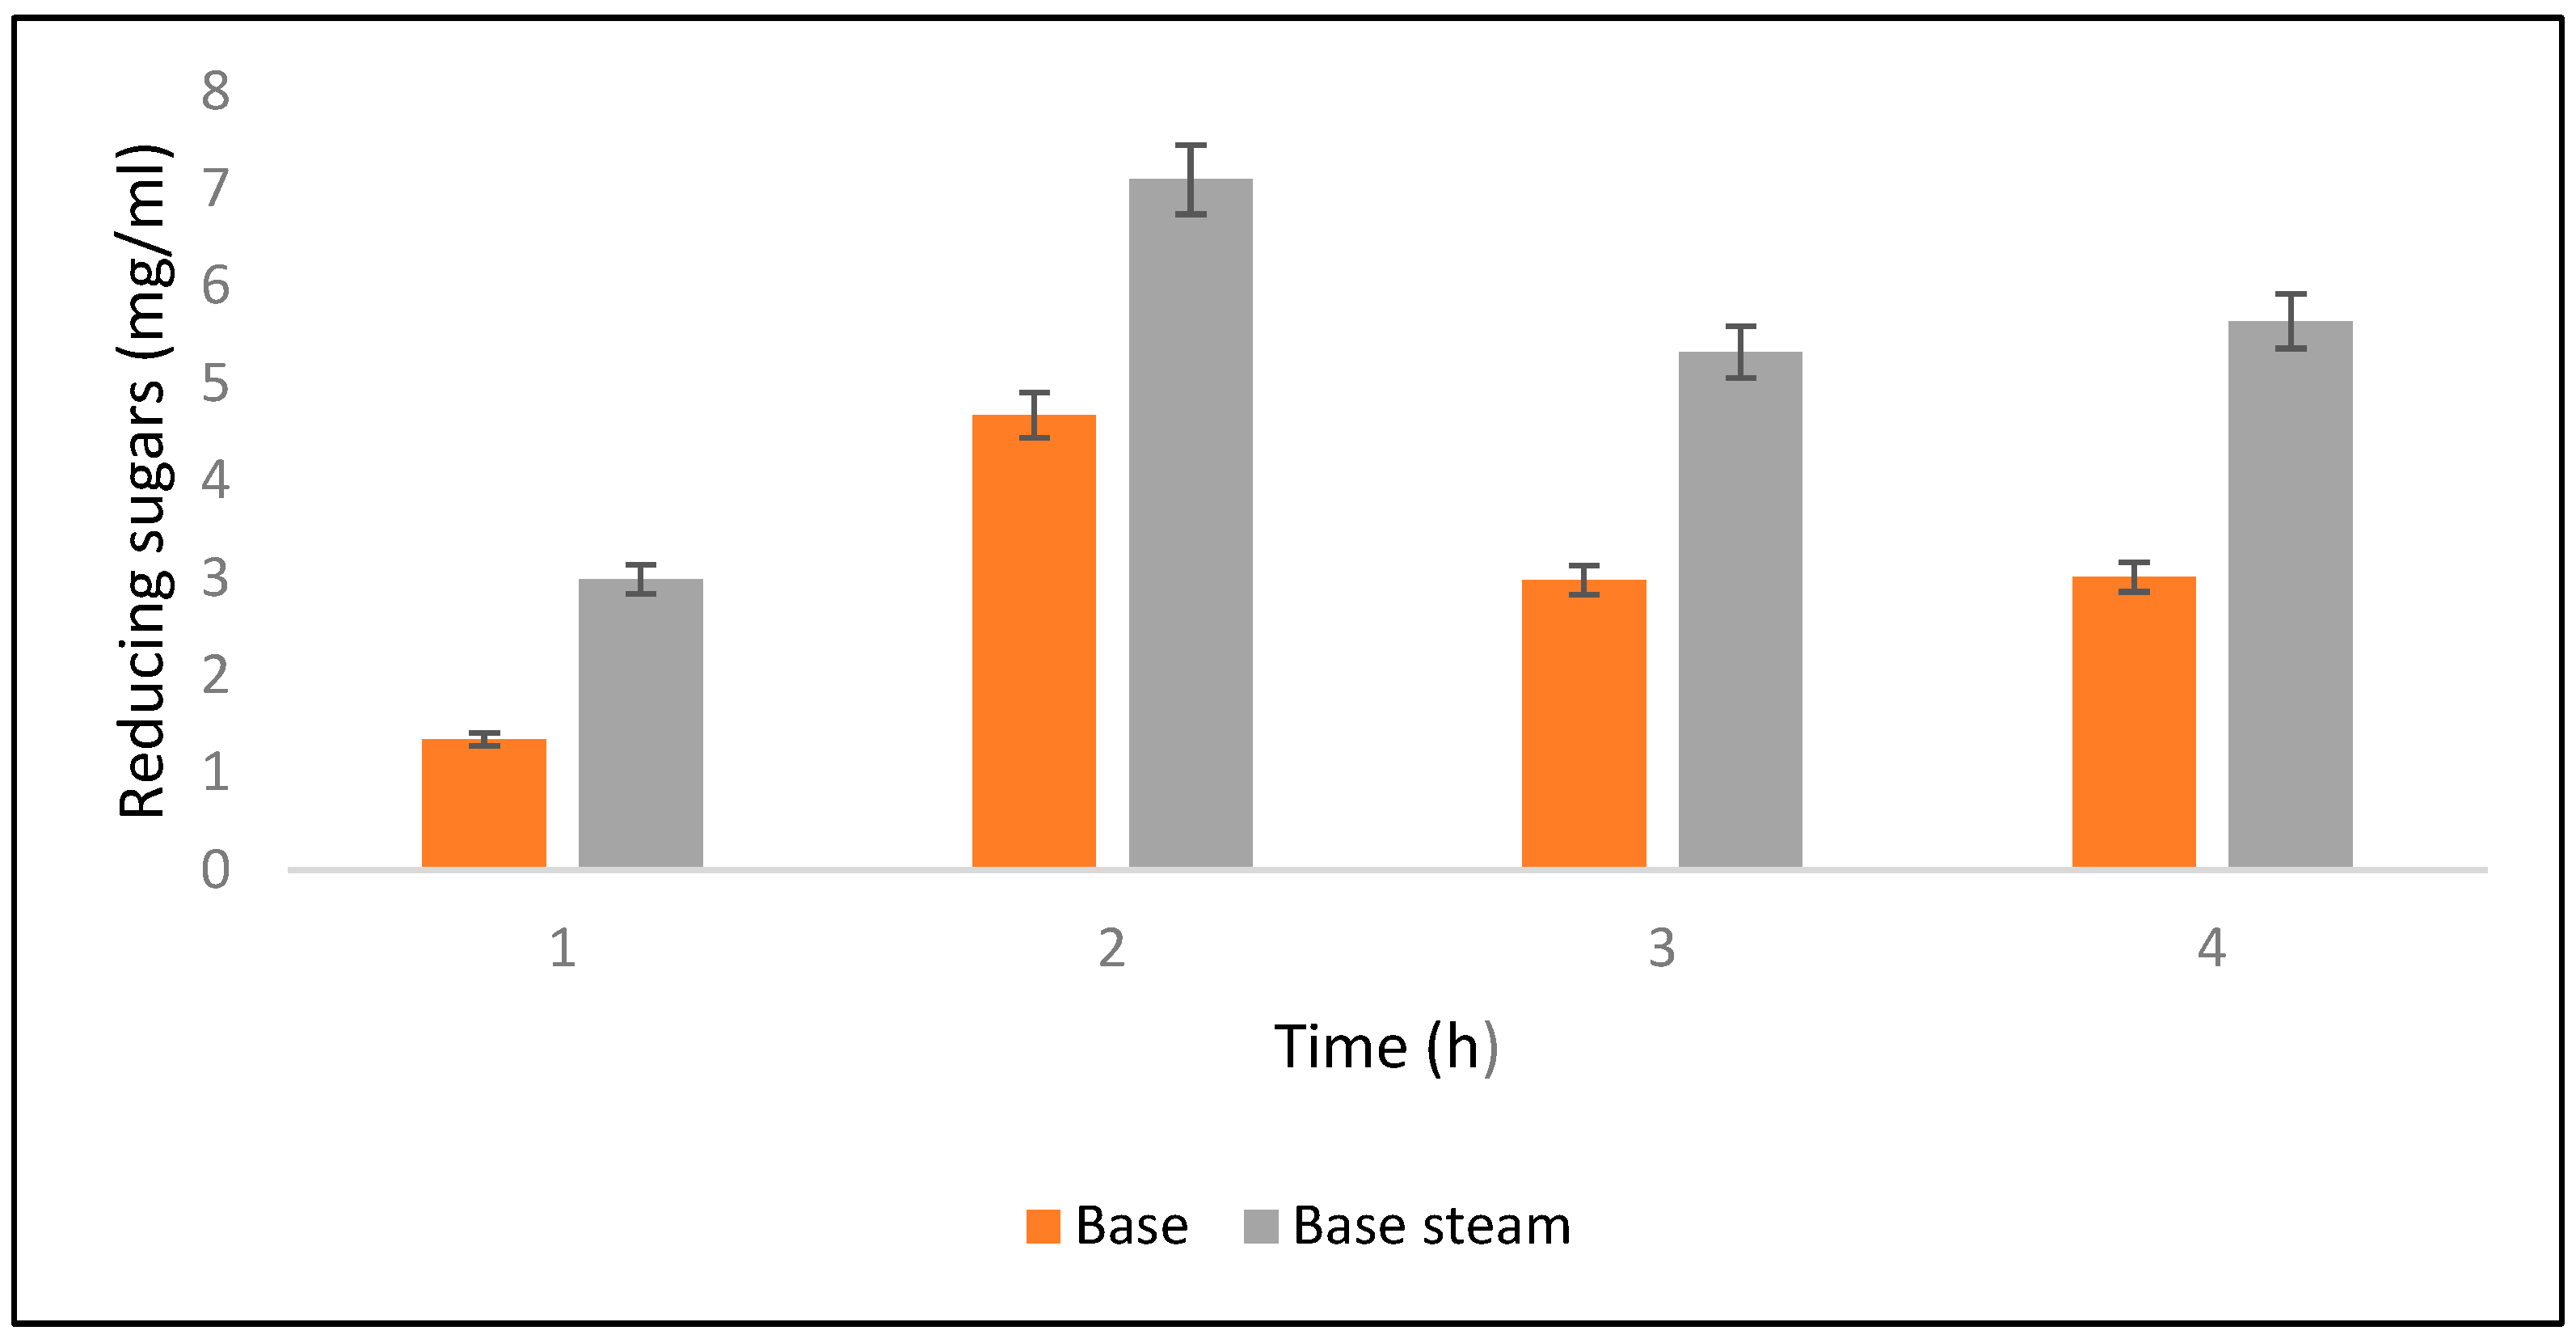
Saccharification was checked at different time intervals such as 4, 6, 8, and 10 h after alkali hydrolysis. Results revealed that maximum saccharification (0.70%) was obtained after 6 h of alkali-assisted autoclave treatment, whereas minimum saccharification (0.029%) was observed after 10 h. Meanwhile, for alkali-treated PPW maximum saccharification was observed as 0.013% (Figure 6). Ben Taher et al. [62] have reported a high saccharification yield using alkali treated PPW.
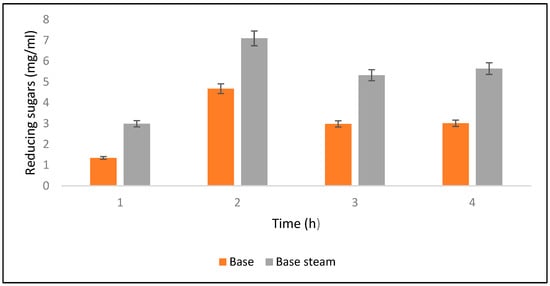
Figure 6.
Yields of reducing sugars released after alkali and alkali-plus-steam hydrolysis from the PPW post treatments.
3. Materials and Methods
3.1. Substrate
In Pakistan, as in many other countries, potatoes represent one of the major staple foods. Their peels, however, are usually discarded [63,64,65]. PPW were obtained from a local fries shop (Gate No.4, Quaid-e-azam campus University of Punjab, Lahore, Pakistan). They were properly washed to remove all dirt, sun dried for 24 h and oven dried at 50 °C for 48 h until consistent weight. They were powdered by an electric mill to obtain a uniform size of 1 mm. The PPW was stored in air tight containers at room temperature (25 ± 5 °C) until use.
3.2. Pretreatment
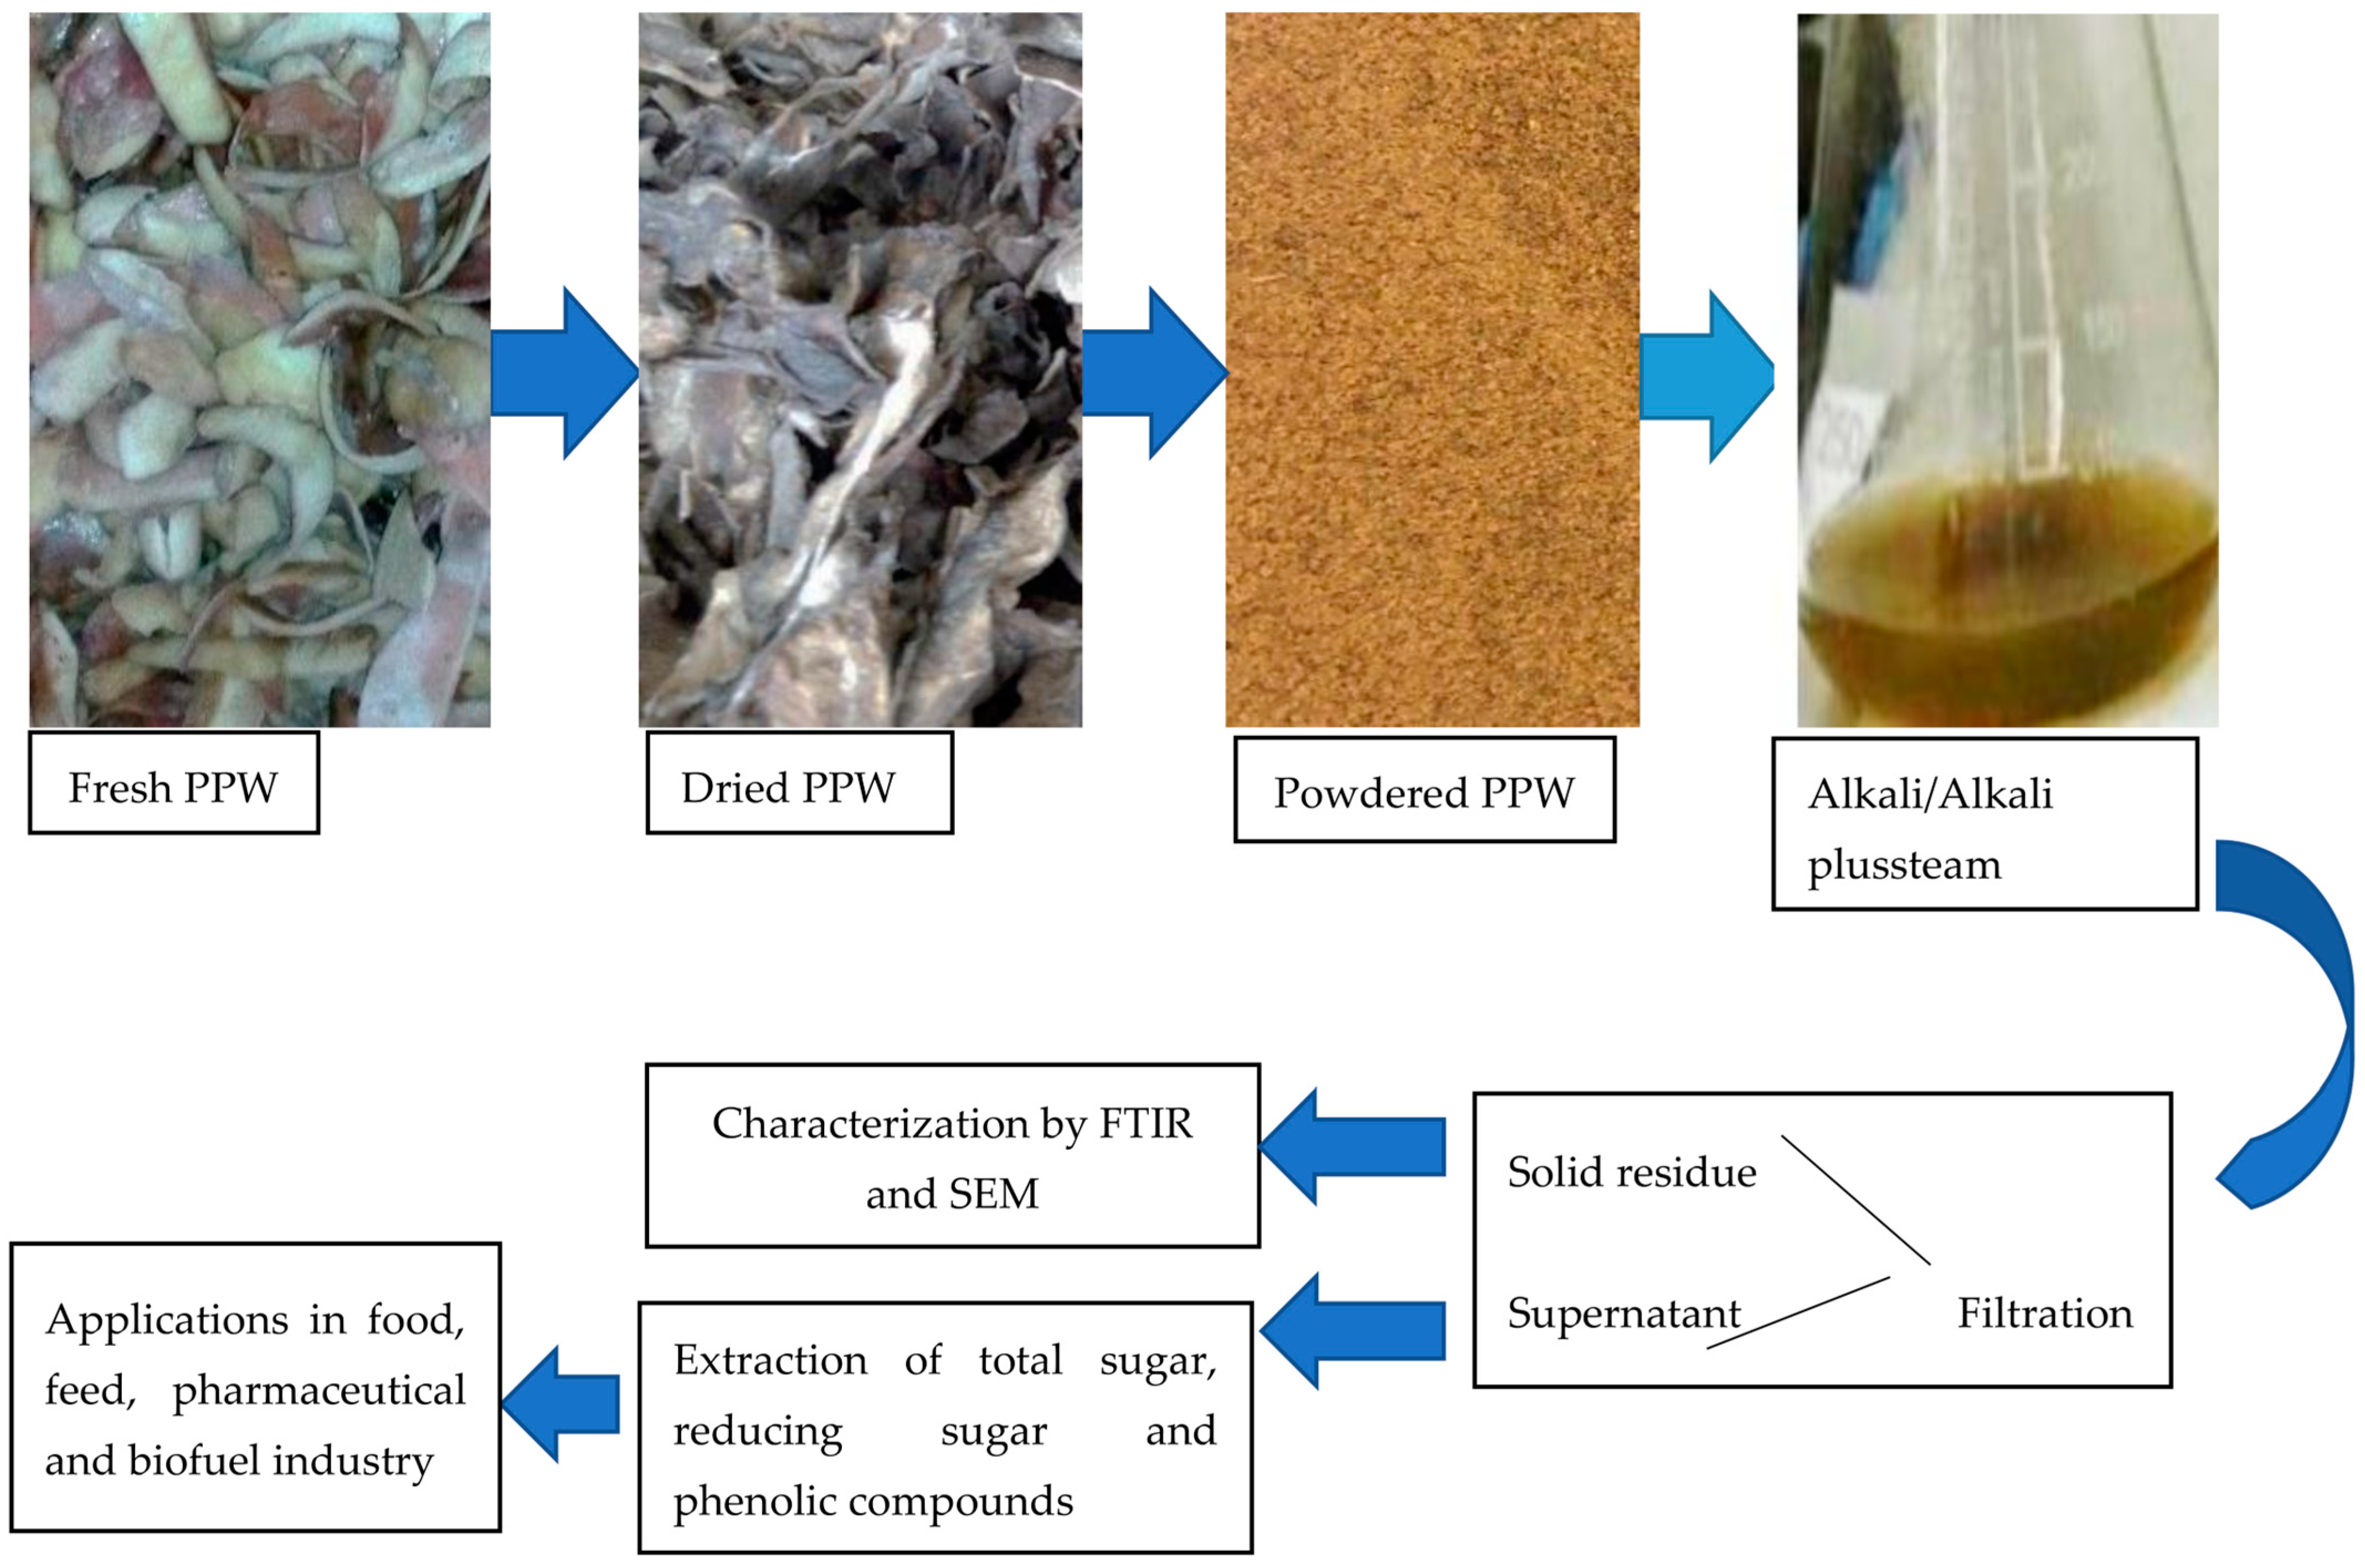
Pretreatment was carried out using two methods, chemical (NaOH) and thermochemical (NaOH-assisted autoclaving).All experiments were carried out in 250 mL Erlenmeyer flasks with a working volume of 100 mL, in triplicates. Different concentrations of substrate were soaked in dissimilar concentrations of NaOH according to the experimental design for different time periods. Following the soaking process, the pretreatment reactors were subjected to pressurized heat at 121 °C, 21 psi for 15 min. Following the treatment process, all samples were filtered, and clear liquid was used to assess the value of RS, TS and TPC. The pH value of the clear filtrate was adjusted to approximately 6.0 (Figure 7).
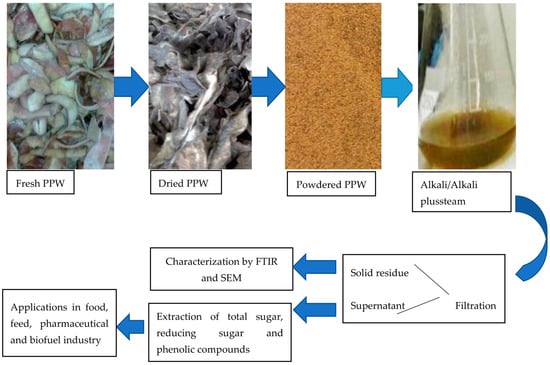
Figure 7.
A schematic overview of value added compounds from PPW.
3.3. Experimental Design
RSM with three factors and three levels were used to optimize pretreatment process in this work. The independent factors used were substrate concentration (X1), NaOH concentration (X2) and time (X3), which were varied in the range of 5–15 g, 0.6–1.0% and 4–8 h, respectively (Table 1). A total of 17 experiments were carried out in triplicates. The experimental data were fitted in the quadratic polynomial model equation relating the input parameters to yield.
The yield was calculated from the following equation using the Minitab software (16th version).
where Y is the response, b0 is the intercept, b1X1 to b3X3 are linear coefficients, b11X12 to b33X32 are quadratic coefficients and b12X1 X2 to b23X2 X3 are interactive coefficients.
Y = b0+ b1X1+ b2X2+ b3X3+ b11X12+ b22X22+ b33X32+ b12X1 X2+ b13X1 X3+ b23X2 X3
3.4. Analytical Methods
After pretreatment, the filtrate was analyzed for the estimation of RS, TS and TP. Total sugars and reducing sugars released during pretreatment were estimated by [66] and the DNS method [67]. Total phenolic compounds released in the filtrate were estimated by [68].
3.4.1. Determinations of TS and RS
TS and RS released following pretreatment were estimated. Glucose was used as the standard, and a series of glucose solutions (0.05–0.4 mg/mL) was prepared to establish the standard curve. For the analysis of total sugar, 0.5 mL of 5% phenol was added to the 0.5 mL of the sample in each test tube. Afterwards, 2.5 mL of sulphuric acid was added to each test tube, and the contents were shaken well. After 10 min, the test tubes were placed in a water bath at 25–30 °C for 20 min. Thereafter, the colour was read at 490 nm.
For the analysis of RS, 0.5 mL of the sample was taken in a test tube to which 1.5 mL of 3,5-Dinitrosalicylic acid (DNS) was added; it was shaken well and covered with aluminium foil. After 10 min, all test tubes were kept in a boiling water bath for 10–15 min. The colour developed was read at 546 nm.
3.4.2. Determination of TPC
For the estimation of phenolic compounds, a series of gallic acid solutions (0.01–0.35 mg/mL) was used to prepare the standard curve. For the analysis, 0.5 mL of a sample was taken in a test tube to which 2.5 mL of diluted Folin-Ciocalteu (FC) reagent was added. After 5–10 min, 1 mL of 1 M Na2CO3 solution was added. Test tubes were shaken well and placed at room temperature; the absorbance was then measured at 760 nm.
3.5. Infrared Spectroscopy Analysis
The absorption spectra of the treated and untreated substrate were obtained using FTIR spectroscopy (Agilent technologies Cary 630, Santa Clara, CA, USA). The FTIR spectra of the samples were recorded in the range of 4000–400 cm−1.
3.6. Scanning Electron Microscopy (SEM)
SEM analysis was conducted to examine the size, shape and morphology of the samples and to compare the topographical modifications in the alkali-treated samples with those in the control substrate. SEM analysis was performed using a Jeol JSM-6490LA microscope, Tokyo, Japan. The sample analysis was conducted with an accelerating voltage of 10 kV at a working distance of 15 mm, and the microscope’s beam intensity was set at 11. Sample preparation for SEM involved suspending 1 mg of the powdered potato peel sample in 1 mL of distilled water in a 1.5 mL Eppendorf tube. The suspension was then sonicated for 1–2 min at 60 amplitudes with 0.5 cycles using a probe sonicator. The Eppendorf tube was placed in a −20 °C freezer overnight. The sample suspension was thawed and sonicated again. One hundred μL of the suspension was taken and resuspended in 900μLof distilled water and subjected to another round of sonication. Subsequently, this suspension was placed in a freezer for 3 h. Meanwhile, glass slides were cut into 1 cm2 pieces which were then washed with 70% ethanol and placed in an oven at 70 °C for 1 h. The frozen sample was taken out, thawed and sonicated. A drop of the sample was then placed on a heated slide, which was then dried in an oven overnight.
Following this, the sample was sputter-coated with carbon using a sputter coater model (Jeol JFC-1500, Tokyo, Japan). The coated sample slide was affixed to conductive tape stubs and subjected to SEM analysis. SEM images of the potato peel samples were acquired and analyzed at various magnifications, resolutions and angles.
3.7. Alkali Saccharification of PPW
Dilute alkali solutions (0.6–1.0 w/v) were used for PPW hydrolysis. Saccharification was performed using two methods via alkali and alkali-plus-steam treatment. Five grams of PPW and a solution of sodium hydroxide (w/v) were added in an Erlenmeyer flask with a capacity of 250 mL and covered with aluminium foil. The PPW mixture with specific parameters was kept in a shaking incubator at 100 rpm at 37 °C. The filtration of the hydrolysed mixture was completed using Whatman filter paper No.1. The filtrates were checked after 4, 6, 8 and 10 h. Samples were taken at the same intervals to determine RS. The saccharification (%) was measured by the following formula [69]:
3.8. Mass Balance
To calculate mass balance, pretreated liquid was carefully filtered through Whatman filter paper No.1. Afterwards, filter papers containing the substrate were placed in an oven at 50 °C until consistent mass. The following formula was used to calculate solubility index (S.I):
4. Conclusions
In this work, alkali and alkali-plus-steam treatments were used to extract bioactive compounds from PPW. The alkali-assisted steam treatment was found to be very effective and yielded 4.064 mg/mL of phenolic compounds from PPW. Optimum extractions of RS and TS were measured as 7.163 and 28.971 mg/mL, respectively. The maximum yield of phenolic compounds revealed that the lignin part was degraded. Lignin degradation makes the treated substrate more accessible for enzymatic hydrolysis, which subsequently boosts the saccharification process. The simple and cost-effective strategy of the deconstruction of PPW into valuable products is promising for the provision of various feedstocks to biotechnological processes with the sustainable management of food wastes. The alkaline treatments may render the PPW a cost-effective substrate for various biotechnological processes, whilst the waste microbial content will also be reduced for a better urban environment.
Author Contributions
Conceptualization, Q.M.; Methodology, Q.M.; Software, Q.M.; Validation, Q.M.; Formal analysis, Q.M.; Investigation, Q.M.; Resources, Q.M.; Data curation, Q.M.; Writing—original draft, Q.M.; Writing—review & editing, Q.M. and P.M.; Supervision, J.I.Q.; Project administration, N.J. All authors have read and agreed to the published version of the manuscript.
Funding
This research received no external funding.
Institutional Review Board Statement
No Ethical concern was raised during this study as no animal or human was used for this study.
Informed Consent Statement
This research work is original, has not been previously published, and is not under consideration for publication elsewhere. Therefore all authors give their consent for this publication.
Data Availability Statement
All the data used for this study is present in this manuscript.
Conflicts of Interest
All authors declare that there was no competing of interest. We the undersigned have read the article titled “Optimization of alkali treatment for production of fermentable sugars and phenolic compounds from potato peel waste using topographical characterization and FTIR spectroscopy”. We approve the proof for publishing in upcoming issue. We declare that our work is original and it is not being considered for potential publication elsewhere. All authors are in agreement with the content of the manuscript. We hereby acknowledge the submission to the journal.
Sample Availability
Not applicable.
References
- Sawicka, B.; Skiba, D.; Barbaś, P. Food and Agricultural Byproducts as Important Source of Valuable Nutraceuticals, 1st ed.; Springer International Publishing: Cham, Switzerland, 2022; pp. 19–37. [Google Scholar]
- Mushtaq, Q.; Irfan, M.; Tabssum, F.; Iqbal Qazi, J. Potato peels: A potential food waste for amylase production. J. Food Process Eng. 2017, 40, e12512–e12519. [Google Scholar] [CrossRef]
- Irfan, M.; Mushtaq, Q.; Tabssum, F.; Shakir, H.A.; Qazi, J.I. Carboxymethylcellulase production optimization from newly isolated thermophilic Bacillus subtilis K-18 for saccharification using response surface methodology. AMB Express 2017, 7, 1–9. [Google Scholar] [CrossRef] [PubMed]
- FAO. Save Food: Global Initiative on Food Loss and Waste Reduction. 2016. Available online: http://www.fao.org/3/i4068e/i4068e.pdf (accessed on 19 October 2023).
- Food Wastage Footprint (Project). Food Wastage Footprint: Impacts on Natural Resources. Summary Report; Food & Agriculture Organization of the UN (FAO): Paris, France, 2013. [Google Scholar]
- FAO. Agriculture Organization of the United Nations Statistics Division. Economic and Social Development Department. 2016. Available online: https://www.fao.org/faostat/en/#home (accessed on 19 October 2023).
- Schieber, A.; Stintzing, F.C.; Carle, R. By-products of plant food processing as a source of functional compounds—Recent developments. Trends Food Sci. Technol. 2001, 12, 401–413. [Google Scholar] [CrossRef]
- Arapoglou, D.; Varzakas, T.; Vlyssides, A.; Israilides, C. Ethanol production from potato peel waste (PPW). Waste Manag. 2010, 30, 1898–1902. [Google Scholar] [CrossRef] [PubMed]
- Freidmen, M. Chemistry biochemistry and dietary role of potato polyphenols. J. Agric. Food Chem. 1997, 45, 1523–1540. [Google Scholar] [CrossRef]
- Al-Weshahy, A.; Rao, A.V. Isolation and characterization of functional components from peel samples of six potatoes varieties growing in Ontario. Food Res. Int. 2009, 43, 1062–1068. [Google Scholar] [CrossRef]
- Abeyrathne, E.D.N.S.; Nam, K.; Huang, X.; Ahn, D.U. Plant-and animal-based antioxidants’ structure, efficacy, mechanisms, and applications: A review. Antioxidants 2022, 11, 1025. [Google Scholar] [CrossRef]
- Ramaswamy, U.R.; Kabel, M.A.; Schols, H.A.; Gruppen, H. Structural features and water holding capacities of pressed potato fibre polysaccharides. Carbohydr. Polym. 2013, 93, 589–596. [Google Scholar] [CrossRef]
- Jeddou, K.B.; Bouaziz, F.; Zouari-Ellouzi, S.; Chaari, F.; Ellouz-Chaabouni, S.; EllouzGhorbel, R.; Nouri-Ellouz, O. Improvement of texture and sensory properties of cakes by addition of potato peel powder with high level of dietary fiber and protein. Food Chem. 2017, 217, 668–677. [Google Scholar] [CrossRef]
- Nazir, A.; Itrat, N.; Ahmad, U.; Yar, S.A.; Fatima, K.; Naeem, M.; Zafar, N. Development and sensory evaluation of potato (Solanum tuberosum) peel powder incorporated muffins for health. Pure Appl. Biol. 2021, 11, 129–134. [Google Scholar] [CrossRef]
- Haleem, N.; Osabutey, A.; Albert, K.; Zhang, C.; Min, K.; Anderson, G.; Yang, X. Flocculation of livestock wastewater using cationic starch prepared from potato peels. Environ. Sci. Water Res. Technol. 2023, 9, 1690–1700. [Google Scholar] [CrossRef]
- Vázquez, M.; Puertas, G.; Cazón, P. Processing of Grape Bagasse and Potato Wastes for the Co-Production of Bacterial Cellulose and Gluconic Acid in an Airlift Bioreactor. Polymers 2023, 15, 3944. [Google Scholar] [CrossRef] [PubMed]
- Das, S.; Lee, S.; Kumar, P.; Kim, K.H.; Lee, S.S.; Bhattacharya, S.S. Solid waste management: Scope and the challenge of sustainability. J. Clean. Prod. 2019, 228, 658–678. [Google Scholar] [CrossRef]
- Pujara, Y.; Pathak, P.; Sharma, A.; Govani, J. Review on Indian Municipal Solid Waste Management practices for reduction of environmental impacts to achieve sustainable development goals. J. Environ. Manag. 2019, 248, 1–14. [Google Scholar] [CrossRef] [PubMed]
- Kim, S.; Lee, Y.; Lin, K.Y.A.; Hong, E.; Kwon, E.E.; Lee, J. The valorization of food waste via pyrolysis. J. Clean. Prod. 2020, 259, 1–13. [Google Scholar] [CrossRef]
- Zhang, Y.; Ma, Z.; Fang, Z.; Qian, Y.; Zhong, P.; Yan, J. Review of harmless treatment of municipal solid waste incineration fly ash. Waste Dispos. Sustain. Energy 2020, 2, 1–25. [Google Scholar] [CrossRef]
- Aracil, C.; Haro, P.; Fuentes-Cano, D.; Gómez-Barea, A. Implementation of waste-to-energy options in landfill-dominated countries: Economic evaluation and GHG impact. Waste Manag. 2018, 76, 443–456. [Google Scholar] [CrossRef]
- Souza, W.D.; Rodrigues, W.S.; Lima Filho, M.M.; Alves, J.J.; Oliveira, T.M. Heavy metals uptake on Malpighiaemarginata DC seed fiber microparticles: Physicochemical characterization, modeling and application in landfill leachate. Waste Manag. 2018, 78, 356–365. [Google Scholar] [CrossRef]
- Liu, S.J.; Xi, B.D.; Qiu, Z.P.; He, X.S.; Zhang, H.; Dang, Q.L.; Zhao, X.Y.; Li, D. Succession and diversity of microbial communities in landfills with depths and ages and its association with dissolved organic matter and heavy metals. Sci. Total Environ. 2019, 651, 909–916. [Google Scholar] [CrossRef]
- Kumar, S.S.; Kumar, V.; Kumar, R.; Malyan, S.K.; Bishnoi, N.R. Ferrous sulfate as an in-situ anodic coagulant for enhanced bioelectricity generation and COD removal from landfill leachate. Energy 2019, 176, 570–581. [Google Scholar] [CrossRef]
- Fei, J.C.; Min, X.B.; Wang, Z.X.; Pang, Z.H.; Liang, Y.J.; Ke, Y. Health and ecological risk assessment of heavy metals pollution in an antimony mining region: A case study from South China. Environ. Sci. Pollut. Res. 2017, 24, 27573–27586. [Google Scholar] [CrossRef] [PubMed]
- Zhang, Y.; Wang, L.; Chen, L.; Ma, B.; Zhang, Y.; Ni, W.; Tsang, D.C. Treatment of municipal solid waste incineration fly ash: State-of-the-art technologies and future perspectives. J. Hazard. Mater. 2021, 411, 125132. [Google Scholar] [CrossRef] [PubMed]
- Cai, Q.-Y.; Mo, C.-H.; Wu, Q.-T.; Zeng, Q.-Y.; Katsoyiannis, A. Concentration and speciation of heavy metals in six different sewage sludge-composts. J. Hazard. Mater. 2007, 147, 1063–1072. [Google Scholar] [CrossRef] [PubMed]
- Bai, J.; Shen, H.; Dong, S. Study on eco-utilization and treatments of highway greening waste. Proc. Environ. Sci. 2010, 2, 25–31. [Google Scholar] [CrossRef]
- Yu, H.; Xie, B.; Khan, R.; Shen, G. The changes in carbon, nitrogen components and humic substances during organic-inorganic aerobic co-composting. Bioresour. Technol. 2019, 271, 228–235. [Google Scholar] [CrossRef] [PubMed]
- Ayilara, M.S.; Olanrewaju, O.S.; Babalola, O.O.; Odeyemi, O. Waste management through composting: Challenges and potentials. Sustainability 2020, 12, 4456. [Google Scholar] [CrossRef]
- Calcio Gaudino, E.; Colletti, A.; Grillo, G.; Tabasso, S.; Cravotto, G. Emerging processing technologies for the recovery of valuable bioactive compounds from potato peels. Foods 2020, 9, 1598. [Google Scholar] [CrossRef]
- Sujeeta, K.M.; Mehta, S.; Sihag, K. Optimization of conditions for bioethanol production from potato peel waste. Int. J. Chem. Stud. 2018, 6, 2021–2024. [Google Scholar]
- Chohan, N.A.; Aruwajoye, G.S.; Sewsynker-Sukai, Y.; Kana, E.G. Valorisation of potato peel wastes for bioethanol production using simultaneous saccharificationand fermentation: Process optimization and kinetic assessment. Renew. Energ. 2020, 146, 1031–1040. [Google Scholar] [CrossRef]
- Soltaninejad, A.; Jazini, M.; Karimi, K. Sustainable bioconversion of potato peel wastes into ethanol and biogas using organosolv pretreatment. Chemosphere 2022, 291, 133003. [Google Scholar] [CrossRef]
- Rodríguez-Martínez, B.; Coelho, E.; Gullón, B.; Yáñez, R.; Domingues, L. Potato peels waste as a sustainable source for biotechnological production of biofuels: Process optimization. Waste Manag. 2023, 155, 320–328. [Google Scholar] [CrossRef] [PubMed]
- Singh, P.P.; Saldana, M.D.A. Subcritical water extraction of phenolic compounds from potato peel. Food Res. Int. 2011, 44, 2452–2458. [Google Scholar] [CrossRef]
- Chen, M.S.; Zhao, Y.; Yu, S.J. Optimisation of ultrasonic-assisted extraction of phenolic compounds, antioxidants, and anthocyanins from sugar beet molasses. Food Chem. 2015, 172, 543–550. [Google Scholar] [CrossRef] [PubMed]
- Alvarez, V.H.; Cahyadi, J.; Xu, D.Y.; Saldana, M.D.A. Optimization of phytochemicals production from potato peel using subcritical water: Experimental and dynamic modeling. J. Supercrit. Fluids 2014, 90, 8–17. [Google Scholar] [CrossRef]
- Maldonado, A.F.S.; Mudge, E.; Ganzle, M.G.; Schieber, A. Extraction and fractionation of phenolic acids and glycoalkaloids from potato peels using acidified water/ethanol-based solvents. Food Res. Int. 2014, 65, 27–34. [Google Scholar] [CrossRef]
- Suryanto, H.; Wijaya, H.W.; Yanuhar, U. FTIR analysis of alkali treatment on bacterial cellulose films obtained from pineapple peel juice. IOP Conf. Ser. Mater. Sci. Eng. 2021, 1034, 012145. [Google Scholar] [CrossRef]
- Mishra, S.; Prabhakar, B.; Kharkar, P.S.; Pethe, A.M. Banana peel waste: An emerging cellulosic material to extract nanocrystalline cellulose. ACS Omega 2022, 8, 1140–1145. [Google Scholar] [CrossRef]
- Srivastava, N.; Mohammad, A.; Pal, D.B.; Srivastava, M.; Alshahrani, M.Y.; Ahmad, I.; Singh, R.; Mishra, P.K.; Yoon, T.; Gupta, V.K. Enhancement of fungal cellulase production using pretreated orange peel waste and its application in improved bioconversion of rice husk under the influence of nickel cobaltite nanoparticles. Biomass Convers. Biorefin. 2022, 12, 1–10. [Google Scholar] [CrossRef]
- Esmer, Ö.K.; Koçak, E.; Cevrem, A.E.; Kıcıkoğlu, O. Alkali extraction of phenolic compounds from tomato peel: Optimization of extraction conditions and investigation of phenolic profile by LC-MS/MS. TURJAF 2022, 10, 2966–2976. [Google Scholar]
- Cao, C.; Yi, B.; Zhang, J.; Hou, C.; Wang, Z.; Lu, G.; Huang, X.; Yao, X. Sprayable superhydrophobic coating with high processibility and rapid damage-healing nature. Chem. Eng. J. 2020, 392, 124834. [Google Scholar] [CrossRef]
- Wang, L.; Boussetta, N.; Lebovka, N.; Vorobiev, E. Cell disintegration of apple peels induced by pulsed electric field and efficiency of bio-compound extraction. Food Biop. Process. 2020, 122, 13–21. [Google Scholar] [CrossRef]
- Pal, C.B.T.; Jadeja, G.C. Microwave-assisted extraction for recovery of polyphenolic antioxidants from ripe mango (Mangiferaindica L.) peel using lactic acid/sodium acetate deep eutectic mixtures. Food Sci. Technol. Int. 2020, 26, 78–92. [Google Scholar] [CrossRef] [PubMed]
- Soni, S.K.; Sharma, B.; Sharma, A.; Thakur, B.; Soni, R. Exploring the Potential of Potato Peels for Bioethanol Production through Various Pretreatment Strategies and an In-House-Produced Multi-Enzyme System. Sustainability 2023, 15, 9137. [Google Scholar] [CrossRef]
- Mazaheri, D.; Pirouzi, A. Valorization of Zymomonasmobilis for bioethanol production from potato peel: Fermentation process optimization. Biomass Convers. Biorefin. 2022, 12, 3389–3398. [Google Scholar] [CrossRef]
- Zhu, X.; Cheng, Y.; Chen, P.; Peng, P.; Liu, S.; Li, D.; Ruan, R. Effect of alkaline and high-pressure homogenization on the extraction of phenolic acids from potato peels. Innov. Food Sci. Emerg. Technol. 2016, 37, 91–97. [Google Scholar] [CrossRef]
- Xu, G.Y.; Liao, A.M.; Huang, J.H.; Zhang, J.G.; Thakur, K.; Wei, Z.J. Evaluation of structural, functional, and anti-oxidant potential of differentially extracted polysaccharides from potatoes peels. Int. J. Biol. Macromol. 2019, 129, 778–785. [Google Scholar] [CrossRef]
- Lu, Y.; Zhang, Q.; Wang, X.; Zhou, X.; Zhu, J. Effect of pH on volatile fatty acid production from anaerobic digestion of potato peel waste. Bioresour. Technol. 2020, 316, 123851. [Google Scholar] [CrossRef]
- Nemadziva, B.; Ngubane, S.; Matiza Ruzengwe, F.; Kasumbwe, K.; Kudanga, T. Potato peels as feedstock for laccase-catalysed synthesis of phellinsin A. Biomass Convers. Biorefin. 2023, 13, 13871–13882. [Google Scholar] [CrossRef]
- El-Azazy, M.; El-Shafie, A.S.; Issa, A.A.; Al-Sulaiti, M.; Al-Yafie, J.; Shomar, B.; Al-Saad, K. Potato peels as an adsorbent for heavy metals from aqueous solutions: Eco-structuring of a green adsorbent operating Plackett–Burman design. J. Chem. 2019, 2019, 1–14. [Google Scholar] [CrossRef]
- Bodirlau, R.; Teaca, C.A.; Spiridon, I. Chemical modification of beech wood: Effect on thermal stability. Bioresources 2008, 3, 789–800. [Google Scholar] [CrossRef]
- Bouhadjra, K.; Lemlikchi, W.; Ferhati, A.; Mignard, S. Enhancing removal efficiency of anionic dye (Cibacron blue) using waste potato peels powder. Sci. Rep. 2021, 11, 2090. [Google Scholar] [CrossRef] [PubMed]
- Sanusi, I.; Aruwajoye, G.; Revaprasadu, N.; Sewsynker-Sukai, Y.; Meyer, E.L.; Kana, E.B.G. A novel autoclave-assisted nanoparticle pre-treatment for improved sugar recovery from potato peel waste: Process optimisation, nanoparticle recyclability and bioethanol production. Biomass Convers. Biorefin. 2022, 12, 1–13. [Google Scholar] [CrossRef]
- Daimary, N.; Eldiehy, K.S.; Boruah, P.; Deka, D.; Bora, U.; Kakati, B.K. Potato peels as a sustainable source for biochar, bio-oil and a green heterogeneous catalyst for biodiesel production. J. Environ. Chem. Eng. 2022, 10, 107108. [Google Scholar] [CrossRef]
- Ghazanfar, M.; Nadeem, M.; Shakir, H.A.; Khan, M.; Ahmad, I.; Franco, M.; Chen, L.; Irfan, M. Valorization of Bombaxceiba waste into bioethanol production through separate hydrolysis and fermentation and simultaneous saccharification and fermentation. Ferment 2022, 8, 386. [Google Scholar] [CrossRef]
- Goyi, A.A.; Sher Mohammad, N.M.; Omer, K.M. Preparation and characterization of potato peel derived hydrochar and its application for removal of Congo red: A comparative study with potato peel powder. Int. J. Environ. Sci. Technol. 2023, 20, 1–12. [Google Scholar] [CrossRef]
- Abdelraof, M.; Hasanin, M.S.; El-Saied, H. Ecofriendly green conversion of potato peel wastes to high productivity bacterial cellulose. Carbohydr. Polym. 2019, 211, 75–83. [Google Scholar] [CrossRef]
- Vunain, E.; Njewa, J.B.; Biswick, T.T.; Ipadeola, A.K. Adsorption of chromium ions from tannery effluents onto activated carbon prepared from rice husk and potato peel by H3PO4 activation. Appl. Water Sci. 2021, 11, 150–164. [Google Scholar] [CrossRef]
- Ben Taher, I.; Fickers, P.; Chniti, S.; Hassouna, M. Optimization of enzymatic hydrolysis and fermentation conditions for improved bioethanol production from potato peel residues. Biotechnol. Prog. 2017, 33, 397–406. [Google Scholar] [CrossRef]
- Ali, S.W.; Nawaz, A.; Irshad, S.; Khan, A.A. Potato waste management in Pakistan’s perspective. J. Hyg. Eng. Des. 2015, 13, 100–107. [Google Scholar]
- Wu, D. Recycle technology for potato peel waste processing: A review. Procedia Environ. Sci. 2016, 31, 103–107. [Google Scholar] [CrossRef]
- Abro, N.Q.; Memon, N.; Samejo, B.A.; Halepoto, M.R.; Hakro, A.A. Characterization and capacitive performance assessment of potato peels derived salt-induced porous carbons. Biomass Convers. Biorefin. 2022, 12, 1–9. [Google Scholar] [CrossRef]
- DuBois, M.; Gilles, K.A.; Hamilton, J.K.; Rebers, P.T.; Smith, F. Colorimetric method for determination of sugars and related substances. Anal. Chem. 1956, 28, 350–356. [Google Scholar] [CrossRef]
- Miller, G.L. Use of dinitrosalicylic acid reagent for determination of reducing sugar. Anal. Chem. 1959, 31, 426–428. [Google Scholar] [CrossRef]
- Sanz, V.C.; Mena, M.L.; González-Cortés, A.; Yanez-Sedeno, P.; Pingarrón, J.M. Development of a tyrosinase biosensor based on gold nanoparticles-modified glassy carbon electrodes: Application to the measurement of a bioelectrochemical polyphenols index in wines. Anal. Chim. Acta 2005, 528, 1–8. [Google Scholar] [CrossRef]
- Irfan, M.; Asghar, U.; Nadeem, M.; Nelofer, R.; Syed, Q.; Shakir, H.A.; Qazi, J.I. Statistical optimization of saccharification of alkali pretreated wheat straw for bioethanol production. Waste Biomass Valori. 2016, 7, 1389–1396. [Google Scholar] [CrossRef]
Disclaimer/Publisher’s Note: The statements, opinions and data contained in all publications are solely those of the individual author(s) and contributor(s) and not of MDPI and/or the editor(s). MDPI and/or the editor(s) disclaim responsibility for any injury to people or property resulting from any ideas, methods, instructions or products referred to in the content. |
© 2023 by the authors. Licensee MDPI, Basel, Switzerland. This article is an open access article distributed under the terms and conditions of the Creative Commons Attribution (CC BY) license (https://creativecommons.org/licenses/by/4.0/).

