Article

Highly Selective and Fast Response/Recovery Cataluminescence Sensor Based on SnO2 for H2S Detection

Guangdong Provincial Academy of Environmental Science, Guangzhou 510045, China
*
Authors to whom correspondence should be addressed.
Molecules 2023, 28(20), 7143; https://doi.org/10.3390/molecules28207143
Submission received: 14 August 2023 / Revised: 2 October 2023 / Accepted: 4 October 2023 / Published: 18 October 2023
(This article belongs to the Section Analytical Chemistry)

Abstract

:
In the present work, three kinds of nanosized SnO2 samples were successfully synthesized via a hydrothermal method with subsequent calcination at temperatures of 500 °C, 600 °C, and 700 °C. The morphology and structure of the as-prepared samples were characterized using X-ray diffraction, transmission electron microscopy, selected area electron diffraction, Brunauer–Emmett–Teller analysis, and X-ray photoelectron spectroscopy. The results clearly indicated that the SnO2 sample calcined at 600 °C had a higher amount of chemisorbed oxygen than the SnO2 samples calcined at 500 °C and 700 °C. Gas sensing investigations revealed that the cataluminescence (CTL) sensors based on the three SnO2 samples all exhibited high selectivity toward H2S, but the sensor based on SnO2−600 °C exhibited the highest response under the same conditions. At an operating temperature of 210 °C, the SnO2−600 °C sensor showed a good linear response to H2S in the concentration range of 20–420 ppm, with a detection limit of 8 ppm. The response and recovery times were 3.5 s/1.5 s for H2S gas within the linear range. The study on the sensing mechanism indicated that H2S was oxidized into excited states of SO2 by chemisorbed oxygen on the SnO2 surface, which was mainly responsible for CTL emission. The chemisorbed oxygen played an important role in the oxidation of H2S, and, as such, the reason for the SnO2−600 °C sensor showing the highest response could be ascribed to the highest amount of chemisorbed oxygen on its surface. The proposed SnO2-based gas sensor has great potential for the rapid monitoring of H2S.

Graphical Abstract

1. Introduction

Hydrogen sulfide (H2S) is a noxious gas that smells like rotten eggs [1,2,3]. Even exposure to a low concentration of H2S can cause serious harmful effects, including damage to the respiratory and central nervous systems [4,5]. Moreover, death occurs immediately upon exposure to a high concentration of H2S. The threshold limit for an 8 h exposure to H2S is 10 ppm, which was established by the Health and Safety Executive [6]. In addition, H2S is also a flammable compound that can cause fires and explosions when exposed to a flame or high temperatures. However, what is more worrying is that H2S is found both in the natural environment and in a variety of production processes, such as oil extraction and metal smelting. In other words, H2S is present in the human living environment. Therefore, in order to prevent harm from H2S, there is an urgent need to develop high-performance gas sensors for the timely detection of H2S.
Cataluminescence (CTL) a kind of in situ chemiluminescence, which occurs through catalytic oxidation reactions at gas–solid interfaces [7,8]. On account of its numerous advantages, such as a rapid response, extraordinary sensitivity, high selectivity, good repeatability, and convenience, CTL-based sensors show promising application in environmental monitoring [9,10], material characterization [11,12], food analysis [13,14], catalyst evaluation [15,16], and clinical diagnosis [17,18,19]. CTL-based sensors are considered one of the most attractive and effective tools for gas sensing. In 2004, Zhang et al. pioneered the development of a CTL-based sensor for H2S using Fe2O3 as the sensing material [20]. Since then, the development of CTL-based sensors for H2S has attracted extensive attention. In particular, the Lv group has conducted a series of innovative studies on the development of a high-performance CTL-based sensor for H2S. Examples include a H2S sensor based on a hierarchical hollow microsphere and flower-like In2O3 [21], a H2S sensor using an α-Fe2O3/g-C3N4 composite [22], and an F-doped cage-like SiC as a metal-free sensing material for H2S [23]. Although significant progress has been made, there are still some drawbacks, such as the high operating temperature, poor selectivity, and complicated procedures for synthesis of the sensing material [24]. Therefore, persistent efforts should be made to overcome these drawbacks.
The sensing material directly determines the sensing performances, including the sensitivity, selectivity, reproducibility, etc. Metal oxide semiconductors have been widely developed as sensing materials owing to their high sensitivity, low cost, good reliability, and fast response [25,26]. Tin dioxide (SnO2) is a stable n-type wide-bandgap semiconducting metal oxide with stable chemical transduction properties [27]. SnO2 easily adsorbs oxygen on its surface because of its natural non-stoichiometry, providing it with high reactivity toward reducing gases [28]. Nowadays, SnO2 is widely used as a base material to design electrical gas sensors for the detection of harmful gas, including H2S [29,30,31,32]. However, electrical gas sensors based on nanostructured SnO2 usually have poor selectivity. It was reported that CTL produced based on a solid catalyst must meet three conditions [33]. First, the reaction must release sufficient energy, but not all of the reactions can release enough energy. Second, the reaction pathway must favor a change in the energy to form an electronically excited molecule. Third, the electronically excited molecule must release its energies via radiative transition but not nonradiative transition. Unfortunately, radiative transition may appear in low proportions. Therefore, CTL sensors show good selectivity due to the three essential conditions described above. However, a CTL sensor using SnO2 for H2S has not been reported, which inspired us to employ SnO2 to design a CTL sensor for H2S to address some of the issues in H2S sensing.
Herein, three kinds of SnO2 were synthesized by a simple hydrothermal method at three different calcination temperatures. Among them, the SnO2 samples annealed at 600 °C (SnO2−600 °C) showed the highest CTL response toward H2S and exhibited sufficient selectivity. Subsequently, the influencing parameters and sensing performance of the SnO2−600 °C sensor were investigated in detail. The sensing mechanism was also explored. Compared with most reported H2S sensors, the outstanding advantage of the present sensor is that it shows high selectivity at a relatively low operating temperature.

2. Results

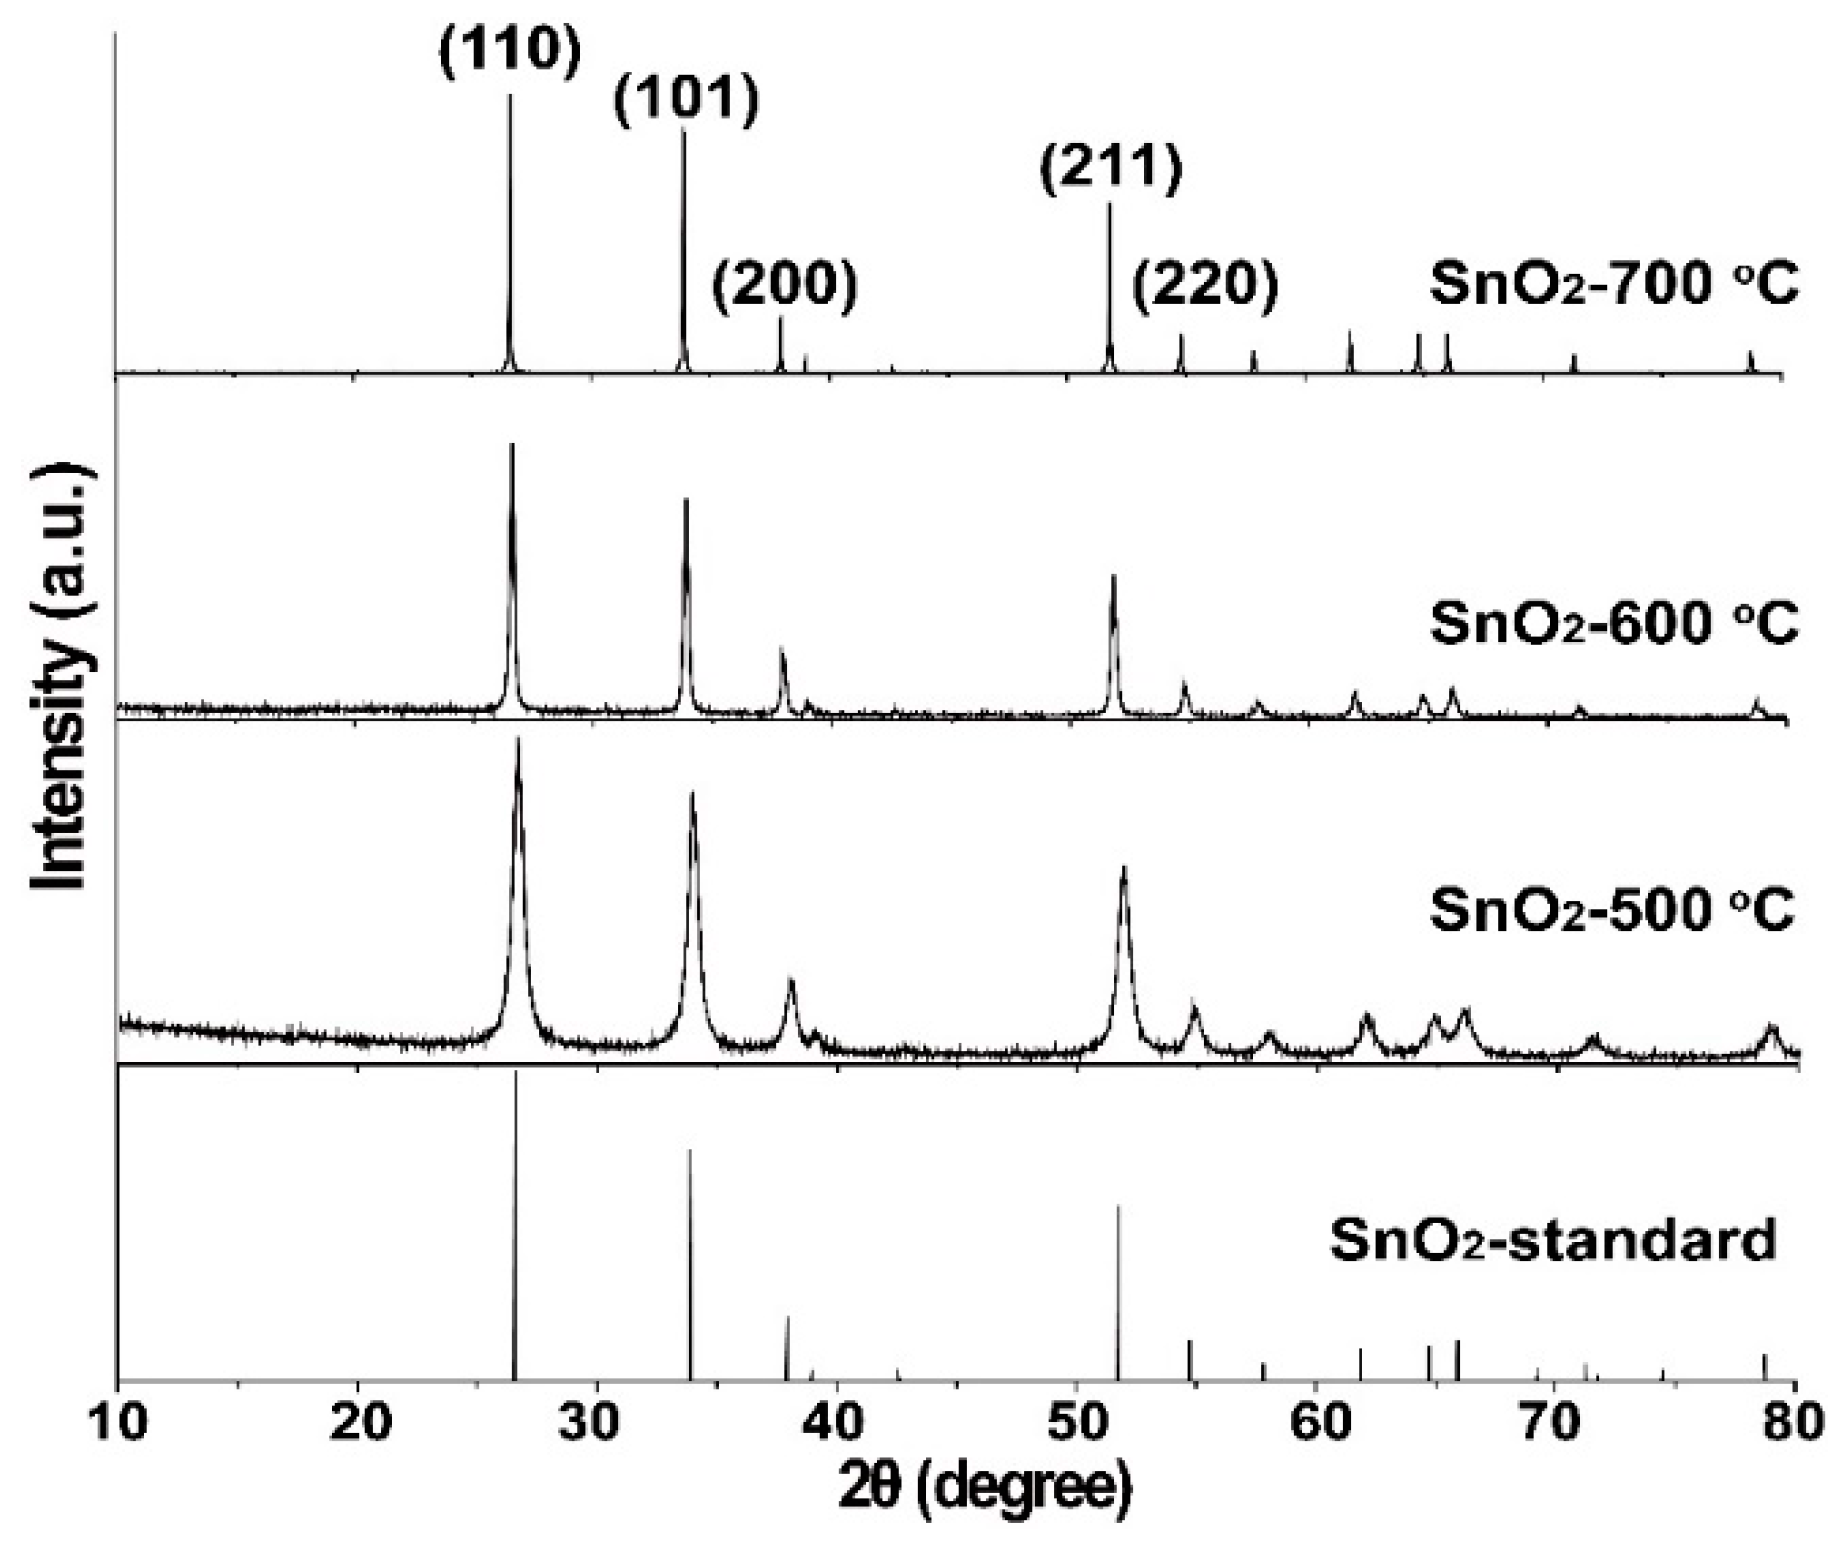
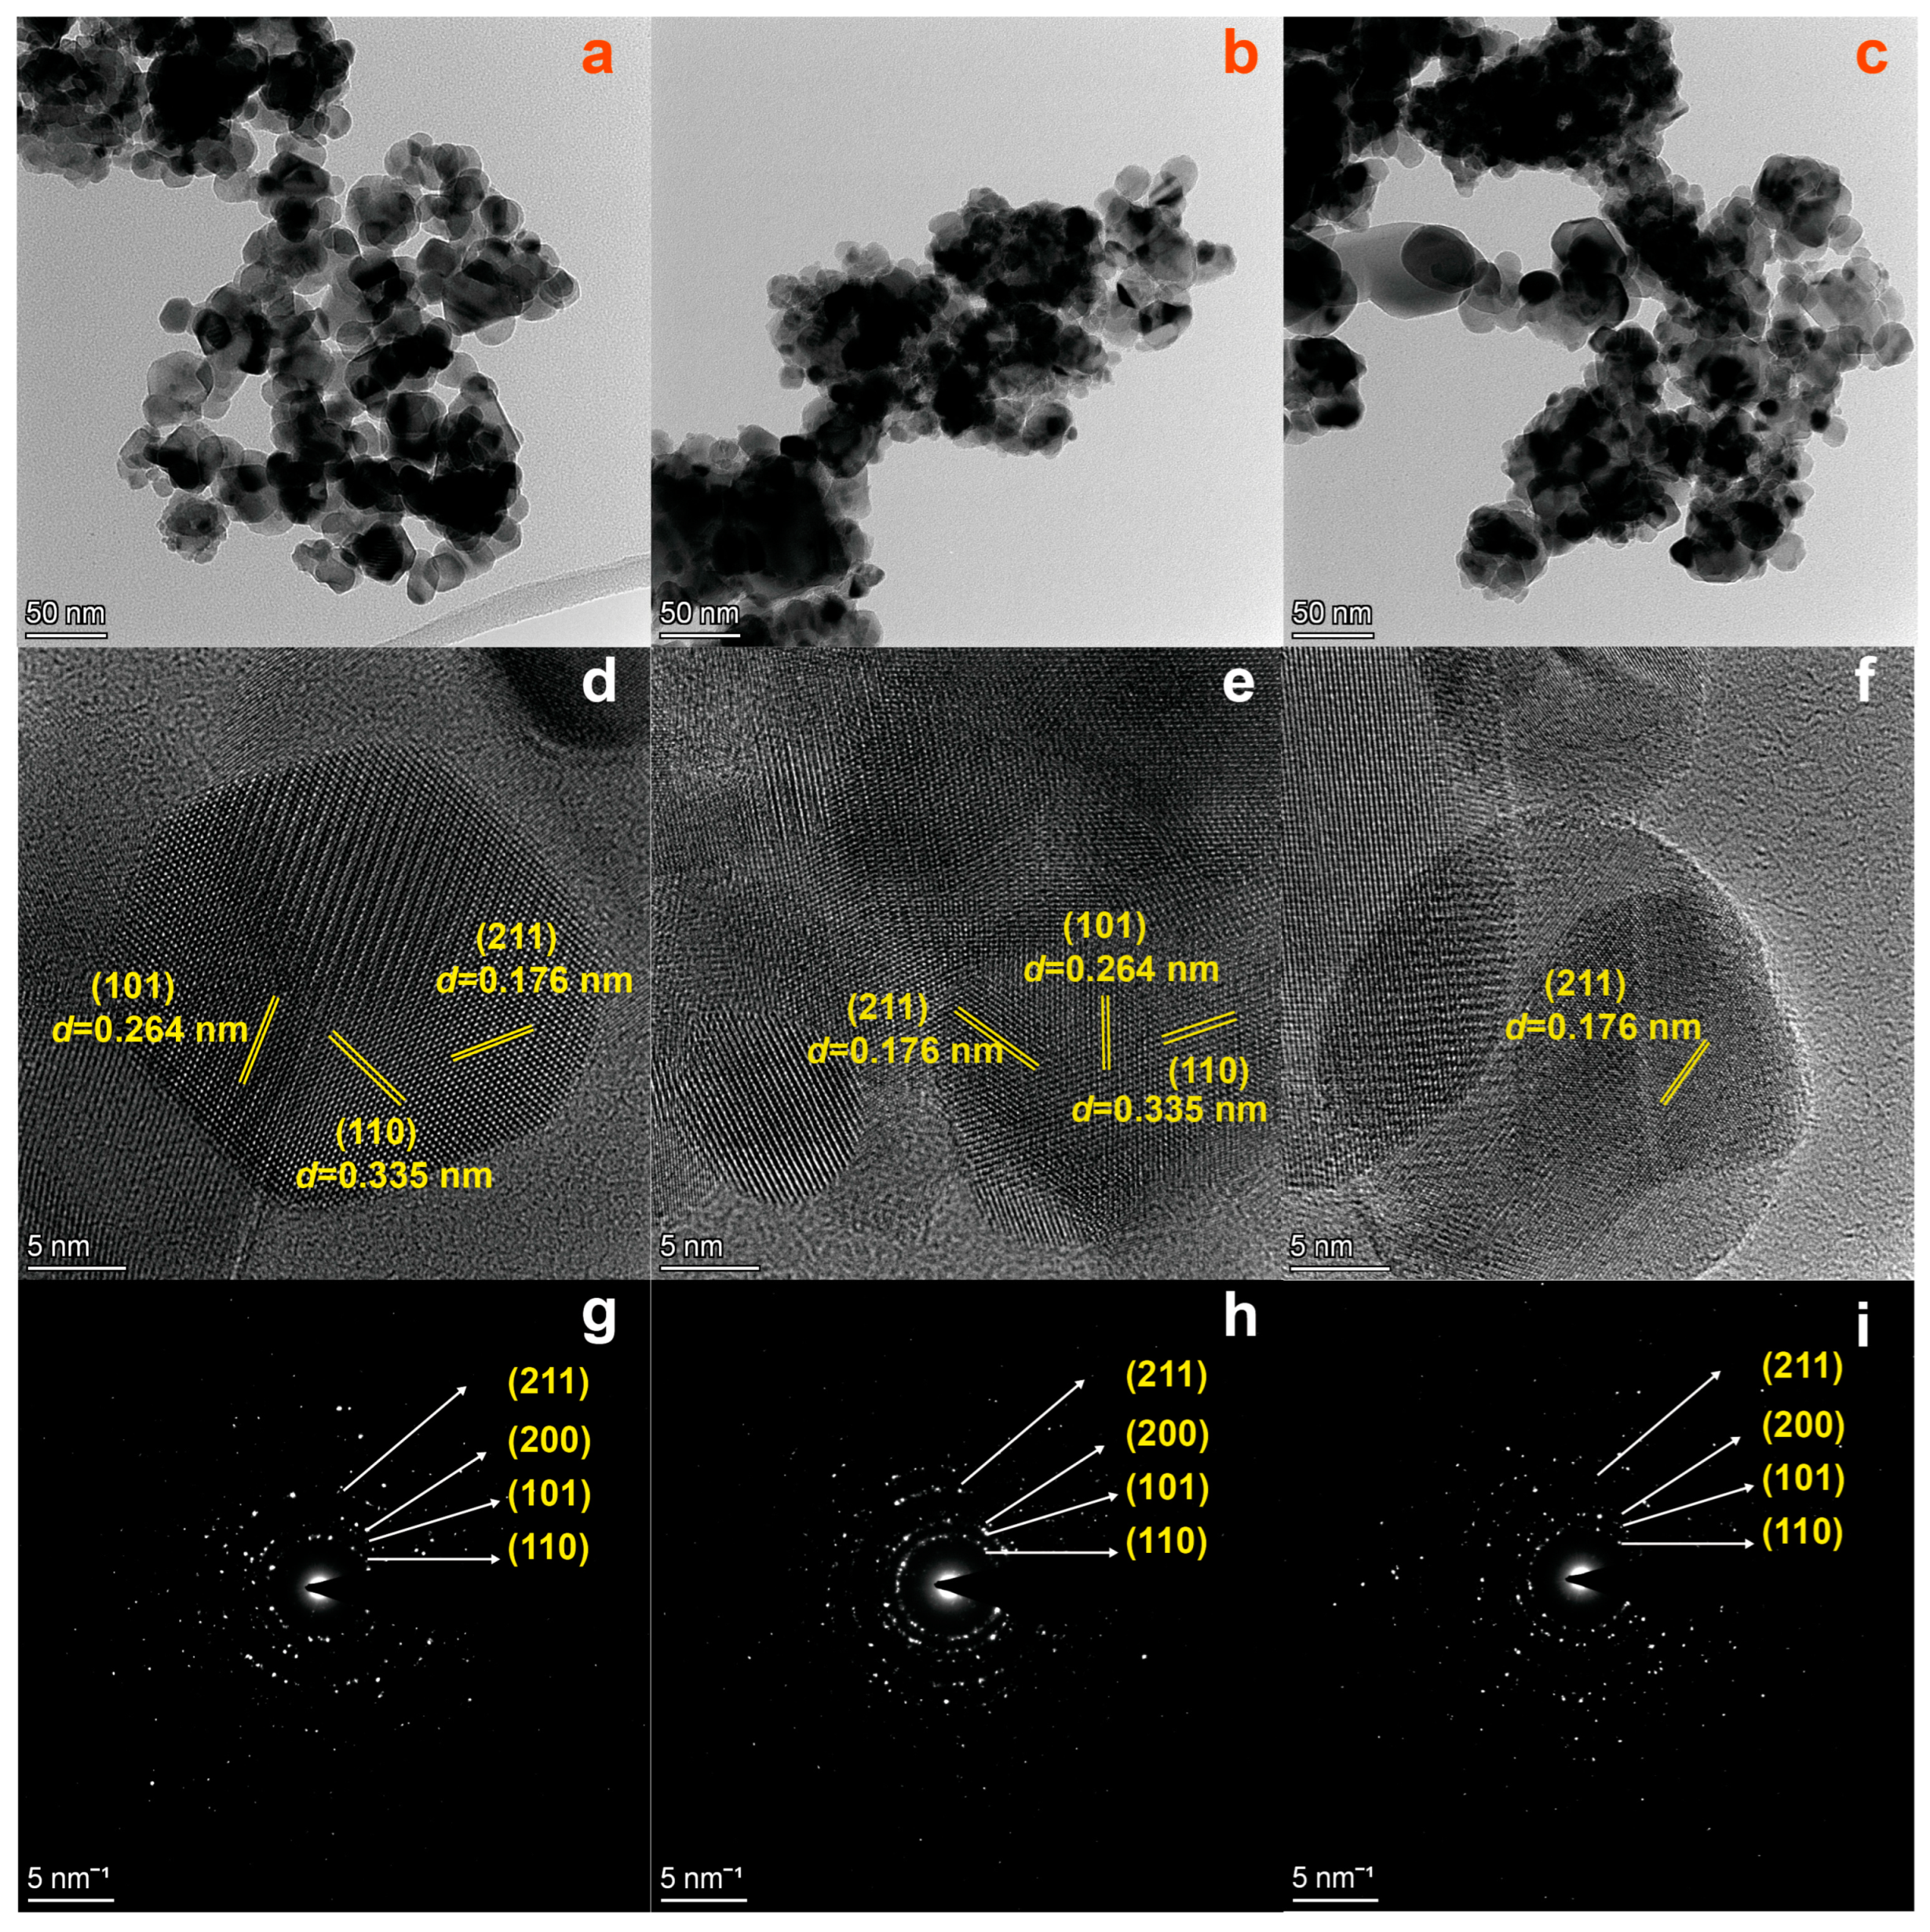
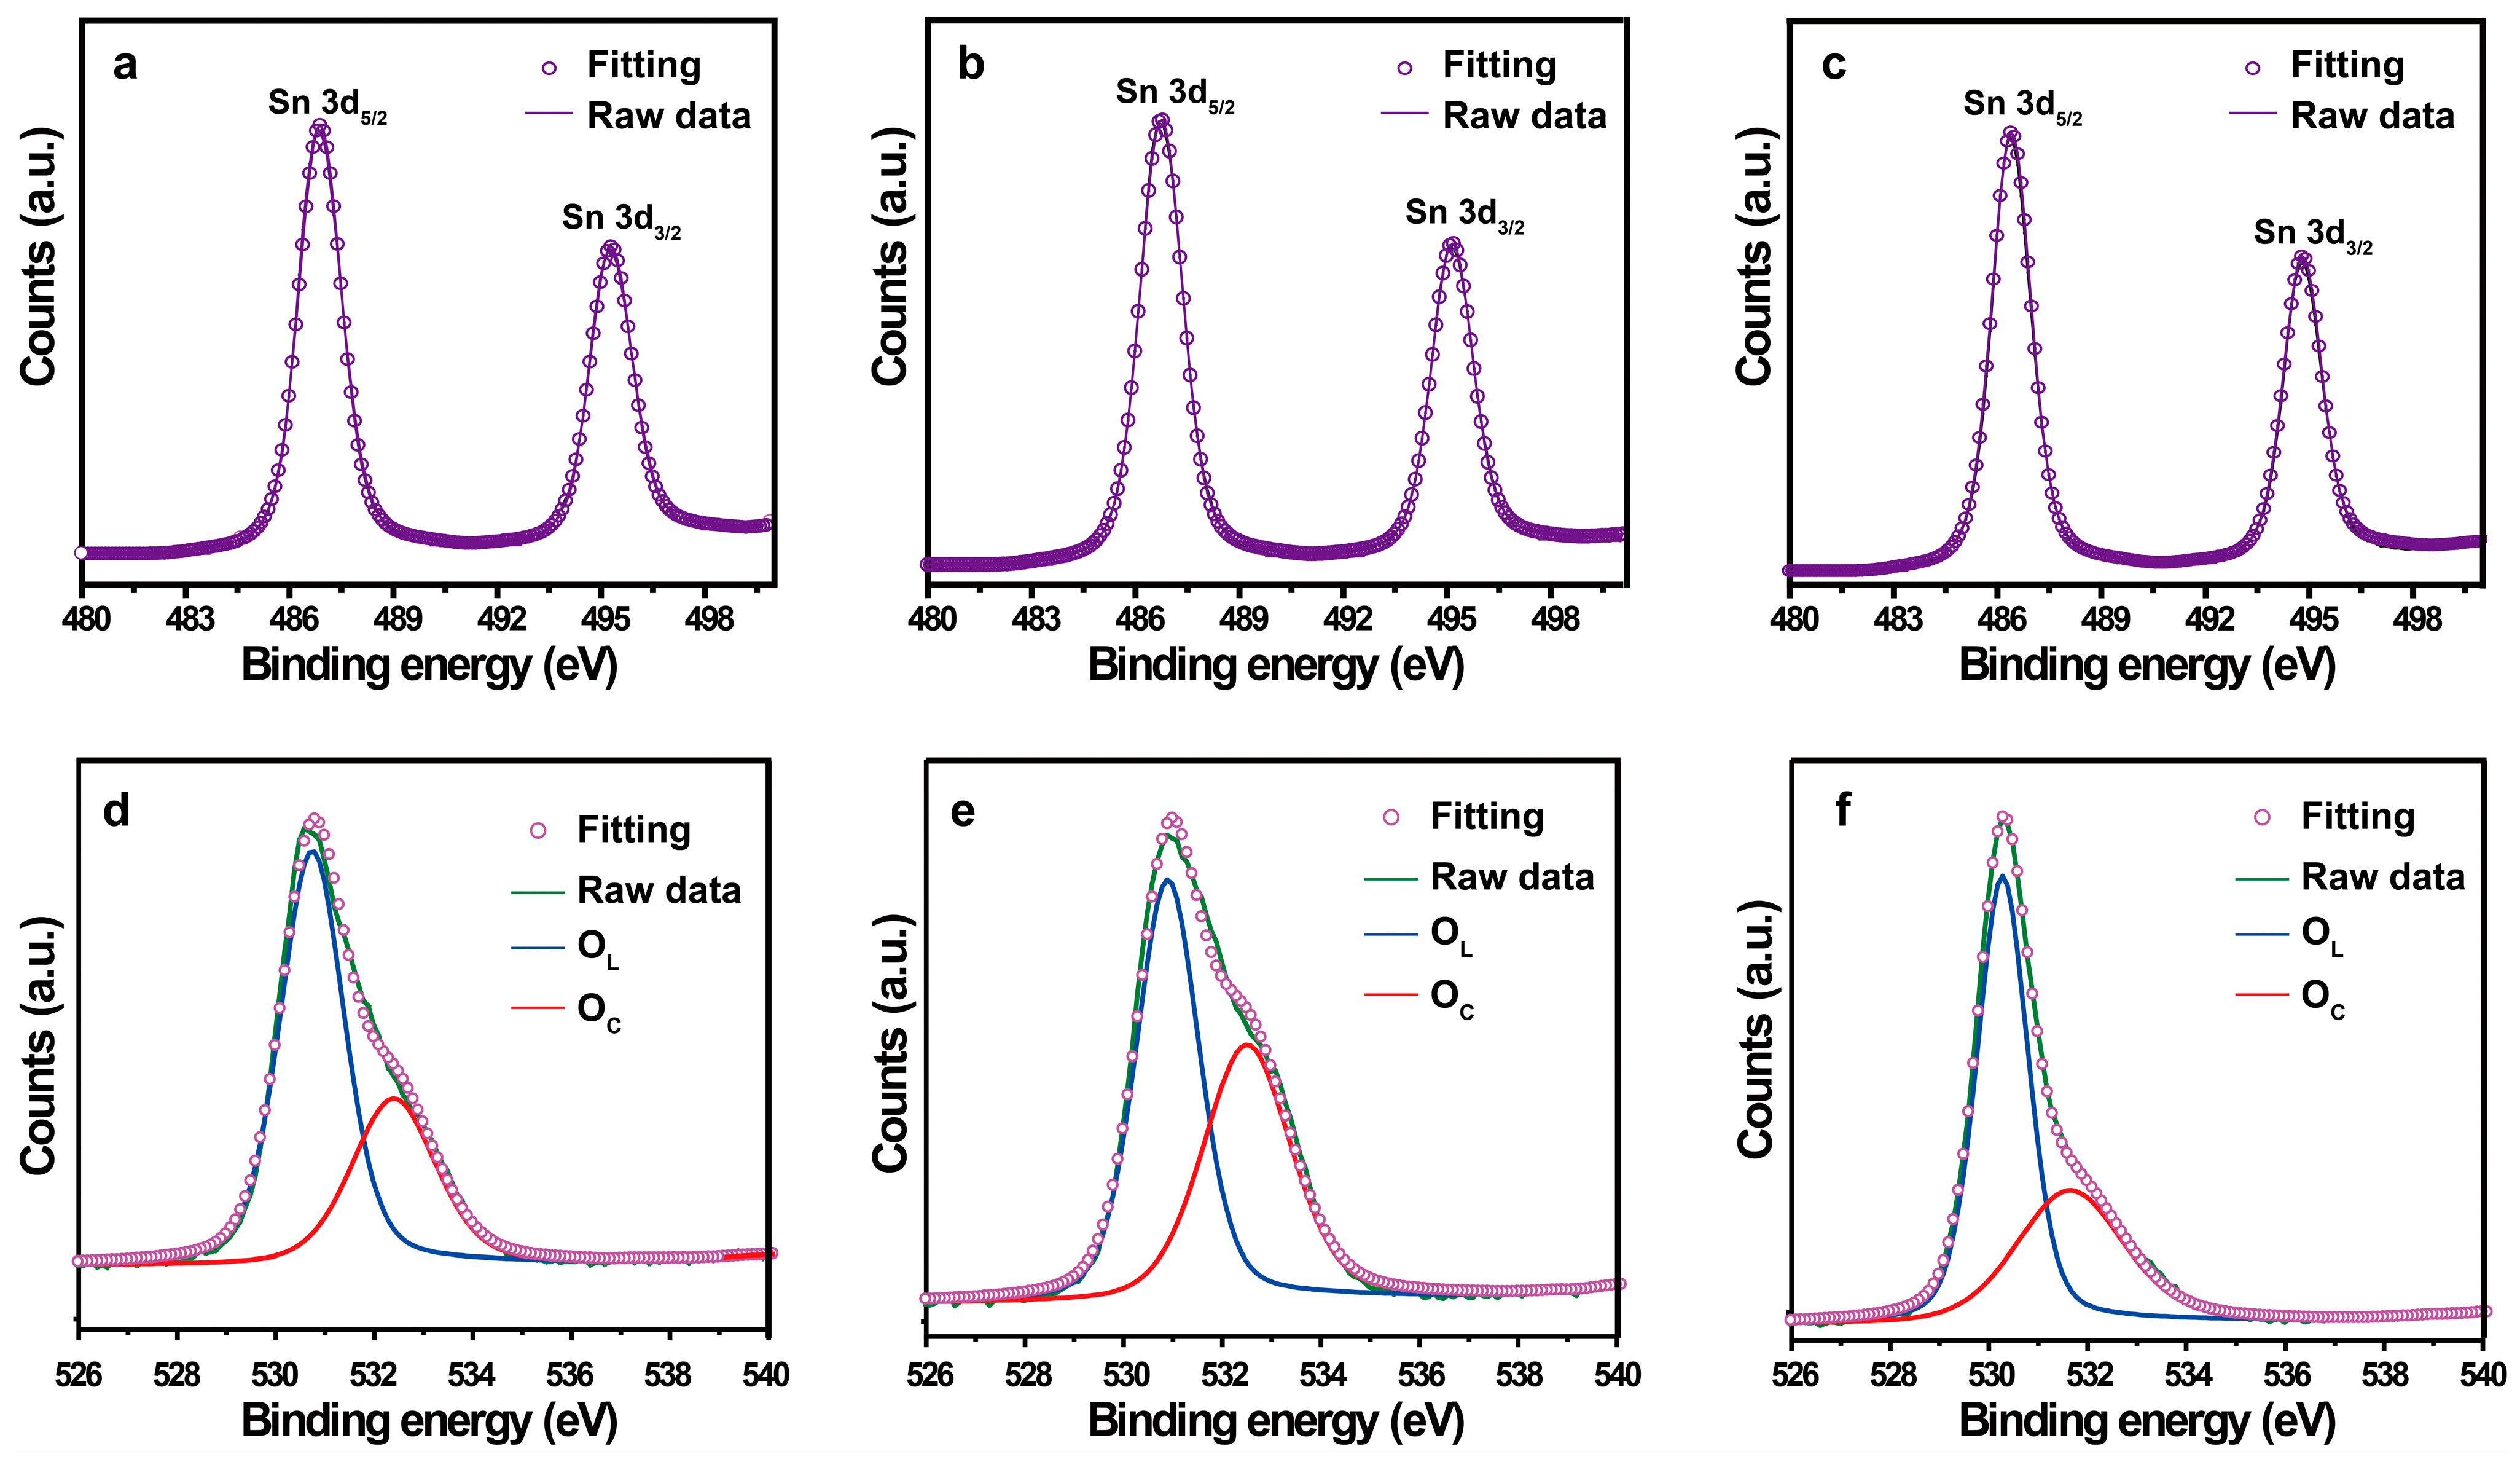
2.1. Structural and Morphological Characterizations

Figure 1 shows the XRD patterns of the three samples annealed at different temperatures. Diffraction peaks at 2θ = 26.58°, 33.88°, 37.94°, 51.78°, and 54.76° correspond to the (110), (101), (200), (211), and (220) planes of tetragonal SnO2 with standard lattice constants of a = b = 4.7382 Å and c = 3.1871 Å (JCPDS card no. 41–1445). An increase in the calcination temperature resulted in a decrease in the full width at half maxima, which mainly results from increased crystallinity. This result agrees with those of previous reports [34,35]. In addition, no impurity peak is presented in the XRD patterns, which clearly proves that highly purified SnO2 was successfully synthesized.
The morphology and size of the as-prepared SnO2 samples were investigated by transmission electron microscopy (TEM) and high-resolution transmission electron microscopy (HRTEM). Figure 2a–c reveal that the three SnO2 samples are monodispersed nanoparticles with an average particle diameter of about 20 nm. The HRTEM images in Figure 2d,e show that both the SnO2−500 °C and SnO2−600 °C have a (101) plane with a lattice space of 0.264 nm, a (110) plane with a lattice space of 0.335 nm, and a (211) plane with a lattice space of 0.176 nm. Figure 2f shows that SnO2−700 °C has a (211) plane with a lattice space of 0.176 nm. The corresponding selected area electron diffraction (SAED) images in Figure 2g–i display the observed diffraction patterns consisting of concentric rings, which implies that the SnO2 samples have a polycrystalline structure. Meanwhile, the SAED fringe patterns are consistent with the peaks observed in the XRD spectra.
The specific surface areas and pore size distribution of the as-prepared samples were measured by nitrogen adsorption−desorption and obtained using Barrett−Joyner−Halenda (BJH) calculations of the adsorption branches. Figure 3a–c show that all the SnO2 samples produced typical type IV curves and have mesoporous features. As shown in Table 1, the BET surface areas of SnO2−500 °C, SnO2−600 °C, and SnO2−700 °C were 19.70, 19.73, and 2.31 m2/g, respectively. The Langmuir surface areas were 289.07, 295.61, and 14.00 m2/g, respectively, following the order of SnO2−600 °C > SnO2−500 °C > SnO2−700 °C. The average pore sizes of SnO2−500 °C and SnO2−600 °C were 17.41 nm and 17.02 nm, respectively, while the average pore size of SnO2−700 °C was not calculated because of its minuscule surface area. Obviously, SnO2−700 °C possessed the smallest surface area, while SnO2−500 °C and SnO2−600 °C had similar surface areas and smaller pore sizes.
The elemental and valence state analyses were performed based on the XPS spectra. Figure 4 shows the XPS spectra of SnO2−500 °C, SnO2−600 °C, and SnO2−700 °C, which were composed of tin and oxygen core levels. The Sn 3d peak was deconvoluted into two peaks: Sn5/2 and Sn3/2. For SnO2−500 °C, the Sn 3d peaks centered at the binding energies of 486.88 eV and 495.28 eV, respectively, yielding a peak-to-peak separation of 8.4 eV (Figure 4a). Similarly, SnO2−600 °C exhibited corresponding peaks at 486.74 eV and 495.14 eV, with a separation of 8.4 eV (Figure 4b), and SnO2−700 °C exhibited corresponding peaks at 486.39 eV and 494.79 eV, with the same separation of 8.4 eV (Figure 4c). The above results indicates that all the Sn 3d peaks can be assigned to the highest oxidation state of Sn4+ for SnO2 [36,37].
The measured O 1s core level spectra of the SnO2 samples are presented in Figure 4d–f. The asymmetric peak of O 1s was fitted by two deconvoluted peaks for all samples. The main components of the O 1s signal, centered at 530.32–530.89 eV, are attributed to the lattice oxygen (OL) as O2− in SnO2. The higher binding energy peaks, centered at 532.11–532.504 eV, can be ascribed to the chemisorbed oxygen (Oc) on the SnO2 surface [36,38]. The binding energy value and the peak area ratio of oxygen species in each sample are listed in Table 2. The percentages of OC were 34.12%, 45.30%, and 26.97% for SnO2−500 °C, SnO2−600 °C, and SnO2−700 °C, respectively. The SnO2−600 °C sample had the highest amount of chemisorbed oxygen. Many studies have demonstrated that abundant chemisorbed oxygen can improve the sensing sensitivity.

2.2. Evaluation of the Sensing Materials

The three as-prepared SnO2 samples were used to fabricate gas sensors to sense H2S. Figure 5a shows the seven parallel determinations of H2S at 50 ppm by the three SnO2 sensors. The relative standard deviations (RSDs) of the response signals of the three sensors were 2.6%, 2.5%, and 3.6%, respectively, indicating that all the sensors have good reproducibility. However, the response signal of SnO2−600 °C was significantly higher than that of SnO2−500 °C and SnO2−700 °C. Then, the selectivity of the sensors toward H2S was studied by three parallel determinations of different gases at 2000 ppm, including ammonium sulfide, ethanethiol, dimethyl sulfide, trimethylamine, dimethylamine, triethylamine, ethylenediamine, ammonia, benzene, toluene, o-xylene, m-xylene, p-xylene, styrene, trichloroethylene, methanol, ethanol, acetone, formaldehyde, acetaldehyde, propionaldehyde, carbon monoxide, carbon dioxide, and sulfur dioxide. As Figure 5b shows, 2000 ppm of ammonium sulfide produced weak responses, but its concentration was much higher than that of H2S. It was found that ammonium sulfide could not produce responses from all the sensors when its concentration was reduced to 1000 ppm. It is worth mentioning that methanol, ethanol, acetone, and carbon monoxide are common interferents for H2S sensors [29,30,31,32,39]. However, the present sensors did not produce responses toward high concentrations of these gases, indicating that the as-prepared SnO2 samples are qualified for the selective sensing of H2S. Because SnO2−600 °C had the most sensitive response and possessed satisfactory selectivity, the sensing performance of a sensor based on SnO2−600 °C was studied in detail in the subsequent work.

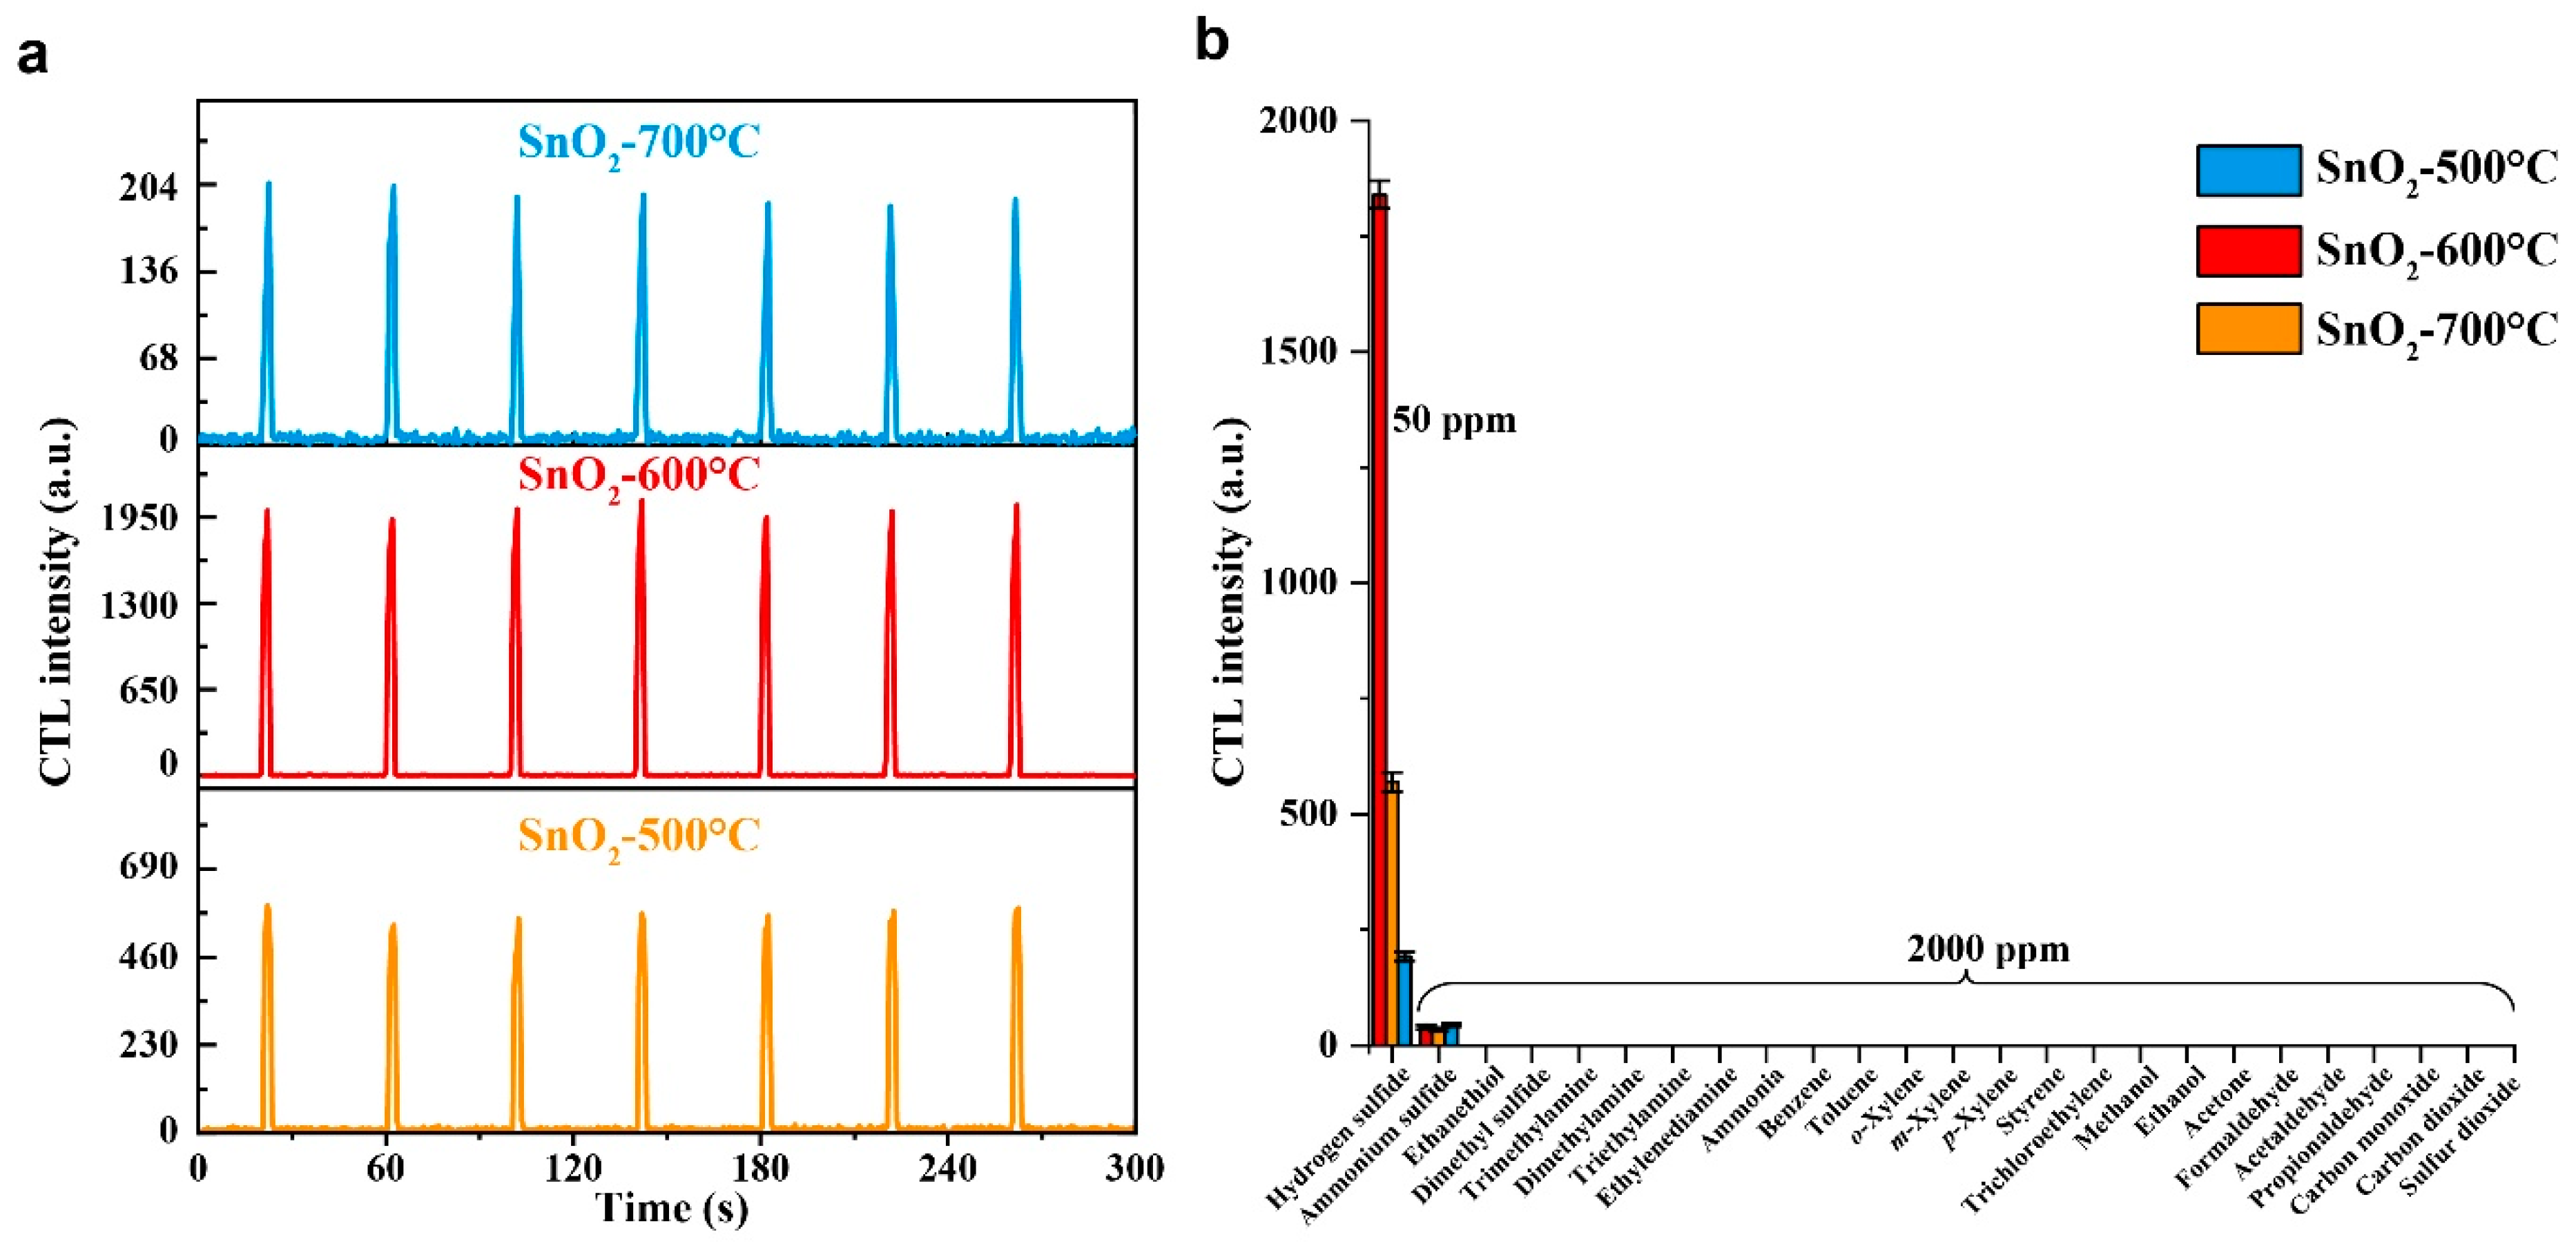
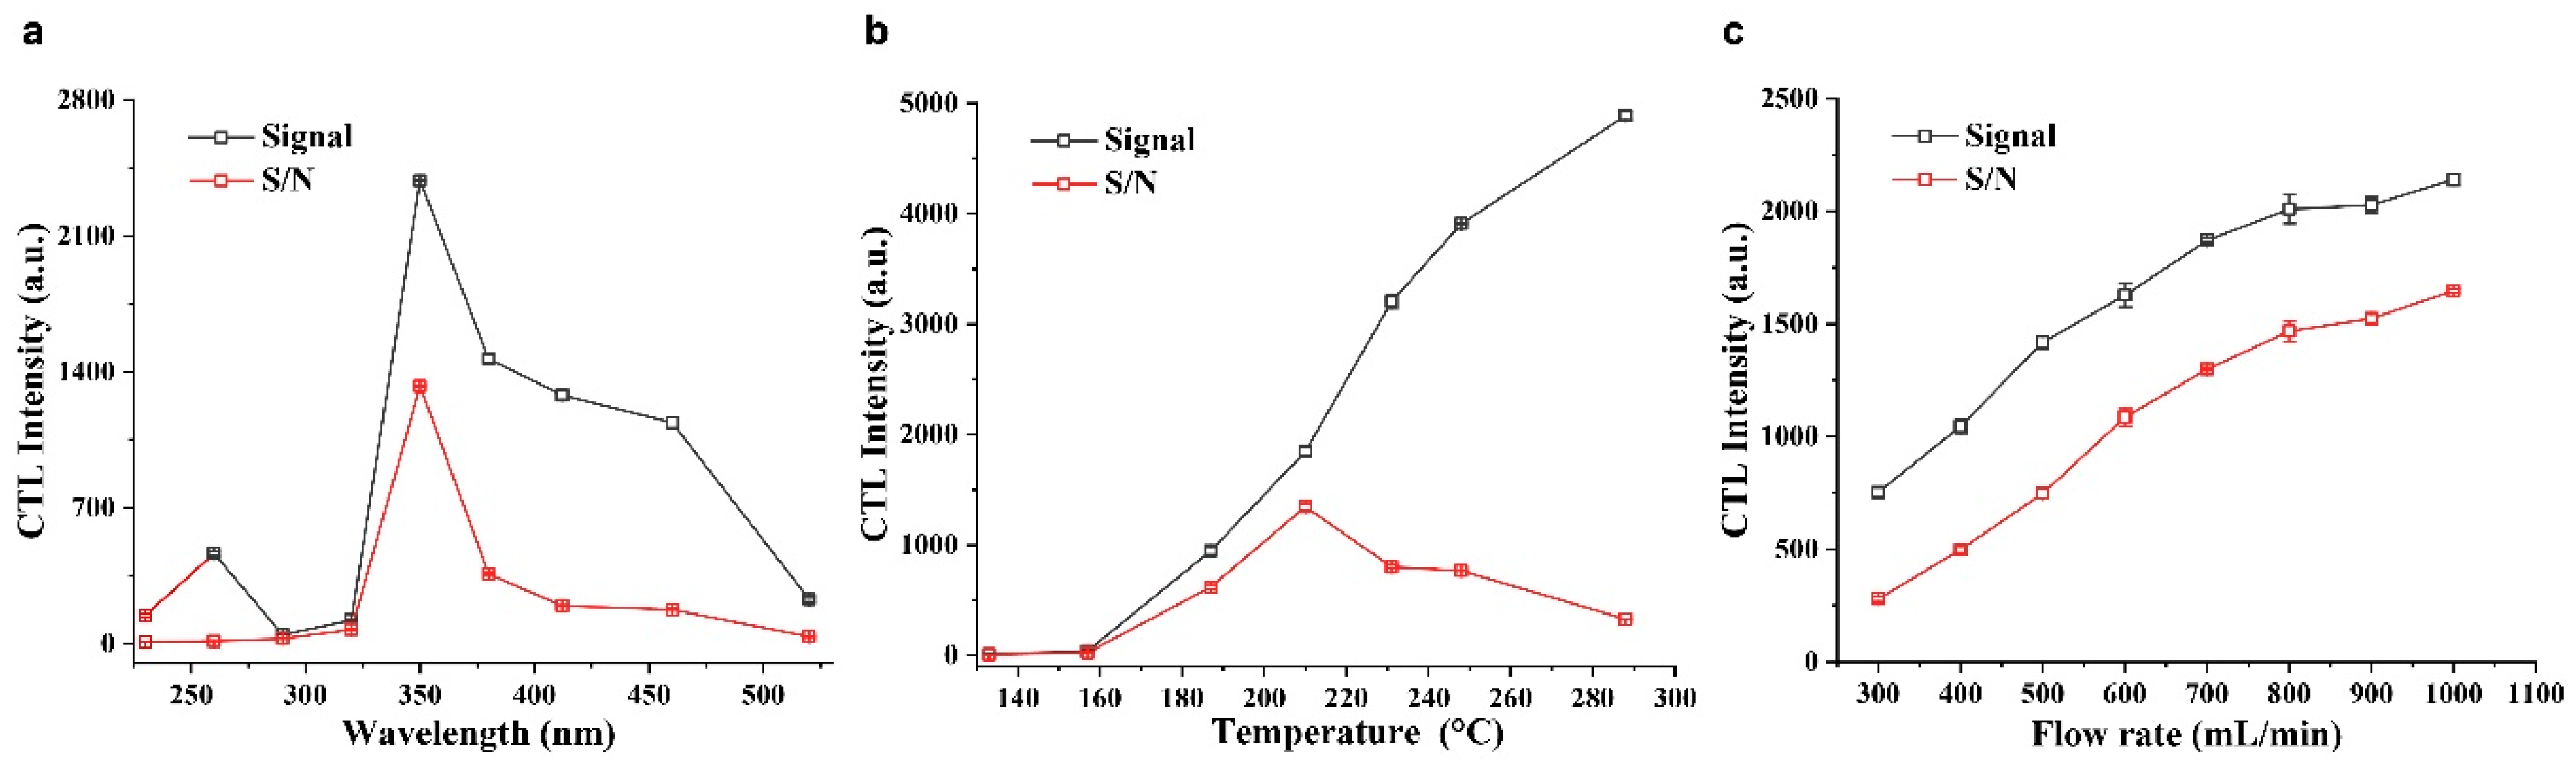
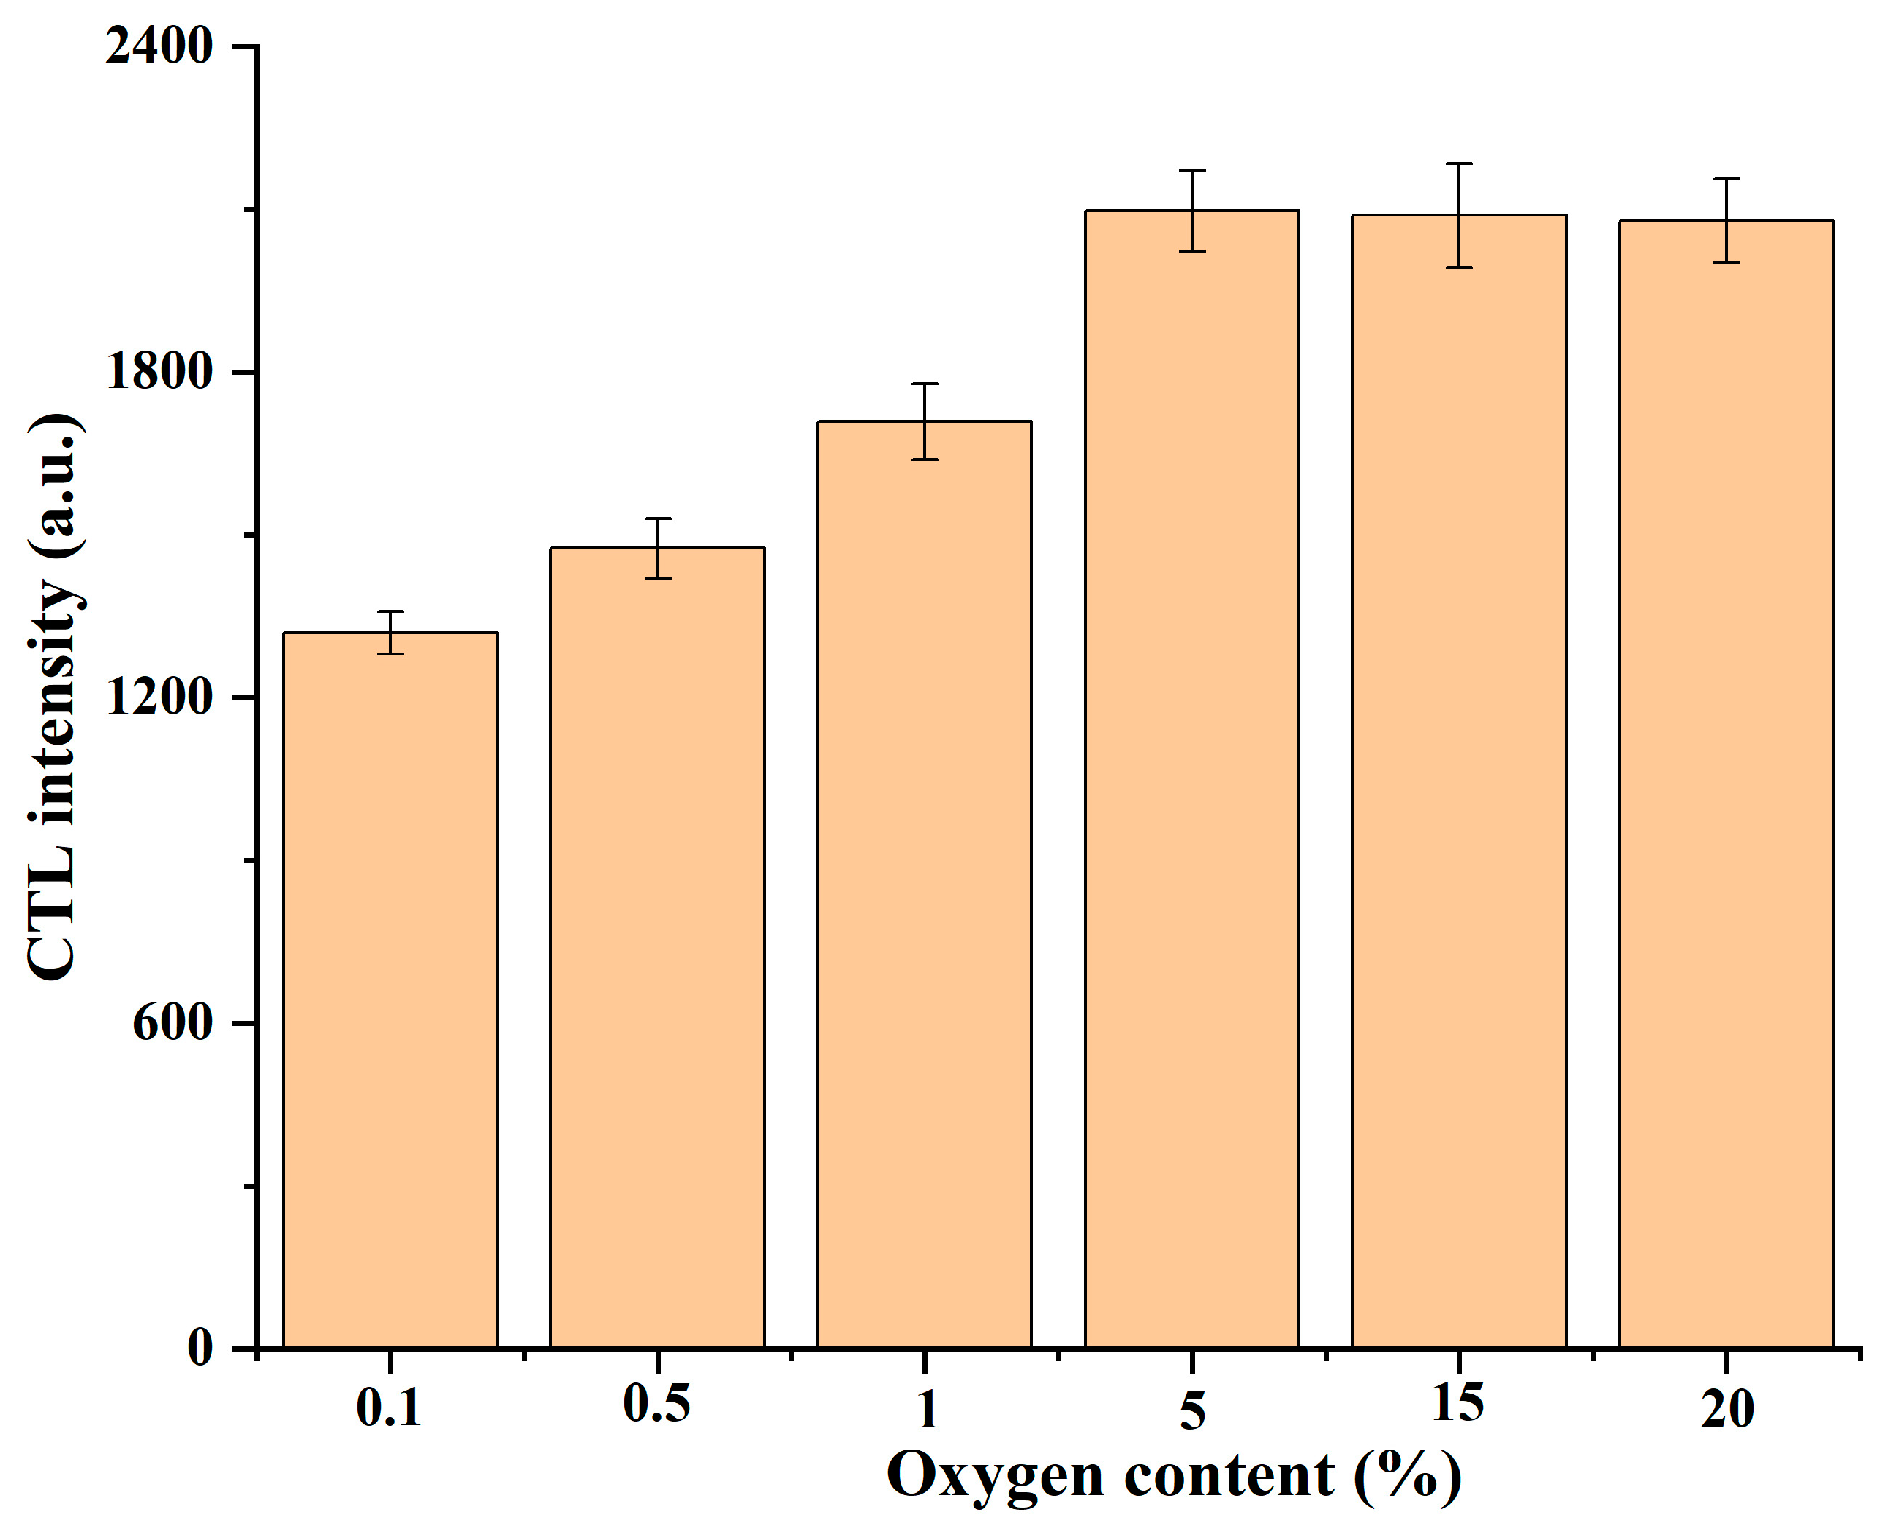
2.3. Optimization of Conditions

The detecting wavelength, operating temperature, and flow rate have sizable effects on CTL sensing. First, the effect of the detecting wavelength on the CTL response signal and signal-to-noise ratio (S/N) was investigated by changing the optical filters in a range of 230–520 nm. As shown in Figure 6a, both the CTL response signal and the S/N value reached their maximums at 350 nm. Consequently, 350 nm was chosen as the optimal wavelength for the CTL sensing of H2S.
Next, the effect of the operating temperature on the CTL response signal and S/N was investigated. Figure 6b shows the change trends of the response signal and S/N versus operating temperature ranging from 133 to 288 °C. The CTL response signal increased monotonically with the operating temperature. For the S/N value, it increased with operating temperature before 210 °C and then deceased with increasing temperature, which can be mainly attributed to the background noise emitted by the thermal radiation that increases with the increasing temperature. Therefore, an operating temperature of 210 °C was chosen as the optimal working temperature, as the maximum S/N was observed at this temperature.
Finally, the effect of the flow rate on the CTL sensing of H2S was investigated. As Figure 6c shows, both the CTL response signal and the S/N value increased gradually with the increasing flow rate. Even when the flow rate reached the maximum rate (1000 mL/min) of the mass control flowmeter, the CTL response signal and the S/N value did not show decreasing trends. This means that the rapid oxidation rate of H2S on the SnO2−600 °C surface and the total reaction rate is controlled by the transfer rate of H2S from the gas phase to the SnO2−600 °C surface. Thus, an increase in the flow rate accelerates the total reaction rate, causing the increase in the CTL signal and S/N. Because the change in the CTL response signal and S/N tended to be stable when the flow rate exceeded 800 mL/min, a flow rate of 800 mL/min was chosen as the optimal flow rate.

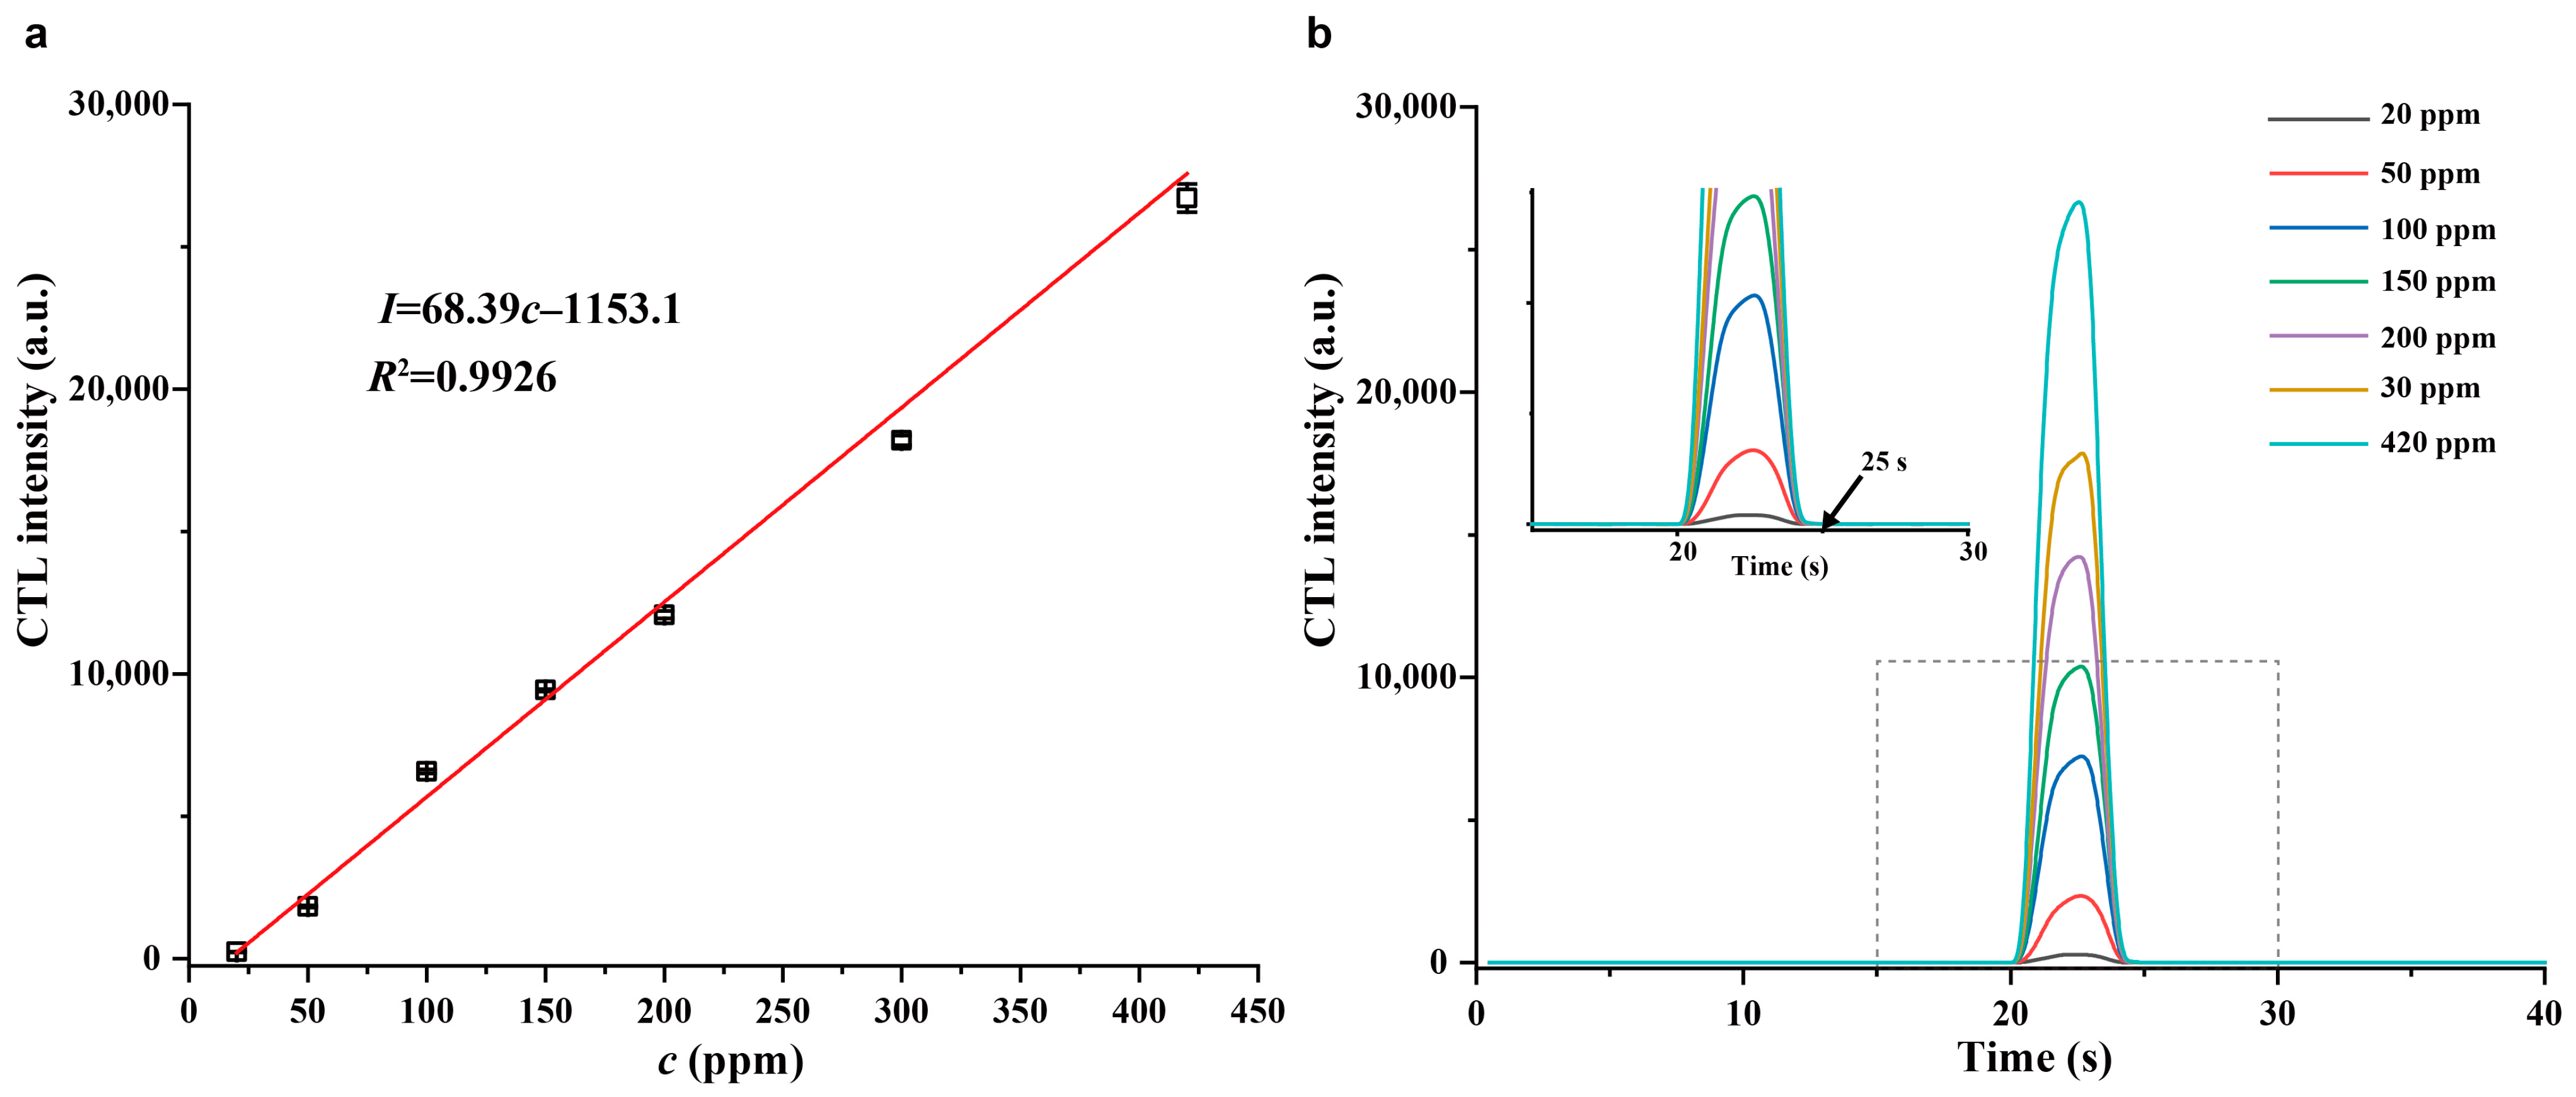
2.4. Analytical Characteristics

Figure 7a shows the response signal of the sensor based on SnO2−600 °C toward different concentrations of H2S under the optimal conditions. A good linear relationship between the CTL response signal and H2S concentration was found in the range of 20–420 ppm with a correlation coefficient of 0.9926. The linear equation was I = 68.39c − 1153.1, where the I is the average CTL response signal of three parallel determinations, and c represents the H2S concentration (ppm). The limit of detection (LOD) was 8 ppm at an S/N ratio of 3. The LOD of the sensor is lower than the threshold limit value of 10 ppm for H2S in a workplace (8 h time weighted average), indicating its promising application to monitor H2S in the workplace for safety management.
A comparison of the sensing performances between the present sensor and other H2S sensors is summarized in Table 3. The present sensor has a relatively lower operating temperature and a faster response and recovery speed than most electrical sensors. Although the electrical sensors are more sensitive than the present sensor, our sensor exhibits higher selectivity toward H2S. Gas sensors that can operate at low or room temperatures are highly desired for reducing the risk of gas explosions, minimizing energy consumption, and increasing security. Further endeavors could be made to improve the sensitivity and reduce the operating temperature of CTL sensors based on SnO2 materials via doping noble metals, loading porous materials, or engineering the oxygen vacancy.
Figure 7b displays the CTL response profiles of the sensor toward different concentrations of H2S under the optimal conditions. The injection time was 20 s, and it can be seen that the response signal can reach the maximum value within 3.5 s, and the maximum response signal can decay back to baseline within 1.5 s for all concentrations of H2S, indicating a fast response/recovery behavior of the sensor and highlighting its ability to rapidly monitor H2S.

2.5. Mechanism Study

SnO2 is a typical n-type semiconductor material; when a SnO2 sensor is exposed to the air atmosphere, the O2 molecules in the air react with SnO2 to produce chemisorbed oxygen via receiving electrons, such as O2−, O2−, and O [31,45]. It was reported that O is the predominant chemisorbed oxygen species on metal oxide surfaces between 100 and 300 °C [46], and thereby the O species is the preferential chemisorbed oxygen because the optimal working temperature of the sensor is 210 °C. We found that the CTL signal could not be detected on a heated ceramic heater without sintering nanosized SnO2, indicating that the catalyst is essential to the CTL emission. In addition, no CTL signal was detected when the air carrier was replaced by nitrogen, helium, or argon, implying that the surface chemisorbed oxygen but not the lattice oxygen takes part in the reaction. The influence of the oxygen content on CTL intensity was also investigated. As shown in Figure 8, the CTL intensity increased gradually with increasing oxygen content, and then remained stable when the oxygen content exceeded 5%. Oxygen is the second most abundant gas in the air at about 21%, indicating that the use of air as a carrier gas can provide sufficient oxygen for the oxidation of H2S on SnO2 surfaces.
In order to further explore the sensing mechanism, gas chromatography–mass spectrometer was used to identify the reaction product from the oxidation of H2S on the SnO2 surface. SO2 and H2O were detected in the exhaust gas from the oxidation of H2S on the SnO2 surface. According to the accepted theory, the generation of excited state intermediates is necessary for the generation of CTL during the reaction process [47]. It was reported that SO2 is a strong chemiluminescence continuum band between 250 and 500 nm with a peak wavelength of around 350 nm [48,49]. The CTL emission spectrum shown in Figure 6a also exhibits similar characteristics. Therefore, the excited state of SO2 (SO2*) is the possible luminophore, which is responsible for CTL emission from the oxidation of H2S on the SnO2 surface. According to the above discussion, the possible oxidation reaction for H2S on the SnO2 surface in air can be described as follows:
  O 2 SnO 2 O ,
H 2 S + O SnO 2 SO 2 * + H 2 O ,
SO 2 * SO 2 + hv ( λ max = 350   nm ) .
The above reactions display the important role of chemisorbed oxygen in CTL emission. Abundant chemisorbed oxygen can promote the oxidation of H2S, enhancing the CTL intensity. The XPS results show that the order of the amount of chemisorbed oxygen is SnO2−600 °C > SnO2−500 °C > SnO2−700 °C, which is in accordance with the order of the sensitivity. Therefore, the amount of chemisorbed oxygen can explain the different sensitivities of the sensors based on the different SnO2 samples. However, extensive work is still needed to explain the underlying sensing mechanism. For example, the adsorption behavior of H2S and the evolution of oxygen species on heated SnO2 surfaces should be studies by in situ diffuse reflectance infrared Fourier transform spectroscopy or in situ Raman spectroscopy.

3. Experimental Section

3.1. Synthesis of SnO2

Approximately 7.012 g (0.02 mol) of SnCL4·5H2O was dissolved in 80 mL deionized water and stirred for 15 min for complete dispersion; the final concentration of SnCL4·5H2O was 0.25 mol/L. Then, 10 mL of 14.8 mol/L ammonium hydroxide (28% NH3 in H2O) was added dropwise into the solution, and the mixture was stirred continuously for 15 min. After that, the obtained solution was transferred into a Teflon-lined stainless steel autoclave and kept at 100 °C for 12 h. After naturally cooling down to room temperature, the as-synthesized precursors were washed several times with deionized water and ethanol and dried at 60 °C for 12 h in an oven. Then, the as-prepared powders were annealed at 500 °C, 600 °C, and 700 °C for 3 h, and the resulting annealed SnO2 samples were labeled as SnO2−500 °C, SnO2−600 °C, and SnO2−700 °C, respectively.

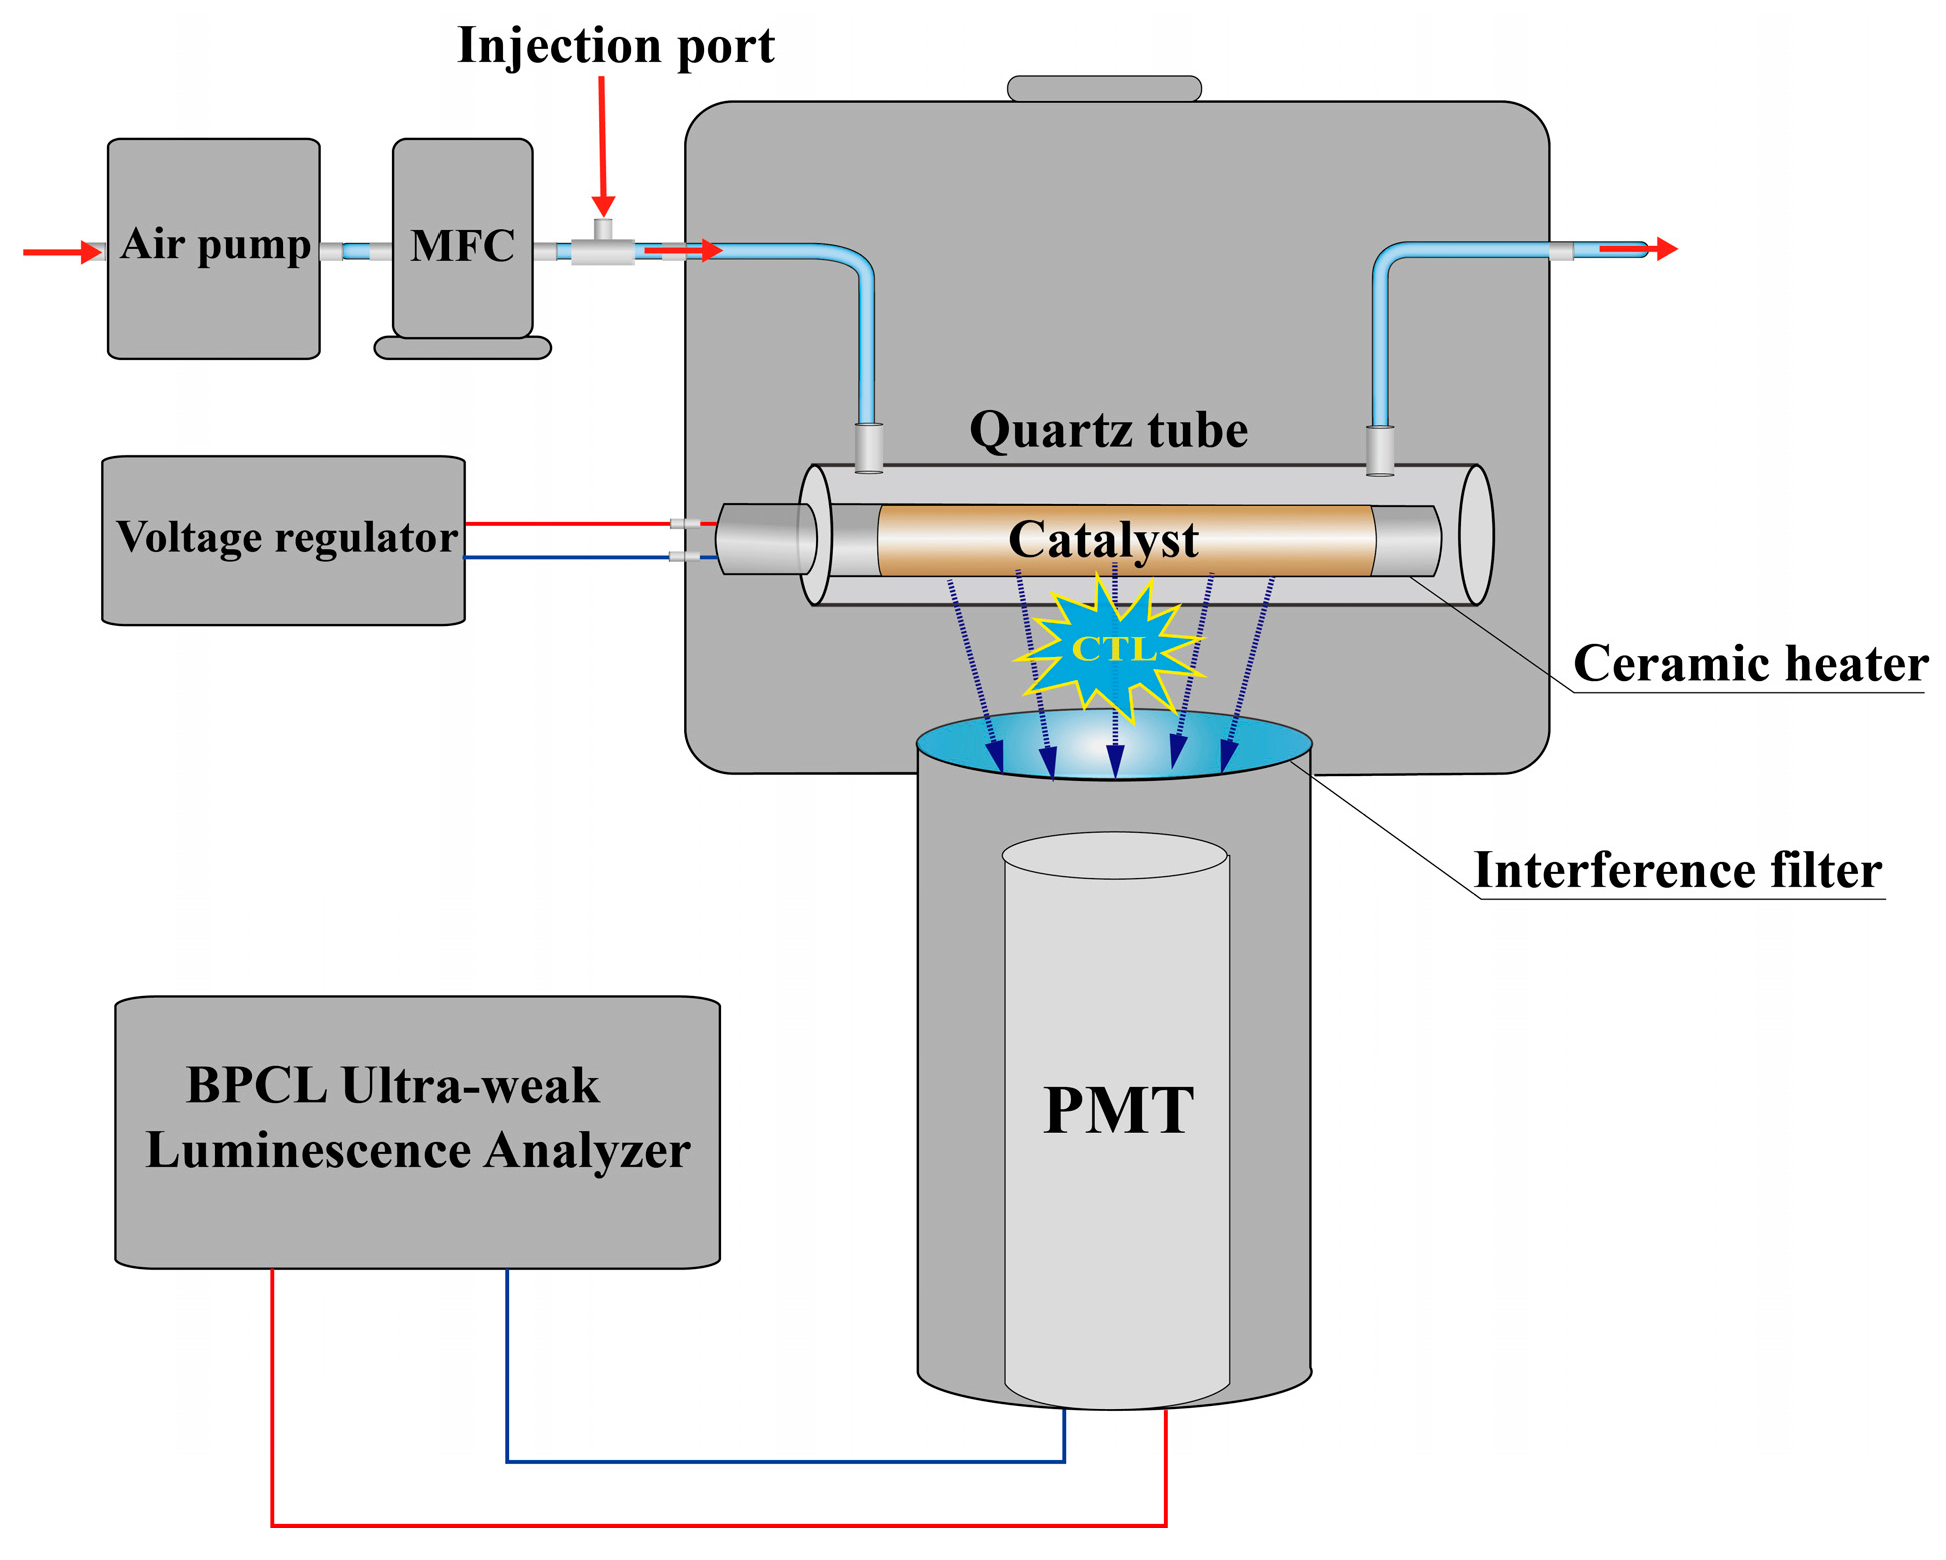
3.2. Characterization and Apparatus

The phase structures of the SnO2 samples were investigated using powder X-ray diffraction (XRD, Rigaku, Ultima IV) with Cu Kα radiation (λ = 1.5406 Å). The morphology and exposed surfaces of the SnO2 samples were studied by transmission electron microscopy (TEM; Titan G260-300 FEI, Stanford, CA, USA). The specific surface areas and pore size distribution of the SnO2 samples were investigated using a surface area analyzer (ASAP2460, Micromeritics, Norcross, GA, USA). The chemical status and the composition of elements of the SnO2 samples were investigated by K-Alpha X-ray photoelectron spectroscopy (XPS; Thermo Scientific, Waltham, MA, USA) with monochromatic Al Kα X-ray radiation.

3.3. Fabrication of the Gas Sensor

The detailed fabrication methods of the SnO2 sensors were similar to those reported in previous works [8,10], and a schematic diagram of the sensing setup is shown in Figure 9. Briefly, the as-prepared SnO2 samples were mixed with deionized water to obtain a suspension. The suspension was then brush-coated on the surface of a ceramic heater (35 W, diameter is 0.5 cm) to obtain a thin layer (about 1 mm in thickness). The ceramic heater was placed in a homemade quartz tube (with a length of 9 cm and an inner diameter of 1.2 cm) with a gas inlet and outlet. The quartz tube was placed into the sample chamber of a commercial BPCL ultra-weak luminescence analyzer (Guangzhou Microphotonics Technologies Co., Ltd., Guangzhou, China) equipped with a photomultiplier (tube type: GDB-52) at the bottom of sample chamber. The sensors were aged at 400 °C for 20 min in a stable airflow at 800 mL/min. An air pump was used to carry and transport the sample, and a mass flow controller was used to control the flow rate. A voltage regulator was used to adjust the operating temperature. The detecting wavelength was changed using different interference filters. The sample was injected into the injection port, and then the CTL signal was recorded and processed by the BPCL ultra-weak luminescence analyzer.

4. Conclusions

In conclusion, three kinds of nanosized SnO2 samples were synthesized through a hydrothermal method. Structural characterizations indicated that the order of the amount of chemisorbed oxygen of the three nanosized SnO2 samples was SnO2−600 °C > SnO2−500 °C > SnO2−700 °C. The gas sensing results indicated that the sensors based on three nanosized SnO2 samples all exhibited high selectivity toward H2S, but the SnO2−600 °C sensor exhibited the highest sensitivity, which can be attributed to the SnO2−600 °C process resulting in the highest amount of chemisorbed oxygen. The mechanism study showed that H2S was oxidized into SO2 and H2O by chemisorbed oxygen on the SnO2 surface. The excited state of the SO2 produced by the oxidation reaction was mainly responsible for CTL emission. The designed CTL sensor for H2S has good prospects for the rapid detection of H2S in the fields of environmental monitoring, food safety, and occupational health, owing to its advantages of sufficient sensitivity, high selectivity, and rapid response and recovery capacity.

Author Contributions

Conceptualization, B.F. and L.-L.Z.; methodology, B.F. and L.-L.Z.; investigation, B.F., J.-R.Z. and J.-L.C.; formal analysis, B.F., Z.-T.Y. and B.L.; software, B.F. and L.W.; visualization, B.F., J.-R.Z. and J.-L.C.; writing—original draft preparation, B.F.; writing—review and editing, J.-R.Z., Z.-T.Y. and L.-L.Z.; validation, Z.-T.Y., B.L., L.W. and M.Y.; data curation, B.F.; supervision, M.Y.; project administration, L.-L.Z.; funding acquisition, B.F., J.-R.Z. and M.Y. All authors have read and agreed to the published version of the manuscript.

Funding

This research was funded by the Special Fund Project for Environmental Protection of Guangdong Province (2022-18 and 2023-12) and the Scientific, Research and Innovation Project of Guangdong Provincial Academy of Environmental Science (XMHT-2022-FP-KYCX439).

Institutional Review Board Statement

Not applicable.

Informed Consent Statement

Not applicable.

Data Availability Statement

The data presented in this study are available upon request from the corresponding authors.

Conflicts of Interest

The authors declare no conflict of interest.

Sample Availability

Not applicable.

References

  1. He, Y.; Sun, B.; Jiang, L.; Li, X.; Ma, Y.; Wang, K.; Han, P.; Jin, S. Effect of ag doping on SnO2 sensing for detecting H2S: A first-principles study. Vacuum 2021, 194, 110587. [Google Scholar] [CrossRef]
  2. Han, C.H.; Li, X.W.; Shao, C.L.; Li, X.H.; Ma, J.G.; Zhang, X.T.; Liu, Y.C. Composition-controllable p-CuO/n-ZnO hollow nanofibers for high-performance H2S detection. Sens. Actuators B Chem. 2019, 285, 495–503. [Google Scholar] [CrossRef]
  3. Zhang, H.L.; Li, S.Y.; Zheng, H.P.; Han, Z.Z.; Lin, B.; Wang, Y.Y.; Guo, X.J.; Zhou, T.G.; Zhang, H.B.; Wu, J.J. A visual color response test paper for the detection of hydrogen sulfide gas in the air. Molecules 2023, 28, 5044. [Google Scholar] [CrossRef]
  4. Maldonado, C.M.S.; Kim, D.; Purnell, B.; Li, R.; Buchanan, G.F.; Smith, J.; Thedens, D.R.; Gauger, P.; Rumbeiha, W.K. Acute hydrogen sulfide-induced neurochemical and morphological changes in the brainstem. Toxicology 2023, 485, 153424. [Google Scholar] [CrossRef] [PubMed]
  5. Wu, D.; Akhtar, A. Ppb-level hydrogen sulfide gas sensor based on the nanocomposite of MoS2 octahedron/ZnO-Zn2SnO4 nanoparticles. Molecules 2023, 28, 3230. [Google Scholar] [CrossRef] [PubMed]
  6. Health, A.S.E. EH40/2005 Workplace Exposure Limits for Use with the Control of Substances; TSO: London, UK, 2020.
  7. Pu, S.R.; Pan, Y.; Zhang, L.C.; Lv, Y. Recent advances in chemiluminescence and cataluminescence for the detection of volatile sulfur compounds. Appl. Spectrosc. Rev. 2023, 58, 401–427. [Google Scholar] [CrossRef]
  8. Zhang, R.K.; Wang, J.X.; Cao, H. High-performance cataluminescence sensor based on nanosized V2O5 for 2-butanone detection. Molecules 2020, 25, 3552. [Google Scholar] [CrossRef]
  9. Zhong, Y.H.; Li, M.; Tan, R.X.; Xiao, X.H.; Hu, Y.F.; Li, G.K. Co (Ⅲ) doped-CoFe layered double hydroxide growth with graphene oxide as cataluminescence catalyst for detection of carbon monoxide. Sens. Actuators B Chem. 2021, 347, 130600. [Google Scholar] [CrossRef]
  10. Zhang, R.K.; Wang, D.; Wu, Y.J.; Hu, Y.H.; Chen, J.Y.; He, J.C.; Wang, J.X. A cataluminescence sensor based on NiO nanoparticles for sensitive detection of acetaldehyde. Molecules 2020, 25, 1097. [Google Scholar] [CrossRef] [PubMed]
  11. Dong, S.Q.; Yuan, Z.Q.; Lin, Y.J.; Ding, C.F.; Lu, C. Propanol-triggered luminescence for rapid screening of crystal facets in noble metal. Anal. Chem. 2019, 91, 4513–4519. [Google Scholar] [CrossRef] [PubMed]
  12. Hu, J.X.; Zhang, L.C.; Song, H.J.; Lv, Y. Evaluating the band gaps of semiconductors by cataluminescence. Anal. Chem. 2021, 93, 14454–14461. [Google Scholar] [CrossRef] [PubMed]
  13. Lu, Z.; Lu, X.; Xia, L.; Zhong, Y.; Li, G.; Hu, Y. Cobalt doped nitrogenous porous carbon derived from covalent organic framework as cataluminescence catalyst for rapid determination of n-hexane in edible oil. Talanta 2021, 232, 122428. [Google Scholar] [CrossRef] [PubMed]
  14. Pei, X.; Hu, J.; Song, H.; Zhang, L.; Lv, Y. Ratiometric cataluminescence sensor of amine vapors for discriminating meat spoilage. Anal. Chem. 2021, 93, 6692–6697. [Google Scholar] [CrossRef] [PubMed]
  15. Wang, X.; Na, N.; Zhang, S.C.; Wu, Y.Y.; Zhang, X.R. Rapid screening of gold catalysts by chemiluminescence-based array imaging. J. Am. Chem. Soc. 2007, 129, 6062–6063. [Google Scholar] [CrossRef] [PubMed]
  16. Na, N.; Zhang, S.C.; Wang, X.; Zhang, X.R. Cataluminescence-based array imaging for high-throughput screening of heterogeneous catalysts. Anal. Chem. 2009, 81, 2092–2097. [Google Scholar] [CrossRef] [PubMed]
  17. Shi, Z.X.; Li, G.K.; Hu, Y.F. Cataluminescence sensor based on Pt/NU-901 nanocomposite for rapid capture, catalysis and detection of acetone in exhaled breath. Anal. Chim. Acta 2022, 1206, 339787. [Google Scholar] [CrossRef]
  18. Zhang, Q.C.; Yan, W.L.; Jiang, L.; Zheng, Y.G.; Wang, J.X.; Zhang, R.K. Synthesis of nano-praseodymium oxide for cataluminescence sensing of acetophenone in exhaled breath. Molecules 2019, 24, 4275. [Google Scholar] [CrossRef]
  19. Na, N.; Liu, H.Y.; Han, J.Y.; Han, F.F.; Liu, H.L.; Ouyang, J. Plasma-assisted cataluminescence sensor array for gaseous hydrocarbons discrimination. Anal. Chem. 2012, 84, 4830–4836. [Google Scholar] [CrossRef]
  20. Zhang, Z.Y.; Jiang, H.J.; Xing, Z.; Zhang, X.R. A highly selective chemiluminescent H2S sensor. Sens. Actuators B Chem. 2004, 102, 155–161. [Google Scholar] [CrossRef]
  21. Cai, P.Y.; Bai, W.; Zhang, L.C.; Song, H.J.; Su, Y.Y.; Lv, Y. Hierarchical hollow microsphere and flower-like indium oxide: Controllable synthesis and application as H2S cataluminescence sensing materials. Mater. Res. Bull. 2012, 47, 2212–2218. [Google Scholar] [CrossRef]
  22. Zeng, B.R.; Zhang, L.C.; Wan, X.Y.; Song, H.J.; Lv, Y. Fabrication of α-Fe2O3/g-C3N4 composites for cataluminescence sensing of H2S. Sens. Actuators B Chem. 2015, 211, 370–376. [Google Scholar] [CrossRef]
  23. Wu, L.Q.; Zhang, L.C.; Sun, M.X.; Liu, R.; Yu, L.Z.; Lv, Y. Metal-free cataluminescence gas sensor for hydrogen sulfide based on its catalytic oxidation on silicon carbide nanocages. Anal. Chem. 2017, 89, 13666–13672. [Google Scholar] [CrossRef] [PubMed]
  24. Yu, K.L.; Hu, J.X.; Li, X.H.; Zhang, L.C.; Lv, Y. Camellia-like NiO: A novel cataluminescence sensing material for H2S. Sens. Actuators B Chem. 2019, 288, 243–250. [Google Scholar] [CrossRef]
  25. Liu, D.; Lin, L.M.; Chen, Q.F.; Zhou, H.Z.; Wu, J.M. Low power consumption gas sensor created from silicon nanowires/TiO2 core-shell heterojunctions. ACS Sens. 2017, 2, 1491–1497. [Google Scholar] [CrossRef]
  26. Ji, H.C.; Zeng, W.; Li, Y.Q. Gas sensing mechanisms of metal oxide semiconductors: A focus review. Nanoscale 2019, 11, 22664–22684. [Google Scholar] [CrossRef]
  27. Kang, X.Y.; Deng, N.P.; Yan, Z.R.; Pan, Y.W.; Sun, W.; Zhang, Y.F. Resistive-type VOCs and pollution gases sensor based on SnO2: A review. Mater. Sci. Semicond. Process 2022, 138, 106246. [Google Scholar] [CrossRef]
  28. Kaur, J.; Roy, S.C.; Bhatnagar, M.C. Highly sensitive SnO2 thin film NO2 gas sensor operating at low temperature. Sens. Actuators B Chem. 2007, 123, 1090–1095. [Google Scholar] [CrossRef]
  29. Sukunta, J.; Wisitsoraat, A.; Tuantranont, A.; Phanichphant, S.; Liewhiran, C. Highly-sensitive H2S sensors based on flame-made v-substituted SnO2 sensing films. Sens. Actuators B Chem. 2017, 242, 1095–1107. [Google Scholar] [CrossRef]
  30. Choi, M.S.; Ahn, J.; Kim, M.Y.; Mirzaei, A.; Choi, S.; Chun, D.W.; Jin, C.; Lee, K.H. Changes in the crystal structure of SnO2 nanoparticles and improved h2s gas-sensing characteristics by Al doping. Appl. Surf. Sci. 2021, 565, 150493. [Google Scholar] [CrossRef]
  31. Nakla, W.; Wisitsora-At, A.; Tuantranont, A.; Singjai, P.; Phanichphant, S.; Liewhiran, C. H2S sensor based on SnO2 nanostructured film prepared by high current heating. Sens. Actuators B Chem. 2014, 203, 565–578. [Google Scholar] [CrossRef]
  32. Liu, L.; Wang, Y.Y.; Dai, Y.B.; Li, G.H.; Wang, S.Q.; Li, T.; Zhang, T.; Qin, S.J. In situ growth of NiO@SnO2 hierarchical nanostructures for high performance H2S sensing. Acs Appl. Mater. Interfaces 2019, 11, 44829–44836. [Google Scholar] [CrossRef] [PubMed]
  33. Meng, F.F.; Lu, Z.Y.; Zhang, R.K.; Li, G.K. Cataluminescence sensor for highly sensitive and selective detection of iso-butanol. Talanta 2019, 194, 910–918. [Google Scholar] [CrossRef]
  34. Bhattacharjee, A.; Ahmaruzzaman, M.; Sinha, T. A novel approach for the synthesis of SnO2 nanoparticles and its application as a catalyst in the reduction and photodegradation of organic compounds. Spectrochim. Acta Part A Mol. Biomol. Spectrosc. 2015, 136, 751–760. [Google Scholar] [CrossRef] [PubMed]
  35. Babu, B.; Reddy, I.N.; Yoo, K.; Kim, D.; Shim, J. Bandgap tuning and XPS study of SnO2 quantum dots. Mater. Lett. 2018, 221, 211–215. [Google Scholar] [CrossRef]
  36. Mousavi, H.; Mortazavi, Y.; Khodadadi, A.A.; Saberi, M.H.; Alirezaei, S. Enormous enhancement of pt/sno2 sensors response and selectivity by their reduction, to CO in automotive exhaust gas pollutants including CO, NOx and C3H8. Appl. Surf. Sci. 2021, 546, 149120. [Google Scholar] [CrossRef]
  37. Vojisavljević, K.; Savić, S.M.; Počuča-Nešić, M.; Hodžić, A.; Kriechbaum, M.; Ribić, V.; Rečnik, A.; Vukašinović, J.; Branković, G.; Djokić, V. Kit-5-assisted synthesis of mesoporous SnO2 for high-performance humidity sensors with a swift response/recovery speed. Molecules 2023, 28, 1754. [Google Scholar] [CrossRef]
  38. Yan, L.; Pan, J.S.; Ong, C.K. XPS studies of room temperature magnetic Co-doped SnO2 deposited on Si. Mater. Sci. Eng. B 2006, 128, 34–36. [Google Scholar] [CrossRef]
  39. Pu, S.R.; Pan, Y.; Zhang, L.C.; Lv, Y. Online evaluation of the catalytic performance of MnO2 and its application in H2S cataluminscence sensing. Anal. Chim. Acta 2021, 1180, 338883. [Google Scholar] [CrossRef] [PubMed]
  40. Modaberi, M.R.; Rooydell, R.; Brahma, S.; Akande, A.A.; Mwakikunga, B.W.; Liu, C.P. Enhanced response and selectivity of H2S sensing through controlled Ni doping into ZnO nanorods by using single metal organic precursors. Sens. Actuators B Chem. 2018, 273, 1278–1290. [Google Scholar] [CrossRef]
  41. Bao, J.; Zhang, Z.; Zheng, Y. H2S sensor based on two-dimensional MoO3 nanoflakes: Transition between sulfidation and oxidation. Sens. Actuators B Chem. 2021, 345, 130408. [Google Scholar] [CrossRef]
  42. Leangtanom, P.; Wisitsoraat, A.; Jaruwongrangsee, K.; Chanlek, N.; Tuantranont, A.; Phanichphant, S.; Kruefu, V. Highly sensitive and selective sensing of H2S gas using precipitation and impregnation-made CuO/SnO2 thick films. Nanoscale Res. Lett. 2021, 16, 70. [Google Scholar] [CrossRef] [PubMed]
  43. Zhou, Y.; Gong, H.; Liu, H.J. Fluorine and oxygen-functionalized silicon nitride with abundant oxygen vacancies for cataluminescence sensing of H2S. Microchem. J. 2023, 193, 109096. [Google Scholar] [CrossRef]
  44. Zhou, Q.; Song, H.; Sun, T.; Zhang, L.; Lv, Y. Cataluminescence on 2D WS2 nanosheets surface for H2S sensing. Sens. Actuators B Chem. 2022, 353, 131111. [Google Scholar] [CrossRef]
  45. Degler, D.; Wicker, S.; Weimar, U.; Barsan, N. Identifying the active oxygen species in SnO2 based gas sensing materials: An operando IR spectrsocopy study. J. Phys. Chem. C 2015, 119, 11792–11799. [Google Scholar] [CrossRef]
  46. Wang, D.; Tian, L.; Li, H.J.; Wan, K.C.; Yu, X.; Wang, P.; Chen, A.Y.; Wang, X.Y.; Yang, J.H. Mesoporous ultrathin SnO2 nanosheets in situ modified by graphene oxide for extraordinary formaldehyde detection at low temperatures. ACS Appl. Mater. Interfaces 2019, 11, 12808–12818. [Google Scholar] [CrossRef]
  47. Wang, S.M.; Shi, W.Y.; Lu, C. Chemisorbed oxygen on the surface of catalyst-improved cataluminescence selectivity. Anal. Chem. 2016, 88, 4987–4994. [Google Scholar] [CrossRef] [PubMed]
  48. Selim, H.; Al Shoaibi, A.; Gupta, A. Examination of emission spectra from hydrogen sulfide flames. In Proceedings of the 49th AIAA Aerospace Sciences Meeting including the New Horizons Forum and Aerospace Exposition, Orlando, FL, USA, 4–7 January 2011; p. 440. [Google Scholar]
  49. Benner, R.L.; Stedman, D.H. Universal sulfur detection by chemiluminescence. Anal. Chem. 1989, 61, 1268–1271. [Google Scholar] [CrossRef]
Figure 1. XRD patterns of the as-prepared samples.
Molecules 28 07143 g001
Figure 2. TEM images of (a) SnO2−500 °C; (b) SnO2−600 °C; (c) SnO2−700 °C. HRTEM images of (d) SnO2−500 °C; (e) SnO2−600 °C; (f) SnO2−700 °C. SAED images of (g) SnO2−500 °C; (h) SnO2−600 °C; (i) SnO2−700 °C.
Molecules 28 07143 g002
Figure 3. Nitrogen adsorption–desorption isotherms of (a) SnO2−500 °C; (b) SnO2−60 °C; (c) SnO2−700 °C. Pore size distribution of (d) SnO2−500 °C; (e) SnO2−600 °C; (f) SnO2−700 °C.
Molecules 28 07143 g003
Figure 4. Sn 3d core level XPS spectra of (a) SnO2−500 °C; (b) SnO2−600 °C; (c) SnO2−700 °C. O 1s core level XPS spectra of (d) SnO2−500 °C; (e) SnO2−600 °C; (f) SnO2−700 °C.
Molecules 28 07143 g004
Figure 5. (a) The response curves of the three sensors toward H2S. (b) The responses of the three sensors toward 50 ppm of H2S and 2000 ppm of potentially interfering gases.
Molecules 28 07143 g005
Figure 6. The effects of the detecting wavelength (a), operating temperature (b), and flow rate (c) on the CTL response signal and S/N. The concentration of H2S used was 50 ppm. For wavelength optimization, the operating temperature was 210 °C, and the flow rate was 800 mL/min. For temperature optimization, the detecting wavelength was 350 nm, and the flow rate was 800 mL/min. For flow rate optimization, the detecting wavelength was 350 nm, and the operating temperature was 210 °C.
Molecules 28 07143 g006
Figure 7. (a) Linear relationship between the CTL response signal and H2S concentration. (b) CTL response profiles of the sensor toward different concentrations of H2S. Inset: enlarged view of the CTL response profiles.
Molecules 28 07143 g007
Figure 8. The influence of the oxygen content on the CTL intensity of the H2S response on the SnO2−600 °C surface.
Molecules 28 07143 g008
Figure 9. The schematic diagram of the sensing setup.
Molecules 28 07143 g009
Table 1. The BET, Langmuir, and BJH results for the three samples.
SampleBET Surface Area
(m2/g)
Langmuir Surface Area
(m2/g)
BJH
(nm)
SnO2−500 °C19.70289.0717.41
SnO2−600 °C19.73295.6117.02
SnO2−700 °C2.3114.00-
Table 2. XPS results of different chemical states of O elements at the surface of the as-prepared SnO2 nanomaterials.
SampleBinding Energy (eV)Percentage (%)
OLOCOLOC
SnO2−500 °C530.74532.3965.8834.12
SnO2−600 °C530.89532.5054.7045.30
SnO2−700 °C530.32532.1173.0326.97
Table 3. Comparison of the sensing performances of H2S sensors.
PrincipleSensing
Material
Operating
Temperature (°C)
SelectivityRes./Rec. Time (s)Linear Range
(ppm)
LOD (ppm)Ref.
Electricity0.1 wt% V-doped SnO2350Little response to NO (5 ppm), NO2 (5 ppm), SO2 (500 ppm), and ethanol (50 ppm).2 s/few min0.25–100.08[29]
ElectricitySnO2-Al (1: 0.33)350Moderate response to 10 ppm of ethanol, ammonia, and toluene.35/NDNDND[30]
ElectricitySnO2 nanowires250Moderate response to 2000 ppm of ethanol and CO and strong response to NO2 (3 ppm).2.3/ND0.2–10ND[31]
ElectricityNiO@SnO2240Weak response to 0.5 ppm of NH3, toluene, formaldehyde, and NO2.37/500.1–500.0015 (in theory)[32]
ResistanceNi-doped ZnO nanorod200Moderate response to 100 ppm of methane, toluene, methanol, and ethanol.48/605–40ND[40]
ElectricityMoO3 nanoflakes300No response to NH3, formaldehyde, benzene, and CO. Weak response to SO2 and ethanol.ND0.5–30ND[41]
ElectricityCuO/SnO2200Weak response to 200 ppm of SO2 (200 ppm) and 1000 ppm of methane, hydrogen, and acetylene.ND0.15–100.15[42]
CTLFlower-like
In2O3
400Weak response to methyl sulfide and ethanol. No response to methanol, propanol, benzene, cyclohexane, etc.5/251317.6–13,176329[21]
CTLα-Fe2O3/g-C3N4183No response to 64 mg/L of methanol, ethanol, n-propanol, isopropanol, n-butanol, isobutanol, formaldehyde, and acetaldehyde.0.1/0.6580–4618329[22]
CTLF-doped
cage-like SiC
298Weak response to 64 ppm of 1-dodecanethiol and 1-thioglycerol. No response to 64 ppm of ethanol, isobutanol, tert-butyl alcohol, n-pentanol, methanol, acetone, etc.0.1/0.66.1–30.43.0[23]
CTLCamellia-like NiO246Weak response to 65 ppm of formaldehyde, acetaldehyde, formic acid, acetic acid, acetone, ether, carbon disulfide, methyl mercaptan, ethyl mercaptan, etc.0.2/0.40.8–30.80.3[24]
CTLβ-MnO2224Weak response to acetone, 2-propanol, propionaldehyde, isobutanol, n-propanol, ethanol, and methanol.0.3/0.41601–19,173184[39]
CTLF/O-Si3N4230Weak response to 64 ppm of ether and acetone. No response to ethanol, isobutanol, tert-butyl alcohol, n-pentanol, methanol, acetone, cyclohexanone, etc.0.5/1322–538217.8[43]
CTL2D WS2 nanosheets187No response to methanol, ethanol, acetone, formaldehyde, acetaldehyde, formic acid, carbon disulfide, benzene, etc.0.2/0.2171–420340[44]
CTLSnO2210Weak response to 2000 ppm of ammonium sulfide. No response to 2000 ppm of ethanethiol, dimethyl sulfide, trimethylamine, dimethylamine, triethylamine, ethylenediamine, ammonia, benzene, toluene, o-xylene, m-xylene, p-xylene, styrene, trichloroethylene, methanol, ethanol, acetone, formaldehyde, acetaldehyde, propionaldehyde, CO, CO2, and SO2, and 1000 ppm of dimethyl sulfide.3.5/1.520–4208This work
Disclaimer/Publisher’s Note: The statements, opinions and data contained in all publications are solely those of the individual author(s) and contributor(s) and not of MDPI and/or the editor(s). MDPI and/or the editor(s) disclaim responsibility for any injury to people or property resulting from any ideas, methods, instructions or products referred to in the content.

