Abstract
Estimating the measurement uncertainty (MU) is becoming increasingly mandatory in analytical toxicology. This study evaluates the uncertainty in the quantitative determination of urinary amphetamine (AP) and 4-hydroxyamphetamine (4HA) using a liquid chromatography–tandem mass spectrometry (LC–MS/MS) method based on the dilute-and-shoot approach. Urine sample dilution, preparation of calibrators, calibration curve, and method repeatability were identified as the sources of uncertainty. To evaluate the MU, the Guide to the Expression of Uncertainty in Measurement (GUM) approach and the Monte Carlo method (MCM) were compared using the R programming language. The MCM afforded a smaller coverage interval for both AP (94.83, 104.74) and 4HA (10.52, 12.14) than that produced by the GUM (AP (92.06, 107.41) and 4HA (10.21, 12.45)). The GUM approach offers an underestimated coverage interval for Type A evaluation, whereas the MCM provides an exact coverage interval under an abnormal probability distribution of the measurand. The MCM is useful in complex settings where the measurand is combined with numerous distributions because it is generated from the uncertainties of input quantities based on the propagation of the distribution. Therefore, the MCM is more practical than the GUM for evaluating the MU of urinary AP and 4HA concentrations using LC–MS/MS.
1. Introduction
Amphetamine (AP) is an active metabolite of methamphetamine and is a commonly prescribed drug for treating attention-deficit hyperactivity disorder (ADHD) [1,2]. ADHD diagnoses have recently increased, along with the use of prescription psychostimulants, particularly prescription ADHD medications [3,4]. Simultaneously, the abuse of these drugs has also increased among students globally, including in the Republic of Korea [5,6,7,8]. According to the Korean Ministry of Food and Drug Safety, the widespread use of ADHD psychostimulants among teenagers constitutes an epidemic that may contribute to future drug addictions [9]. Therefore, the Korean government has officially registered AP as a controlled substance owing to its high abuse potential. Although AP is less potent than methamphetamine, it is still a stimulant of the central nervous system. It is metabolized to benzoic acid, 1-phenylpropan-2-one, and 4-hydroxyamphetamine (4HA). 4HA, a sympathomimetic amine, is an active metabolite [4,5]. The presence of AP and 4HA in biological samples is generally determined using two types of hyphenated mass spectrometric methods: gas chromatography–mass spectrometry [6] and liquid chromatography–tandem mass spectrometry (LC–MS/MS) [7,8,10]. Herein, LC–MS/MS was used because it does not require an additional derivatization process for polar functional groups in target analytes [9], resulting in short sample preparation times.
The ISO/IEC 17025:2017 standard specifies the guidelines that enable laboratories to verify their competency and generate valid results, which promotes confidence in their analytical experiments [11]. Estimating the measurement uncertainty (MU) is being increasingly mandated in analytical toxicology by quality management standards, e.g., ISO/IEC 17025, to produce reliable results [12]. The Guide to the Expression of Uncertainty in Measurement (GUM) approach estimates the overall uncertainty based on the law of propagation of uncertainty or a bottom-up approach, identifying and quantifying the uncertainties in individual sources [13]. The GUM approach mainly involves specification, identification, quantification, and combination [14]. It provides a fundamental structure for evaluating the MU by assuming that all systematic errors are identical and amendable in the early stages of the evaluation. The GUM approves the use of its own approach and the Monte Carlo method (MCM) for the expression of the MU. However, the GUM approach has two main limitations. First, the first-order derivative of each component of the output quantity needs to be calculated, which requires mathematical expertise, particularly if the mathematical model is complex [15]. Second, it cannot exactly predict the probability distribution of the output quantity if the input quantities are not normally distributed. The MCM involves the propagation of the entire probability distribution of the input quantities without the need for calculating the first-order derivatives. Thus, it provides a numerical approximation to the distribution associated with a measurand, which is correlated with the measurement model and the distributions assigned to the input quantities [16]. It also provides a probability density function (PDF) for the output quantity as the final result, from which the coverage interval can be determined.
This study aims to estimate the MU associated with the quantification of urinary AP and 4HA using LC–MS/MS. Moreover, it examines the differences between the GUM approach and the MCM for calculating the MU of hardness and the input correlation effect on the uncertainty budget.
2. Results and Discussion
2.1. GUM Approach for Evaluating the Measurement Uncertainty
2.1.1. Urine Sample Dilution
The urine sample (100 μL) was prepared by mixing it with an internal standard (IS) (50 μL) and mobile phase A (50 μL) before performing the LC–MS/MS analysis. The uncertainty associated with urine sample dilution, , combines those resulting from the inaccuracies stemming from the use of a measuring pipette for urine sample dilution for sample preparation. The volume MU from pipetting was indicated in the calibration report as (100 ± 0.1) µL and (50 ± 0.1) µL with a coverage factor of 2. The standard uncertainties were evaluated as and . The relative standard uncertainties were and :
The relative standard uncertainty () was 0.000866:
2.1.2. Preparation of Calibrators
The uncertainty associated with the preparation of calibrators is approximated to the highest individual uncertainty of the preparatory steps—the MU of the reference standard and inaccuracy of the measuring devices (e.g., volumetric pipettes and volumetric flasks). The reference standards are used as calibrators and quality control (QC) samples in forensic toxicology [17]. The uncertainties of the certified ampoule solution reference standards of AP and 4HA were both (1.00 ± 0.006) mg/mL with a coverage factor of 2. The standard uncertainties were evaluated as and The relative standard uncertainties were and , as shown below:
The volume MU from pipetting, , was indicated in the calibration report as (1000 ± 1.5) µL and (500 ± 1.5) µL with a coverage factor of 2. The standard uncertainties were evaluated as and . The relative standard uncertainties were and :
The volume MU from using a 10 mL glass volumetric flask, , was indicated on the calibration report as (10 ± 0.006) mL with a coverage factor of 2. The standard uncertainty was evaluated as . Additional uncertainty due to temperature differences between calibration time and the analysis time was estimated as ±5 °C, by considering the cubic thermal expansion coefficient of methanol (α = 0.00149 mL/°C) [18]. The temperature variation for the measurement step was (25 ± 5) °C, determined using a uniform distribution (Table 1) [13]. The standard uncertainty () was 0.004301 mL:

Table 1.
Information about input quantities of the model.
These standard uncertainty components are combined as one standard uncertainty according to the law of the propagation of errors. The combined standard uncertainty, , was 0.043114 mL, and the estimated relative standard uncertainty () was 0.004311 mL:
The derivation of the uncertainty of calibrators is described in detail in Supplementary Materials S1. It includes the following steps: (1) preparation of the working standard solution; (2) preparation of the calibration standard solutions; and (3) dilution. The uncertainty associated with the preparation of the working standard solution ( and ) was calculated by combining the uncertainties resulting from the use of reference standard, pipettes, and volumetric flasks. The calibration standard solutions were obtained by serial dilution of the working standard solution with the pooled blank urine [19]. The uncertainty associated with the calibrators ( and ) was calculated by combining the uncertainties of pipettes, calibration standard solutions, and dilutions, as follows:
where is the uncertainty of each calibration standard solution for
2.1.3. Calibration Curve
Calibration curves were prepared by plotting the peak area ratio against the analyte concentration, which required the preparation of calibrators (n = 7, see Section 3). These calibration curves were used to estimate the analyte concentrations in the urine samples. The calibration functions were calculated and fitted by a linear regression model with a weighting factor () yielding the following equation:
where is a value on the x-axis and is the peak area ratio of the analyte () to its IS () in the urine sample [20].
The urine sample of an AP abuser was analyzed, and for AP and for 4HA were obtained. The standard uncertainties and relative standard uncertainties of AP and 4HA were determined by solving regression equations for the weighted model. The standard uncertainties of the calibration curve () for AP and 4HA were 2.539030 and 0.372684, respectively, while their relative standard uncertainties () were 0.025458 and 0.032891, respectively, calculated as follows:
where is the determined concentration of the analyte, is the peak area ratio of the analyte, and is the weighting factor of the calibration curve in the urine sample.
2.1.4. Method Repeatability
Method repeatability is estimated by conducting measurements in multiple independent experimental assays. To ensure the repeatability of the analytical methodology, QC samples were prepared for AP (30, 150, and 300 ng/mL) and 4HA (6, 30, and 150 ng/mL) in blank urine. Six independent determinations were performed on each prepared QC sample on four different days to obtain a repeatability estimate using the abovementioned method (Table 2). The relative standard uncertainties () were 0.019355 for AP and 0.028505 for 4HA.
where is the standard deviation for multiple replicates, is the number of replicates, and is the mean of the measurements [21]. Next, the relative standard uncertainty was linearly interpolated to estimate the corresponding value with the estimated measurand concentrations of AP and 4HA [22].
Table 2.
Results of the evaluation of method repeatability from low-, middle-, and high-quality control samples.
The effective degree of freedom () was obtained by calculating the degree of freedom for each component of uncertainty using the Welch–Satterthwaite equation (Table 3):
where is the degree of freedom of the i-th component of uncertainty, is the standard uncertainty of the i-th component, and is the combined uncertainty [23].
Table 3.
Estimation of uncertainty contributions in quantitative LC–MS/MS analysis results of amphetamine (AP) and 4-hydroxyamphetamine (4HA) in urine.
2.1.5. Calculating the Combined and Expanded Uncertainty
The uncertainties from four individual components in the urine analysis of AP and 4HA were quantified (Table 3). The combined standard MU of the overall analytical method () was calculated as follows:
If the measured quantity is related to the t-distribution from which the values are taken, the selection of k = 2.07 and 2.08 for AP and 4HA, respectively, is indicative of a 95% confidence level. Expanded uncertainty () was obtained by multiplying the combined standard MU ( with the coverage factor (), as shown below:
The expanded uncertainties of AP and 4HA in the sample were 7.68 and 1.12 ng/mL, respectively. Therefore, the concentrations of AP and 4HA in the real urine sample with their expanded uncertainties were 99.74 ± 7.68 and 11.33 ± 1.12 ng/mL, respectively. Figure 1 shows the relative contribution of the main uncertainty sources to the overall combined standard uncertainty for the quantification of urinary AP and 4HA using the GUM approach.
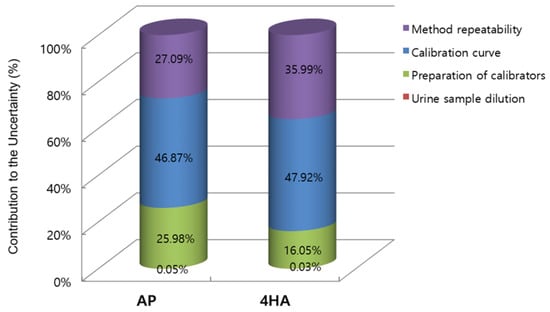
Figure 1.
Relative contribution of the four different uncertainty sources to the overall combined uncertainty of amphetamine (AP) and 4-hydroxyamphetamine (4HA) in the Guide to the Expression of Uncertainty in Measurement (GUM) approach.
2.2. MCM for the Evaluation of MU
2.2.1. Mathematical Modeling of the Measurand
The following mathematical modeling of the measurand was used for the MCM:
where , , is the peak area ratio of the analyte ) to its deuterated IS (, is the y-intercept, is the calibration curve slope, is the additive factor for the urine sample dilution uncertainty, and is the additive factor for the method repeatability uncertainty.
The measurand for Equation (21) does not include the additive factor for the uncertainty of calibrators and calibration curve uncertainty because the calibration curve was estimated using error-contaminated calibrators (because of the uncertainty of calibrators). Therefore, indicates the randomness associated with the preparation of calibrators and the calibration curve. The PDFs of the reference standard (), pipette (), and 10 mL volumetric flask () values were followed by the calibration report, whilethe volumetric expansion is assumed, as the temperature () has a uniform distribution (Table 1).
2.2.2. MCM Simulation
The MCM algorithm was implemented in R version 4.0.1 with 106 simulation trials (M = 106). The calibrators were first generated by utilizing the serial dilution described in Supplementary Data S1. The uncertainty of response yi was obtained from the standard deviations of four repeated measured peak area ratios at each calibrator, while response yi was drawn from a normal distribution. The calibration curve was fitted using the weighted linear regression model with the generated calibrators. The responses of the peak area ratios and predicted measurand were obtained for each trial. The additive factors accounting for method repeatability and urine sample dilution were drawn from normal distributions with a mean of 0 and standard deviations obtained through the GUM approach, respectively. The R code to implement the MCM is available at Supplementary Data S2.
2.2.3. Uncertainty with MCM and Comparison with GUM Approach
Figure 2 shows the histograms overlaid with the kernel density estimates of the simulated measurand concentrations of AP and 4HA. The estimated AP concentration was 99.75 ng/mL, with an associated standard uncertainty of 2.53 ng/mL and a 95% coverage interval (94.83, 104.74). The estimated 4HA concentration was 11.33 ng/mL, with an associated standard uncertainty of 0.41 ng/mL and a 95% coverage interval (10.52, 12.14). The MCM provided a smaller coverage interval for both AP and 4HA compared to that obtained with the GUM approach (Table 4). In addition, the GUM approach underestimates the coverage interval, whereas the MCM provides an exact coverage interval under an abnormal probability distribution of the measurand [24]. Therefore, MCM is considered a more practical approach for evaluating MUs in this study.
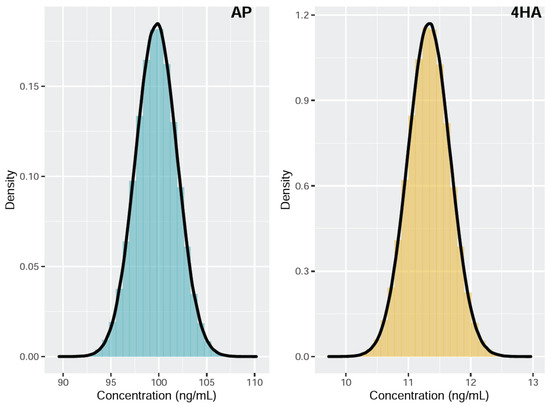
Figure 2.
Probability density function of the concentration measurand for amphetamine (AP) and 4-hydroxyamphetamine (4HA).
Table 4.
Statistical parameters obtained for the Guide to the Expression of Uncertainty in Measurement (GUM) approach and the Monte Carlo method (MCM) for the determination of urinary concentrations of amphetamine (AP) and 4-hydroxyamphetamine (4HA).
In the GUM approach, the standard uncertainty is obtained by combining uncertainties for each error-accompanied factor (law of propagation of uncertainty), while the expanded uncertainty is calculated by multiplying a coverage factor corresponding to the 95% confidence level. However, the GUM approach has two limitations: (1) the measured values should follow a t-distribution to obtain the expanded uncertainties and (2) the uncertainty of calibrators and calibration curve uncertainty shown in Equation (18) should be additively combined. However, the intercept ( and slope estimates in Equation (12) include calibrators, demonstrating a non-linear relationship between the calibrators and the measurand. Thus, simply adding the uncertainty of calibrators would be inaccurate; therefore, a correct uncertainty equation based on the law of propagation of uncertainty should be considered for the GUM approach. In the MCM, the measurand is generated from the uncertainties of input quantities using the propagation of distribution. The propagation of distribution is useful in complex settings where the measurand combines numerous distributions and the distribution of the measurand is unknown [25,26].
The GUM approach, based on the law of propagation of uncertainty, should be used with caution when the model includes complex non-linear elements. The uncertainty of calibrators was added to the combined uncertainty of other sources in most previous studies [22,27] and was also used here. However, this approach becomes invalid when the measurand and calibrators have non-linear relationships. When the analyte concentration of the samples is estimated, the measurement error of calibrators is not considered in the GUM approach. If this measurement error model can be considered an additive Berkson error problem of the form , where is the true calibrator, is the error-contaminated calibrator, and is the additive Berkson error term, then the intercept and slope estimators become unbiased in a simple linear regression model [28]. However, the true calibrators and error-contaminated calibrators may not have an additive Berkson error problem, which leads to a bias between the intercept and slope estimators. In the present study, the uncertainty of calibrators is small, which results in negligible bias in the estimate of the measurand. The analytical standard uncertainty of the analyte based on the multiple standard addition method was investigated in a previous paper [29], and it accounted for the measurement error in the response and calibrators. Further research is required to account for the measurement error in the response and calibrators in an IS calibration method using the method of measurement error correction to obtain correct estimators and standard uncertainty.
3. Materials and Methods
3.1. Chemicals and Reagents
AP, 4HA, and AP-d8 were obtained as solutions from Cerilliant (Austin, TX, USA). HPLC-grade methanol was purchased from J.T. Baker/Avantor (Center Valley, PA, USA). Water (LiChrosolv-grade) was supplied by Merck (Darmstadt, Germany). Formic acid (LC–MS LiChropur-grade) was purchased from Sigma Aldrich (St. Louis, MO, USA). All other chemicals were of analytical grade or higher. The AP and 4HA working standard solutions (10 µg/mL) were prepared by dilution with methanol. The IS working solution was prepared in methanol to obtain an AP-d8 solution (0.1 µg/mL). These solutions were stored at −20 °C in amber bottles before use.
3.2. Preparation of Urine Sample
Blank urine samples were obtained from the laboratory staff with their consent. Pooled blank urine was used for preparing calibrators and QC samples. Forensic urine samples were obtained from the Narcotics Departments at the District Prosecutors’ Offices (Seoul Metropolitan Area). The urine sample (100 μL) was transferred to a 1.5 mL polypropylene tube (Eppendorf, Hamburg, Germany) and mixed with mobile phase A (50 μL) and IS (50 μL). After centrifugation at 50,000× g for 3 min, 8 μL of clear supernatant was injected into the LC–MS/MS system.
3.3. Preparation of Calibrators and QC Samples
The linearity of the method was evaluated over the concentration ranges for AP (5, 10, 25, 50, 100, 250, and 500 ng/mL) and 4HA (2, 5, 10, 25, 50, 100, and 250 ng/mL). The linear least-squares regression of the ratio of the analyte to the IS peak area, with a weighting factor of 1/x2, was used to generate a calibration curve. QC samples for AP (30, 150, and 300 ng/mL) and 4HA (6, 30, and 150 ng/mL) were prepared by spiking the pooled blank urine samples with known amounts of each compound to ensure the repeatability of the LC–MS/MS method. The inter-day precision of the method was established via six independent determinations with the same QC samples on four independent experimental assays of the abovementioned replicates (n = 24).
3.4. LC–MS/MS Conditions
LC–MS/MS was performed using a Shiseido (Osaka, Japan) Nanospace SI-2 HPLC system coupled to a Sciex (Foster City, CA, USA) QTRAP 6500 mass spectrometer. The target compounds were separated using a Hypersil GOLD C18 column (150 mm × 2.1 mm i.d., 5 μm, Thermo Scientific, Waltham, MA, USA). The mobile phases consisted of 0.4% formic acid in water (mobile phase A) and methanol (mobile phase B) at different ratios at a flow rate of 400 μL/min. Gradient elution was initiated with a solution containing 10% of mobile phase B for 1 min. The mobile phase B content was increased to 20% over 3.5 min, then to 90% over 7 min, and was then maintained at 90% for 1 min. Finally, the condition was changed to the initial composition (i.e., 10% of mobile phase B) for 3 min to stabilize the system. The column was thermostated at 35 °C, while the autosampler temperature was 10 °C. Electrospray ionization was performed in the positive mode. The ion spray voltage and ion source temperature were set at 5500 V and 600 °C, respectively. Ion source gases 1 and 2, curtain gas, and collision gas were set to 55, 80, 60, and medium (arbitrary units), respectively. The scheduled multiple-reaction monitoring (MRM) mode was operated with a 60 s detection window. The most abundant and specific ion transitions were selected as the quantitative ion pairs of the target compounds, while the second-most abundant ones were employed as the qualitative ion pairs. The MRM ion pairs were set as follows: m/z 136 → 91 and m/z 136 → 119 for AP, m/z 152 → 132 and m/z 152 → 107 for 4HA, and m/z 144 → 97 for AP-d8.
3.5. Identification of the Uncertainty Sources
An estimation of the MU associated with the analytical results can be obtained by considering different individual uncertainties. The main uncertainty sources associated with quantifying AP and 4HA in urine were urine sample dilution, preparation of calibrators, calibration curve, and method repeatability.
3.6. Uncertainty Estimation Method
The uncertainty was quantified using the GUM approach and the MCM. The MU was estimated using the GUM approach as follows: (1) the measurand was defined; (2) possible uncertainty factors and sources were identified; (3) their contribution to MU was estimated; (4) the combined uncertainties were calculated; and (5) the expanded uncertainty was expressed to define a probability range. The uncertainty was calculated using the MCM as follows: (1) the measurand was defined; (2) possible uncertainty factors and sources were identified; (3) their contribution to MU was estimated using PDF; (4) the number of simulations was selected; (5) the simulation procedure was conducted; and (6) the measurand probability range was expressed based on the probability density distribution.
3.7. Specifying the Measurand
The measurand was defined as the concentration of AP and 4HA in each urine sample and was expressed using Equation (22):
where is the concentration of AP or 4HA in the urine sample, is the amount of AP or 4HA in the given sample volume, is the additive factor for the urine sample dilution uncertainty, is the additive factor for the calibrators uncertainty, is the additive factor for the calibration curve uncertainty, and is the additive factor for the method repeatability uncertainty.
4. Conclusions
Herein, we discussed the application of the GUM approach and the MCM for calculating the uncertainty generated while quantifying the urinary AP and 4HA using LC–MS/MS. The MCM provided a smaller coverage interval for both AP and 4HA compared to that obtained using the GUM approach. Since MCM provides an exact coverage interval under an abnormal probability distribution of the measurand, it is more practical for evaluating MU. The methods proposed herein can be widely applied to the MU evaluation of quantitative analyses in various fields, including forensic chemistry.
Supplementary Materials
The following supporting information can be downloaded at https://www.mdpi.com/article/10.3390/molecules28196803/s1. The derivation for uncertainty of calibrators is provided in Supplementary Data S1. The R code for uncertainty evaluation with the MCM for the quantification of urinary AP and 4HA using LC–MS/MS is available Supplementary Data S2.
Author Contributions
Conceptualization, J.Y.K.; methodology, S.Y.K. and J.L.; validation, S.Y.K. and N.H.K.; formal analysis, S.Y.K., D.W.S., J.H. and N.H.K.; investigation, D.W.S. and J.H.; writing—original draft preparation, S.Y.K.; writing—review and editing, J.C.C., K.-J.P., J.L. and J.Y.K.; supervision, J.L. and J.Y.K. All authors have read and agreed to the published version of the manuscript.
Funding
This study was partly supported by a grant from the R&D program of the Supreme Prosecutors’ Office of Korea and by the Chung-Ang University Research Grants in 2022.
Informed Consent Statement
Informed consent was obtained from all subjects involved in the study.
Data Availability Statement
The data presented in this study are available in manuscript and Supplementary Materials.
Conflicts of Interest
The authors declare that they have no known competing financial interests or personal relationships that could have appeared to influence the work reported in this paper.
Sample Availability
Samples of the compounds are not available from the authors.
References
- Stevenson, R.; Wolraich, M. Stimulant medication therapy in the treatment of children with attention deficit hyperactivity disorder. Pediatr. Clin. N. Am. 1989, 36, 1183–1197. Available online: https://www.sciencedirect.com/science/article/abs/pii/S0031395516367645 (accessed on 31 August 2022). [CrossRef] [PubMed]
- Parkes, J.D.; Fenton, G.W. Levo (−) amphetamine and dextro (+) amphetamine in the treatment of narcolepsy. J. Neurol. Neurosurg. Psychiatry 1973, 36, 1076–1081. Available online: https://jnnp.bmj.com/content/36/6/1076 (accessed on 31 August 2022). [CrossRef]
- Perez, E.; Knapp, J.; Horn, C.; Stillman, S.; Evans, J.; Arfsten, D. Comparison of LC–MS-MS and GC–MS analysis of benzodiazepine compounds included in the drug demand reduction urinalysis program. J. Anal. Toxicol. 2016, 40, 201–207. [Google Scholar] [CrossRef]
- Dring, L.; Smith, R.; Williams, R. The metabolic fate of amphetamine in man and other species. J. Biochem. 1970, 116, 425–435. [Google Scholar] [CrossRef]
- Cho, A.; Wright, J. Pathways of metabolism of amphetamine and related compounds. Life Sci. 1978, 22, 363–372. [Google Scholar] [CrossRef] [PubMed]
- Miranda, G.; Sordo, M.; Salazar, A.; Contreras, C.; Bautista, L.; Rojas, G.; Ostrosky, W. Determination of amphetamine, methamphetamine, and hydroxyamphetamine derivatives in urine by gas chromatography-mass spectrometry and its relation to CYP2D6 phenotype of drug users. J. Anal. Toxicol. 2007, 31, 31–36. [Google Scholar] [CrossRef] [PubMed]
- Hendrickson, H.; Laurenzana, E.; Owens, S.M. Quantitative determination of total methamphetamine and active metabolites in rat tissue by liquid chromatography with tandem mass spectrometric detection. AAPS J. 2006, 8, 709–717. [Google Scholar] [CrossRef]
- Lehmann, S.; Kieliba, T.; Beike, J.; Thevis, M.; Mercer-Chalmers-Bender, K. Determination of 74 new psychoactive substances in serum using automated in-line solid-phase extraction-liquid chromatography-tandem mass spectrometry. J. Chromatogr. B Biomed. Sci. Appl. 2017, 1064, 124–138. [Google Scholar] [CrossRef]
- Segura, J.; Ventura, R.; Jurado, C. Derivatization procedures for gas chromatographic-mass spectrometric determination of xenobiotics in biological samples, with special attention to drugs of abuse and doping agents. J. Chromatogr. B Biomed. Sci. Appl. 1998, 713, 61–90. [Google Scholar] [CrossRef]
- Shin, Y.; Kong, T.; Cheong, J.; Kim, J.; Lee, J.; Lee, H. Simultaneous determination of 75 abuse drugs including amphetamines, benzodiazepines, cocaine, opioids, piperazines, zolpidem and metabolites in human hair samples using liquid chromatography-tandem mass spectrometry. Biomed. Chromatogr. 2019, 33, e4600. [Google Scholar] [CrossRef]
- General Requirements for the Competence of Testing and Calibration Laboratories. 2017. Available online: http://www.iso.org/standard/66912.html (accessed on 31 August 2022).
- Taverniers, I.; Loose, M.D.; Bockstaele, E.V. Trends in quality in the analytical laboratory. I. Traceability and measurement uncertainty of analytical results. Trends Anal. Chem. 2004, 23, 480–490. [Google Scholar] [CrossRef]
- Joint Committee for Guides in Metrology. Evaluation of Measurement Data—Guide to the Expression of Uncertainty in Measurement. 2008. Available online: https://www.bipm.org/documents/20126/2071204/JCGM_100_2008_E.pdf (accessed on 31 August 2022).
- Shoemaker, D.P. Experiments in Physical Chemistry, 4th ed.; McGraw-Hill: New York, NY, USA, 1981; pp. 46–50. [Google Scholar]
- Azpúrua, M.; Tremola, C.; Páez, E. Comparison of the GUM and Monte Carlo method for the uncertainty estimation in electromagnetic compatibility testing. Prog. Electromagn. Res. B 2011, 34, 125–144. [Google Scholar] [CrossRef]
- Joint Committee for Guides in Metrology. Evaluation of Measurement Data—“Supplement 1 to the Guide to the Expression of Uncertainty in Measurement”—Propagations of Distributions Using a Monte Carlo Method. 2008. Available online: https://www.bipm.org/documents/20126/2071204/JCGM_101_2008_E.pdf (accessed on 31 August 2022).
- Gates, K.; Chang, N.; Dilek, I.; Jian, H.; Pogue, S.; Sreenivasan, U. The uncertainty of reference standards-a guide to understanding factors impacting uncertainty, uncertainty calculations, and vendor certifications. J. Anal. Toxicol. 2009, 33, 532–539. [Google Scholar] [CrossRef] [PubMed]
- Veen, A.; Cox, M. Getting started with uncertainty evaluation using the Monte Carlo method in R. Accred. Qual. Assur. 2021, 26, 129–141. [Google Scholar] [CrossRef]
- Hayashi, Y.; Matsuda, R. An expression of uncertainty in calibration using stepwise or separate dilution of a stock solution. Anal. Sci. 2006, 22, 889–894. [Google Scholar] [CrossRef][Green Version]
- Kim, J.Y.; Kwon, W.; Kim, H.S.; Suh, S.; In, M.K. Estimation of measurement uncertainty for the quantification of 11-nor-delta 9-tetrahydrocannabinol-9-carboxylic acid and its glucuronide in urine using liquid chromatography–tandem mass spectrometry. J. Anal. Toxicol. 2014, 38, 164–170. [Google Scholar] [CrossRef]
- Jeong, Y.D.; Suh, S.I.; In, M.K.; Paeng, K.J.; Kim, J.Y. Determination of toluene and ethanol in urine by headspace and cryotrapping gas chromatography/mass spectrometry. Anal. Lett. 2017, 50, 1260–1275. [Google Scholar] [CrossRef]
- González, A.; Herrador, M.; Asuero, A.; Martín, J. A practical way to ISO. GUM measurement uncertainty for analytical assays including in-house validation data. In Quality Control in Laboratory; Gaffar, S., Ed.; IntechOpen Limited: London, UK, 2018; Chapter 8; pp. 109–123. [Google Scholar]
- US Department of Commerce, Technology Administration, National Institute of Standards and Technology. Guidelines for Evaluating and Expressing the Uncertainty of NIST Measurement Results. 1994. Available online: https://www.nist.gov/pml/nist-technical-note-1297 (accessed on 31 August 2022).
- Vilbaste, M.; Slavin, G.; Saks, O.; Pihl, V.; Leito, I. Can coverage factor 2 be interpreted as an equivalent to 95% coverage level in uncertainty estimation? Two case studies. Measurement 2010, 43, 392–399. [Google Scholar] [CrossRef]
- Sega, M.; Pennecchi, F.; Rinaldi, S.; Rolle, F. Uncertainty evaluation for the quantification of low masses of benzo[a]pyrene: Comparison between the Law of Propagation of Uncertainty and the Monte Carlo method. Anal. Chim. Acta 2016, 920, 10–17. [Google Scholar] [CrossRef]
- Vilbaste, M.; Tammekivi, E.; Leito, I. Uncertainty contribution of derivatization in gas chromatography/mass spectrometric analysis. Rapid Commun. Mass Spectrom. 2020, 34, e8704. [Google Scholar] [CrossRef]
- Klu, J.; Officer, J.; Park, A.; Mudie, R.; NicDaeid, N. Measurement uncertainty in quantifying delta-9-tetrahydrocannabinol (THC) in blood using SPE and LC/MS/MS. Forensic Sci. Int. 2021, 322, 110744. [Google Scholar] [CrossRef] [PubMed]
- Buonaccorsi, J.P. Measurement Error: Models, Methods, and Applications; Chapman & Hall/CRC Interdisciplinary Statistics Series; Taylor & Francis: Milton, UK, 2010; pp. 73–104. [Google Scholar]
- Hyk, W.; Stojek, Z. Quantifying uncertainty of determination by standard additions and serial dilutions methods taking into account standard uncertainties in both axes. Anal. Chem. 2013, 85, 5933–5939. [Google Scholar] [CrossRef] [PubMed]


Disclaimer/Publisher’s Note: The statements, opinions and data contained in all publications are solely those of the individual author(s) and contributor(s) and not of MDPI and/or the editor(s). MDPI and/or the editor(s) disclaim responsibility for any injury to people or property resulting from any ideas, methods, instructions or products referred to in the content. |
© 2023 by the authors. Licensee MDPI, Basel, Switzerland. This article is an open access article distributed under the terms and conditions of the Creative Commons Attribution (CC BY) license (https://creativecommons.org/licenses/by/4.0/).