
Using the Correlation Intensity Index to Build a Model of Cardiotoxicity of Piperidine Derivatives


Abstract
:1. Introduction
2. Results
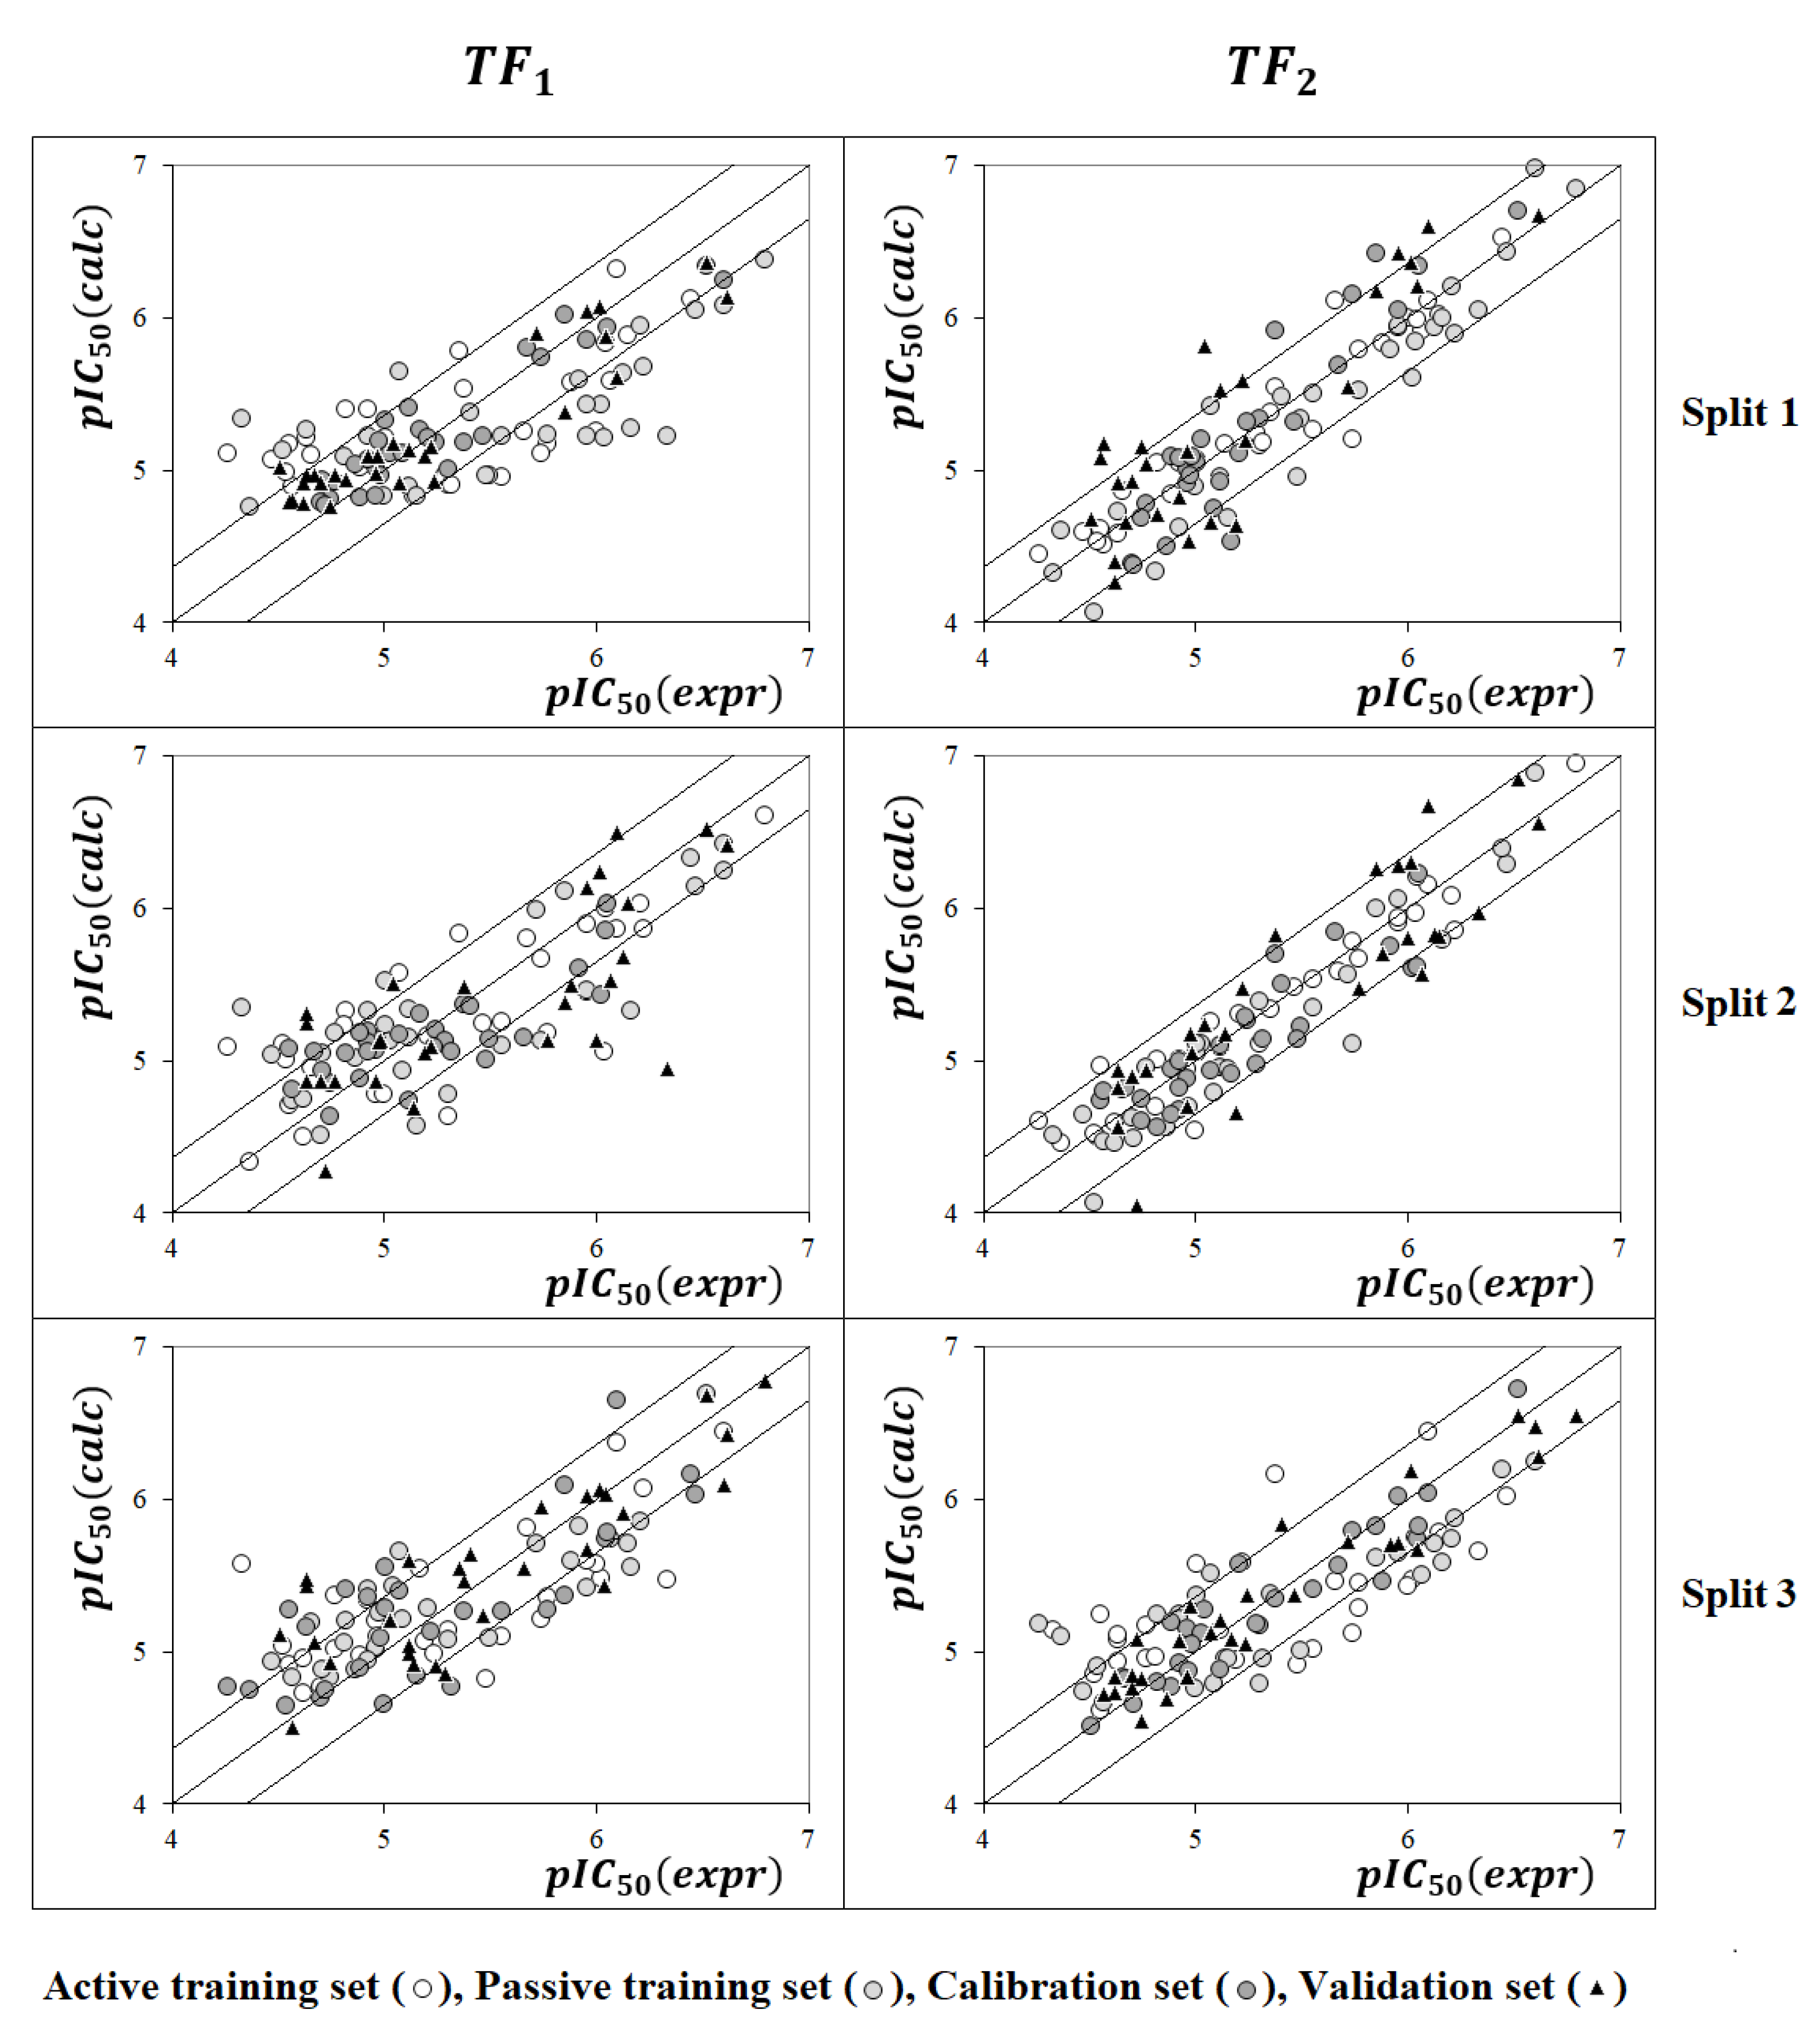
2.1. QSAR Models Based on TF1
2.2. QSAR Models Based on TF2
3. Discussion
- A defined endpoint;
- An unambiguous algorithm;
- A defined applicability domain;
- Appropriate measures of goodness-of-fit, robustness, and predictivity;
- A mechanistic interpretation, if possible.
- -
- Whether (and if so, how much) the considered endpoint depends on the representation of molecules using SMILES;
- -
- Whether (and if so, to what extent) the considered endpoint depends on the representation of molecules using graphs;
- -
- Whether the representation of the molecular features extracted from SMILES and the graph provide a synergetic effect (i.e., improving the predictive potential of a model in the comparison of the separate cases considering the SMILES-based model and graph-based model);
- -
- Whether IIC improves the predictive potential of models based on SMILES-based representation of molecules;
- -
- Whether IIC improves the predictive potential of models based on a graph-based representation of molecules;
- -
- Whether CII improves the predictive potential of models based on SMILES-based representation of molecules;
- -
- Whether CII improves the predictive potential of models based on a graph-based representation of molecules;
- -
- Whether the combined use of IIC and CII has a synergistic effect, that is, whether observed improvement of the predictive potential of models occurs if applying IIC and CII together compared to the cases of using IIC and CII separately.
4. Methods
4.1. Data
4.2. Optimal Descriptor
4.3. Monte Carlo Optimization
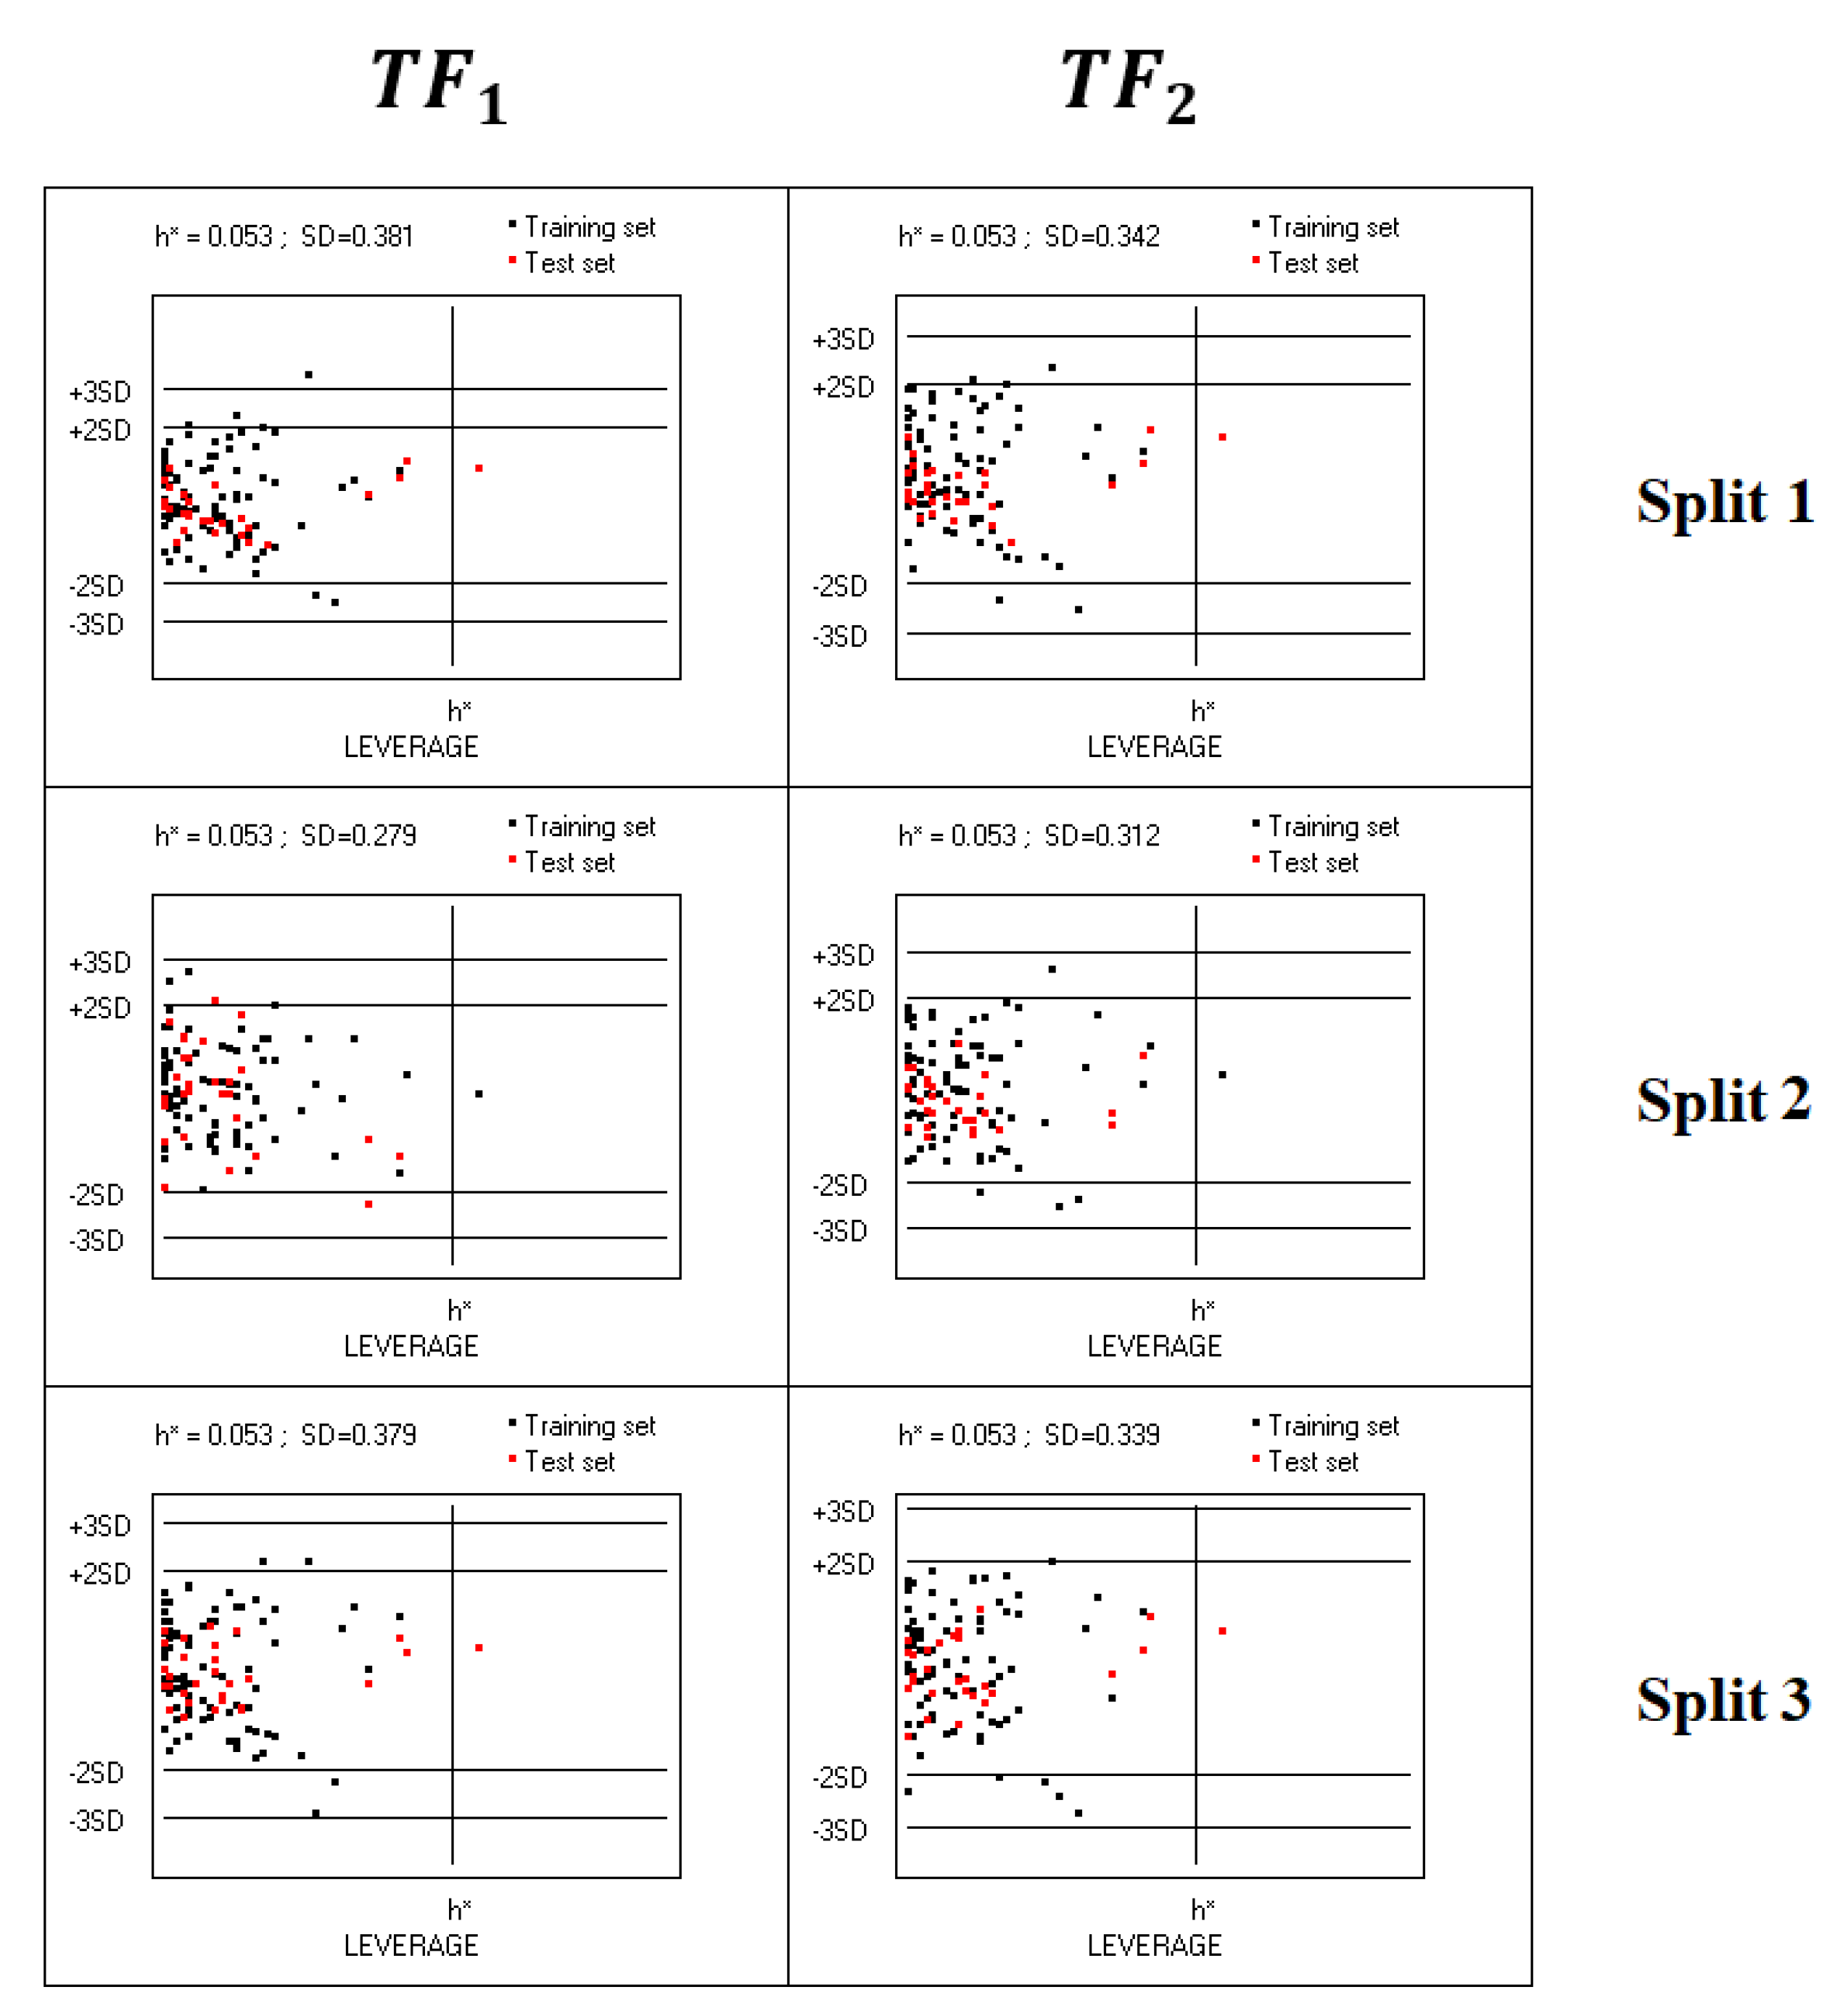
4.4. Applicability Domain
5. Conclusions
Supplementary Materials
Author Contributions
Funding
Institutional Review Board Statement
Informed Consent Statement
Data Availability Statement
Conflicts of Interest
References
- Niedziałkowski, P.; Czaczyk, E.; Jarosz, J.; Wcisło, A.; Białobrzeska, W.; Wietrzyk, J.; Ossowski, T. Synthesis and electrochemical, spectral, and biological evaluation of novel 9,10-anthraquinone derivatives containing piperidine unit as potent antiproliferative agents. J. Mol. Struct. 2019, 1175, 488–495. [Google Scholar] [CrossRef]
- Godugu, K.; El-Far, A.H.; Al Jaouni, S.; Mousa, S.A. Nanoformulated ajwa (phoenix dactylifera) bioactive compounds improve the safety of Doxorubicin without compromising its anticancer efficacy in breast cancer. Molecules 2020, 25, 2597. [Google Scholar] [CrossRef]
- Dragojevic, S.; Ryu, J.S.; Hall, M.E.; Raucher, D. Targeted Drug Delivery Biopolymers Effectively Inhibit Breast Tumor Growth and Prevent Doxorubicin-Induced Cardiotoxicity. Molecules 2022, 27, 3371. [Google Scholar] [CrossRef] [PubMed]
- LeBaron, T.W.; Kura, B.; Kalocayova, B.; Tribulova, N.; Slezak, J. A new approach for the prevention and treatment of cardiovascular disorders. Molecular hydrogen significantly reduces the effects of oxidative stress. Molecules 2019, 24, 2076. [Google Scholar] [CrossRef] [PubMed]
- Berra, C.; Torta, R. Therapeutic rationale of antidepressant use in the elderly. Arch. Gerontol. Geriatr. 2007, 44, 83–90. [Google Scholar] [CrossRef]
- Peltzer, S.; Köstler, U.; Müller, H.; Müller, H.; Scholten, N.; Schulz-Nieswandt, F.; Jessen, F.; Albus, C. The CoRe-Net Study Group. The psychological consequences of living with coronary heart disease: Are patients’ psychological needs served? A mixed-method study in Germany. Health Expect. 2022, 25, 2746–2761. [Google Scholar] [CrossRef]
- Mackin, P. Cardiac side effects of psychiatric drugs. Hum. Psychopharmacol. 2008, 23 (Suppl. S1), 3–14. [Google Scholar] [CrossRef]
- Jordaan, P.; Dumotier, B.; Traebert, M.; Miller, P.E.; Ghetti, A.; Urban, L.; Abi-Gerges, N. Cardiotoxic potential of hydroxychloroquine, chloroquine and azithromycin in adult human primary cardiomyocytes. Toxicol. Sci. 2021, 180, 356–368. [Google Scholar] [CrossRef]
- Hari Narayana Moorthy, N.S.; Karthikeyan, C.; Manivannan, E. Multi-algorithm based machine learning and structural pattern studies for hERG ion channel blockers mediated cardiotoxicity prediction. Chemometr. Intell. Lab. Syst. 2021, 208, 104213. [Google Scholar] [CrossRef]
- Krishna, S.; Borrel, A.; Kleinstreuer, N.; Huang, R.; Zhao, J.; Xia, M. High-Throughput Chemical Screening and Structure-Based Models to Predict hERG Inhibition. Biology 2022, 11, 209. [Google Scholar] [CrossRef]
- Spadarella, G.; Perillo, T.; Ugga, L.; Cuocolo, R. Radiomics in Cardiovascular Disease Imaging: From Pixels to the Heart of the Problem. Curr. Cardiovasc. Imaging Rep. 2022, 15, 11–21. [Google Scholar] [CrossRef]
- Dearani, J.A.; Connolly, H.M.; Martinez, R.; Fontanet, H.; Webb, G.D. Caring for adults with congenital cardiac disease: Successes and challenges for 2007 and beyond. Cardiol. Young. 2007, 17 (Suppl. S2), 87–96. [Google Scholar] [CrossRef] [PubMed]
- Gobbi, M.; Beeg, M.; Toropova, M.A.; Toropov, A.A.; Salmona, M. Monte Carlo method for predicting of cardiac toxicity: hERG blocker compounds. Toxicol. Lett. 2016, 250–251, 42–46. [Google Scholar] [CrossRef] [PubMed]
- Obiol-Pardo, C.; Gomis-Tena, J.; Sanz, F.; Saiz, J.; Pastor, M. A multiscale simulation system for the prediction of drug-induced cardiotoxicity. J. Chem. Inf. Model. 2011, 51, 483–492. [Google Scholar] [CrossRef]
- Toropov, A.A.; Toropova, A.P. QSPR/QSAR: State-of-art, weirdness, the future. Molecules 2020, 25, 1292. [Google Scholar] [CrossRef]
- Balaban, A.T. Interdisciplinary aspects of organic chemistry-cum-graph theory. Curr. Org. Chem. 2015, 19(4), 387–395. [Google Scholar] [CrossRef]
- Wang, H.; Zhu, G.; Izu, L.T.; Chen-Izu, Y.; Ono, N.; Altaf-Ul-Amin, M.D.; Kanaya, S.; Huang, M. On QSAR-based cardiotoxicity modeling with the expressiveness-enhanced graph learning model and dual-threshold scheme. Front. Physiol. 2023, 14, 1156286. [Google Scholar] [CrossRef]
- Toropov, A.A.; Toropova, A.P.; Lombardo, A.; Roncaglioni, A.; Benfenati, E.; Gini, G. CORAL: Building up the model for bioconcentration factor and defining it’s applicability domain. Eur. J. Med. Chem. 2011, 46, 1400–1403. [Google Scholar] [CrossRef]
- Toropov, A.A.; Toropova, A.P.; Lombardo, A.; Roncaglioni, A.; De Brita, N.; Stella, G.; Benfenati, E. CORAL: The prediction of biodegradation of organic compounds with optimal SMILES-based descriptors. Cent. Eur. J. Chem. 2012, 10, 1042–1048. [Google Scholar] [CrossRef]
- Toropov, A.A.; Toropova, A.P.; Roncaglioni, A.; Benfenati, E. Prediction of biochemical endpoints by the coral software: Prejudices, paradoxes, and Results. Methods Mol. Biol. 2018, 1800, 573–583. [Google Scholar] [CrossRef]
- Toropov, A.A.; Toropova, A.P.; Roncaglioni, A.; Benfenati, E. The system of self-consistent semi-correlations as one of the tools of cheminformatics for designing antiviral drugs. New J. Chem. 2021, 45, 20713–20720. [Google Scholar] [CrossRef]
- Toropova, A.P.; Toropov, A.A.; Roncaglioni, A.; Benfenati, E. The index of ideality of correlation improves the predictive potential of models of the antioxidant activity of tripeptides from frog skin (Litoria rubella). Comput. Biol. Med. 2021, 133, 104370. [Google Scholar] [CrossRef] [PubMed]
- Li, Q.; Ding, X.; Si, H.; Gao, H. QSAR model based on SMILES of inhibitory rate of 2, 3-diarylpropenoic acids on AKR1C3. Chemometr. Intell. Lab. Syst. 2014, 139, 132–138. [Google Scholar] [CrossRef]
- Veselinović, J.B.; Nikolić, G.M.; Trutić, N.V.; Živković, J.V.; Veselinović, A.M. Monte Carlo QSAR models for predicting organophosphate inhibition of acetylcholinesterase. SAR QSAR Environ. Res. 2015, 26, 449–460. [Google Scholar] [CrossRef] [PubMed]
- Islam, M.A.; Pillay, T.S. Simplified molecular input line entry system-based descriptors in QSAR modeling for HIV-protease inhibitors. Chemometr. Intell. Lab. Syst. 2016, 153, 67–74. [Google Scholar] [CrossRef]
- Kumar, A.; Chauhan, S. Use of the Monte Carlo Method for OECD Principles-Guided QSAR Modeling of SIRT1 Inhibitors. Arch. Pharm. 2017, 350, e1600268. [Google Scholar] [CrossRef]
- Simon, L.; Imane, A.; Srinivasan, K.K.; Pathak, L.; Daoud, I. In Silico Drug-Designing Studies on Flavanoids as Anticolon Cancer Agents: Pharmacophore Mapping, Molecular Docking, and Monte Carlo Method-Based QSAR Modeling. Interdiscip. Sci. Comput. Life Sci. 2017, 9, 445–458. [Google Scholar] [CrossRef]
- Toropova, A.P.; Toropov, A.A. The index of ideality of correlation: A criterion of predictability of QSAR models for skin permeability? Sci. Total Environ. 2017, 586, 466–472. [Google Scholar] [CrossRef]
- Toropov, A.A.; Toropova, A.P. Correlation intensity index: Building up models for mutagenicity of silver nanoparticles. Sci. Total Environ. 2020, 737, 139720. [Google Scholar] [CrossRef]
- Lanevskij, K.; Didziapetris, R.; Sazonovas, A. Physicochemical QSAR analysis of hERG inhibition revisited: Towards a quantitative potency prediction. J. Comput. Aided Mol. Des. 2022, 36, 837–849. [Google Scholar] [CrossRef]
- OECD, (Organization for Economic Co-operation and Development). Guidance Document on The Validation of (Quantitative) Structure-Activity Relationship [(Q)SAR] Models; OECD: Paris, France, 2007; No. 69. [Google Scholar]
- Toropova, A.P.; Toropov, A.A. Hybrid optimal descriptors as a tool to predict skin sensitization in accordance to OECD principles. Toxicol. Lett. 2017, 275, 57–66. [Google Scholar] [CrossRef]
- Chemi, G.; Gemma, S.; Campiani, G.; Brogi, S.; Butini, S.; Brindisi, M. Computational tool for fast in silico evaluation of hERG K+ channel affinity. Front. Chem. 2017, 5, 7. [Google Scholar] [CrossRef] [PubMed]
- Melnikov, F.; Anger, L.T.; Hasselgren, C. Toward Quantitative Models in Safety Assessment: A Case Study to Show Impact of Dose–Response Inference on hERG Inhibition Models. Int. J. Mol. Sci. 2023, 24, 635. [Google Scholar] [CrossRef] [PubMed]
- Box, G.E.P. Science and statistics. J. Am. Stat. Assoc. 1976, 71, 791–799. [Google Scholar] [CrossRef]
- Palacios-Can, F.J.; Silva-Sánchez, J.; León-Rivera, I.; Tlahuext, H.; Pastor, N.; Razo-Hernández, R.S. Identification of a Family of Glycoside Derivatives Biologically Active against Acinetobacter baumannii and Other MDR Bacteria Using a QSPR Model. Pharmaceuticals 2023, 16, 250. [Google Scholar] [CrossRef] [PubMed]
- Weininger, D. SMILES, a Chemical Language and Information System: 1: Introduction to Methodology and Encoding Rules. J. Chem. Inf. Comput. Sci. 1988, 28, 31–36. [Google Scholar] [CrossRef]


| n | R2 | CCC | IIC | CII | Q2 | Q2F1 | Q2F2 | Q2F3 | RMSE | MAE | F | |
|---|---|---|---|---|---|---|---|---|---|---|---|---|
| A * | 28 | 0.5552 | 0.7140 | 0.5588 | 0.7844 | 0.4940 | 0.424 | 0.371 | 32 | |||
| P | 28 | 0.6911 | 0.7400 | 0.6525 | 0.8394 | 0.6454 | 0.438 | 0.373 | 58 | |||
| C | 29 | 0.9101 | 0.9524 | 0.9536 | 0.9436 | 0.8955 | 0.9083 | 0.8998 | 0.9424 | 0.160 | 0.129 | 273 |
| V | 28 | 0.9146 | - | - | - | - | - | - | - | - | 0.20 | 0.15 |
| A | 29 | 0.8548 | 0.9217 | 0.8629 | 0.9300 | 0.8306 | 0.241 | 0.201 | 159 | |||
| P | 28 | 0.8893 | 0.8958 | 0.3877 | 0.9303 | 0.8740 | 0.284 | 0.222 | 209 | |||
| C | 28 | 0.8680 | 0.9261 | 0.8836 | 0.9273 | 0.8451 | 0.8346 | 0.8340 | 0.8658 | 0.242 | 0.194 | 171 |
| V | 28 | 0.8959 | - | - | - | - | - | - | - | - | 0.27 | 0.24 |
| A | 28 | 0.5347 | 0.6968 | 0.7312 | 0.7836 | 0.4239 | 0.436 | 0.379 | 30 | |||
| P | 28 | 0.5607 | 0.7087 | 0.4930 | 0.7714 | 0.4976 | 0.451 | 0.387 | 33 | |||
| C | 28 | 0.8374 | 0.9124 | 0.9150 | 0.8940 | 0.8173 | 0.8201 | 0.8192 | 0.8808 | 0.228 | 0.179 | 134 |
| V | 29 | 0.9181 | - | - | - | - | - | - | - | - | 0.21 | 0.16 |
| n | R2 | CCC | IIC | CII | Q2 | Q2F1 | Q2F2 | Q2F3 | RMSE | MAE | F | |
|---|---|---|---|---|---|---|---|---|---|---|---|---|
| A | 28 | 0.5067 | 0.6726 | 0.7118 | 0.7752 | 0.4439 | 0.446 | 0.386 | 27 | |||
| P | 28 | 0.6341 | 0.6605 | 0.6043 | 0.8438 | 0.5801 | 0.481 | 0.436 | 45 | |||
| C | 29 | 0.9143 | 0.9556 | 0.9562 | 0.9494 | 0.9011 | 0.9206 | 0.9132 | 0.9501 | 0.149 | 0.123 | 288 |
| V | 28 | 0.9347 | - | - | - | - | - | - | - | - | 0.19 | 0.15 |
| A | 29 | 0.5253 | 0.6887 | 0.6764 | 0.7989 | 0.4496 | 0.436 | 0.387 | 30 | |||
| P | 28 | 0.6806 | 0.7591 | 0.8009 | 0.8318 | 0.6362 | 0.395 | 0.354 | 55 | |||
| C | 28 | 0.9494 | 0.9717 | 0.9741 | 0.9742 | 0.9396 | 0.9475 | 0.9473 | 0.9574 | 0.136 | 0.105 | 488 |
| V | 28 | 0.9292 | - | - | - | - | - | - | - | - | 0.19 | 0.16 |
| A | 28 | 0.5870 | 0.7398 | 0.7662 | 0.7886 | 0.5004 | 0.410 | 0.361 | 37 | |||
| P | 28 | 0.6347 | 0.7708 | 0.5116 | 0.7931 | 0.5878 | 0.412 | 0.341 | 45 | |||
| C | 28 | 0.8773 | 0.9322 | 0.9366 | 0.9231 | 0.8587 | 0.8548 | 0.8540 | 0.9038 | 0.205 | 0.174 | 186 |
| V | 29 | 0.9255 | - | - | - | - | - | - | - | - | 0.22 | 0.18 |
| ID | SAk | CWs Run1 | CWs Run2 | CWs Run3 | NA * | NP | NC | dk |
|---|---|---|---|---|---|---|---|---|
| Promoters of increase | ||||||||
| 1 | (........... | 0.1947 | 0.7446 | 0.5440 | 28 | 28 | 29 | 0.0000 |
| 2 | 1........... | 0.7284 | 0.4211 | 0.3577 | 28 | 28 | 29 | 0.0000 |
| 3 | O...(....... | 0.3798 | 0.9650 | 0.5790 | 28 | 28 | 29 | 0.0000 |
| 4 | c........... | 0.1359 | 0.7877 | 0.3057 | 28 | 28 | 29 | 0.0000 |
| 5 | c...1....... | 0.6071 | 0.0798 | 0.1767 | 28 | 27 | 28 | 0.0009 |
| 6 | c...c....... | 0.6871 | 0.6369 | 0.6244 | 28 | 28 | 29 | 0.0000 |
| 7 | C...1....... | 0.2662 | 0.3189 | 0.4394 | 25 | 23 | 28 | 0.0038 |
| 8 | 1...(....... | 1.5716 | 0.9427 | 0.9525 | 24 | 19 | 26 | 0.0063 |
| 9 | N...(....... | 0.5049 | 0.6520 | 0.3610 | 24 | 20 | 23 | 0.0043 |
| 10 | 2........... | 0.3701 | 0.3364 | 0.3724 | 20 | 20 | 16 | 0.0058 |
| 11 | F...(....... | 0.4099 | 0.3220 | 0.1576 | 17 | 24 | 18 | 0.0085 |
| 12 | c...F....... | 0.2340 | 0.7688 | 0.0176 | 13 | 14 | 9 | 0.0105 |
| 13 | n...(....... | 0.4261 | 0.7984 | 0.6231 | 12 | 10 | 12 | 0.0042 |
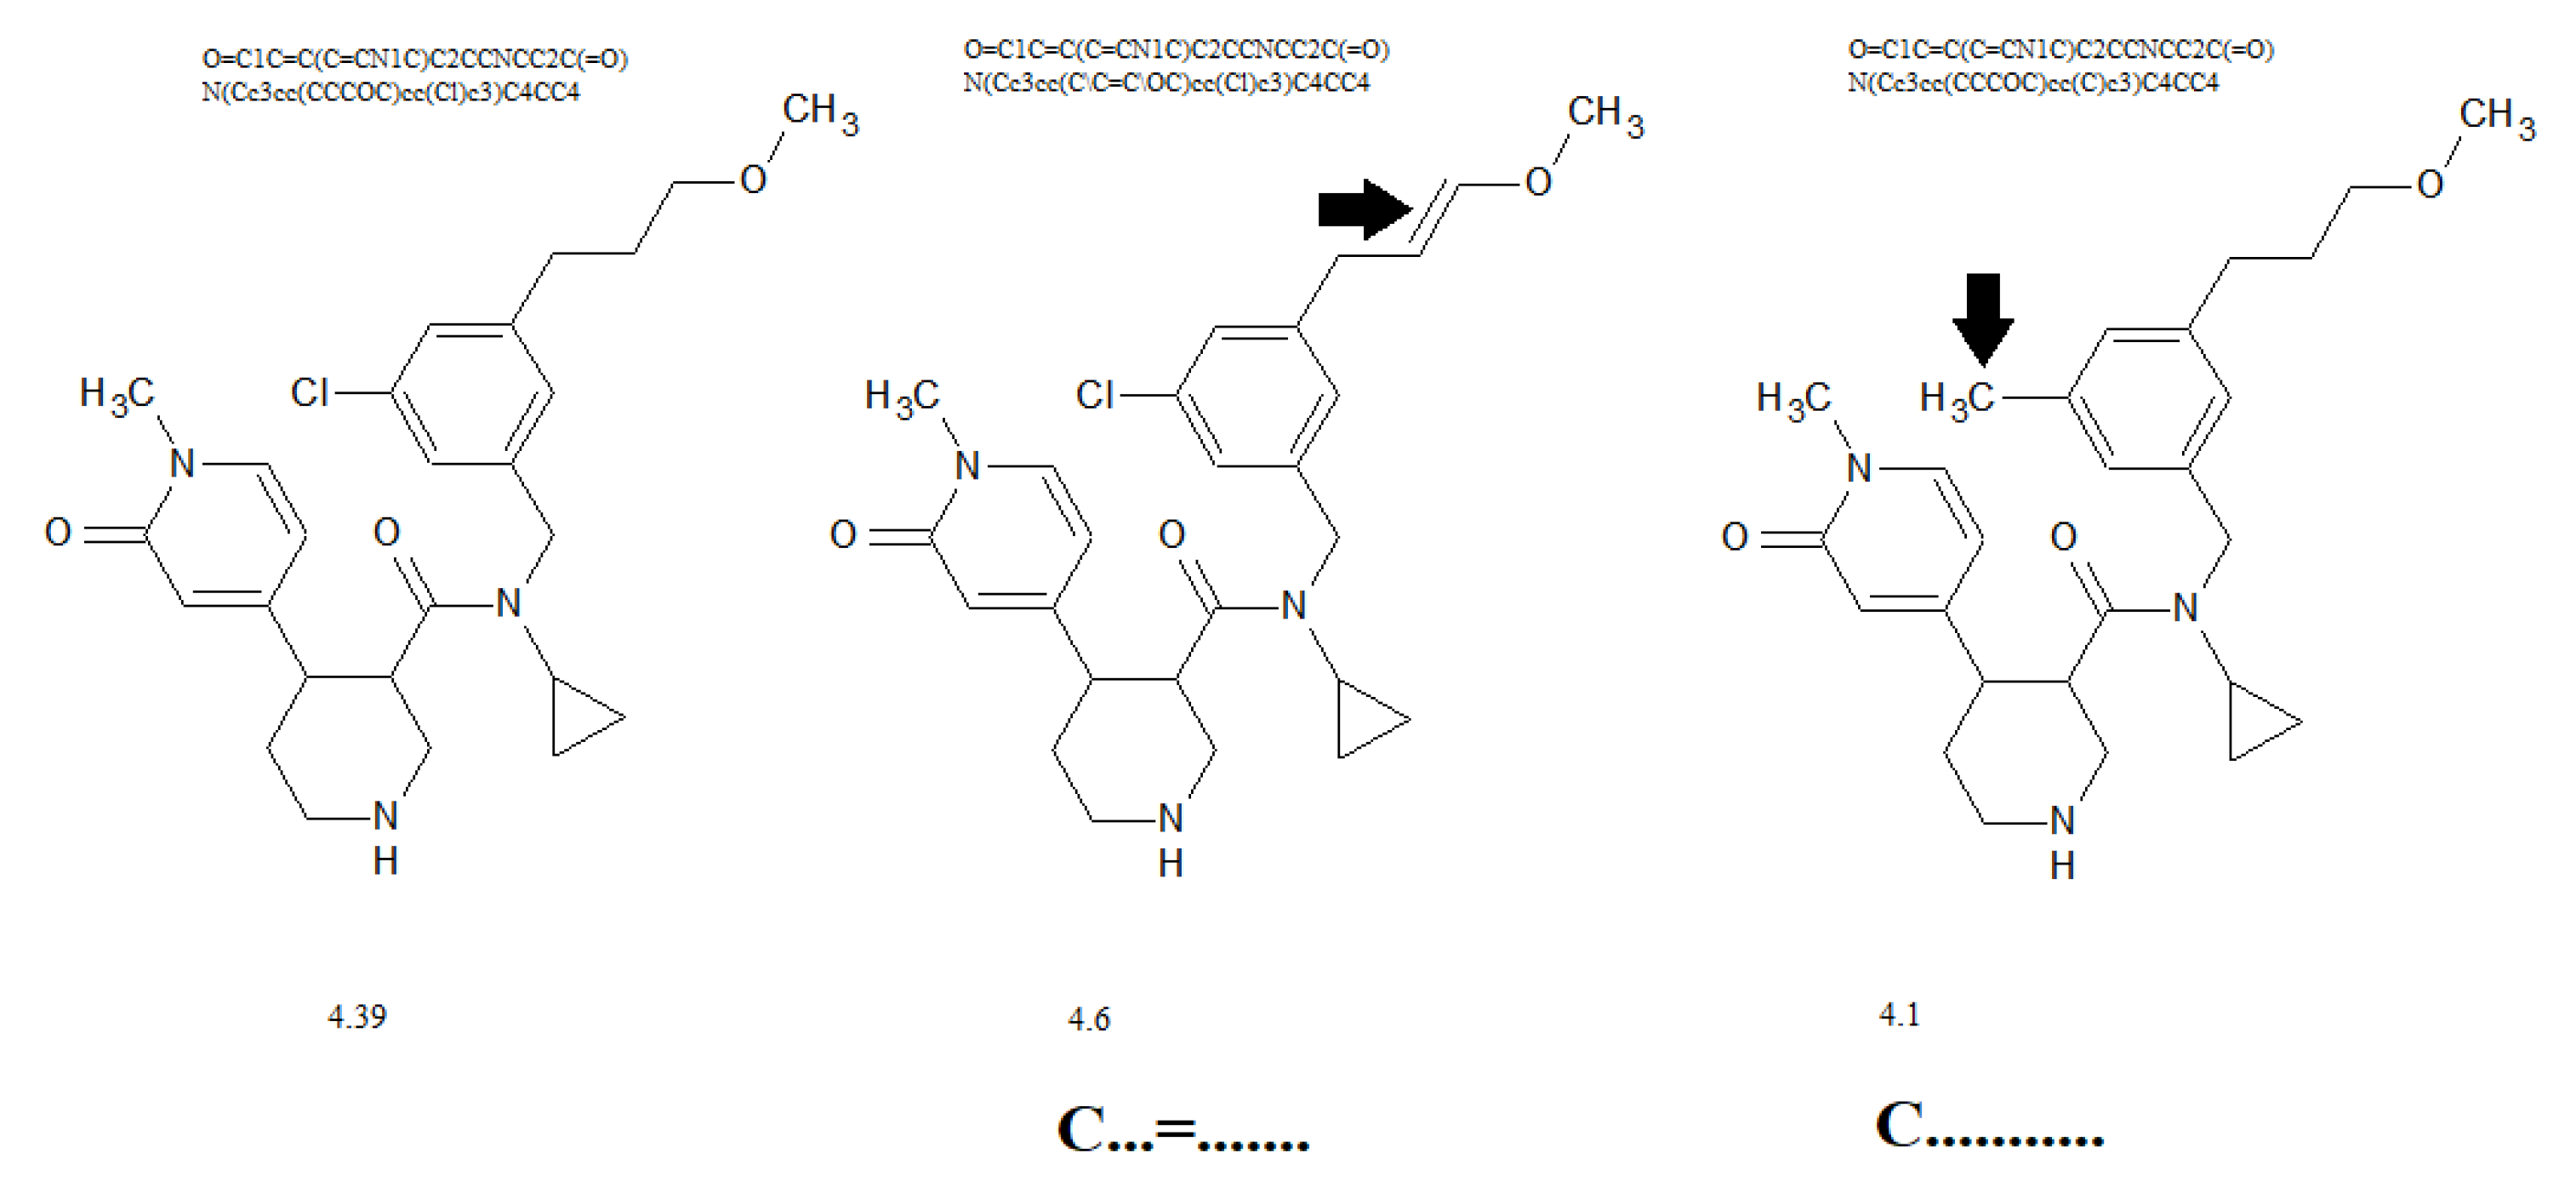
| 14 | C...=....... | 1.2645 | 0.4920 | 0.8643 | 11 | 5 | 6 | 0.0195 |
| 15 | F...1....... | 0.0991 | 0.3553 | 0.9094 | 11 | 11 | 9 | 0.0053 |
| Promoters of decrease | ||||||||
| 1 | C........... | −0.0788 | −0.0409 | −0.0820 | 28 | 28 | 29 | 0.0000 |
| 2 | =...(....... | −0.6876 | −0.8715 | −0.2888 | 26 | 26 | 28 | 0.0009 |
| 3 | O...=....... | −1.0322 | −0.3332 | −0.3444 | 26 | 26 | 28 | 0.0009 |
| 4 | O...C....... | −0.4151 | −0.2547 | −0.0993 | 17 | 12 | 19 | 0.0094 |
| 5 | c...C....... | −1.3073 | −0.8511 | −0.1159 | 17 | 16 | 15 | 0.0037 |
| N Train | R2 Train | Q2 Train | RMSE Train | N Valid | R2 Valid | RMSE Valid | Reference |
|---|---|---|---|---|---|---|---|
| 113 | 0.6576 0.6264 0.6872 | 0.6341 0.5801 0.6516 | - | - | - | - | [9] MOE-models |
| 113 | 0.6600 0.6896 0.7498 | 0.6272 0.6565 0.7118 | - | - | - | - | [9] MACCS-models |
| 623 | 0.29 | - | 0.630 | 345 | 0.41 | 0.550 | [30] |
| 309 | 0.911 | - | 0.264 | 112 | 0.860 | 0.301 | [33] |
| 4081 | 0.46 | - | 0.59 | - | - | - | [34] |
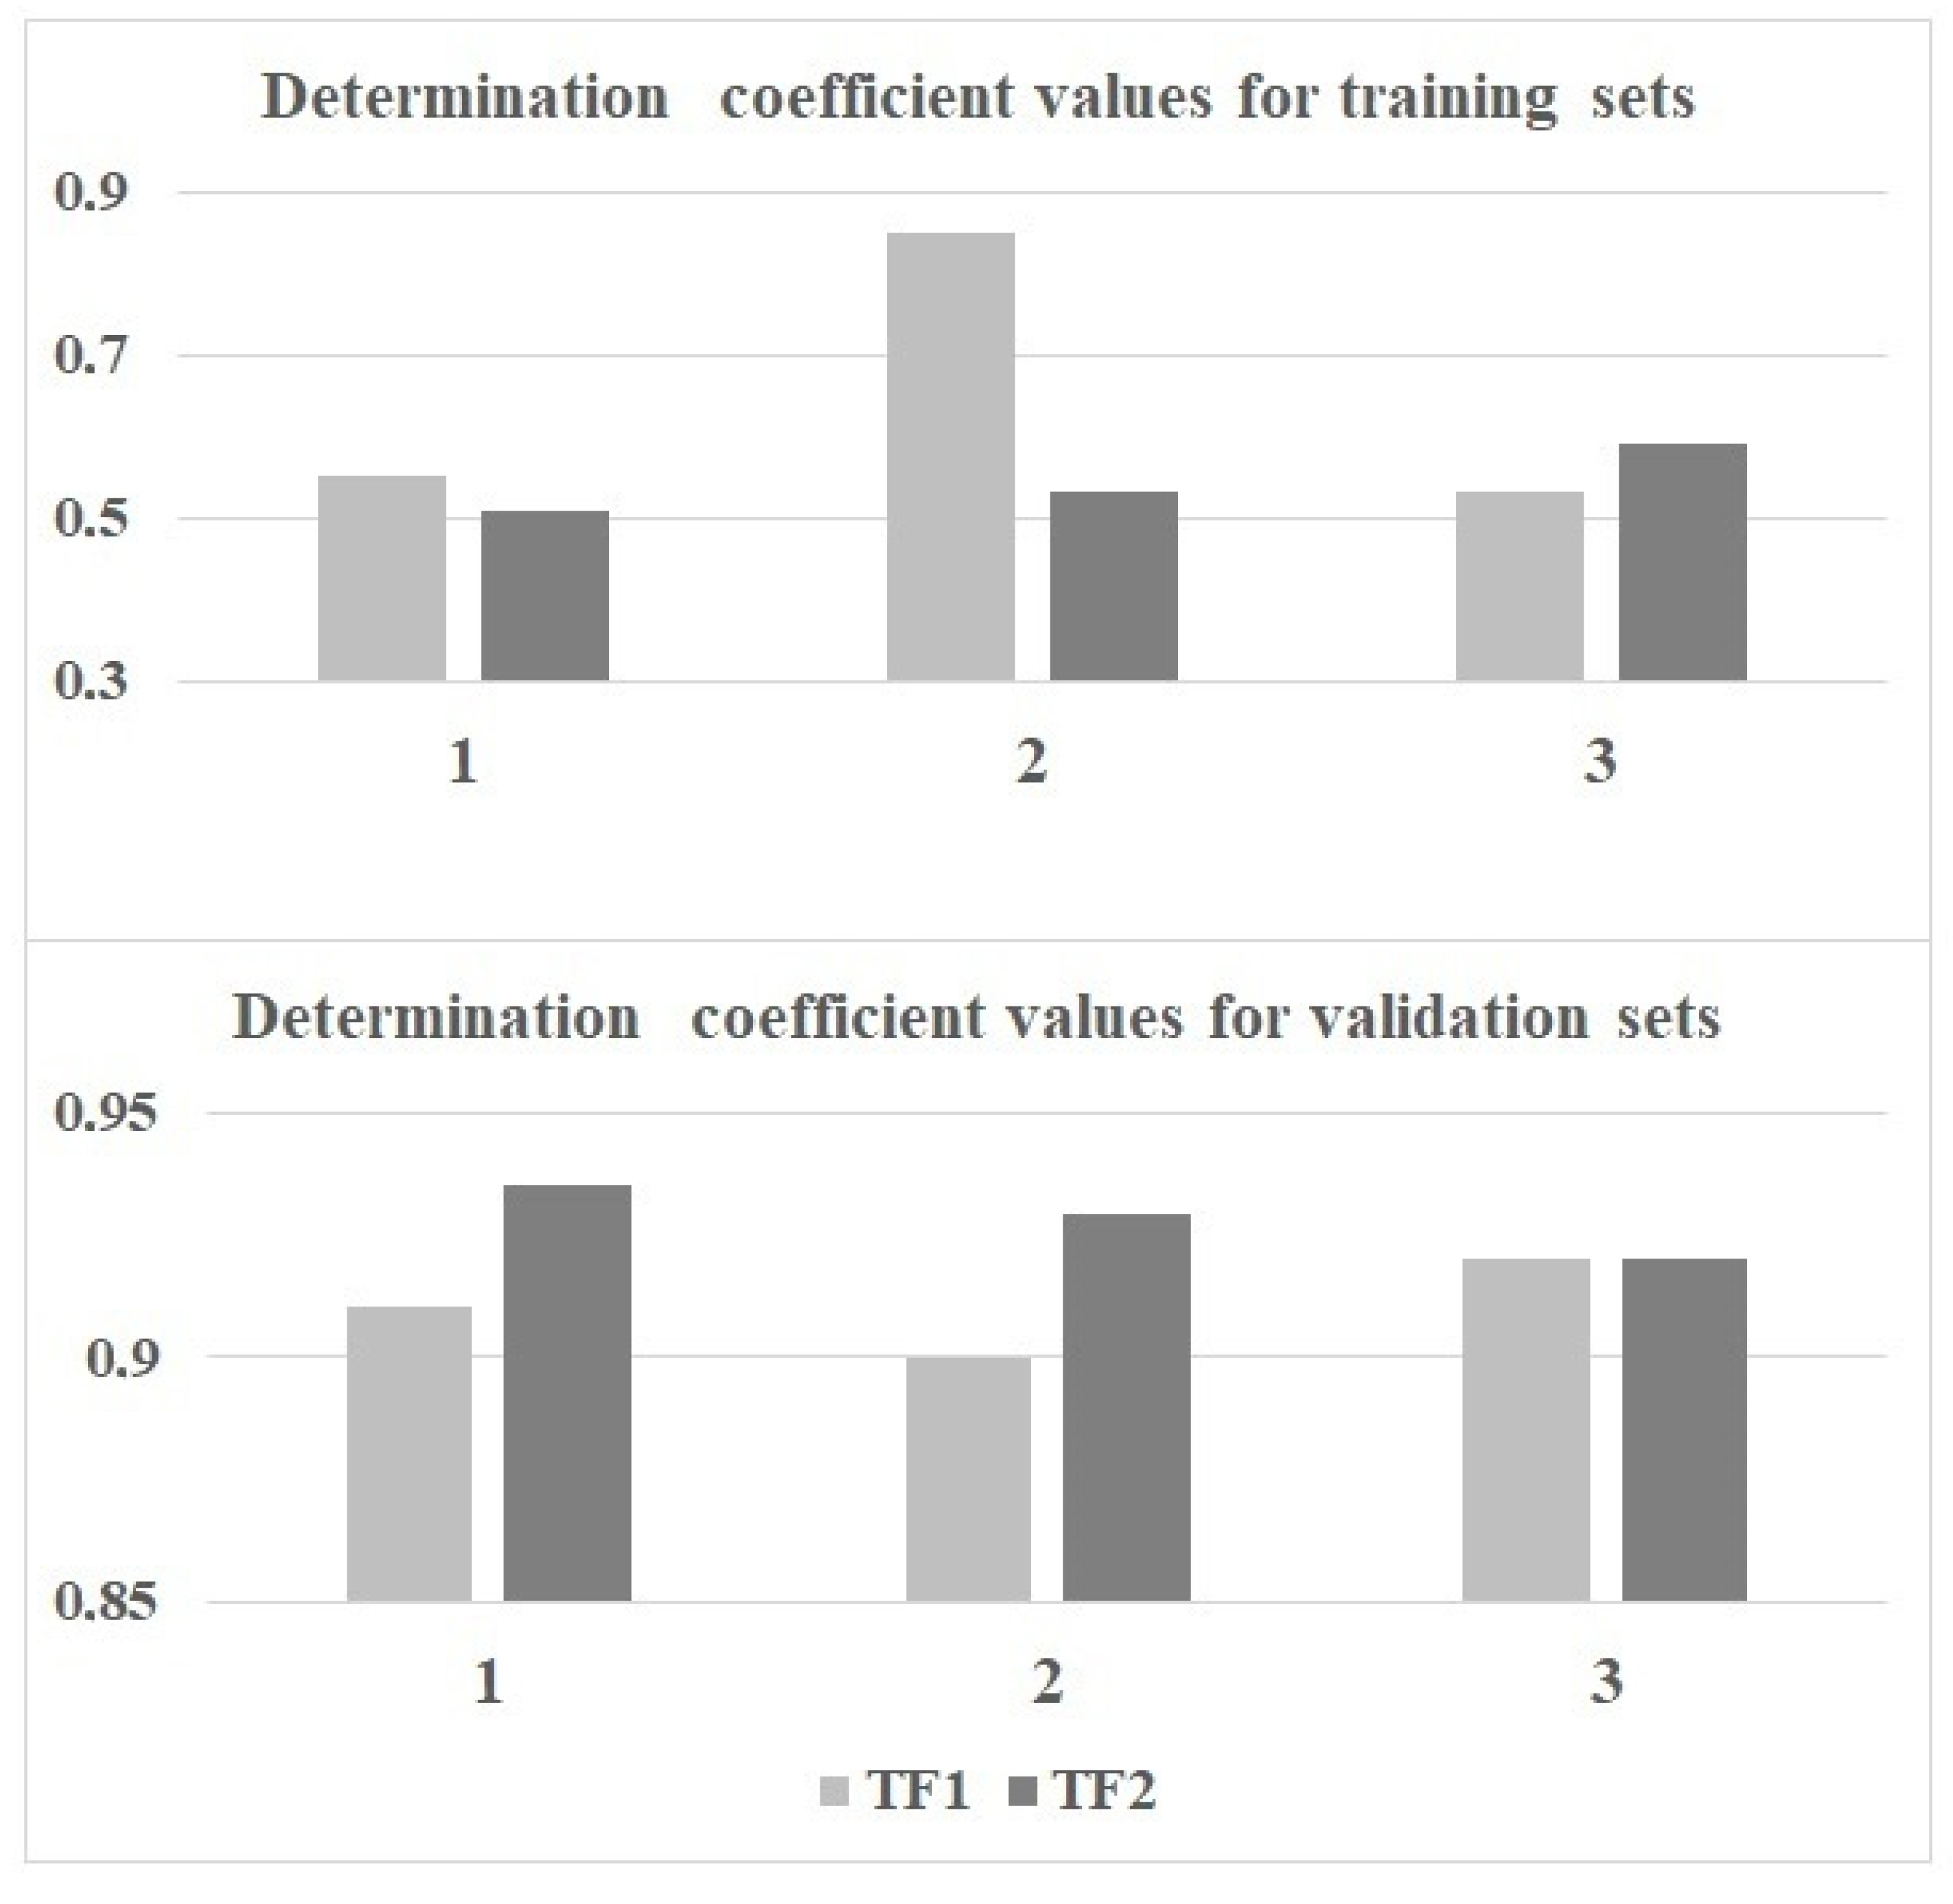
| 85 85 84 | 0.6774 0.8463 0.6169 | 0.6641 0.8379 0.5991 | 0.358 0.253 0.380 | 28 28 29 | 0.9146 0.8959 0.9181 | 0.203 0.275 0.210 | Split-1 Split-2 Split-3 (In this work, TF1) |
| 85 85 84 | 0.6348 0.7056 0.6746 | 0.6201 0.6931 0.6596 | 0.382 0.346 0.352 | 28 28 29 | 0.9347 0.9292 0.9255 | 0.189 0.186 0.221 | Split-1 Split-2 Split-3 (In this work, TF2) |
Disclaimer/Publisher’s Note: The statements, opinions and data contained in all publications are solely those of the individual author(s) and contributor(s) and not of MDPI and/or the editor(s). MDPI and/or the editor(s) disclaim responsibility for any injury to people or property resulting from any ideas, methods, instructions or products referred to in the content. |
© 2023 by the authors. Licensee MDPI, Basel, Switzerland. This article is an open access article distributed under the terms and conditions of the Creative Commons Attribution (CC BY) license (https://creativecommons.org/licenses/by/4.0/).
Share and Cite
Toropova, A.P.; Toropov, A.A.; Roncaglioni, A.; Benfenati, E. Using the Correlation Intensity Index to Build a Model of Cardiotoxicity of Piperidine Derivatives. Molecules 2023, 28, 6587. https://doi.org/10.3390/molecules28186587
Toropova AP, Toropov AA, Roncaglioni A, Benfenati E. Using the Correlation Intensity Index to Build a Model of Cardiotoxicity of Piperidine Derivatives. Molecules. 2023; 28(18):6587. https://doi.org/10.3390/molecules28186587
Chicago/Turabian StyleToropova, Alla P., Andrey A. Toropov, Alessandra Roncaglioni, and Emilio Benfenati. 2023. "Using the Correlation Intensity Index to Build a Model of Cardiotoxicity of Piperidine Derivatives" Molecules 28, no. 18: 6587. https://doi.org/10.3390/molecules28186587
APA StyleToropova, A. P., Toropov, A. A., Roncaglioni, A., & Benfenati, E. (2023). Using the Correlation Intensity Index to Build a Model of Cardiotoxicity of Piperidine Derivatives. Molecules, 28(18), 6587. https://doi.org/10.3390/molecules28186587