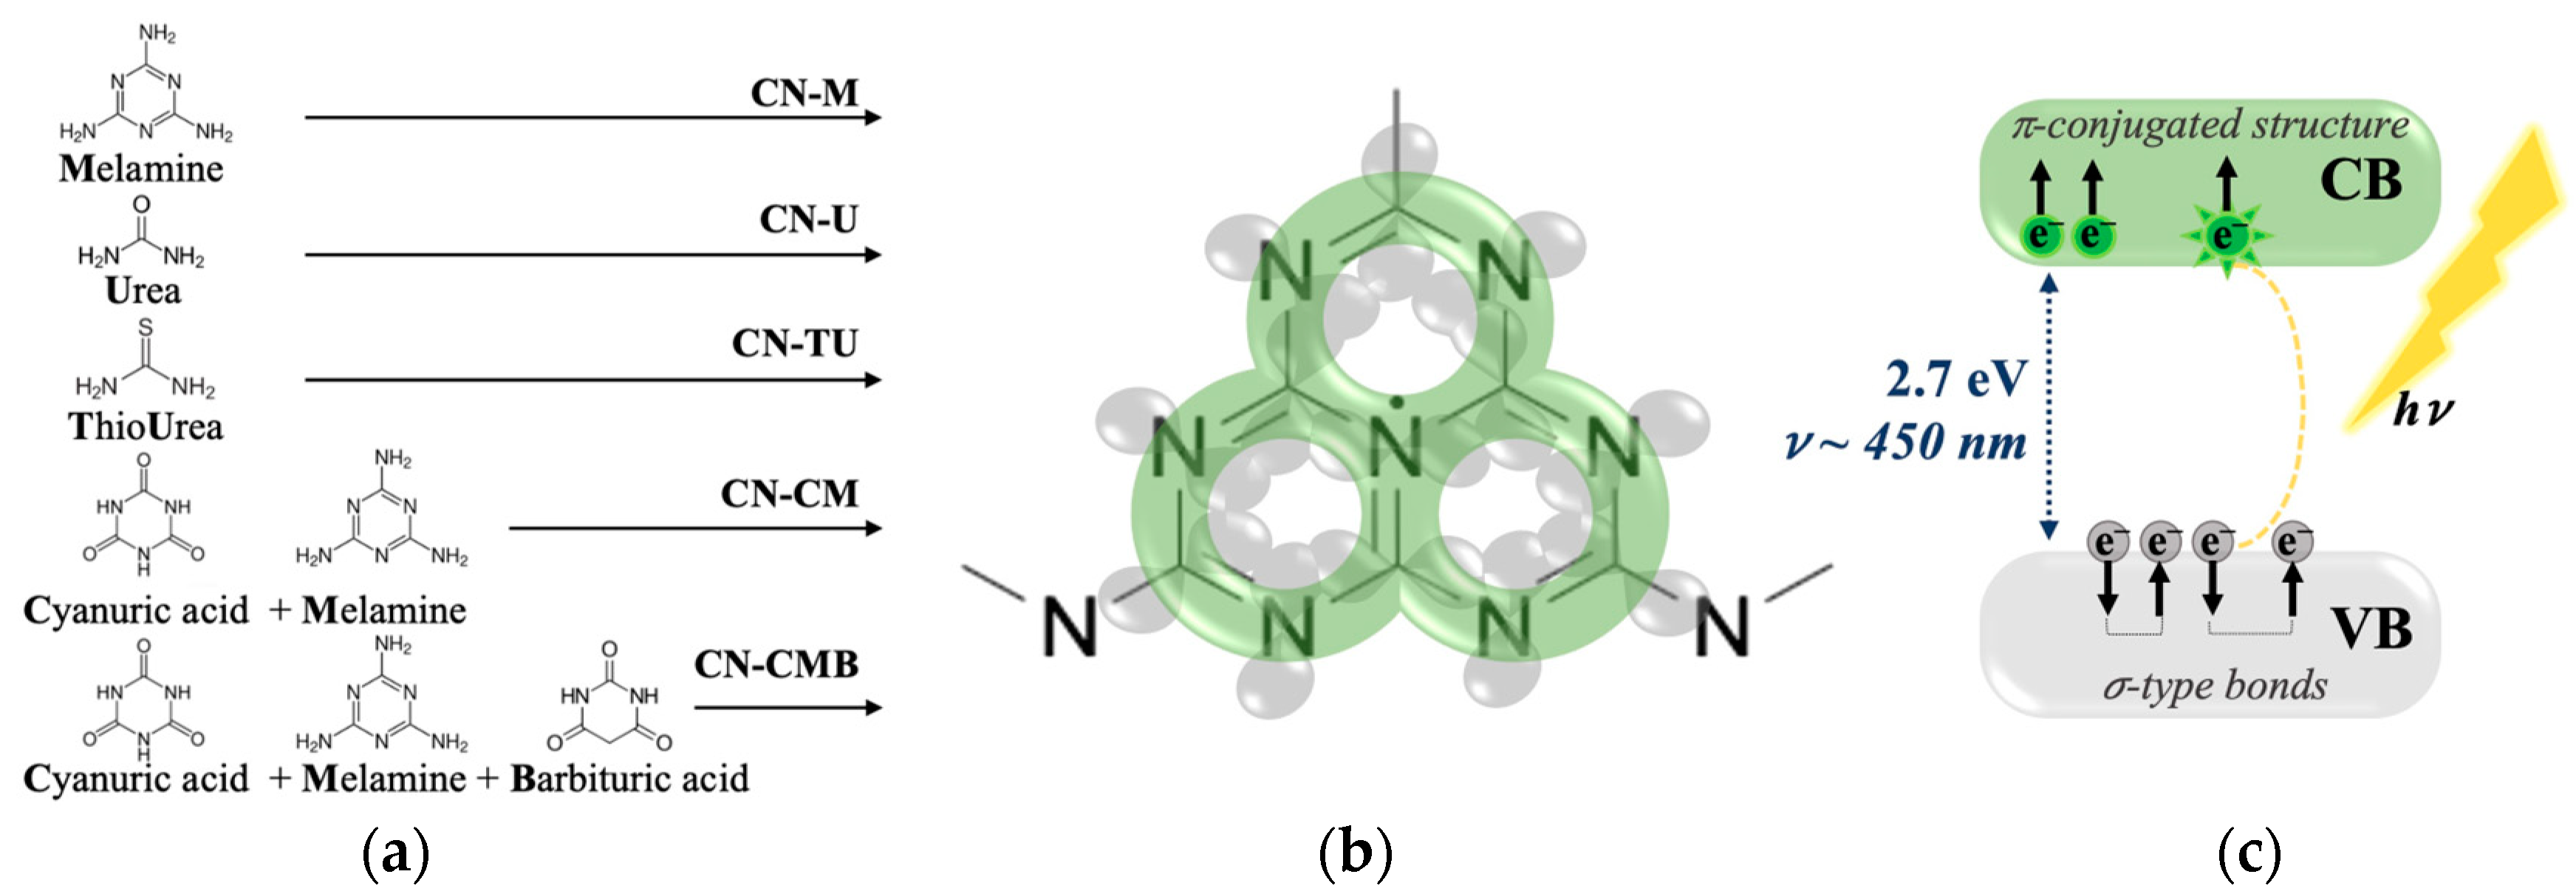
2.1. gCN Electronic Stability over Time
The gCN EPR response has been mainly reported to be a single Lorentzian line and associated with unpaired electrons from π-conjugated structures responsible for photocatalytic activity [
2,
4,
5,
8]. More recent studies have shown evidence that multiple spins may contribute to the overall CW-EPR spectrum; however, variety in synthesis procedures leading to differences in morphology [
5] does not allow for direct comparison of these results [
7,
9]. In this study EPR spectra were recorded initially and sequentially for 18 months following the initial synthesis of several gCN samples. Significant changes in the EPR spectrum were observed with respect to time and a deviation from the previously reported Lorentzian lineshape was observed in all gCN samples investigated.
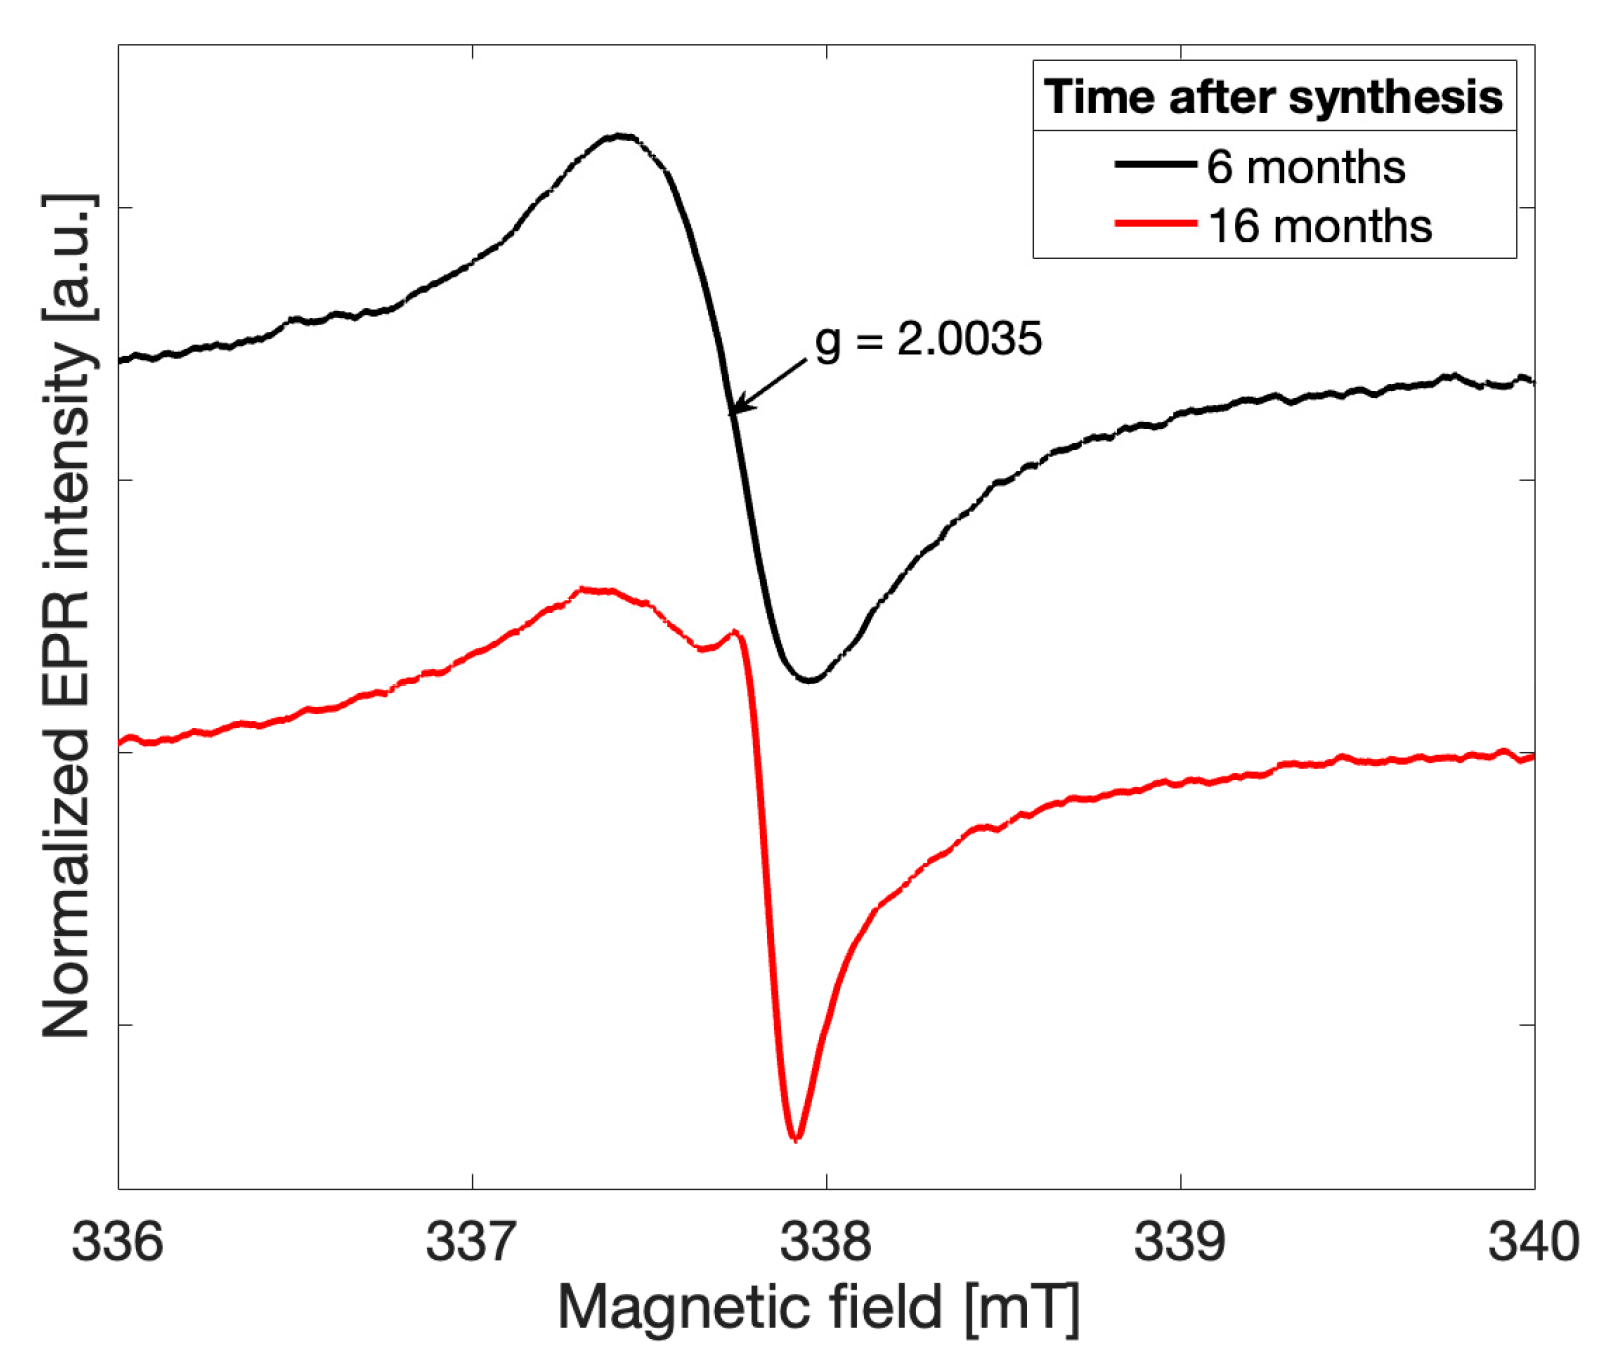
Spectra recorded for all gCN samples investigated exhibited initially a more symmetric lineshape in agreement with previously reported observations [
2,
4]. As early as six months following the successful synthesis, the overall EPR lineshape was observed to deviate from a single Lorentzian for all five samples in the recorded spectra (
Figure 2,
black). The overall lineshape continued to change over time, providing initial evidence that a change in the electronic structure of the gCN framework has occurred. After 16 months following the successful gCN synthesis, an additional peak may be clearly distinguished (
Figure 2,
red). This observation suggests that an additional paramagnetic species arises in gCN over time and likely alters both the electronic structure of the catalytic material and the physical structure of the bonding character within the triazine units.
A fitting routine which considers two independent spin contributions to the overall spectrum was introduced using a linear combination of two derivative Lorentzian lineshapes according to the following formula,
where weighting coefficients
,
, central positions
,
and FWHM (full width at half maximum)
,
values were allowed to vary within a least squares regression (performed in Matlab,
Mathworks) [
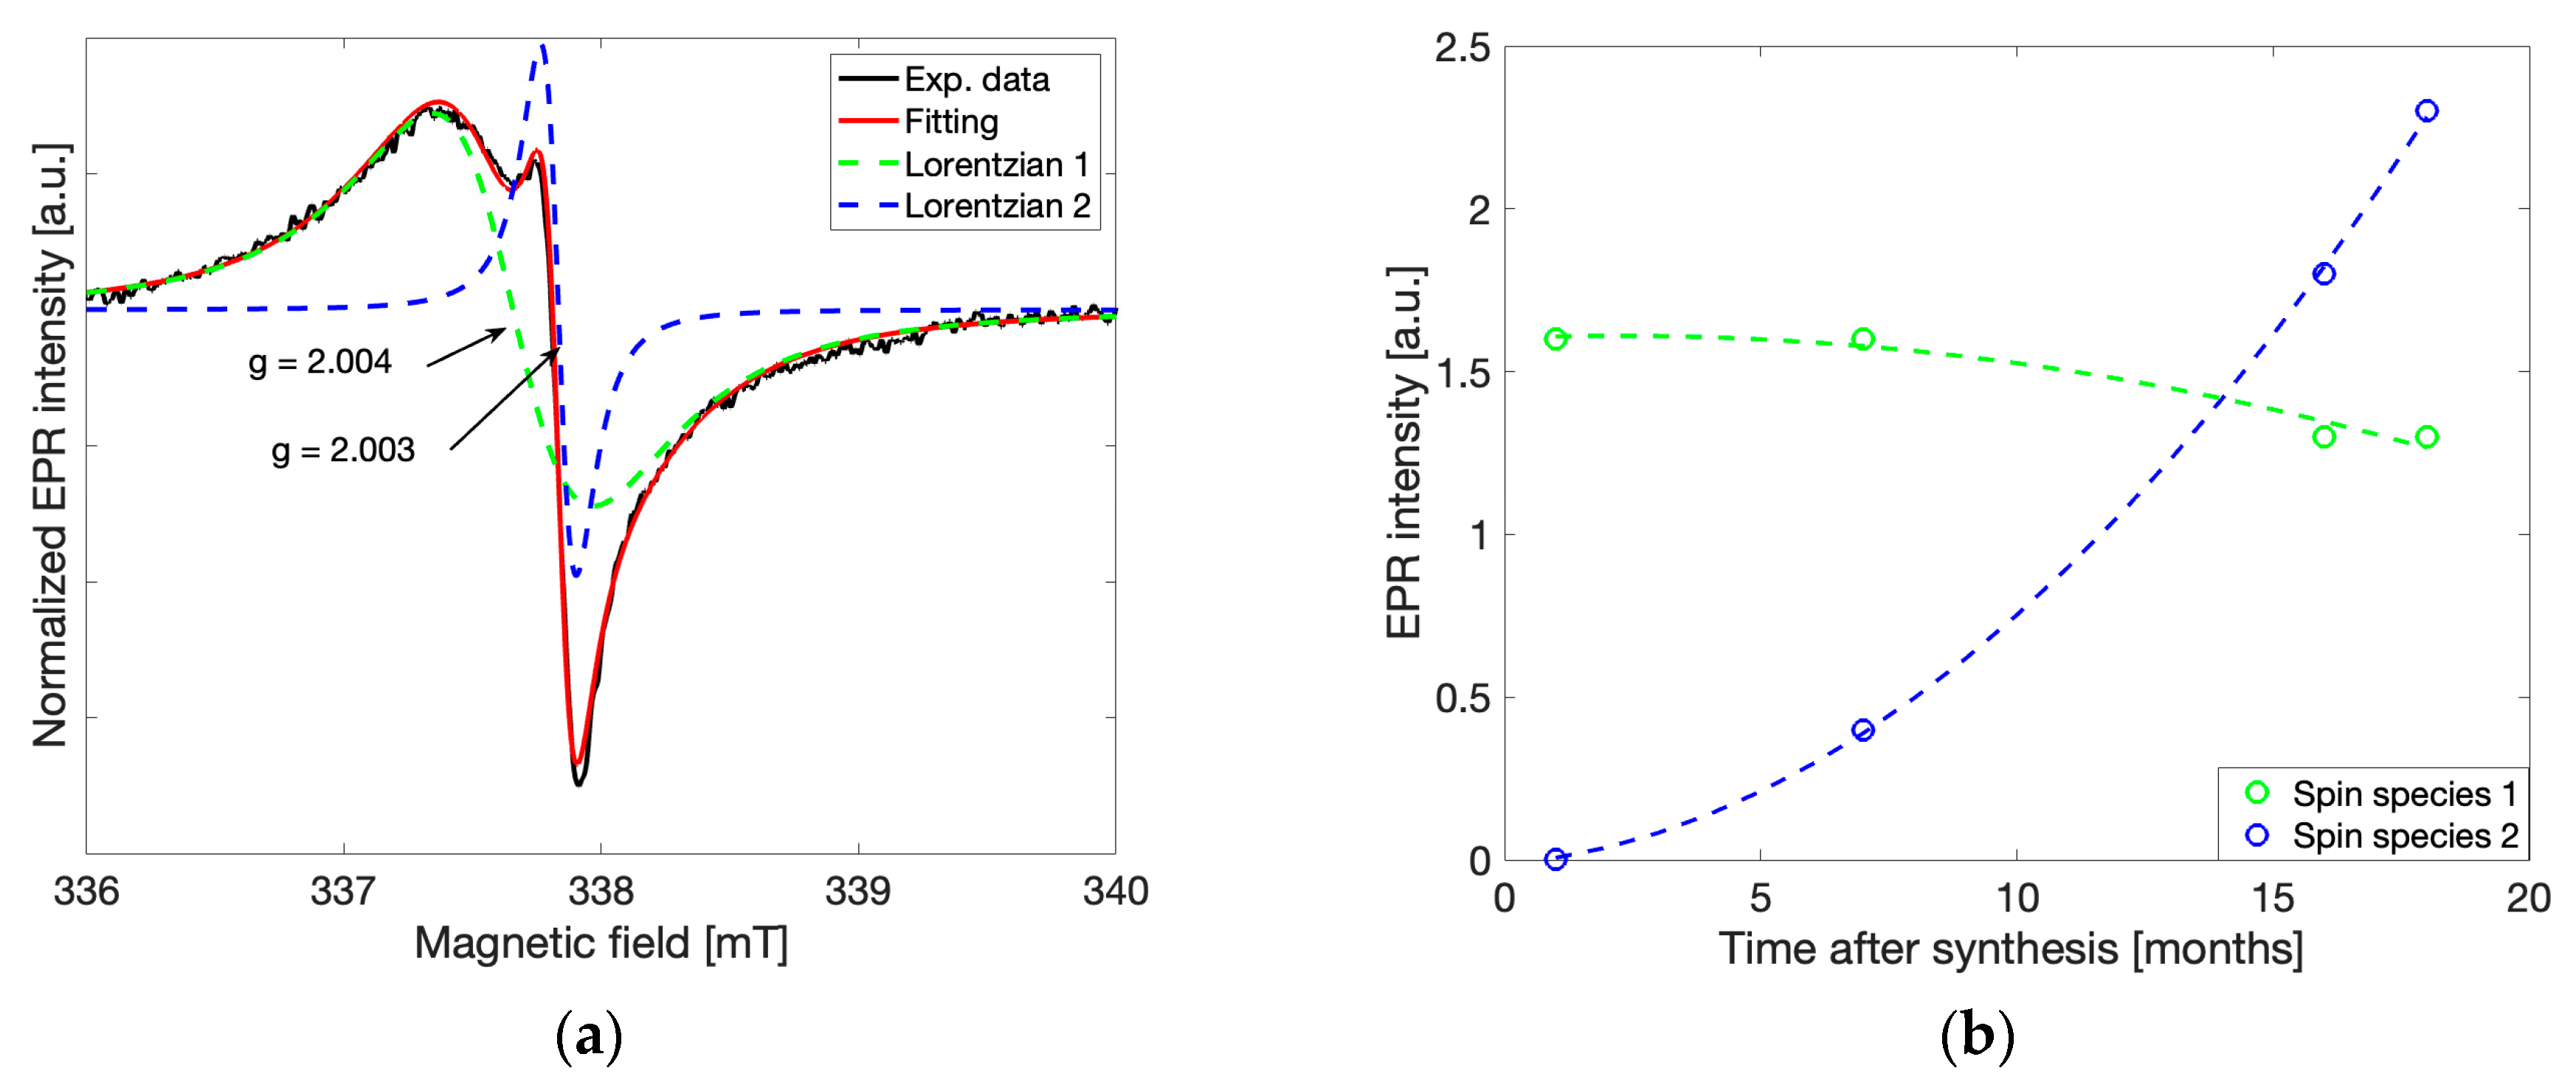
10]. In
Figure 3a, the gCN spectrum shown previously in
Figure 2 (
red) is modelled using the above relationship. The overall fit is the sum of two Lorentzian lineshapes such that each independent Lorentzian lineshape can be built using one set of coefficients
,
,
] or
,
,
] obtained from the fit. The same fitting routine and initial parameters were utilized for all five investigated samples. Spectra recorded at different observation times and different microwave powers were found to be in good agreement throughout all samples. While the observed g-values of the two peaks were constant, the intensities and linewidths varied with microwave power, time, and temperature.
Here, the wider lineshape (
Figure 3a,
green, ΔB
pp = 0.6 mT) labeled as spin species 1, corresponds to unpaired electrons distributed over the π-conjugated structure of the triazine unit of gCN, also known to be responsible for photocatalytic activity, as both linewidth and g-value agree well with previous reports [
2,
4]. The origin of the narrow lineshape (
Figure 3a,
blue, ΔB
pp = 0.1 mT), labeled spin species 2, has not been investigated before.
By separating the two Lorentzian contributions to the overall EPR spectrum via the fitting routine described above, the peak-to-peak intensities of each species were determined for spectra recorded under the same conditions at different time points between 2 and 18 months after synthesis (
Figure 3b). The intensity of the line associated with spin species 2 (
Figure 3b,
blue) increases drastically over time, while the intensity of the line associated with spin species 1, typically attributed to catalytically active spins, (
Figure 3b,
green) decreases slowly over the same time duration. The exponential increase in the intensity at g = 2.003 ± 0.00003 and slow decrease in the intensity at g = 2.004 ± 0.00003 provides insight into the dynamic nature of gCN. It is likely that the second spin species (g = 2.003) forms spontaneously from interactions with the environment, followed by a decreasing concentration of the spin species associated with photocatalytic activity (g = 2.004). Such behavior provides initial implications that a degradation process occurs over time.
In newly synthesized gCN materials, the EPR spectral component corresponding to spin species 2 is negligible, so the gCN spectrum in principle may be described with a single Lorentzian lineshape and has been shown by previous groups where a single symmetric Lorentzian lineshape in the gCN EPR spectrum was observed [
2,
4,
5,
8]. Deviation from a Lorentzian shape as presented in this work is only observable following significantly long times after synthesis. Nevertheless, evidence of the presence of the second spin species long after the synthesis has made it possible to reconstruct the contributions of both spin species in recently synthesized samples allowing for investigation of the potential effects on photocatalytic activity on a relevant timescale and are herein reported.
2.2. Saturation and Relaxation Behavior
To investigate the independent behavior of the two observed Lorentzian contributions to the gCN EPR spectrum, power saturation behavior was recorded and the fitting procedure described previously was applied to each EPR spectrum recorded at varying microwave power levels. Power saturation curves interrogate the dependence of EPR amplitude on the applied B
1 field such that saturation behavior may be used for the determination of electronic longitudinal (T
1 or spin-lattice) and transverse (T
2 or spin-spin) relaxation rates of the system because these processes are closely correlated allowing for their estimation from CW-EPR experiments [
10,
11].
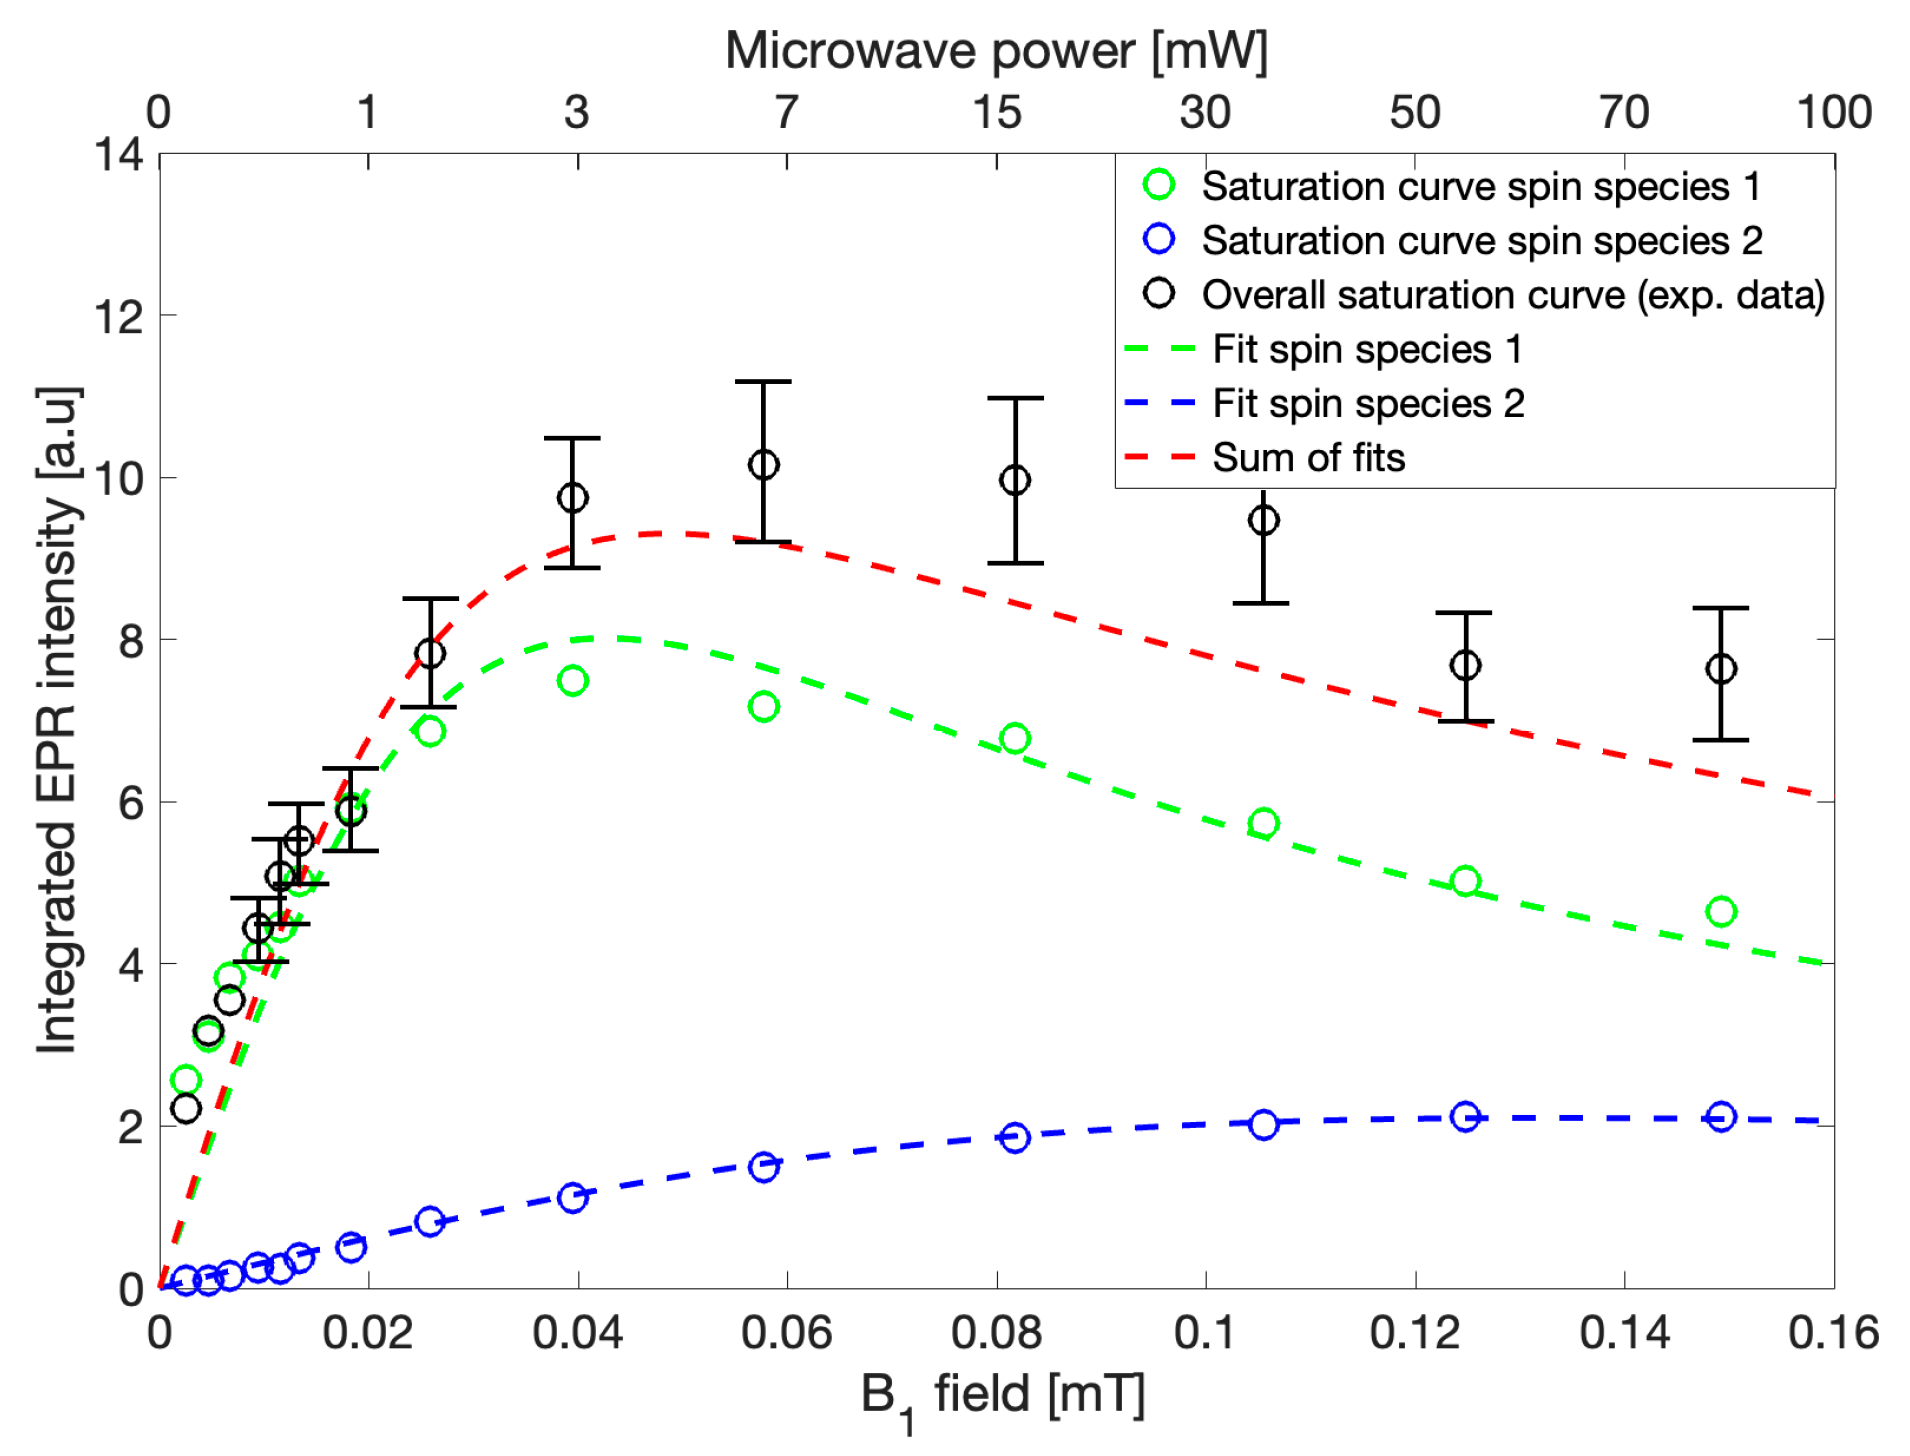
EPR spectra were recorded sequentially using microwave powers from 0.1 mW to 100 mW while keeping all other parameters constant. The maximum integrated intensities of the recorded spectra were plotted against B
1, which is proportional to the square root of microwave power (
Figure 4,
black circles). Because the spectra within this power range may be fit using two Lorentzian lines, the individual intensities of each of the two lines were constructed via the previously described fitting routine and were similarly plotted against B
1 (
Figure 4, g = 2.004,
green circles, and g = 2.003,
blue circles), to yield simulated power saturation curves. Fits to the power saturation data were performed using the analytical formula for homogeneous saturation as follows,
where I represents the integrated intensity of the EPR signal, B
1 is the magnetic field of the microwaves,
, γ is the gyromagnetic ratio, T
1 is the spin-lattice relaxation time, and T
2 is the spin-spin relaxation time [
11]. This model provides an estimation of T
1 relaxation times under the assumption that T
2 may be determined by the linewidth of a purely Lorentzian signal and no additional unresolved contributions to relaxation are present [
11]. Both simulated saturation curves constructed based on individual signal intensities were found to be adequately described independently using a homogeneous saturation model (
Figure 4,
green and blue dashed lines) allowing for the conclusion that the gCN EPR spectrum consists of two spin centers at approximately g = 2.004 and g = 2.003. Since the involved spin species are not identical, the overall saturation of the system cannot be described by a homogeneous saturation model. Due to the complexity of non-homogeneous saturation and the many possible processes involved, an analytical description for the general case is not valid; however, the saturation behavior of gCN resulting from the recorded EPR spectra may be described as the sum of two separate power saturation curves within reasonable error (
Figure 4,
red dashed line). The significantly higher experimental values when compared to those obtained from the sum of the independently derived saturation curves could be explained by consideration of the integrated noise contributions to the overall intensity, which is not considered in the fitting routine [
12]. Such discrepancies between the observed and calculated intensities may also arise from the assumption of absolute independence with respect to the simulations of the two spin systems, which is unlikely given their close proximity to one another. Therefore, additional weakly coupled interactions resulting in cross-correlations between the spin centers might occur and affect the saturation and relaxation behavior of each individual spin system [
13,
14]. Nevertheless, relaxation behavior may be qualitatively determined from these experiments such that spin species 1 (g = 2.004) which is represented by a wider EPR linewidth and saturation at lower microwave powers would typically correspond to faster T
2 and slower T
1, respectively, in comparison to spin species 2 (g = 2.003), which is instead described by a narrower EPR linewidth and later saturation, which would conversely have slower T
2 and faster T
1, respectively. This routine provides only an estimation and is not a direct observation; therefore, these results were further evaluated using complimentary pulse EPR and continuous wave saturation recovery EPR experiments.
Following qualitative analysis of relaxation via CW experiments, relaxation time constants of gCN materials were measured directly by CW saturation recovery EPR techniques at X-band and by pulse EPR techniques at Q-band. CW saturation recovery measurements were preferentially performed at X-band due to the presumably very short T
2 time constants which therefore render pulse techniques at this frequency ineffective due to low echo intensities after consideration of the dead time of the instrument. The T
1 times estimated from the constructed saturation curves agree qualitatively with those obtained via continuous wave saturation recovery experiments. The relaxation times observed in gCN materials are not reported in the literature; however, these values may be compared with those observed in similar materials, for example, N-doped graphene oxide is reported to have similarly long T
1 relaxation [
15,
16,
17]. Because only T
1 relaxation times increase with microwave frequency and T
2 is primarily frequency-independent [
18,
19], the two-pulse Hahn-echo sequence for measuring T
2 relaxation at Q-band was used for T
2 relaxation measurements. The resulting echo lasted sufficiently beyond the dead time of the instrument to enable not only T
2 measurements but also the three-pulse inversion recovery sequence for measuring T
1 relaxation at Q-band. In all experiments for all gCN compounds, similar and consistent results were obtained. For all relaxation data, fits using a biexponential function resulted in lower standard deviation in a residual analysis (
Figures S1–S3 from Supplementary Materials). Mono-exponential functions were considered, but the residual analysis demonstrated nonlinear deviation above the noise levels in both cases. The spin–lattice (T
1) relaxation times and spin–spin (T
2) relaxation times varied by factors of only about two to three between all samples investigated and may be explained by differences in the morphologies of the samples due to diverse synthesis pathways [
5], different spin concentrations influencing dipole coupling, and varying magnitudes of contributions from the first and second species and the resulting effects of cross correlated relaxation [
13,
14]. Further descriptions of the relaxation data and the various fitting approaches may be found in the
supporting information. The multi-component relaxation behavior observed via CW saturation recovery at X-band and via pulse experiments at Q-band provide further support that two spin species are present in the gCN systems investigated.
A summary of relaxation times observed is given in
Table 1. Longer T
1 values, which correspond to a lower degree of spin-lattice interactions, together with shorter T
2 values, which correspond to a greater contribution from spin-spin interactions, may indicate high delocalization and give some idea of the mobile character of spin species 1 (g = 2.004). These spins are primarily localized to the π-conjugated structure of the triazine rings and are responsible for photocatalytic activity [
4]. On the contrary, shorter T
1 values and longer T
2 values observed for spin species 2 (g = 2.003) indicate a much greater interaction with the lattice or surrounding environment and a lower contribution from spin–spin interactions which may instead be correlated with an immobilized spin system and suggests that this species may not directly participate in the photocatalytic activity of the material.
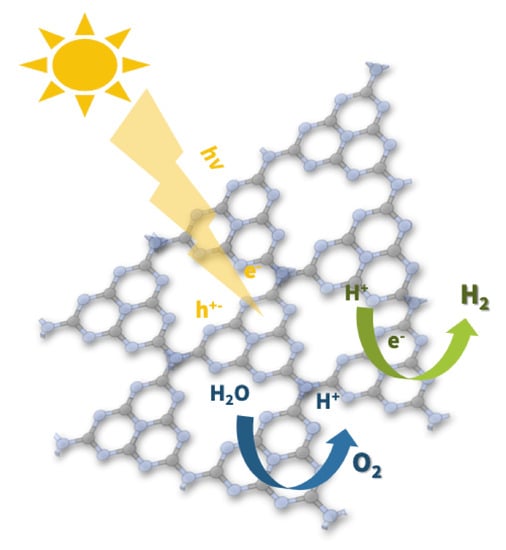
2.3. Light Response
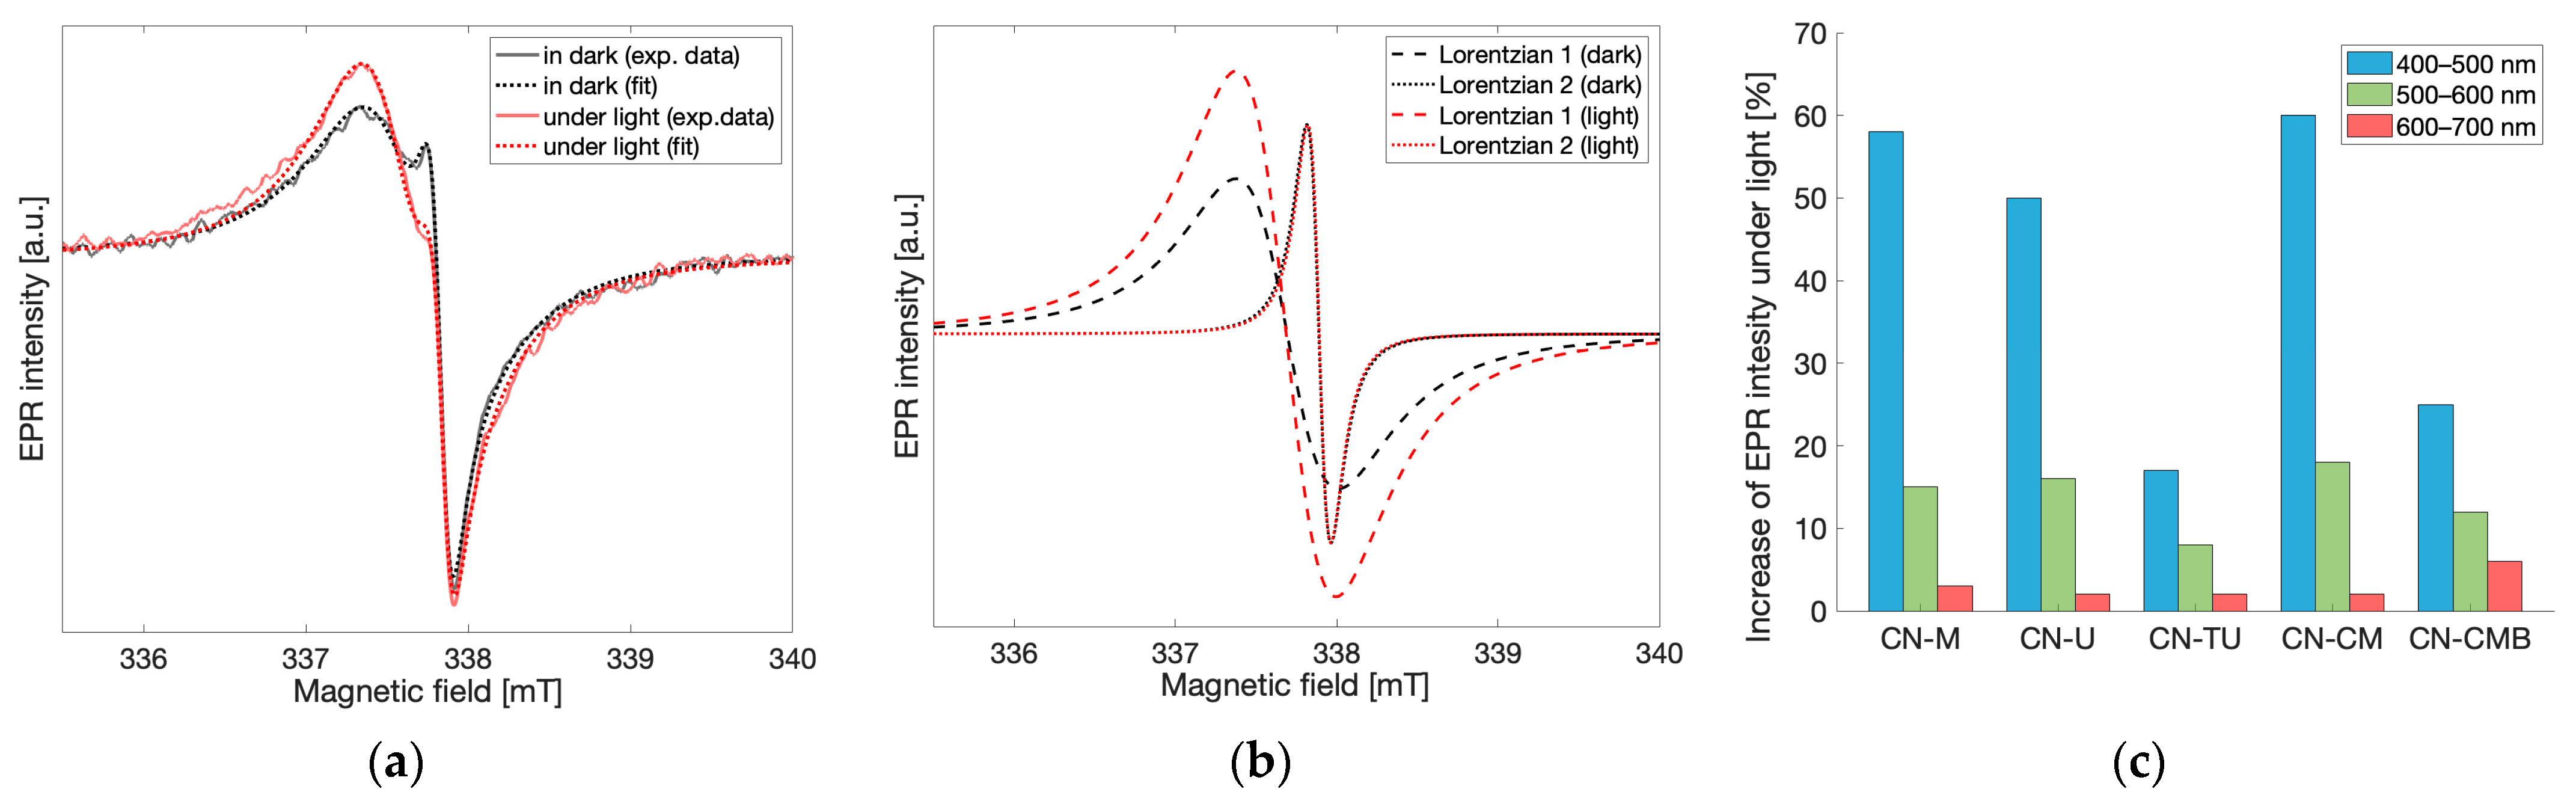
To understand the EPR signal response to light and therefore define the probabilities of each spin species exerting any effects on gCN photocatalytic performance, light-dependent EPR measurements were performed at X-band. For all gCN materials investigated, an increase in the resulting EPR signal was observed in response to irradiation by visible light. The EPR spectra recorded under dark conditions and under continuous light irradiation for the melamine-based gCN material are shown in
Figure 5a. After applying the fitting routine described previously to differentiate the contributions from each of the spin species observed (
Figure 5b), the EPR spectrum under light irradiation shows that the low field, wider component corresponding to spin species 1 (g = 2.004) increases by 60% when under irradiation, while the high field, narrower component corresponding to spin species 2 (g = 2.003) remains unchanged. Similar light-response behavior was observed for all investigated gCN materials and wavelengths of light in the range 400–700 nm. This demonstrates that only spin species 1 is light-active while species 2 which appears months after synthesis is light-inactive. Prolonged irradiation using white light resulted in further increase in the EPR peak-to-peak intensity of spin species 1 while the EPR intensity of spin species 2 remained unchanged. Similarly, the reverse effect was observed when removing the sample from light. After keeping the gCN materials in the dark for prolonged times, decreases in the EPR intensity of spin species 1 were observed while the EPR intensity of spin species 2 remained unchanged. These findings bring forth the implication that spin species 1 is likely associated with the spins responsible for photocatalytic activity [
2,
3,
4]. The light-inactive character of spin species 2 instead implies that these spins likely do not contribute positively to photocatalysis. Rather, in conjunction with the time-dependent increase in the EPR intensity of spin species 2 following synthesis of the material, it is likely that this species may be indicative of the formation of degradation products within the gCN material. In much later stages of this study, a third spin species was detected in some but not all of the gCN samples investigated; however, this contribution to the overall signal was significantly lower than the two signals reported and was not well reproduced such that it was not considered for the further analysis (
Figure S4 from Supplementary Materials). This signal likely corresponds to further degradation processes and may be attributed to an additional localized spin species as it does not respond to light; however, a thorough analysis of this contribution was beyond the scope of this work.
To better investigate the light-dependence of the EPR signals in the spectra obtained for gCN, EPR measurements were performed for all gCN samples while exposed to continuous light irradiation using the following 100 nm bands: 400–500 nm, 500–600 nm, 600–700 nm and in the dark state as a reference. Each recorded spectrum was fit using two Lorentzian lines, as described previously, and the relative change of the EPR peak-to-peak intensities between the dark state and under illumination at each of the irradiation bands for both Lorentzian lines was calculated independently. The relative changes in the EPR intensity at different bandwidths of excitation were normalized to the same photon flux while the linear dependence of the light-induced increase in EPR intensity with respect to photon flux was verified separately using a halogen cold light source (Schott KL 2500 LCD and Thurlby Thandar TSX1820P). As stated previously, the intensity of spin species 2 remained unchanged in all irradiation conditions. Therefore, only the relative change in the EPR intensity of spin species 1 is shown in
Figure 5c. For all gCN materials investigated, the maximum increase in EPR intensity was observed when the spectrum was recorded using light irradiation bandwidths of 400–500 nm, while the increase in EPR intensity was significantly lower for the 500–600 nm bandwidth and even smaller for the 600–700 nm bandwidth. Noticeably, this behavior correlates very well with UV-Vis spectra previously recorded for gCN materials [
20,
21]. Though the EPR spectrum of gCN materials is typically interpreted as a single component, separating gCN EPR spectra into multiple components and considering only the light-active species in the assessment of light-dependent properties leads to better predictions of photocatalytic activity [
4,
7]. While this experiment allows for the comparison of the light response within the material under irradiation from different wavelengths, comparability between the overall activity of different gCN materials with respect to surface effects must be considered. It has been shown that photocatalytic activity mainly occurs on the surface of the material [
22,
23,
24]. However, due to morphological differences within the materials impacting the diffraction of the incident light, as well as variations in porosity and therefore variations in both density and surface area, the number of spins exposed to irradiation may vary greatly between different gCN materials. Therefore, a comparison between materials according to the light-induced EPR response was not considered due to the difference in the responses between samples (
Figure 5c) which primarily corresponds to the difference in numbers of spins accessible by light irradiation and not directly the total number of photoactive spins within the material.
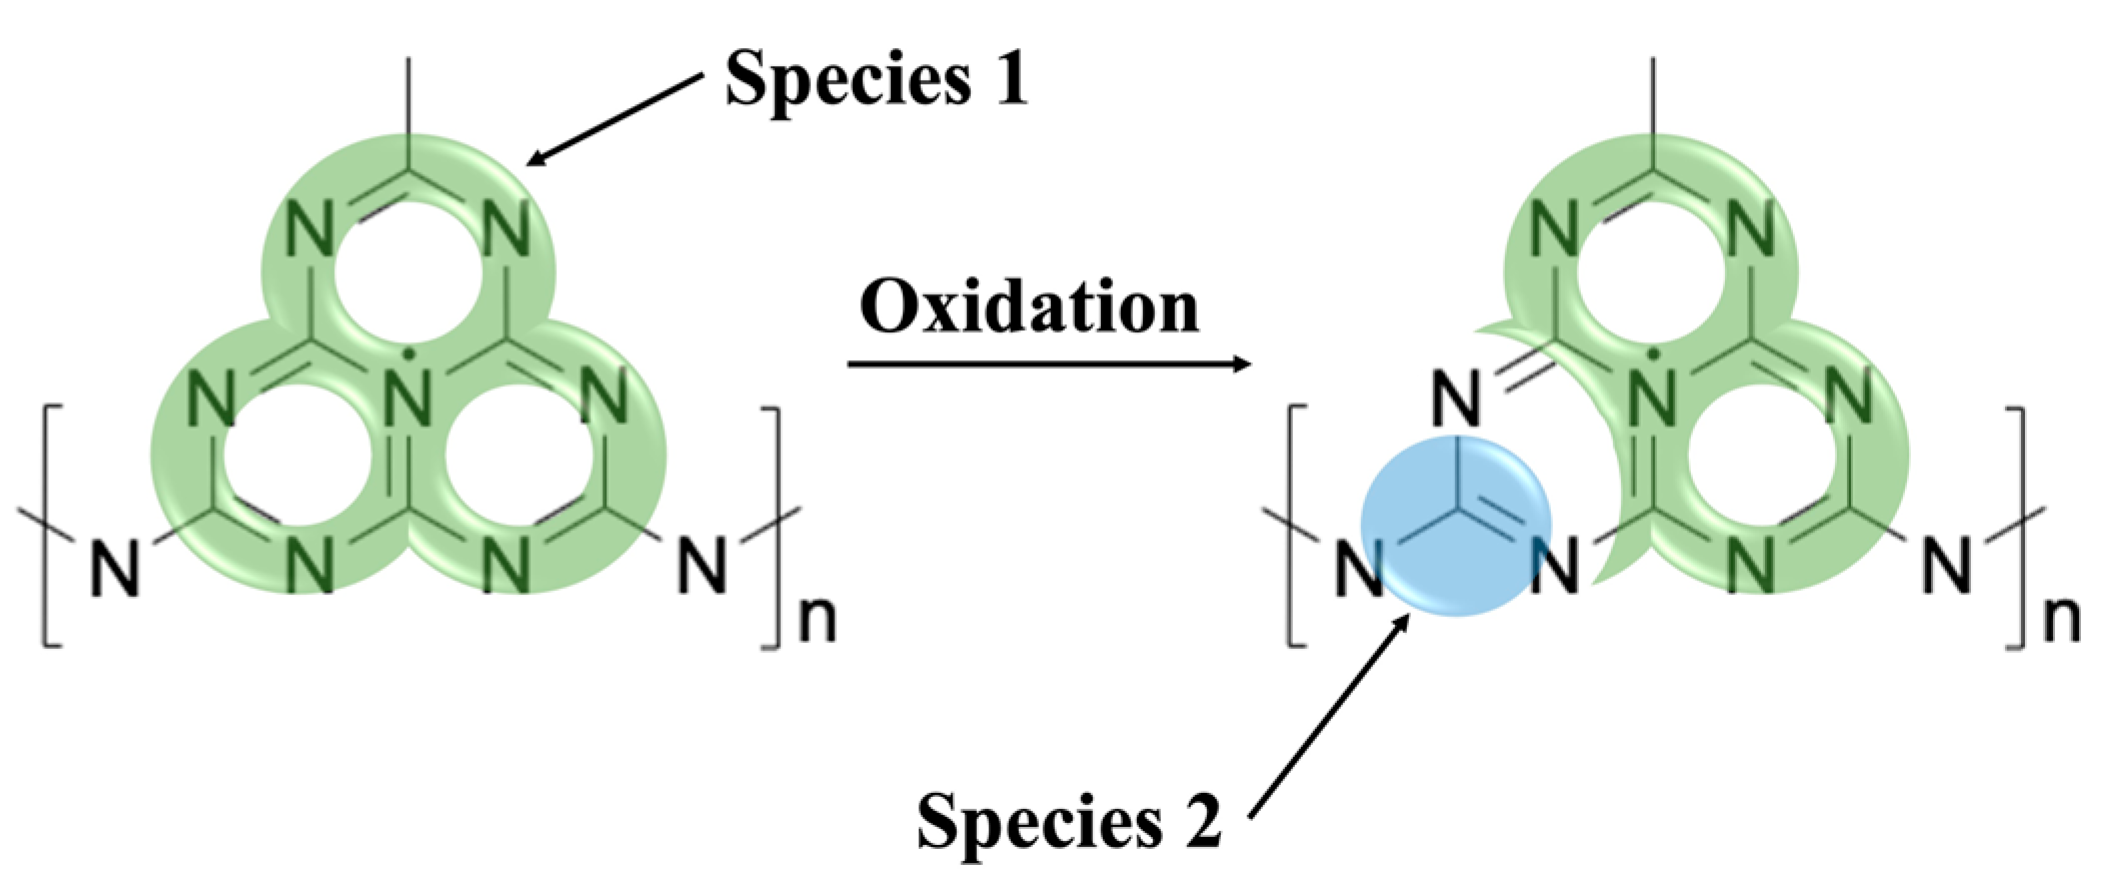
2.4. Oxidation Effects
In order to investigate the origin of spin species 2 (g = 2.003) which was thought to result from interactions with the environment leading to the observed time-dependent changes in the EPR spectra, attempts were made to elicit similar processes artificially while recording the EPR spectrum both before and after the elicited process. The gCN materials were stored in non-sealed vials open to the air, where both reactive oxygen and water are present [
25]. Since gCN is a photocatalyst, it is possible that H
2 may be formed via water splitting reactions using water from the air even without special conditions. To determine if this is the case, the relative humidity was increased in the sample tube and any resulting effects on the observed EPR lineshape were recorded. This was performed in two ways: by blowing water vapor into the sample tube and by adding water dropwise directly to the sample tube. In neither of these experiments were any changes to the lineshape observed.
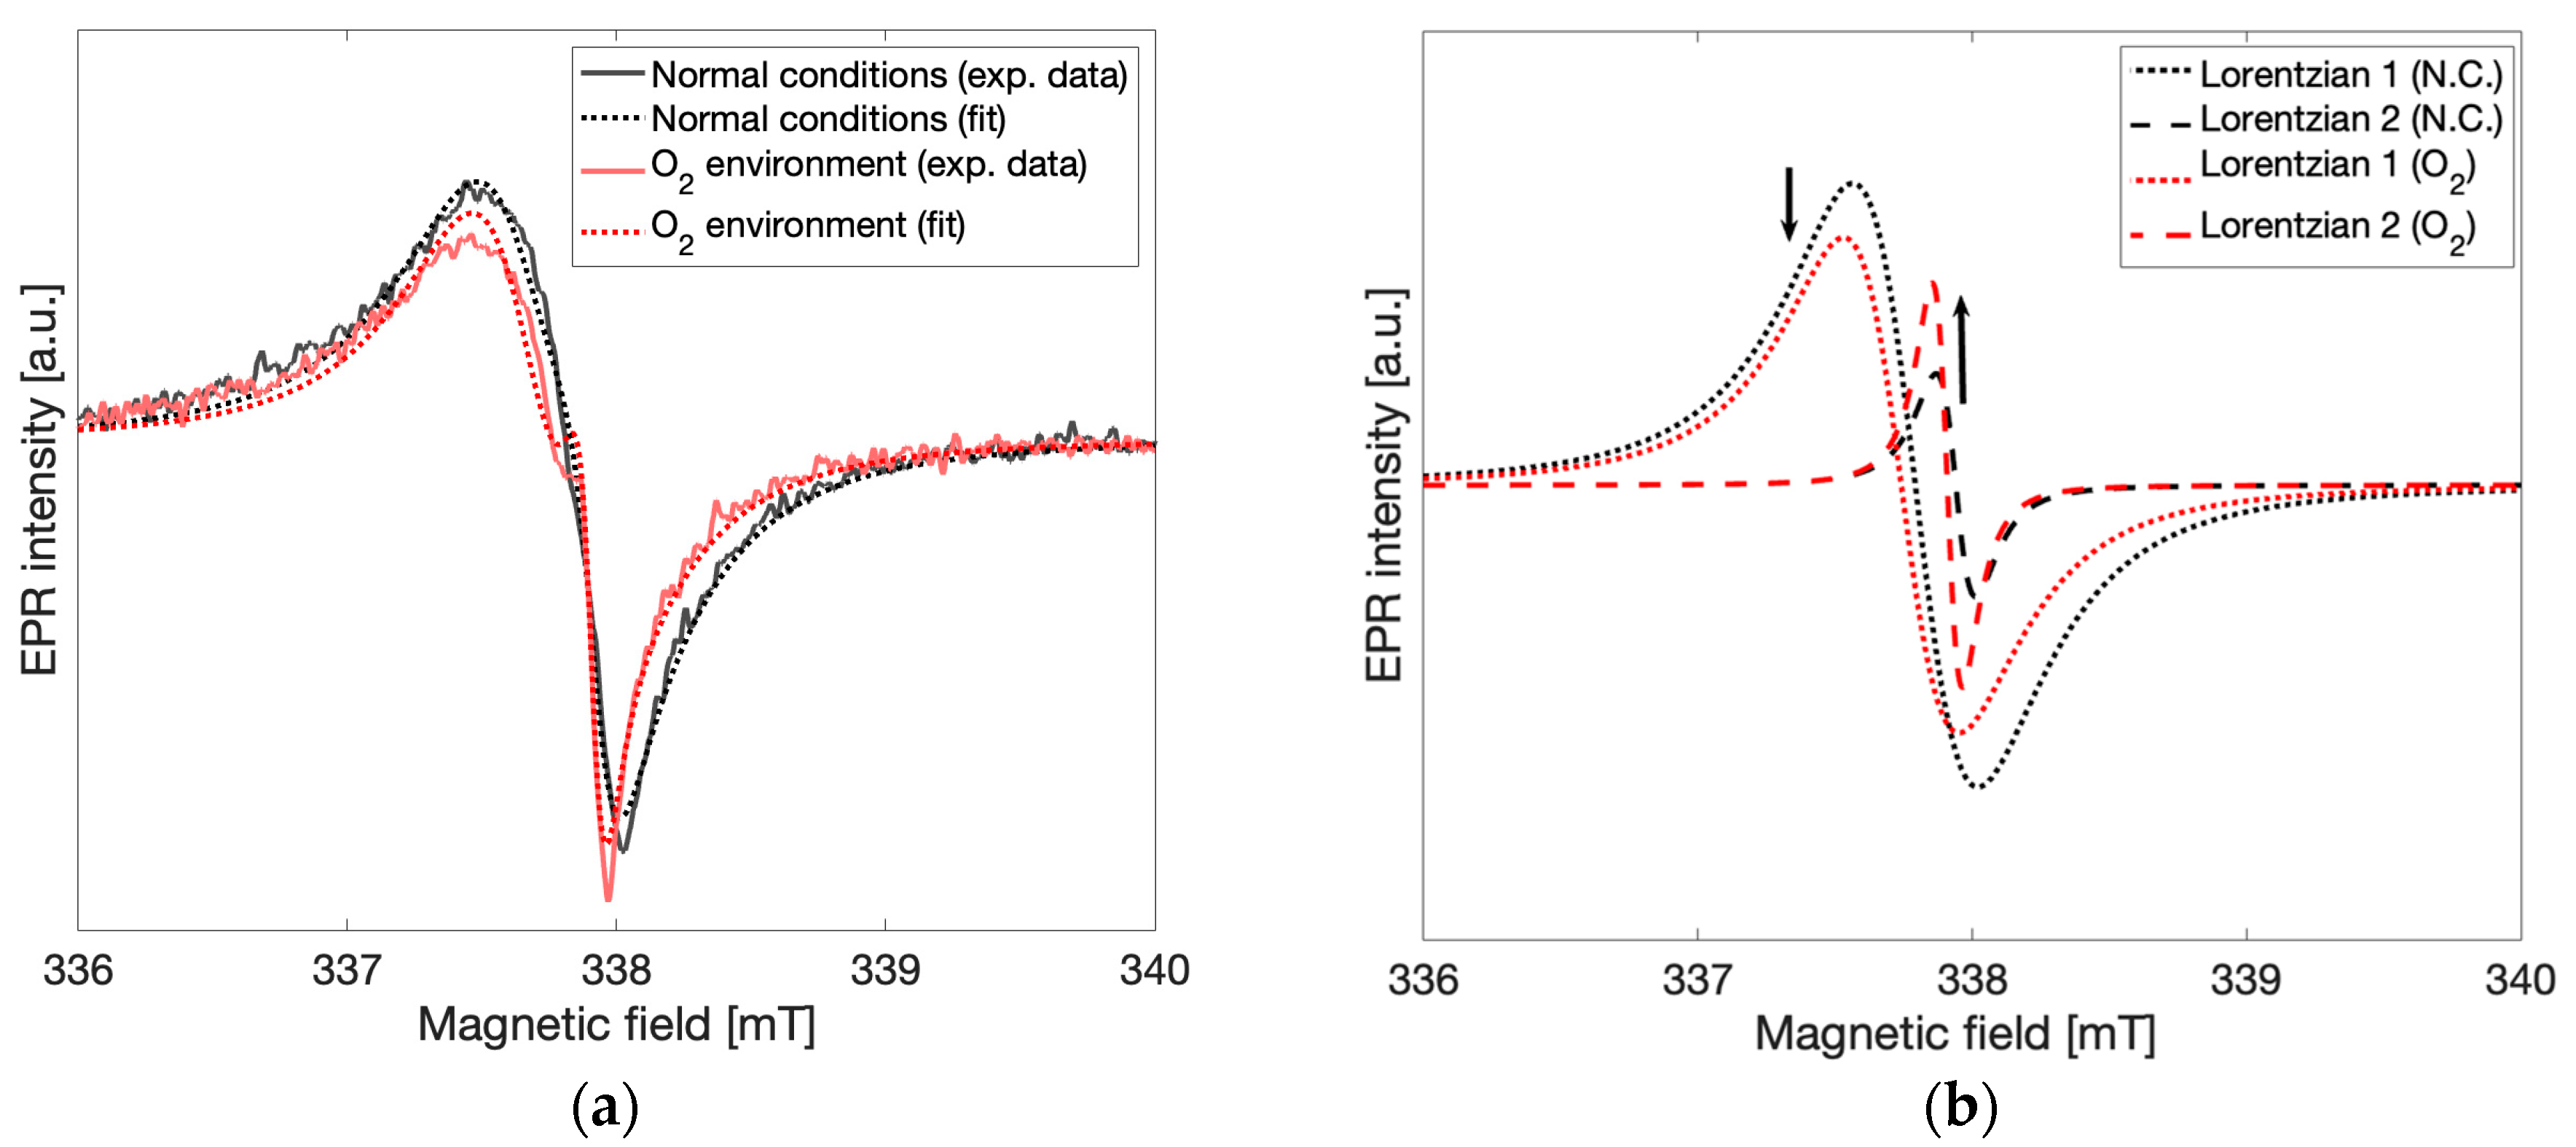
To test the effects of oxygen in the environment on the spectral lineshape, the sample tube with gCN powder was exposed to an oxygen-enriched environment by replacing the atmosphere of the EPR sample tube with oxygen. EPR spectra were recorded immediately after oxygen was introduced and continuously for 8 h. In
Figure 6a spectra taken in the oxygen-enriched environment and in normal atmospheric conditions are shown for comparison. Both an increase in the signal corresponding to spin species 2 and a decrease in the signal corresponding to spin species 1 were observed. In
Figure 6b Lorentzian lines calculated from the fitting routine described above and corresponding to spin species 1 (g = 2.004,
dotted lines) and spin species 2 (g = 2.003,
dashed lines) are shown under normal atmospheric conditions (
black) and oxygen-enriched conditions (
red). The observed relative change in the peak-to-peak intensities of the Lorentzian lines demonstrates that concentrations of spin species 2 increased while concentrations of spin species 1 decreased after oxygen enrichment in a manner similar to those observed to be taking place slowly over time. Direct oxidation of the gCN material was attempted via treatment with aqueous H
2O
2 solution (3%) and the EPR response before and after treatment was recorded. The obtained results demonstrated a similar effect where the signal from spin species 2 increases in intensity while the signal from spin species 1 decreases. This effect is quickly followed by additional degradation of the material, characterized by numerous additional overlapping signals (
Figure S5 from Supplementary Materials) [
9]. Further analysis of these results was not pursued due to low SNR from the increased microwave absorption of aqueous solutions. From these experiments taken together, it may be concluded that a local increase in oxygen concentration interacting with the gCN material leads to similar spectral changes to those observed in the time-dependent response, providing unambiguous support for oxidation processes as the primary influence on the time-dependent appearance of spin species 2 and may be attributed to new spin centers formed via the interaction of gCN with atmospheric oxygen.


 ,
, 


