
Hydrophilic Partitioning or Surface Adsorption? A Quantitative Assessment of Retention Mechanisms for Hydrophilic Interaction Chromatography (HILIC)


Abstract
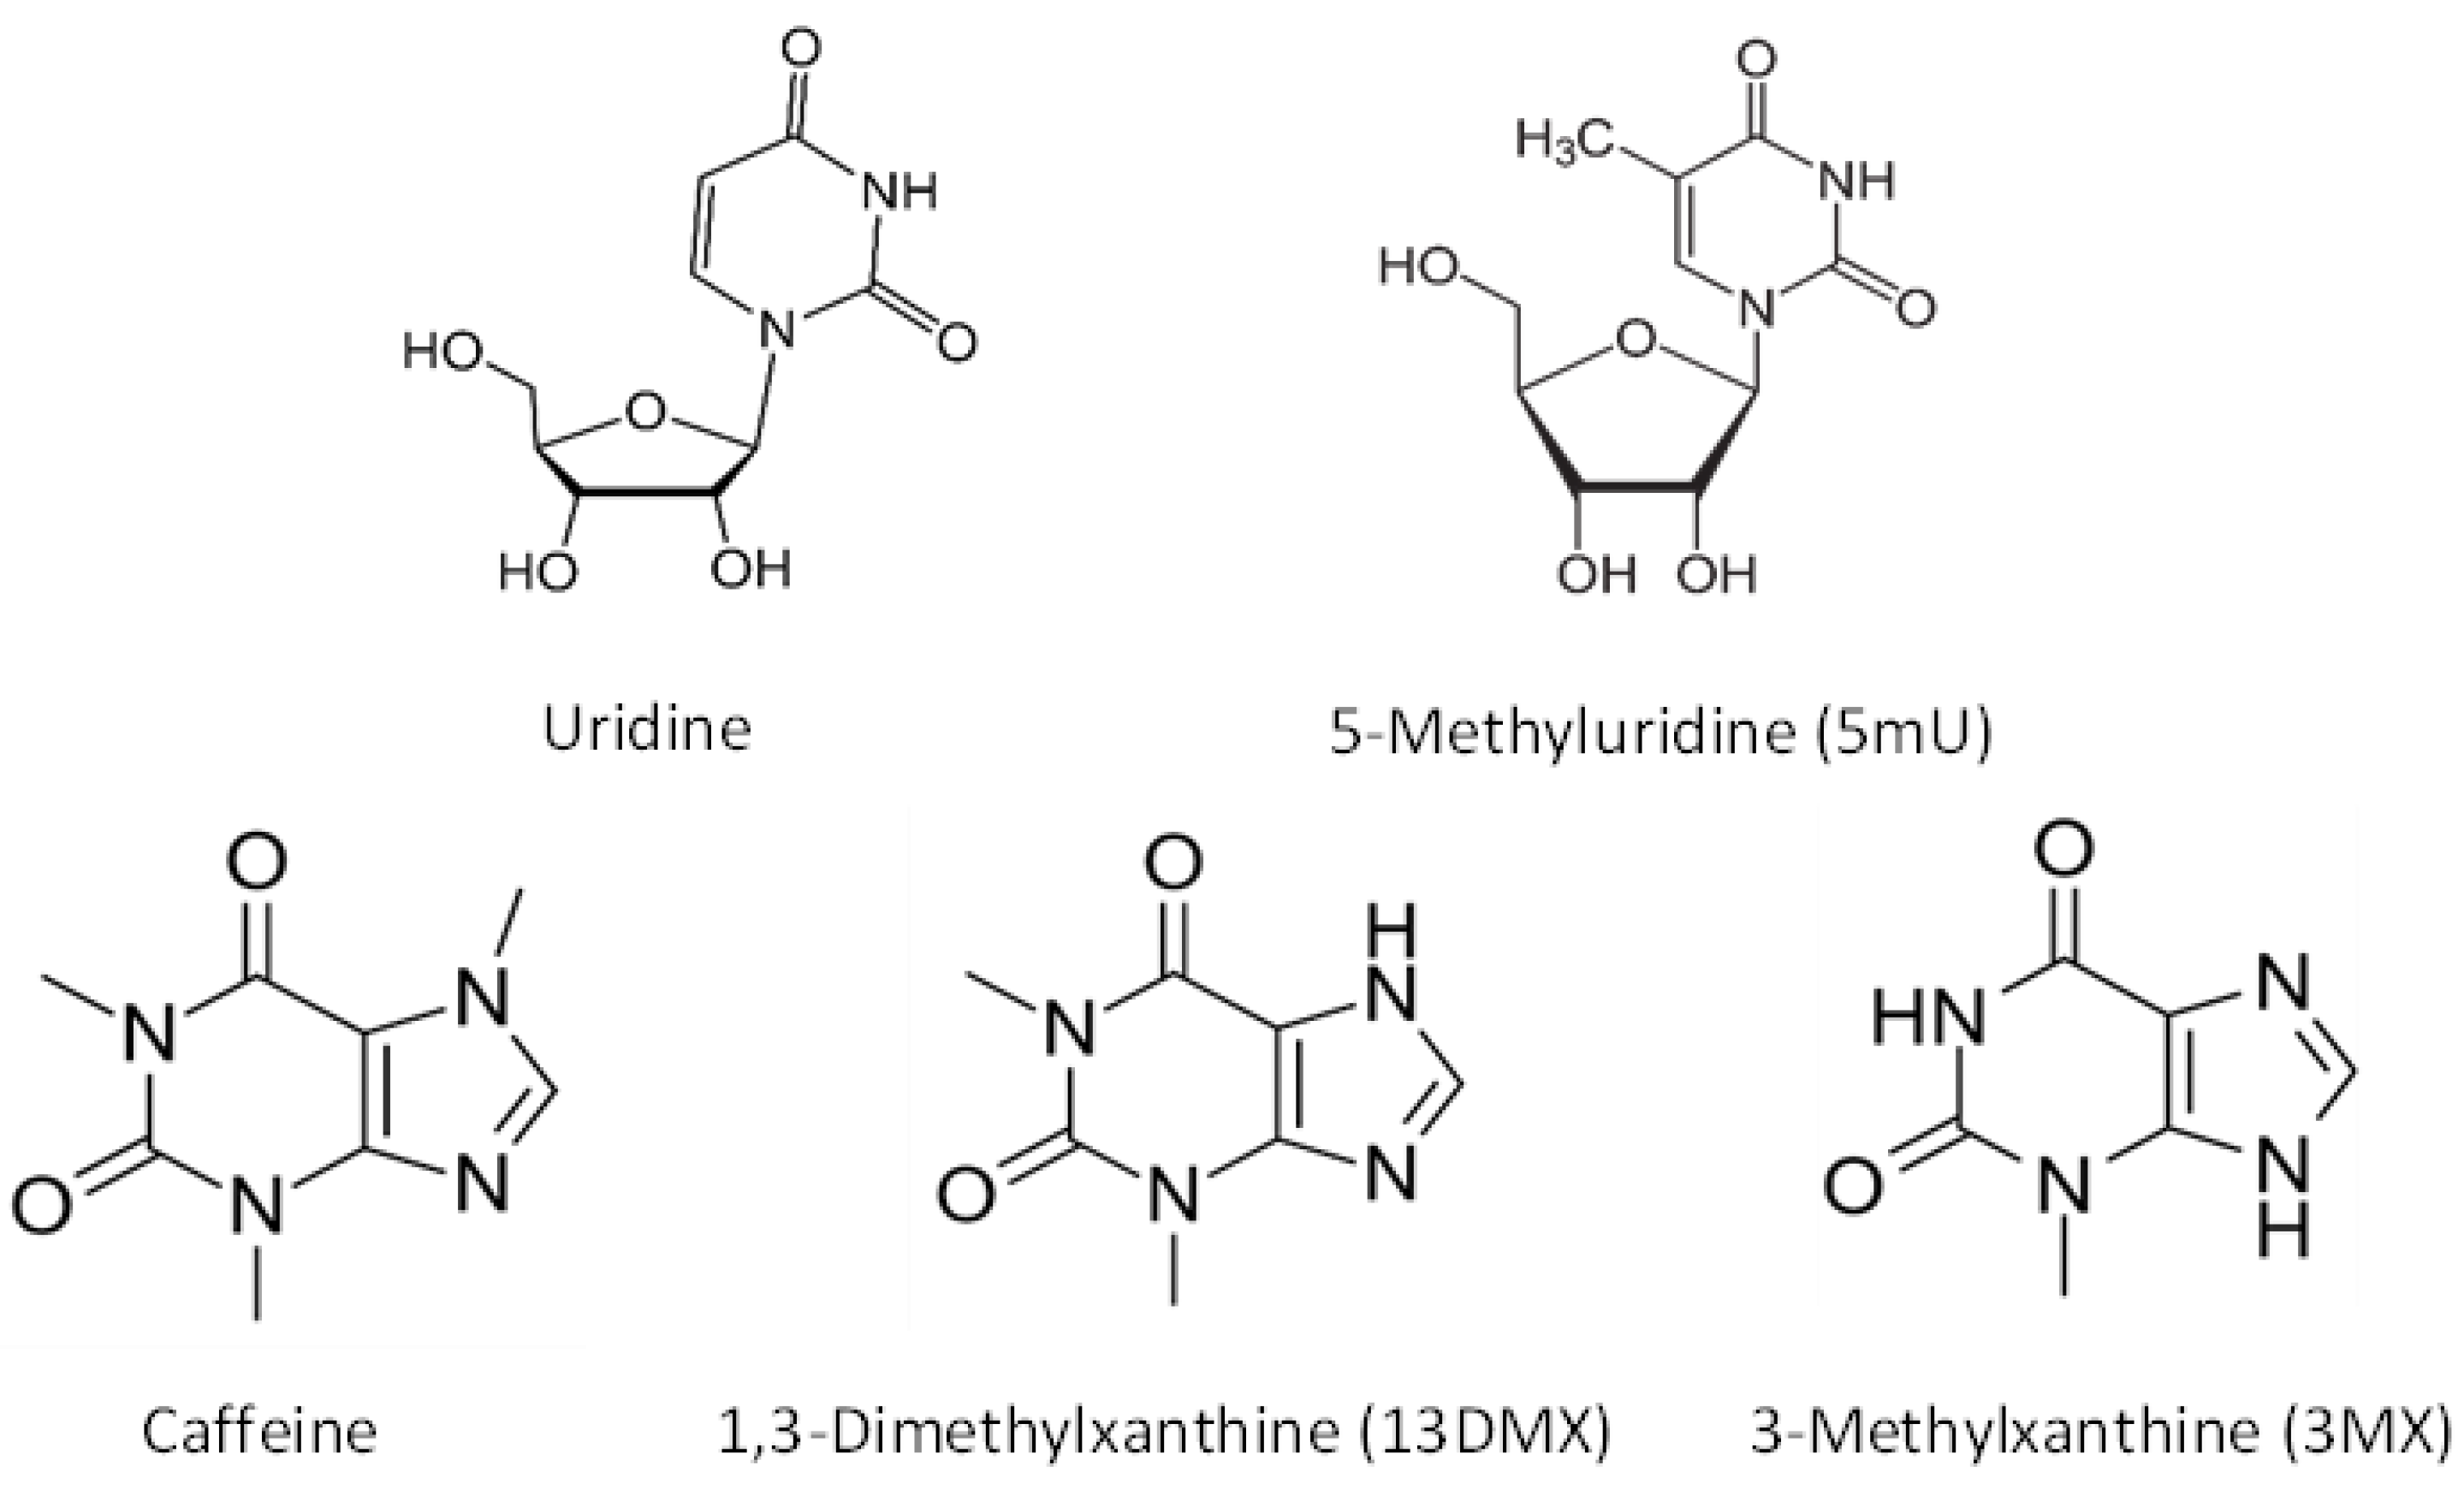
:1. Introduction
2. Results and Discussion
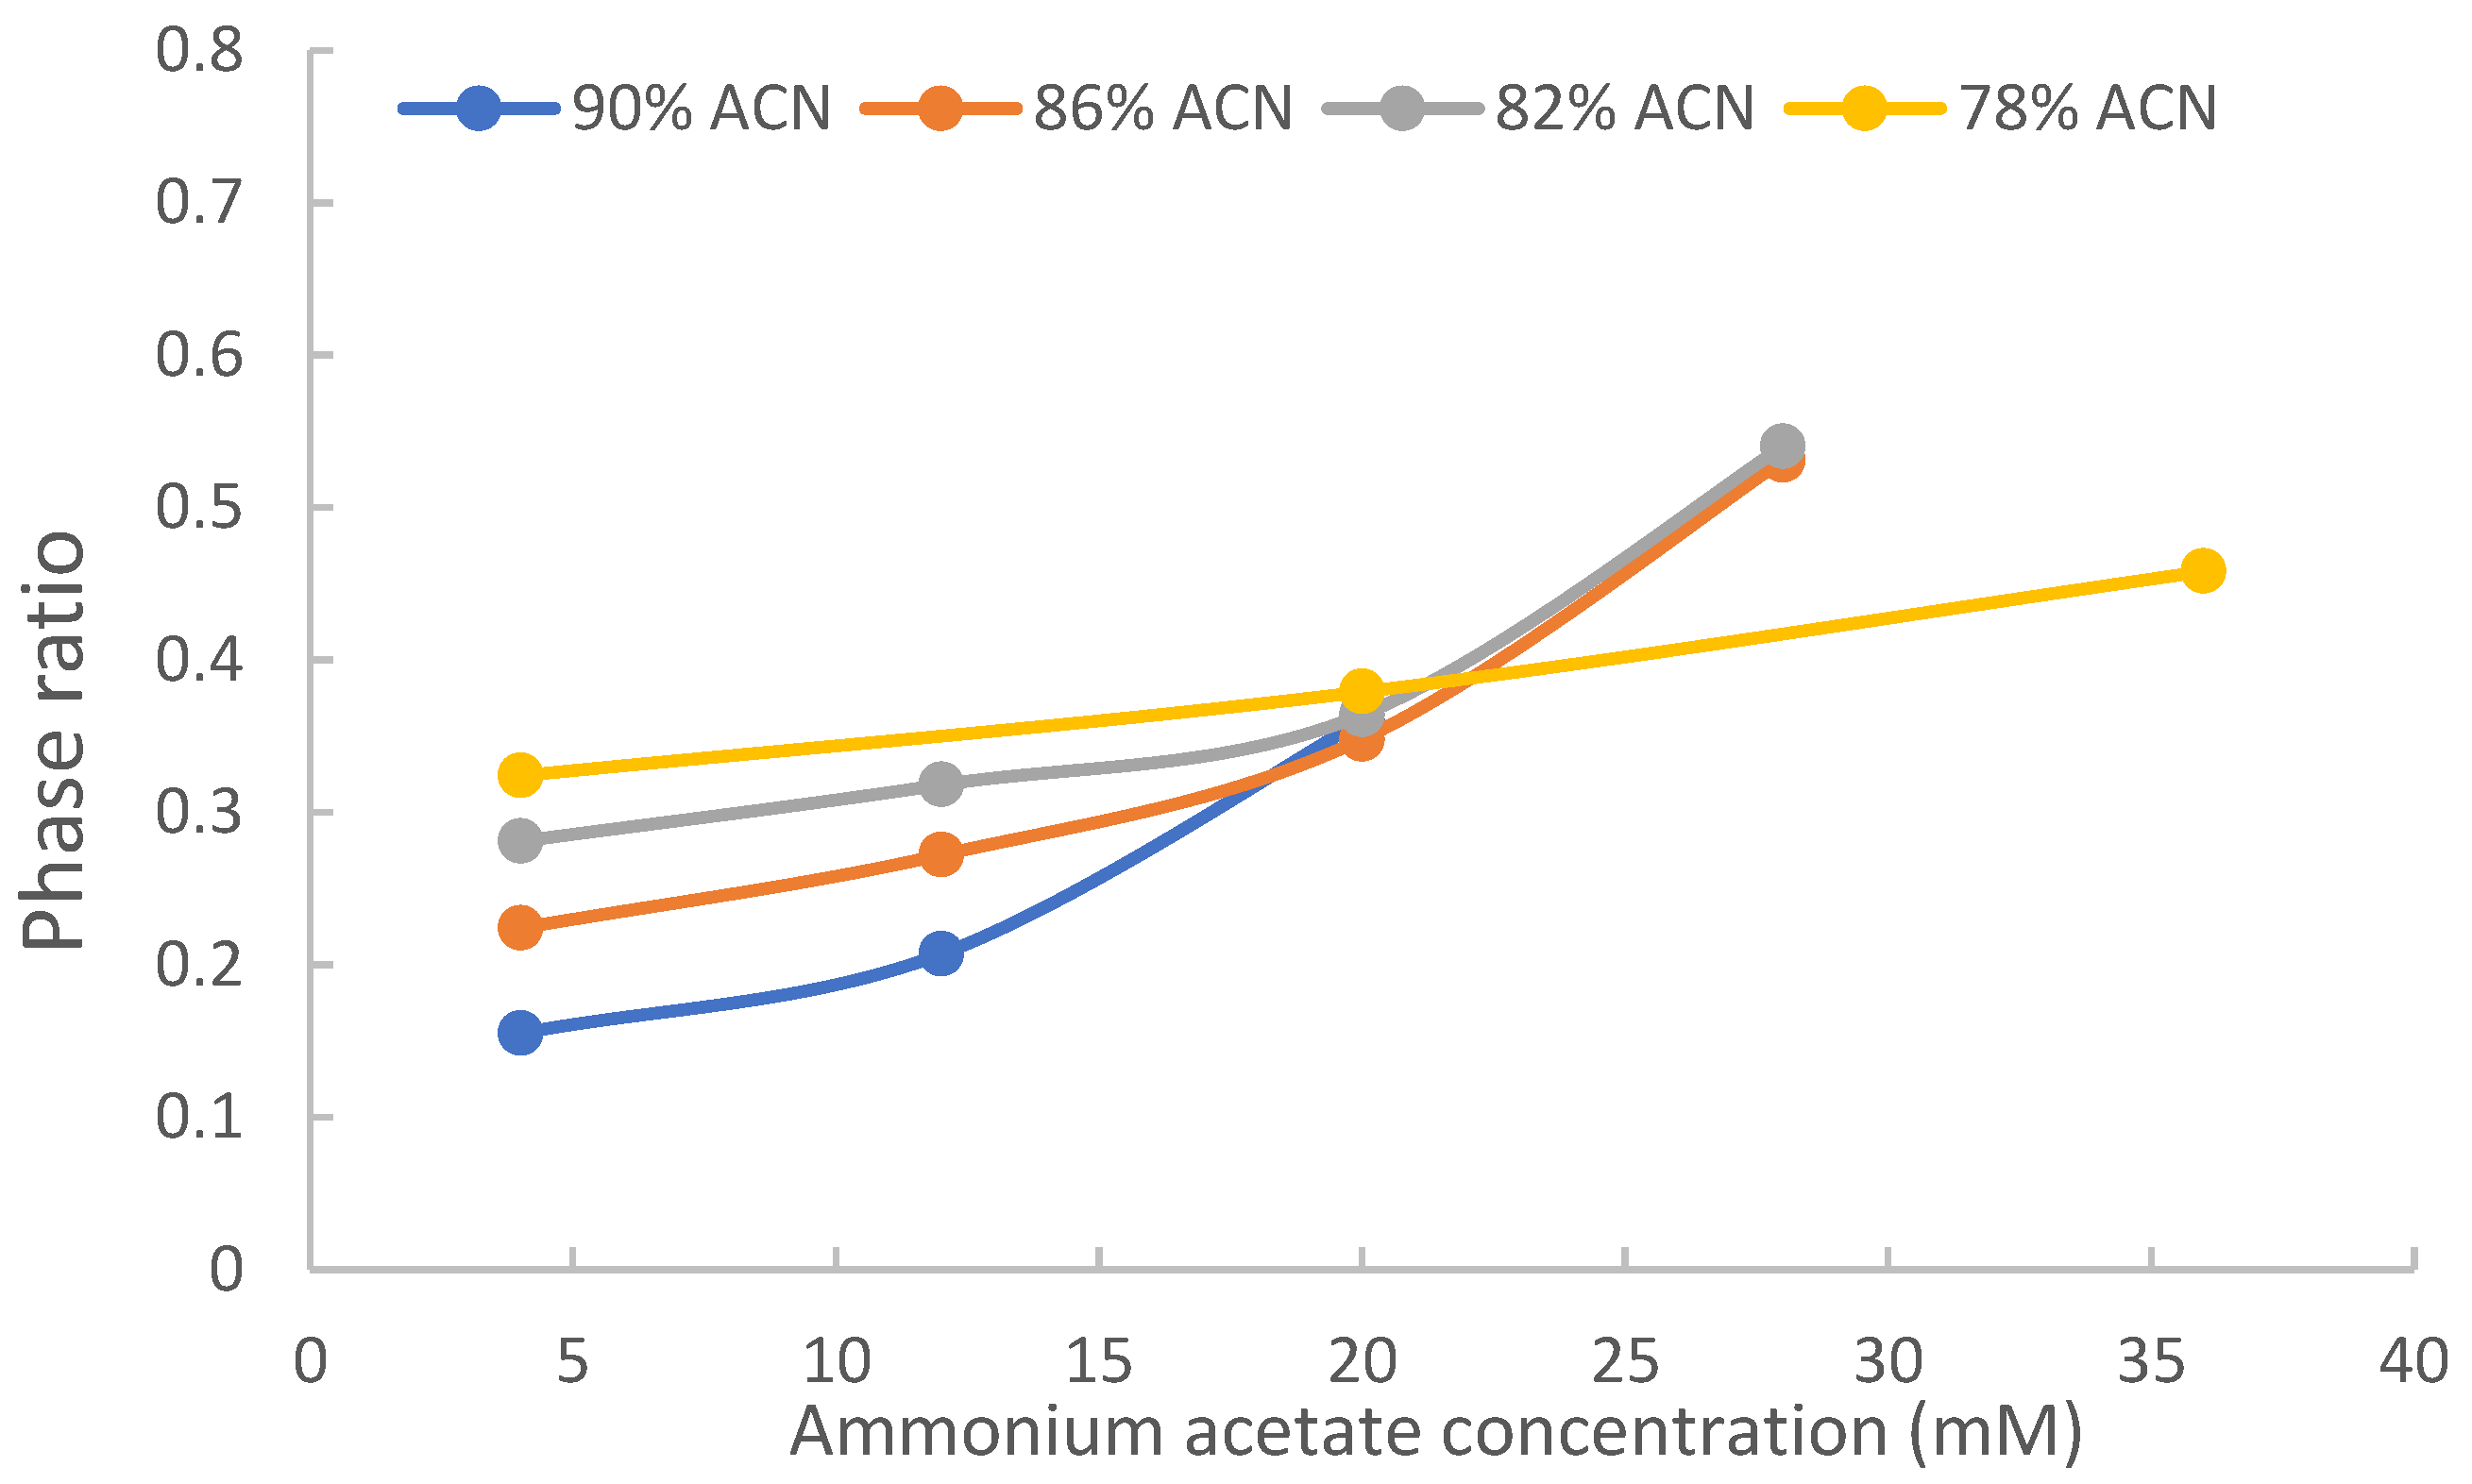
2.1. Phase Ratio
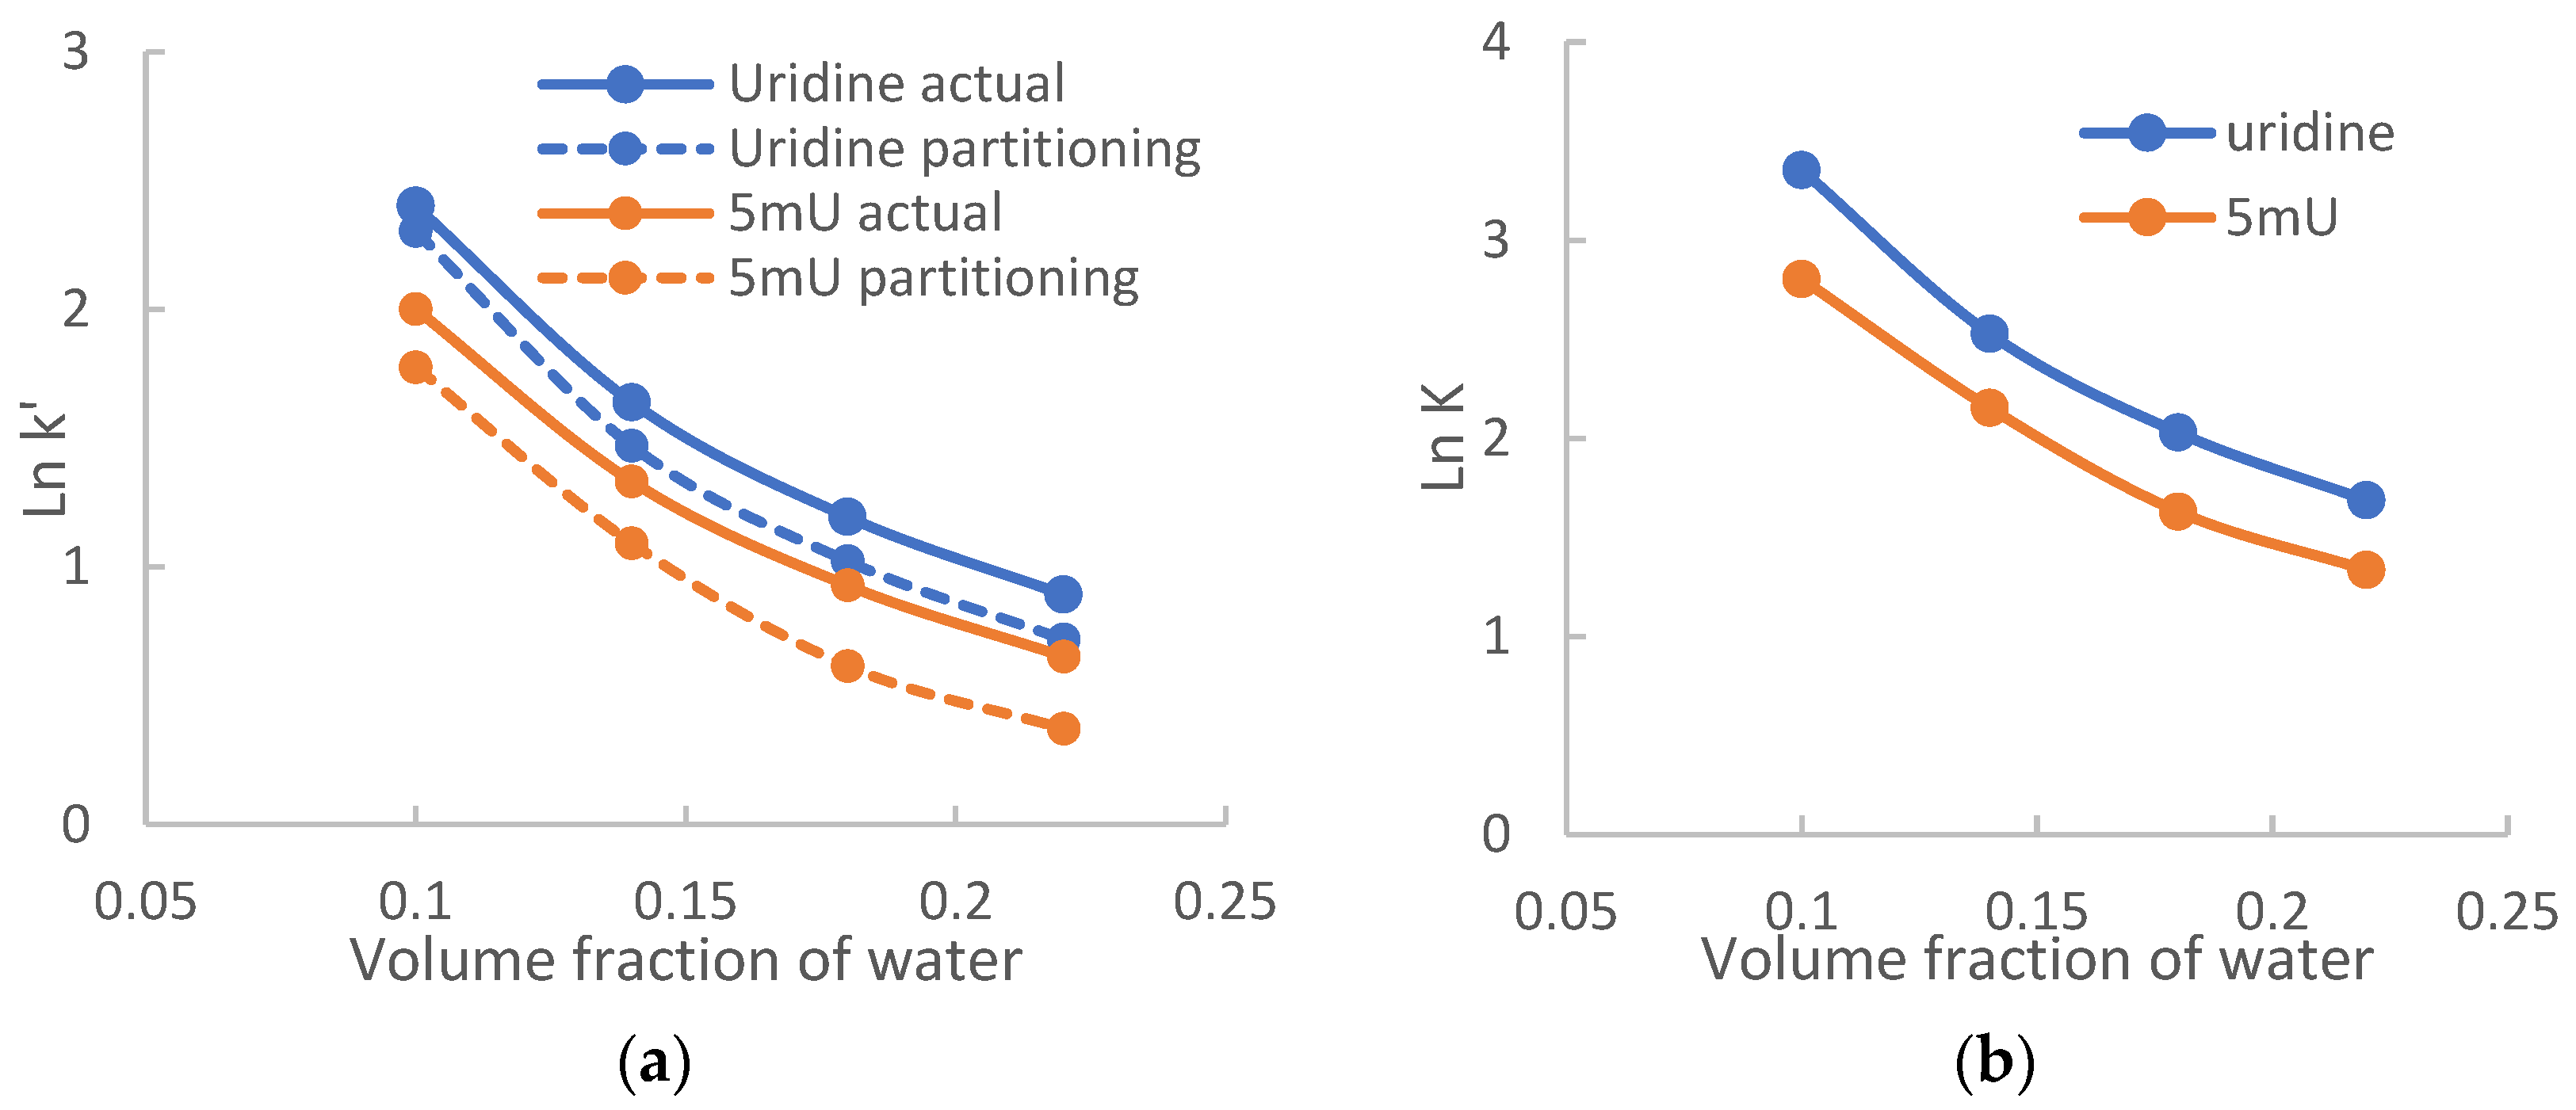
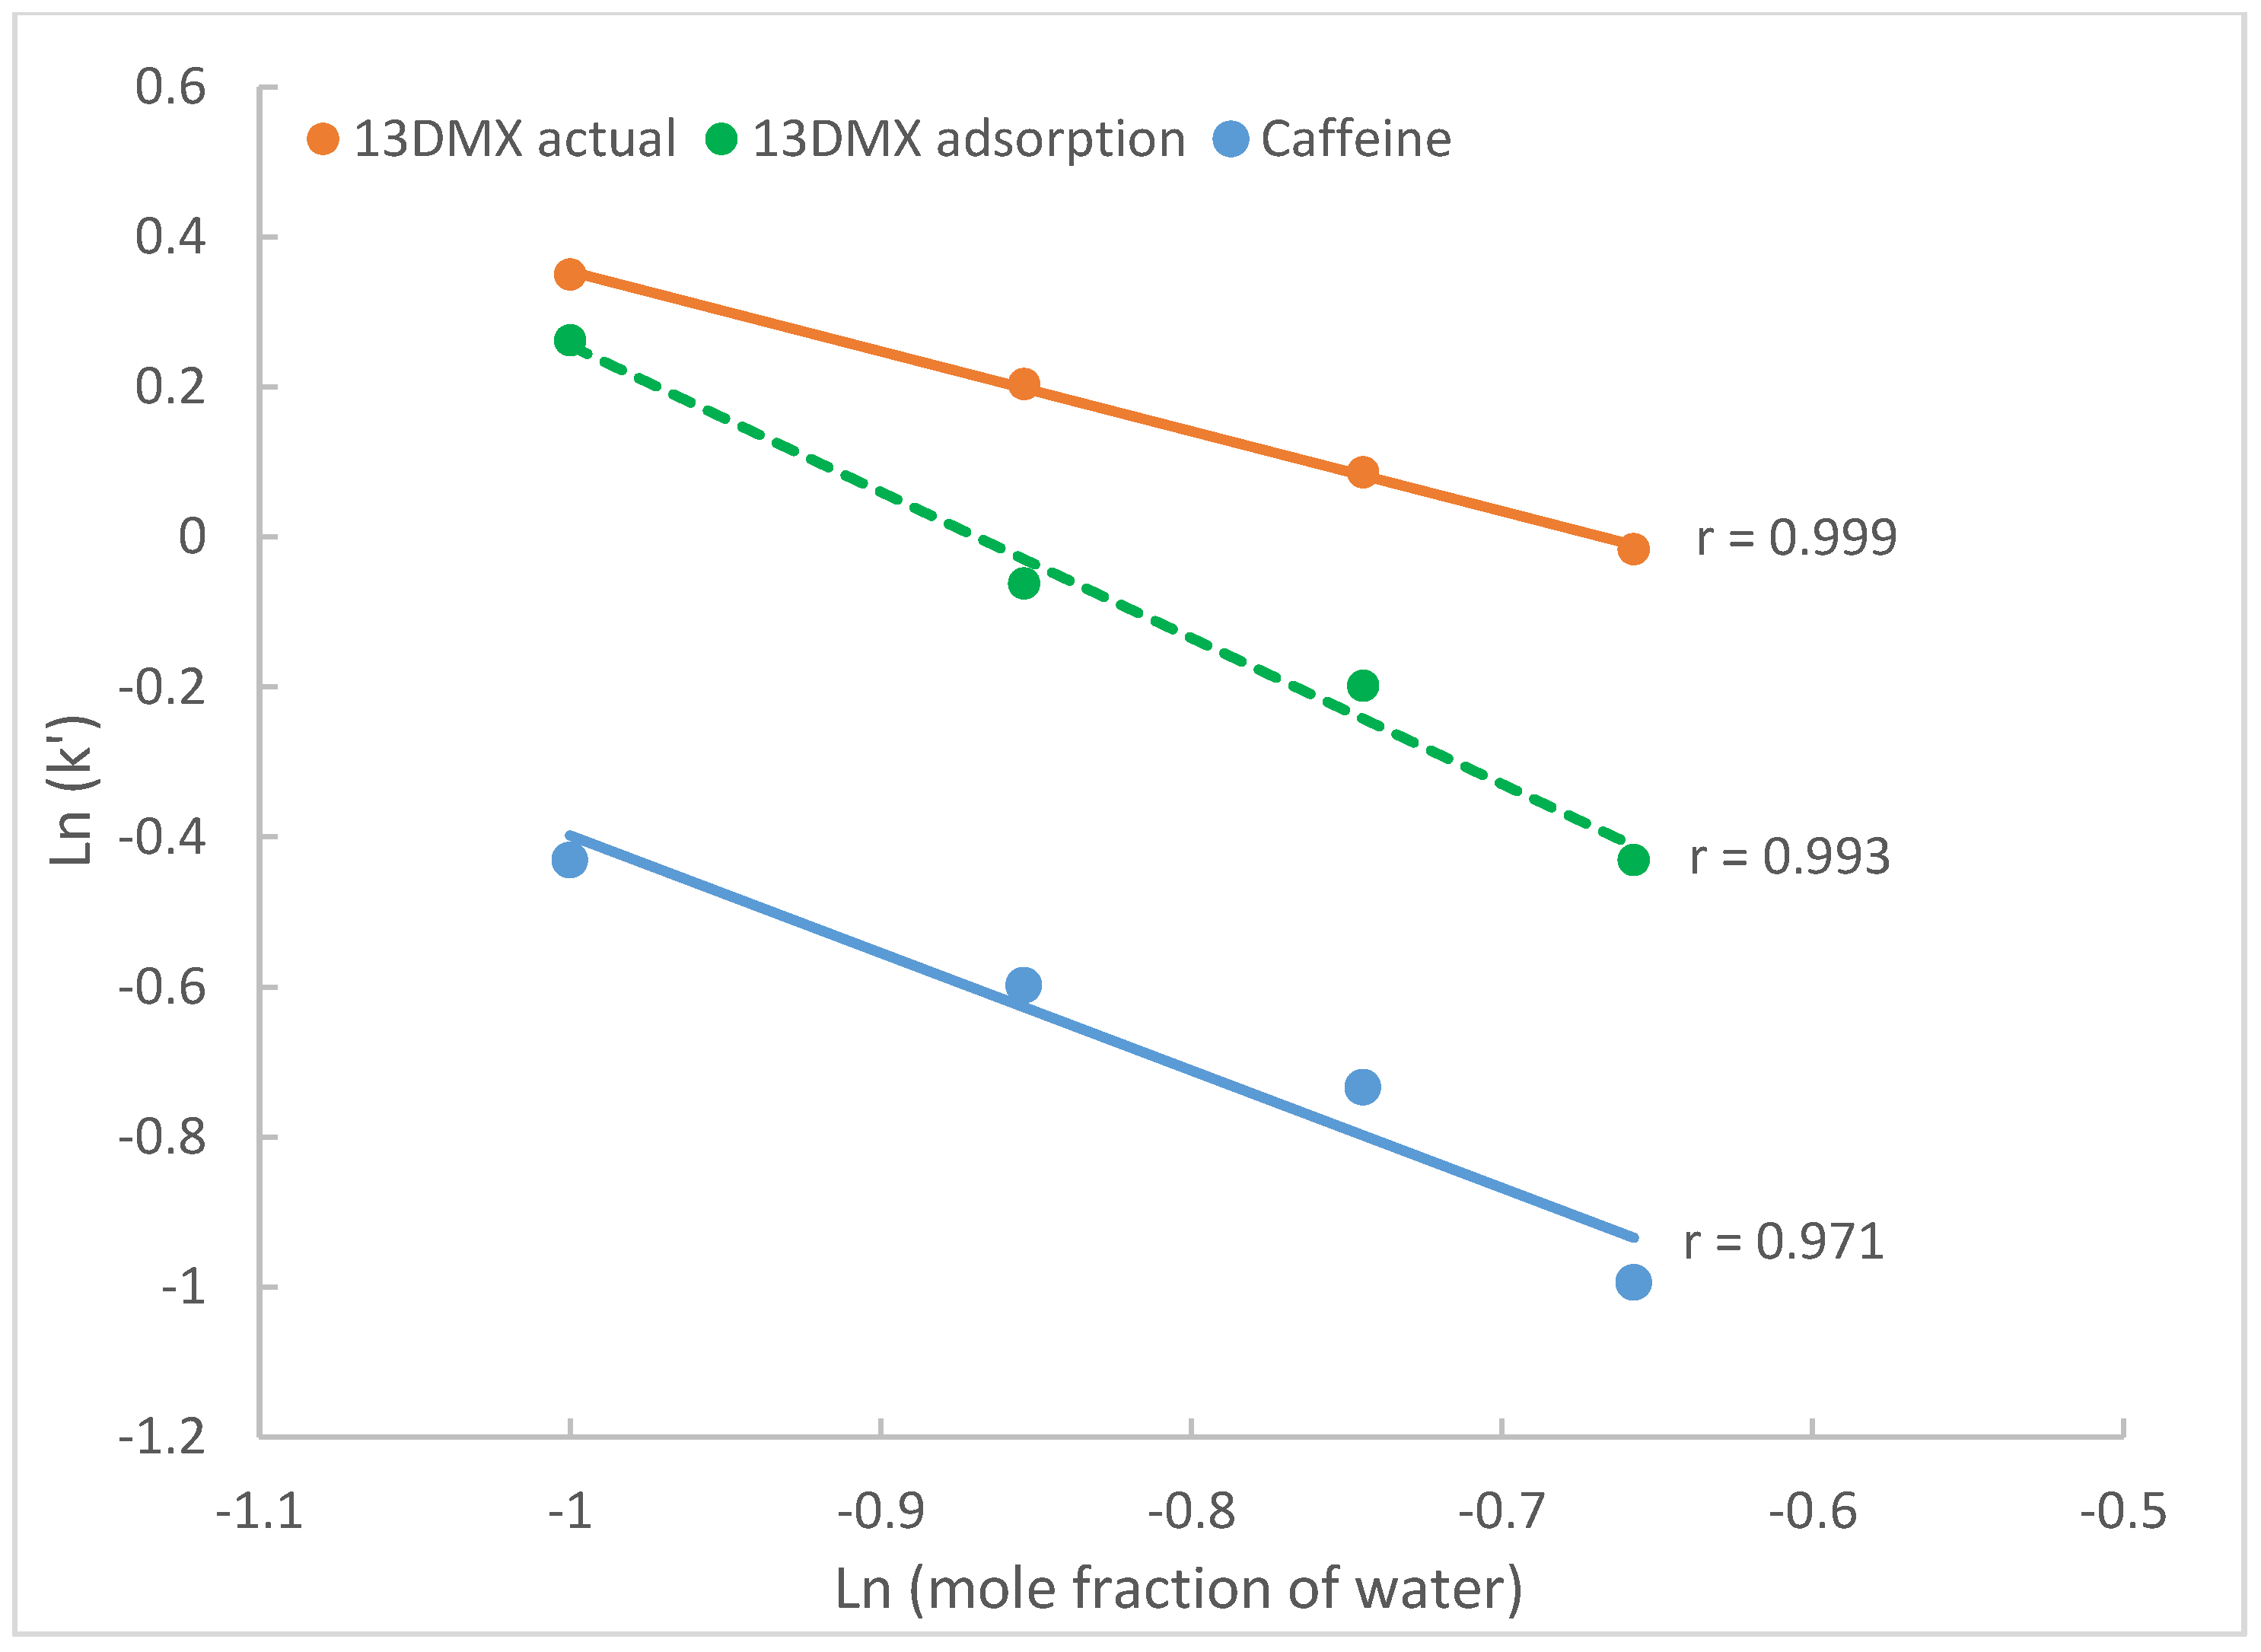
2.2. Quantitative Retention Assessment
2.3. The Effect of Acetonitrile Content
2.3.1. The Effect on Hydrophilic Partitioning
2.3.2. The Effect on Surface Adsorption
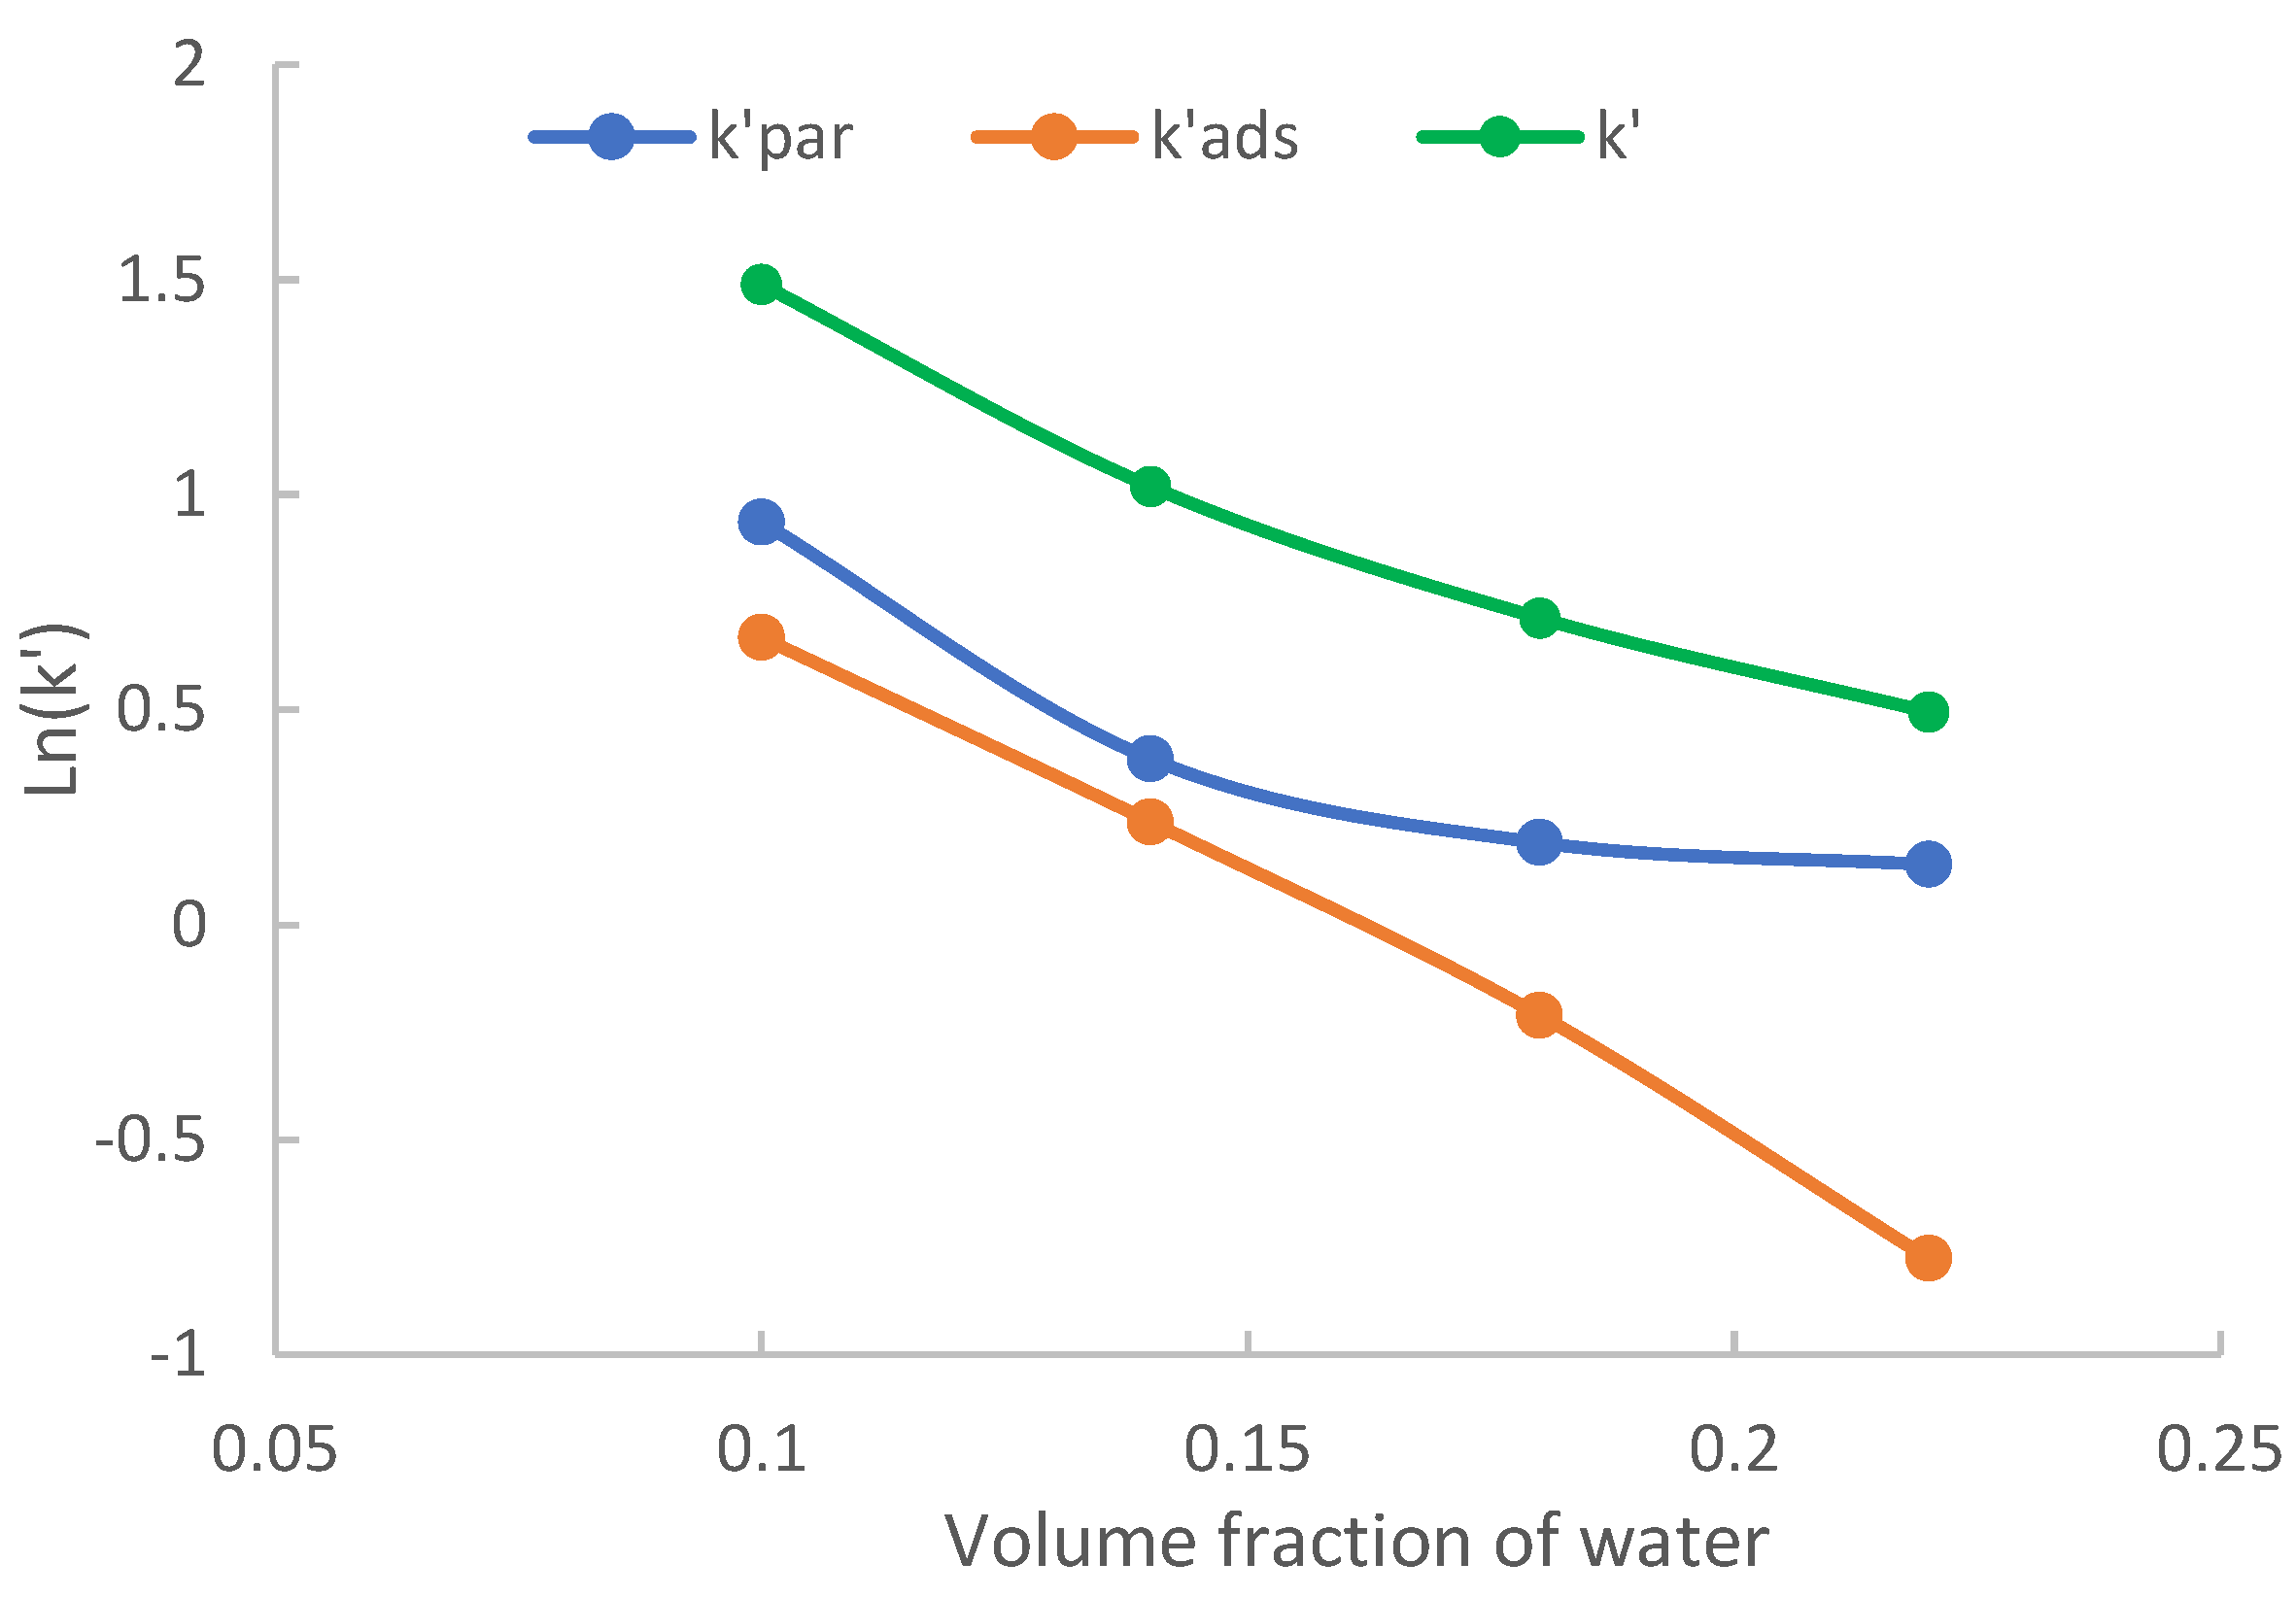
2.3.3. The Effect on Combined Hydrophilic Partitioning and Surface Adsorption
3. Materials and Methods
3.1. Materials and Reagents
3.2. Equipment and Methods
4. Conclusions
Author Contributions
Funding
Institutional Review Board Statement
Informed Consent Statement
Data Availability Statement
Acknowledgments
Conflicts of Interest
Sample Availability
References
- Alpert, A. Hydrophilic interaction chromatography for the separation of peptides, nucleic acids and other polar compounds. J. Chromatogr. 1990, 499, 177–196. [Google Scholar] [CrossRef] [PubMed]
- Buszewski, B.; Noga, S. Hydrophilic interaction liquid chromatography—A powerful separation technique. Anal. Bioanal. Chem. 2012, 402, 231–247. [Google Scholar] [CrossRef] [PubMed]
- Moco, S.; Buescher, J.M. Metabolomics, going deeper, go broader, go further. Methods Mol. Bio. 2023, 2554, 155–178. [Google Scholar]
- Kohler, I.; Verhoeven, M.; Haselberg, R. Hydrophilic interaction chromatography—Mass spectrometry for metabolomics and proteomics: State-of-the-art and current trends. Microchem. J. 2022, 175, 106986. [Google Scholar] [CrossRef]
- Guo, Y. A survey of polar stationary phases for hydrophilic interaction chromatography and recent progress in understanding retention and selectivity. Biomed. Chromatogr. 2022, 36, e5332. [Google Scholar] [CrossRef] [PubMed]
- Liao, W.R.; Wu, K.L.; Chiang, K.H.; Teng, C.E.; Chen, S.F. Analysis of highly polar pesticides in foods by LC-MS/MS. J. Food Drug Anal. 2022, 30, 538–548. [Google Scholar] [CrossRef]
- Wang, F.; Yang, F.; Tian, Y.; Liu, J.; Shen, J.; Bai, Q. Studies on the retention mechanism of solutes in hydrophilic interaction chromatography using stoichiometric displacement theory I. The linear relationship of lgk′ vs. lg[H2O]. Talanta 2018, 176, 499–508. [Google Scholar] [CrossRef]
- Subirats, X.; Abraham, M.H.; Roses, M. Characterization of hydrophilic interaction liquid chromatography retention by a linear free energy relationship. Comparison to reversed- and normal-phase retentions. Anal. Chim. Acta 2018, 1092, 132–143. [Google Scholar] [CrossRef]
- McCalley, D. Understanding and manipulating the separation in hydrophilic interaction liquid chromatography—A review. J. Chromatogr. A 2017, 1523, 204–214. [Google Scholar] [CrossRef]
- Guo, Y.; Shah, R. Detailed insights into the retention mechanism of caffeine metabolites on the amide stationary phase in hydrophilic interaction chromatography. J. Chromatogr. A 2016, 1643, 121–127. [Google Scholar] [CrossRef]
- Gritti, F.; Holtzel, A.; Tallarek, U.; Guiochon, G. Relative importance of the adsorption and partitioning mechanisms in hydrophilic interaction liquid chromatography. J. Chromatogr. A 2015, 1376, 112–125. [Google Scholar] [CrossRef] [PubMed]
- Wang, F.; Yang, F.; Liu, J.; Bai, Q. Studies on the retention mechanism of solutes in hydrophilic interaction chromatography using stoichiometric displacement theory II. HILIC/RPLC dual-retention mechanism of solutes in hydrophilic interaction chr matography over the entire range of water concentration in mobile phase. Talanta 2023, 265, 124858. [Google Scholar] [PubMed]
- Melnikov, S.M.; Holtzel, A.; Seidel-Morgenstern, A.; Tallarek, U. A molecular dynamics study on the partitioning mechanism in hydrophilic interaction chromatography. Angew. Chem. Int. Ed. 2012, 51, 6251–6254. [Google Scholar] [CrossRef]
- Chirita, R.I.; West, C.; Zubrzycki, S.; Finaru, A.L.; Elfakir, C. Investigations on the chromatographic behavior of zwitterionic stationary phases used in hydrophilic interaction chromatography. J. Chromatogr. A 2011, 1218, 5939–5963. [Google Scholar] [CrossRef] [PubMed]
- Shamshir, A.; Dinh, N.P.; Jonsson, T.; Sparrman, T.; Irgum, K. Probing the retention mechanism of small hydrophilic molecules in hydrophilic interaction chromatography using saturation transfer difference nuclear magnetic resonance spectroscopy. J. Chromatogr. A 2020, 1623, 461130. [Google Scholar] [CrossRef] [PubMed]
- Alpert, A.J. Effect of salts on retention in hydrophilic interaction chromatography. J. Chromatogr. A 2018, 1538, 45–53. [Google Scholar] [CrossRef]
- Greco, G.; Letzel, T. Main interactions and influences of the chromatographic parameters in HILIC separations. J. Chromatogr. Sci. 2013, 51, 684–693. [Google Scholar] [CrossRef]
- Hanai, T. Quantitative explanation of retention mechanisms in reversed-phase mode liquid chromatography and untilization of typical reversed-phase liquid chromatography for drug discovery. Current Chromatogr. 2019, 6, 52–64. [Google Scholar] [CrossRef]
- Rafferty, J.; Zhang, L.; Siepmann, J.I.; Schure, M.R. Retention mechanism in reversed-phase liquid chromatography; a molecular perspective. Anal. Chem. 2007, 79, 6551–6556. [Google Scholar] [CrossRef]
- Gritti, F.; Guiochon, G. Critical contribution of non-linear chromatography to the understanding of retention mechanism in reversed-phase liquid chromatography. J. Chromatogr. A 2005, 1099, 1–42. [Google Scholar] [CrossRef]
- Hemstrom, P.; Irgum, K. Hydrophilic interaction chromatography. J. Sep. Sci. 2009, 29, 1784–1821. [Google Scholar] [CrossRef] [PubMed]
- Jin, G.; Guo, Z.; Zhang, F.; Xue, X.; Jin, Y.; Liang, X. Study on the retention equation in hydrophilic interaction liquid chromatography. Talanta 2008, 76, 522–527. [Google Scholar] [CrossRef] [PubMed]
- Guo, Y.; Fattal, B. Relative significance of hydrophilic partitioning and surface adsorption to the retention of polar compounds in hydrophilic interaction chromatography. Anal. Chim. Acta 2021, 1184, 339025. [Google Scholar] [CrossRef] [PubMed]
- Neue, U.D. Theory of Chromatography. In HPLC Columns; Theory, Technology, and Practice; Wiley-VCH Inc.: New York, NY, USA, 1997; pp. 35–36. [Google Scholar]
- Kawachi, Y.; Ikegami, T.; Takubo, H.; Ikegami, Y.; Miyamoto, M.; Tanaka, N. Chromatographic characterization of hydrophilic interaction liquid chromatography stationary phases: Hydrophilicity, charge effects, structural selectivity, and separation efficiency. J. Chromatogr. A 2011, 1218, 5903–5919. [Google Scholar] [CrossRef]
- Guo, Y.; Bholodia, N.; Fattal, B.; Serris, I. Evaluating the adsorbed water layer on polar stationary phases for hydrophilic interaction chromatography (HILIC). Separations 2019, 6, 19. [Google Scholar] [CrossRef]
- McCalley, D.V. Evaluation of a linear free nergy relationship for the deerminaton of the column void volume in hydrophilic interaction chromatography. J. Chromatogr. A 2020, 1638, 461849. [Google Scholar] [CrossRef] [PubMed]
- Jandera, P.; Hajek, T. Mobile phase effects on the retention on polar columns with special attention to the dual hydrophilic interaction-reversed phase liquid chromatography mechanism, a review. J. Sep. Sci. 2018, 41, 145–162. [Google Scholar] [CrossRef]
- Dinh, N.P.; Jonsson, T.; Irgum, K. Water uptake on polar stationary phases under conditions for hydrophilic interaction chromatography and its relation to solute retention. J. Chromatogr. A 2013, 1320, 33–47. [Google Scholar] [CrossRef]
- Soukup, J.; Jandera, P. Adsorption of water from aqueous acetonitrile on silica-based stationary phases in aqueous normal-phase liquid chromatography. J. Chromatogr. A 2014, 1374, 102–111. [Google Scholar] [CrossRef]
- Melnikov, S.M.; Holtzel, A.; Seidel-Morganstern, A.; Tallarek, U. Composition, structure, and mobility of water-acetonitrile mixtures in a silica nanopore studies by molecular dynamics simulation. Anal. Chem. 2011, 83, 2569–2575. [Google Scholar] [CrossRef]
- Neue, U.D. Normal-Phase Chromatography. In HPLC Columns; Theory, Technology, and Practice; Wiley-VCH Inc.: New York, NY, USA, 1997; pp. 164–180. [Google Scholar]


| Test Compound | Distribution Coefficient (K) |
Retention Factor by Partitioning () |
Retention Factor by Adsorption () |
|---|---|---|---|
| Uridine | 28.6 | 10.0 (90.9%) 2 | 0.74 (6.7%) |
| 5-methyluridine | 16.5 | 5.90 (79.7%) | 1.47 (19.8%) |
| 3-methylxanthine | 6.9 | 2.55 (57.6%) | 1.95 (44.1%) |
| 1,3-methylxanthine | 0.7 | 0.36 (22.9%) | 1.30 (83.2%) |
| Caffeine | NA | NA | 0.54 3 |
| Columns | Phase Ratio () | Distribution Coefficient (K) | Intercept | ||
|---|---|---|---|---|---|
| Uridine | YMC PVA | 0.205 | 8.76 | −0.22 | 1.80 (116%) 2 |
| EPIC HILIC | 0.245 | 8.65 | −0.30 | 2.12 (116%) | |
| 5-methyl uridine | YMC PVA | 0.205 | 6.17 | 0.01 | 1.26 (101%) |
| EPIC HILIC | 0.245 | 6.08 | 0.00 | 1.49 (100%) |
Disclaimer/Publisher’s Note: The statements, opinions and data contained in all publications are solely those of the individual author(s) and contributor(s) and not of MDPI and/or the editor(s). MDPI and/or the editor(s) disclaim responsibility for any injury to people or property resulting from any ideas, methods, instructions or products referred to in the content. |
© 2023 by the authors. Licensee MDPI, Basel, Switzerland. This article is an open access article distributed under the terms and conditions of the Creative Commons Attribution (CC BY) license (https://creativecommons.org/licenses/by/4.0/).
Share and Cite
Guo, Y.; Baran, D. Hydrophilic Partitioning or Surface Adsorption? A Quantitative Assessment of Retention Mechanisms for Hydrophilic Interaction Chromatography (HILIC). Molecules 2023, 28, 6459. https://doi.org/10.3390/molecules28186459
Guo Y, Baran D. Hydrophilic Partitioning or Surface Adsorption? A Quantitative Assessment of Retention Mechanisms for Hydrophilic Interaction Chromatography (HILIC). Molecules. 2023; 28(18):6459. https://doi.org/10.3390/molecules28186459
Chicago/Turabian StyleGuo, Yong, and Dominik Baran. 2023. "Hydrophilic Partitioning or Surface Adsorption? A Quantitative Assessment of Retention Mechanisms for Hydrophilic Interaction Chromatography (HILIC)" Molecules 28, no. 18: 6459. https://doi.org/10.3390/molecules28186459
APA StyleGuo, Y., & Baran, D. (2023). Hydrophilic Partitioning or Surface Adsorption? A Quantitative Assessment of Retention Mechanisms for Hydrophilic Interaction Chromatography (HILIC). Molecules, 28(18), 6459. https://doi.org/10.3390/molecules28186459