Article

Single-Molecule Magnet Properties in 3d4f Heterobimetallic Iron and Dysprosium Complexes Involving Hydrazone Ligand

CNRS, ISCR (Institut des Sciences Chimiques de Rennes)—UMR 6226, University of Rennes, 35000 Rennes, France
*
Author to whom correspondence should be addressed.
Molecules 2023, 28(17), 6359; https://doi.org/10.3390/molecules28176359
Submission received: 20 July 2023 / Revised: 28 August 2023 / Accepted: 29 August 2023 / Published: 30 August 2023
(This article belongs to the Special Issue Design of Coordination Compounds with Novel Magnetic Properties)

Abstract

:
The reaction between the ((E)-N′-(2-hydroxy-3-methoxybenzylidene)pyrazine-2-carbohydrazide) (H2opch) ligand and the metallo-precursor [Dy(hfac)3]·2H2O led to the formation of an homometallic coordination complex with the formula [Dy2(hfac)3(H2O)(Hopch)2][Dy(hfac)4] (1). In presence of both [Dy(hfac)3] 2H2O and the Fe(II) salt, the heterobimetallic tetranuclear [FeDy3(hfac)8(H2O)2(opch)2] (2) was isolated, while the addition of the co-ligand 1,2-Bis(2-hydroxy-3-methoxybenzylidene) hydrazine (H2bmh) led to the formation of two heterobimetallic tetranuclear complexes with the formula [Fe3Dy(hfac)6(opch)2(H2bmh)] C6H14 (3) C6H14 and [Fe2Dy2(hfac)7(opch)2(H2bmh)] 0.5C7H16 (4) 0.5C7H16. Single crystal X-ray diffraction and dc magnetic investigation demonstrated that 3 and 4 involved the iron center in the +II and +III oxidation states. Dynamic magnetic measurements highlighted the single-molecule magnet behavior of 1 and 2 in a zero applied dc field primarily due to the ferromagnetic interactions taking place in these compounds.

1. Introduction

Since the discovery of a Mn12 cluster [1] which displayed the first single-molecule magnet (SMM) behavior thirty years ago, the molecular magnetism field is still very active. Its activity was enhanced by the observation a decade later of similar slow magnetic relaxation for a mononuclear lanthanide complex [2]. After these two pioneer works, the community developed several chemical strategies to enhance the magnetic performances of the lanthanide-based SMMs to make them suitable candidates for applications in high-density data storage [3]. Thus, the lanthanide ions, such as Dy(III) and Tb(III), were associated with stable organic radicals to establish significant 2p4f magnetic exchange interactions, allowing the observation of blocking temperatures up to 30 K [4,5]. A few years later, theoretical work demonstrated that two coordinate dysprosium complexes with linear geometry are perfect to maximize the Ising magnetic anisotropy and the energy barrier value [6]. Such complexes with pseudo-linear coordination geometry were designed by chemists using organometallic chemistry [7,8,9], leading to an increase in the blocking temperature of up to 80 K [10]. Recently, the role of lanthanide—lanthanide bonds in the observation of huge coercive fields was reported [11]. The main drawback of these previously mentioned strategies is the poor stability in air and regarding the temperature. Consequently, chemists are also exploring the possibility of combining 3d and 4f elements in hetero-bimetallic complexes to exploit the strong magnetic anisotropy of the 4f ions and to establish significant 3d4f magnetic interactions, which can significantly lessen the quantum tunneling of magnetization (QTM) and improve the energy barrier [12]. The 3d ion can itself bring new physical properties, such as spin-crossover behavior. In this context, the combination of Fe(II) or Fe(III) with Ln(III) is of particular interest and it already permitted the design of 3d4f SMMs [13,14,15,16,17,18].
The two ((E)-N′-(2-hybroxy-3-methoxybenzylidene)pyrazine-2-carbohydrazide) (H2opch) (Scheme 1) and 1,2-Bis(2-hydroxy-3-methoxybenzylidene) hydrazine (H2bmh) (Scheme 1) ligands were selected because they were used to design lanthanide SMMs [19,20,21,22] and Fe(III) spin-crossover complexes [23].
In this article, we proposed to engage these two ligands in coordination reactions with [Dy(hfac)3]·2H2O (hfac = 1,1,1,5,5,5-hexafluororacetylacetonate) and the Fe(II) salt. The homometallic trinuclear complex [Dy2(hfac)3(H2O)(Hopch)2][Dy(hfac)4] (1) as well as the three hetero-bimetallic tetranuclear complexes [FeDy3(hfac)8(H2O)2(opch)2] (2), [Fe3Dy(hfac)6(opch)2(H2bmh)]·C6H14 (3C6H14 and [Fe2Dy2(hfac)7(opch)2(H2bmh)]·0.5C7H16 (40.5C7H16, were isolated and characterized by single crystal X-ray diffraction. Both dc and ac magnetic properties were investigated and the role of the magnetic interaction was emphasized.

2. Results and Discussion

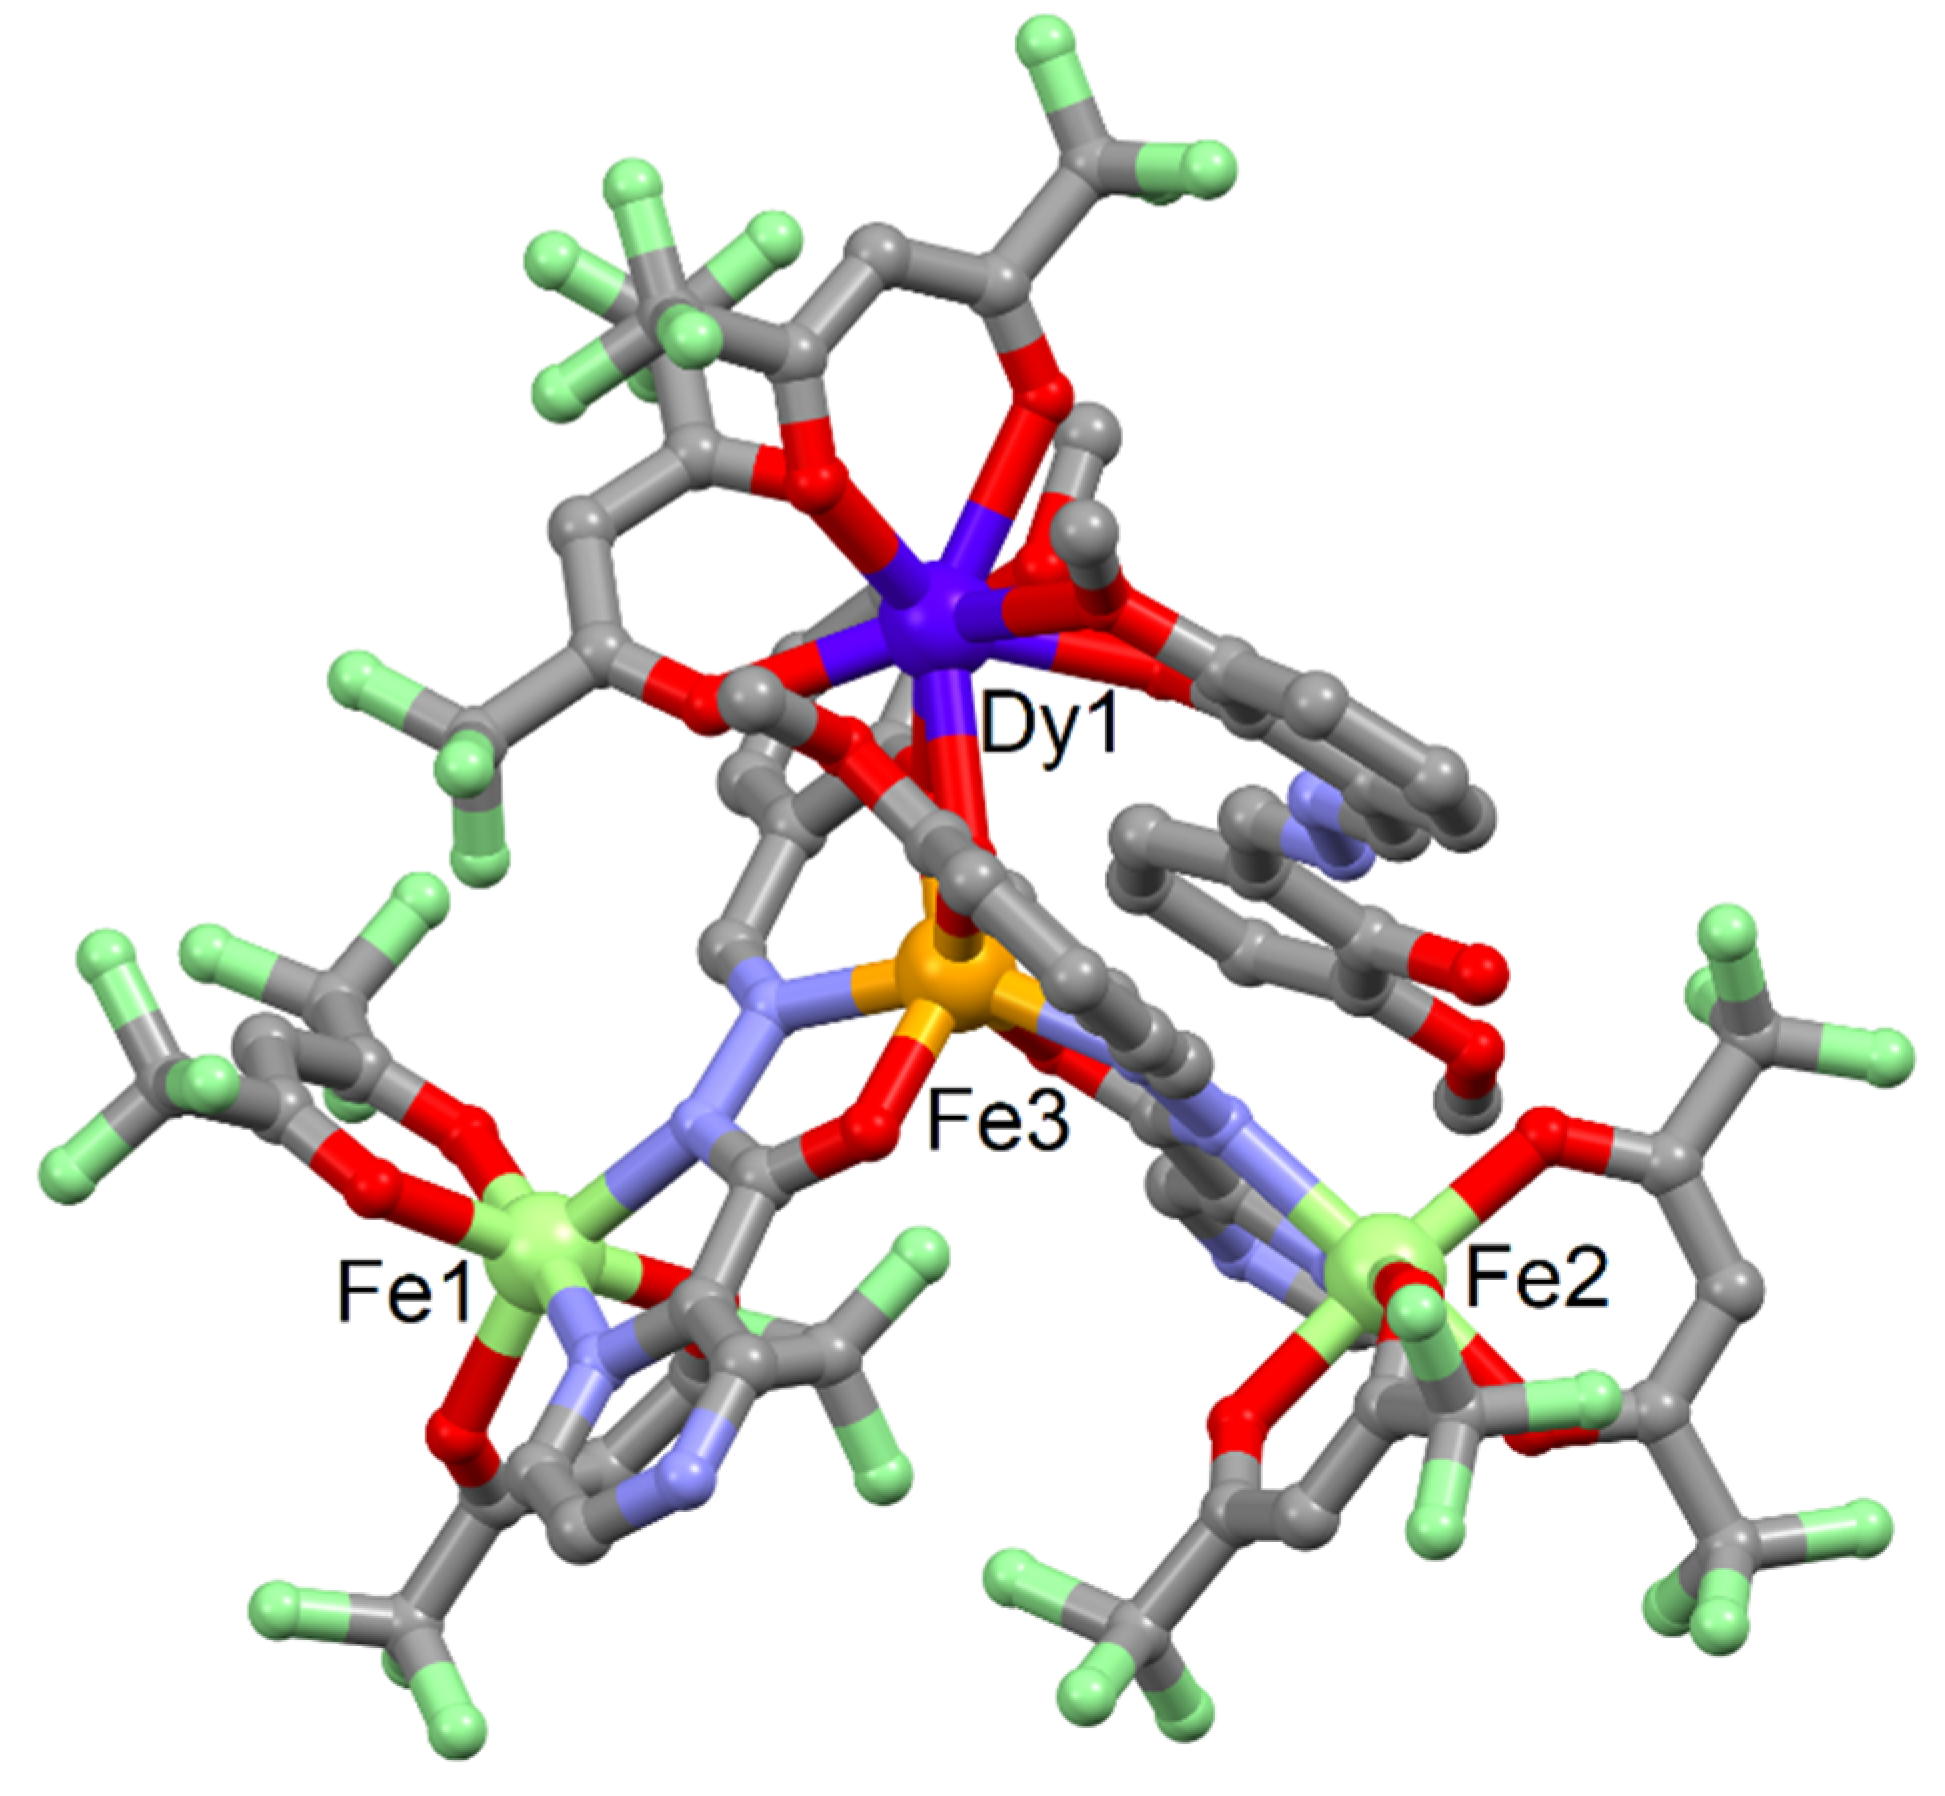
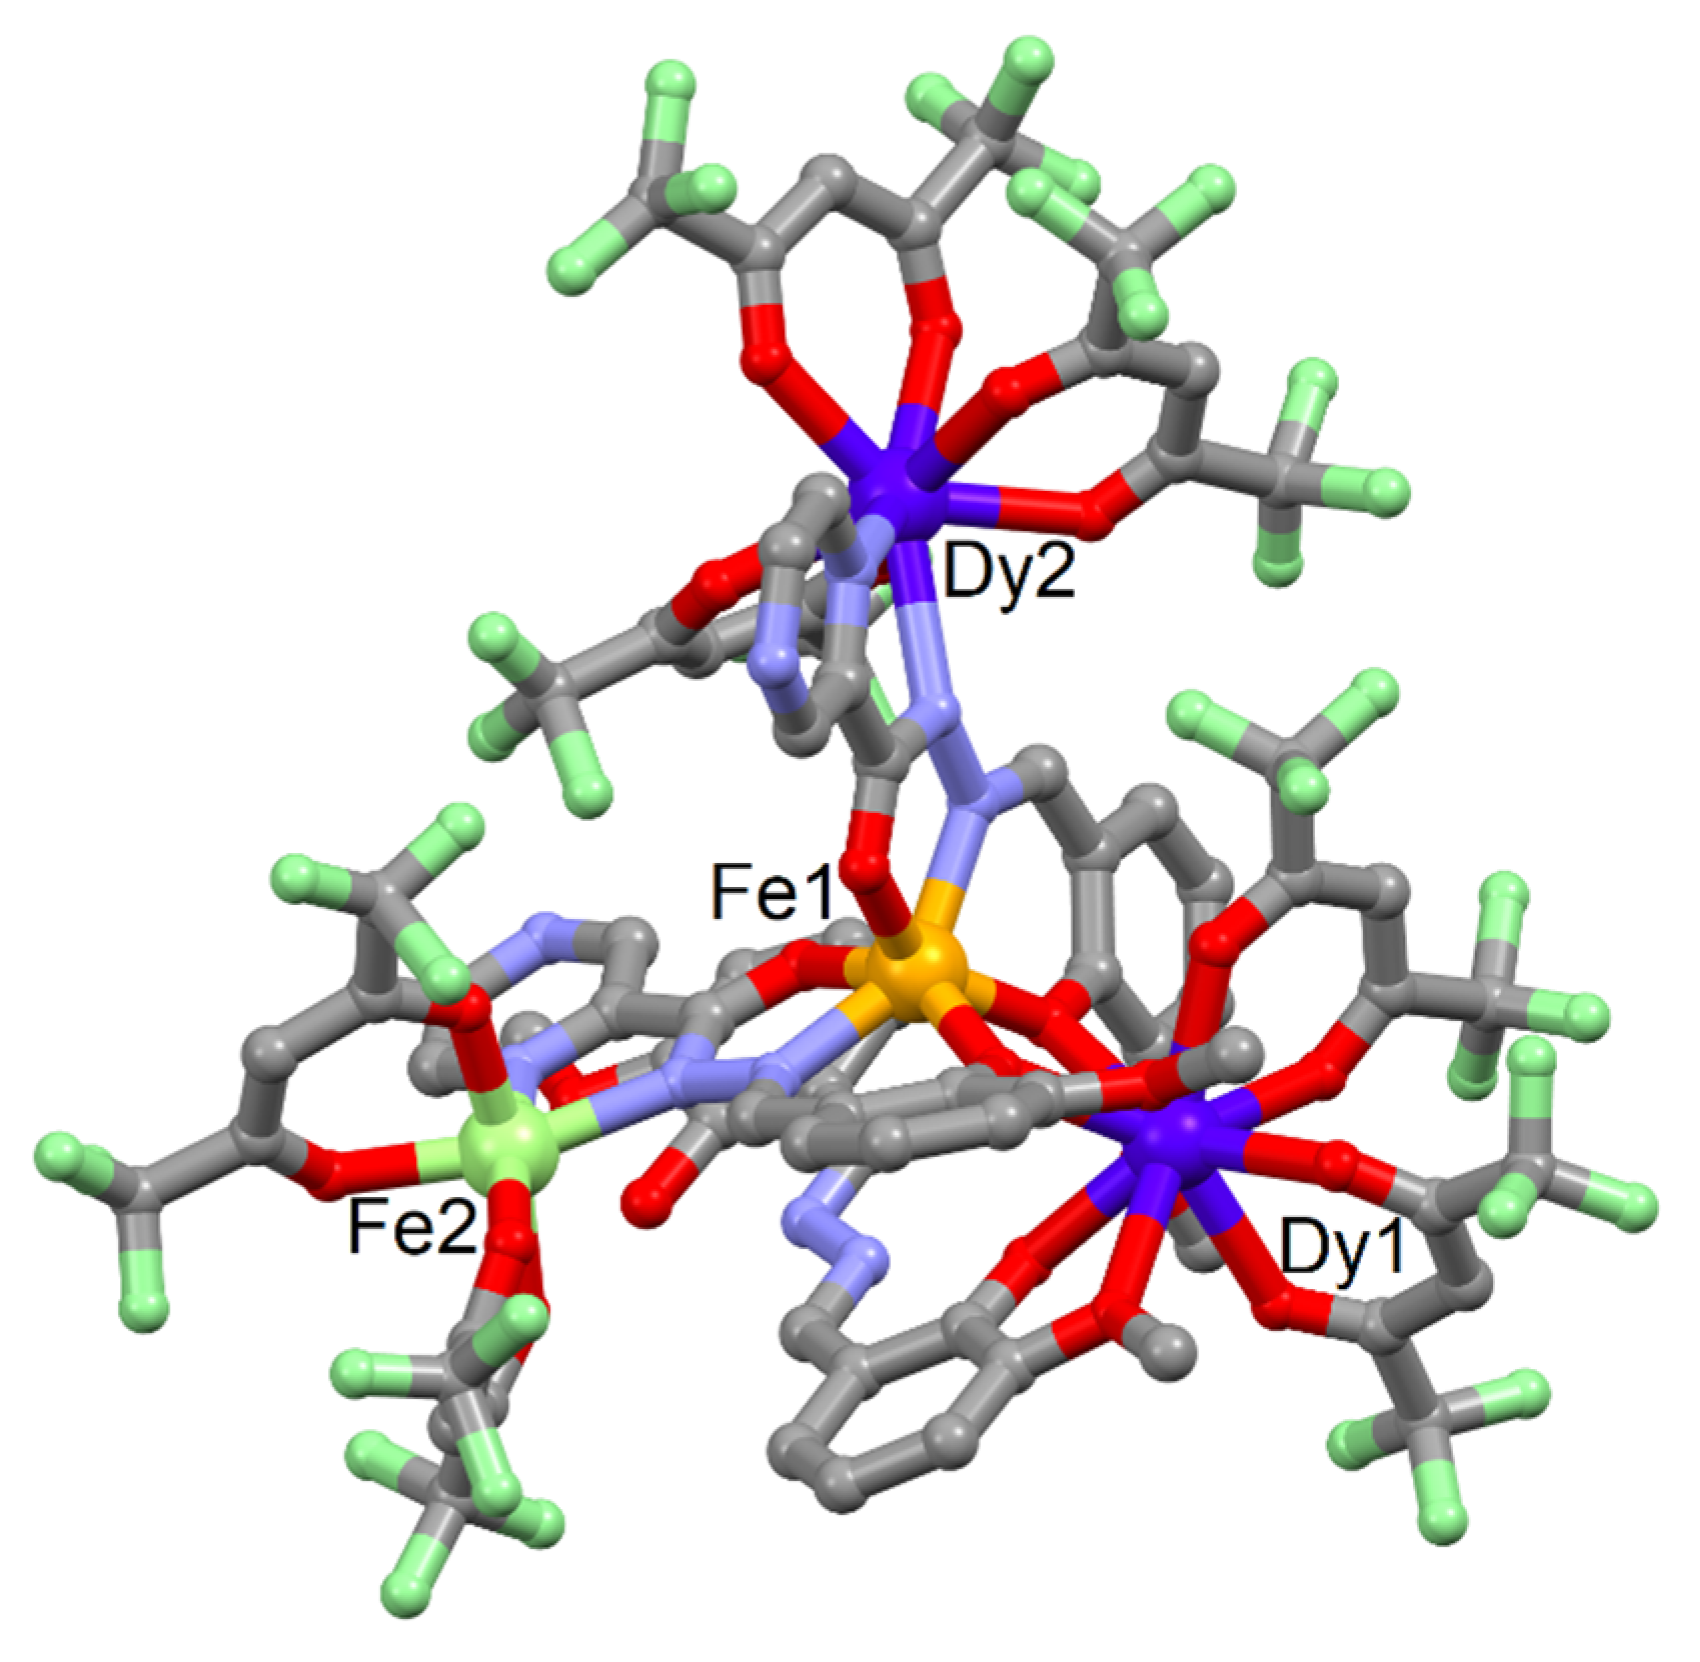
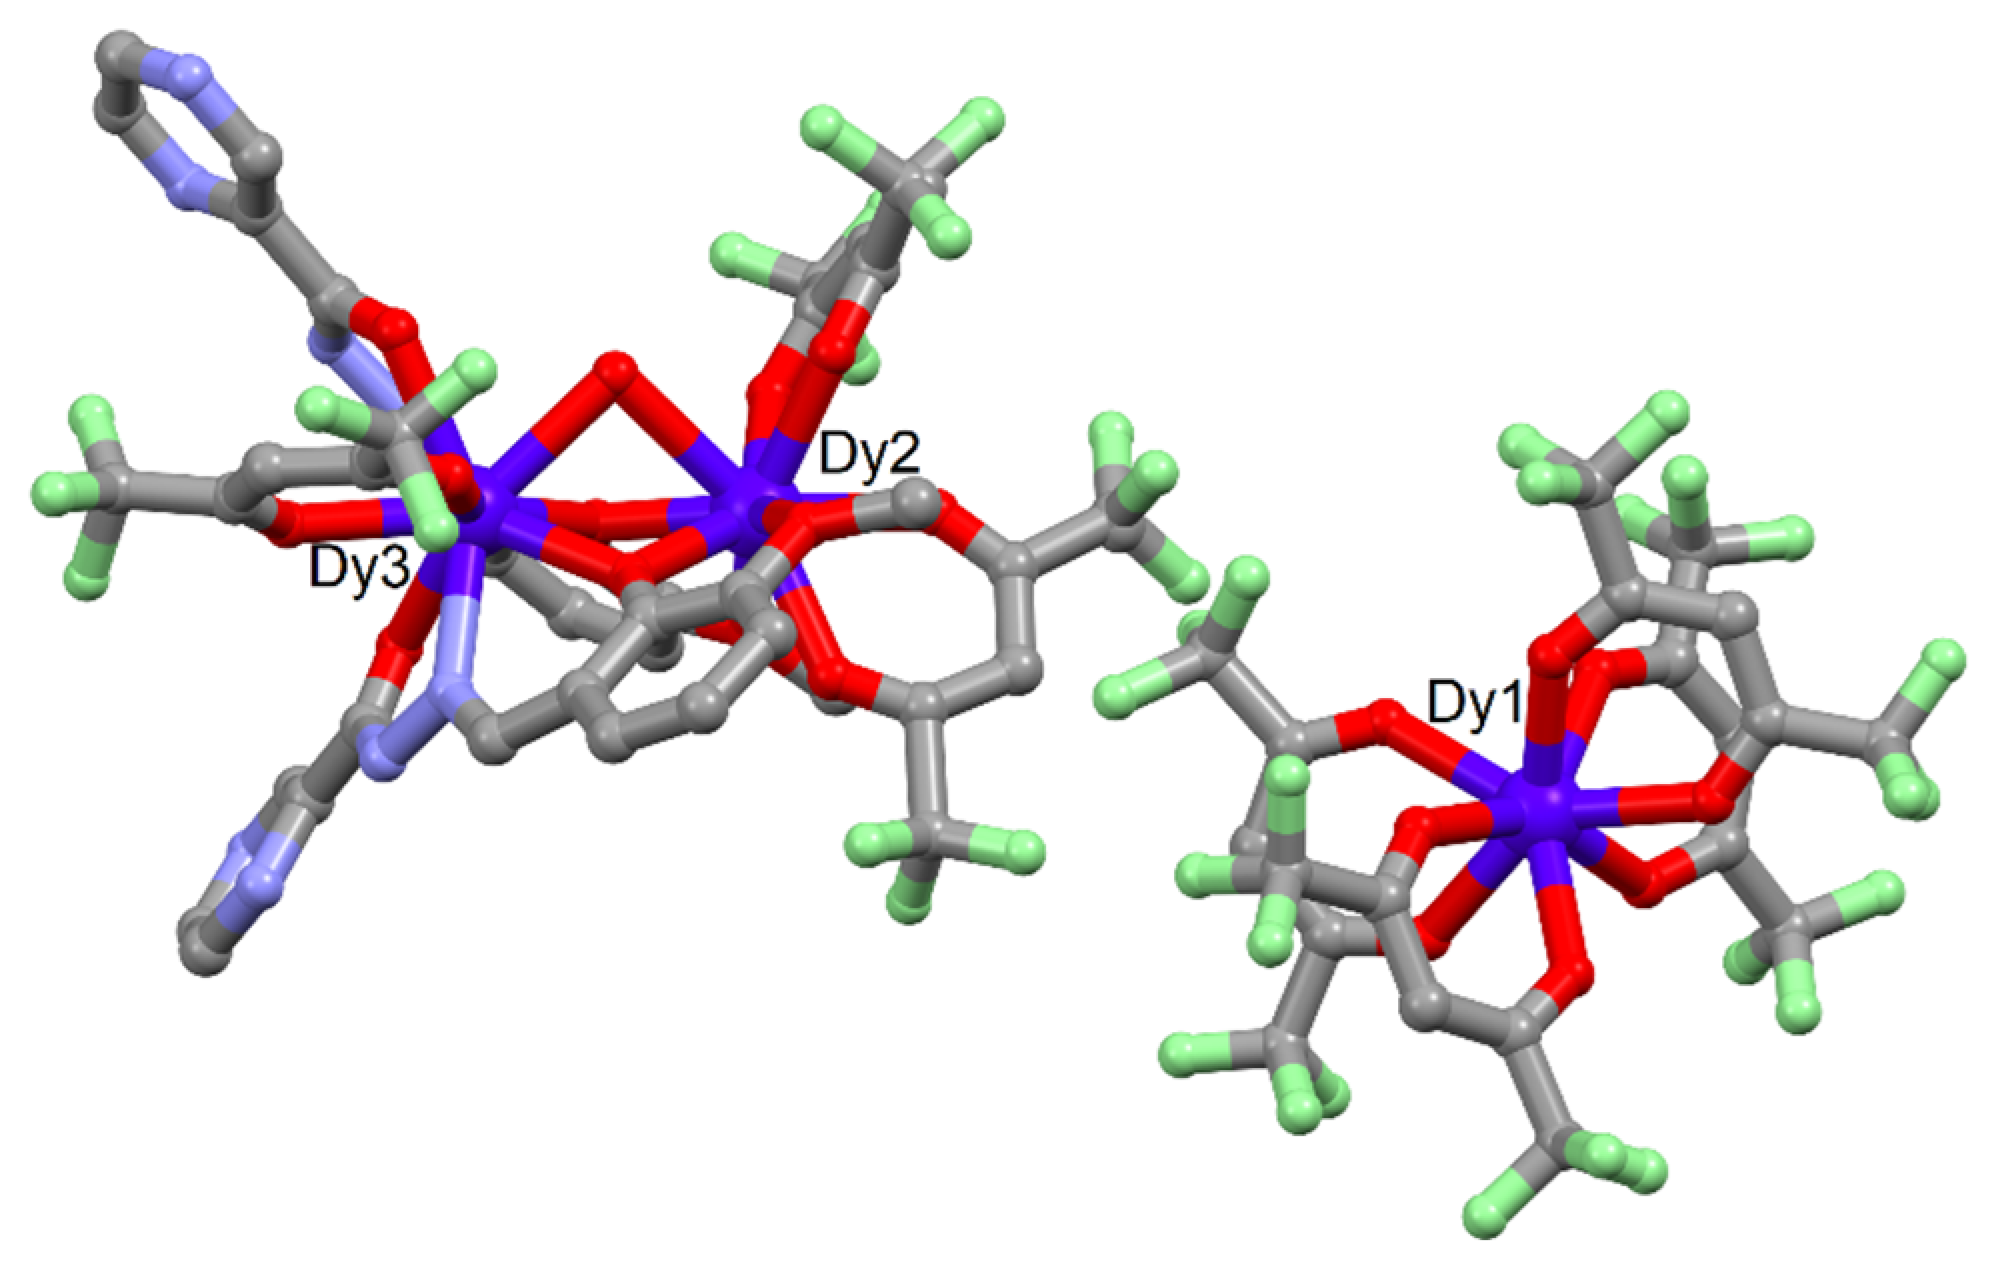
2.1. X-ray Structures

[Dy2(hfac)3(H2O)(Hopch)2]·[Dy(hfac)4] (1). 1 crystallizes in the monoclinic space group P21/n (N°14) (Figure 1, Supplementary Materials Figure S1, Table S1). The asymmetric unit is composed of one mono-cationic dinuclear complex, [Dy2(hfac)3(H2O)(Hopch)2]+, and one mono-anionic mononuclear complex, [Dy(hfac)4].
The Dy(III) center of the cation (Dy1) is coordinated with eight oxygen atoms coming from four hfac- ancillary ligands. The Dy-O bond lengths are similar and range from 2.335(13) to 2.373(12) Å. The two Dy2 and Dy3 of the dimeric cation are coordinated to two deprotonated keto forms (Hopch) (Scheme 1) of the ligand H2opch. Dy2 is linked to two Hopch ligands through the bischelating methoxyphenol moiety and its coordination sphere is filled by two hfac ancillary ligands and one bridging water molecule leading to a DyO9 surrounding. Furthermore, the Dy-O bond lengths range from 2.303(9) to 2.607(11) Å, and the Dy2-O distances involving a negatively charged oxygen atom are shorter (2.340 Å) than Dy2-O distances involving neutral oxygen atom (2.597 Å). The third Dy(III) (Dy3) is also coordinated to the two Hopch ligands through the trischelating coordination site [22] and its coordination sphere is filled with one hfac- ancillary ligand and the bridging water molecule leading to a DyN2O7 surrounding. The Dy3-X bond lengths range from 2.308(9) to 2.540(11) Å. As expected, both Dy3-O involving neutral oxygen atoms and Dy3-N distances are longer than Dy3-O involving negatively charged oxygen atoms. The intra-molecular Dy2···Dy3 distance is 3.652 Å. The crystal packing highlighted the formation of a H-bond network (Figure S1) between the bridging H2O and the pyrazine (O37w···N89 = 2.681 Å) and the amido groups and the hfac anions of the [Dy(hfac)4] fragment (O7···N62 = 3.320 Å, O5···N62 = 3.339 Å and O1···N82 = 3.361 Å). The shortest inter-molecular Dy···Dy distance was found between Dy1 and Dy3 (7.990 Å).
[FeDy3(hfac)8(H2O)2(opch)2] (2). 2 crystallized in the monoclinic space group C2/c (N°15) (Figure 2 and Figure S2, Table S1). The asymmetric unit is composed of one heterobimetallic 3d4f tetranuclear complex with the formula [FeDy3(hfac)8(H2O)2(opch)2].
The Fe(III) ion is coordinated to two ligands in their enol forms (opch2−) (Scheme 1) through the tris-chelating site leading to a FeO4N2 surrounding with average Fe-O and Fe-N bond lengths of 1.999(7) Å and 2.118(9) Å, respectively. The two Dy(III) Dy1 and Dy2 adopted the same coordination sphere. They are coordinated to the bis-chelating site of opch2− formed by the pyrazine and the hydrazone. The resulting DyO6N2 surrounding is obtained by the coordination of three hfac- ancillary ligands. The third Dy(III) center is coordinated to the phenol moiety already coordinated to the Fe(III). To assume the neutrality of the tetranuclear complex, only two hfac- ancillary ligands are coordinated to Dy3, while its coordination sphere is filled by two water molecules. Thus, the Dy3 adopted a DyO8 coordination sphere. The Dy-O distances are similar (2.351(8) Å) but shorter than the Dy-N distances (2.547(9) Å). Additionally, the shortest intramolecular Dy···Fe distance has been found between the two metal centers, which share the phenol oxygen atoms (3.542 Å), while the two other ones, Dy1···Fe (5.551 Å) and Dy2···Fe (5.576 Å), are longer because of the nature of the bridge. The crystal packing revealed the presence of hydrogen bond between the coordinated water and the pyrazine (O105w···N24 = 3.011 Å) (Figure S2). Moreover, the shortest inter-molecular Dy···Dy distance was found between the Dy2 (8.901 Å).
[Fe3Dy(hfac)6(opch)2(H2bmh)]·C6H14 (3C6H14. It crystallized in the triclinic space group P-1 (N°2) (Figure 3 and Figure S3, Table S1). The asymmetric unit is composed of one heterobimetallic 3d4f tetranuclear complex with the formula [Fe3Dy(hfac)6(opch)2(H2bmh)] and one disordered n-hexane molecule of crystallization.
As for compound 2, the Fe(III) is coordinated to two opch2− with a FeN2O4 surrounding. The two nitrogen bis-chelating coordination sites are occupied by two neutral [Fe(hfac)2] moieties, which are formed in situ during the coordination reaction. As expected, the Fe-O and Fe-N involving the Fe(II) ions (2.078(5) Å and 2.178(5) Å) are slightly longer than those involving the Fe(III) center (1.991(5) Å and 2.126(5) Å). Furthermore, a Dy(III) is coordinated to the two phenol groups and two hfac- anions. In addition, instead of two water molecules (for 2), a 1,2-Bis(2-hydroxy-3-methoxybenzylidene) hydrazine ligand (H2bmh) filled the coordination sphere of the Dy(III) ion, which adopts a DyO8 surrounding. Also, few intramolecular interactions take place, such as hydrogen bonds (O3···N2 = 2.709 Å and O1···O9 = 2.913 Å and O1···N1 = 2.552 Å) and π-π stacking between one of the opch2− ligand and the H2bmh ligand. The shortest intramolecular Dy···Fe distance (Dy1···Fe3 = 3.584 Å) is shorter than the one for Fe···Fe (Fe2···Fe3 = 5.135 Å). The crystal packing also revealed intermolecular π-π stacking between the H2bmh ligands leading to the formation of a pseudo-dimer composed of tetranuclear complexes (Figure S3). These units interact through F···F and H···F contacts, and the shortest intermolecular Dy···Dy distance is 11.034 Å.
[Fe2Dy2(hfac)7(opch)2(H2bmh)]·0.5C7H16 (40.5C7H16. It crystallized in the triclinic space group P-1 (N°2) (Figure 4 and Figure S4, Table S1). The asymmetric unit is composed of two heterobimetallic 3d4f tetranuclear complexes with the formula [Fe2Dy2(hfac)7(opch)2(H2bmh)] and one n-heptane molecule of crystallization. Complex 4 has some similitudes with 3. Indeed, the main difference is the coordination of one [Dy(hfac)3] unit for 4 instead of one [Fe(hfac)2] for 3. Based on the information from single crystal X-ray diffraction structures of 2 and 3, i.e., the oxidation state +III of the iron center coordinate to the trischelating site of the opch2− ligand, and to guarantee the electro-neutrality of the system, Fe1 and Fe2 centers have been associated to the +III and +II oxidation states, respectively. The crystal packing is not significantly affected by the same formation of pseudo-dimer of tetranuclear complexes (Figure S4). The shortest intermolecular Dy···Dy distance is also slightly shorter (9.495 Å) than for (3C6H14.

2.2. Magnetic Properties

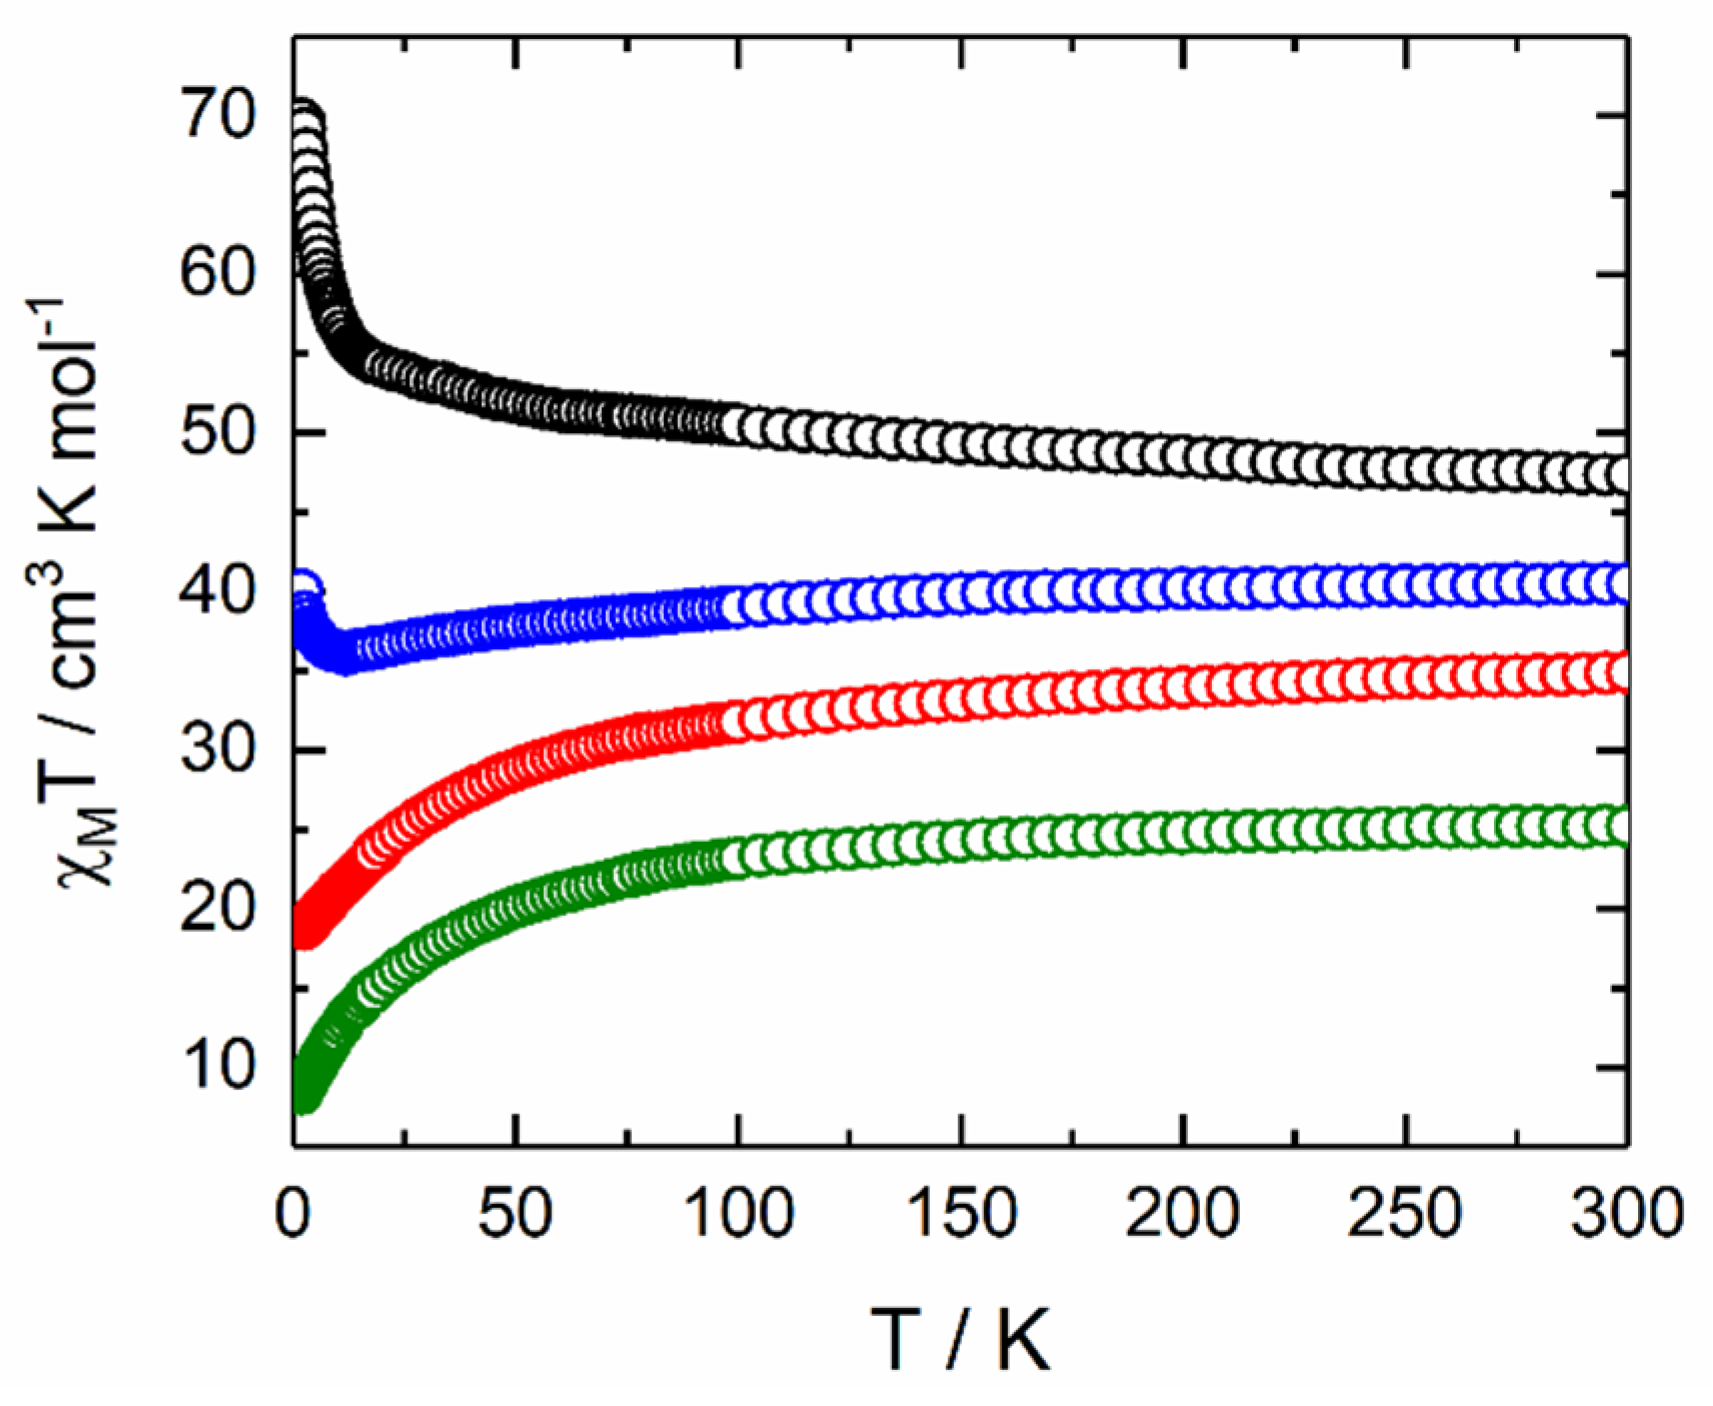
2.2.1. Static Magnetic Measurements

The temperature dependence of χMT for samples 14 is represented in Figure 5. The room temperature values are 40.49 cm3·K·mol−1, 47.33 cm3·K·mol−1, 25.15 cm3·K·mol−1 and 34.87 cm3·K·mol−1 for 14, respectively.
Such values are in agreement with expected values of 42.51 cm3·K·mol−1 (for three Dy(III) with a 6H15/2 ground state (GS) and gJ = 4/3), 46.89 cm3·K·mol−1 (for three Dy(III), 6H15/2 GS, gJ = 4/3 and one high spin state (HS) Fe(III)), 24.55 cm3·K·mol−1 (for one Dy(III), 6H15/2 GS, gJ = 4/3; one HS Fe(III) and two HS Fe(II)) and 35.72 cm3 K mol−1 (for two Dy(III), 6H15/2 GS, gJ = 4/3; one HS Fe(III) and one HS Fe(II)) [24,25]. In addition, upon cooling, χMT decreases monotonically down to 8.36 cm3·K·mol−1 and 18.74 cm3 K mol−1 at 2 K for 3 and 4, respectively. Such a decrease could be attributed to both thermal depopulation of the MJ states of the Dy(III) ion and antiferromagnetic interactions between the different spin carriers. For 1, the χMT slightly decreases until the temperature reaches 12 K due to the crystal field effect, while, for lower temperatures, the χMT slightly increases the sign of the ferromagnetic interaction. Finally, 2 displays a continuous increase at low temperatures, reaching the value of 69.79 cm3·K·mol−1, which indicates the presence of significant ferromagnetic interactions. Magnetization for 14 is depicted in Figure S5 with experimental values of 14.84 Nβ at 50 kOe, 22.33 Nβ at 70 kOe, 8.42 Nβ at 70 kOe and 9.42 Nβ at 50 kOe, respectively.

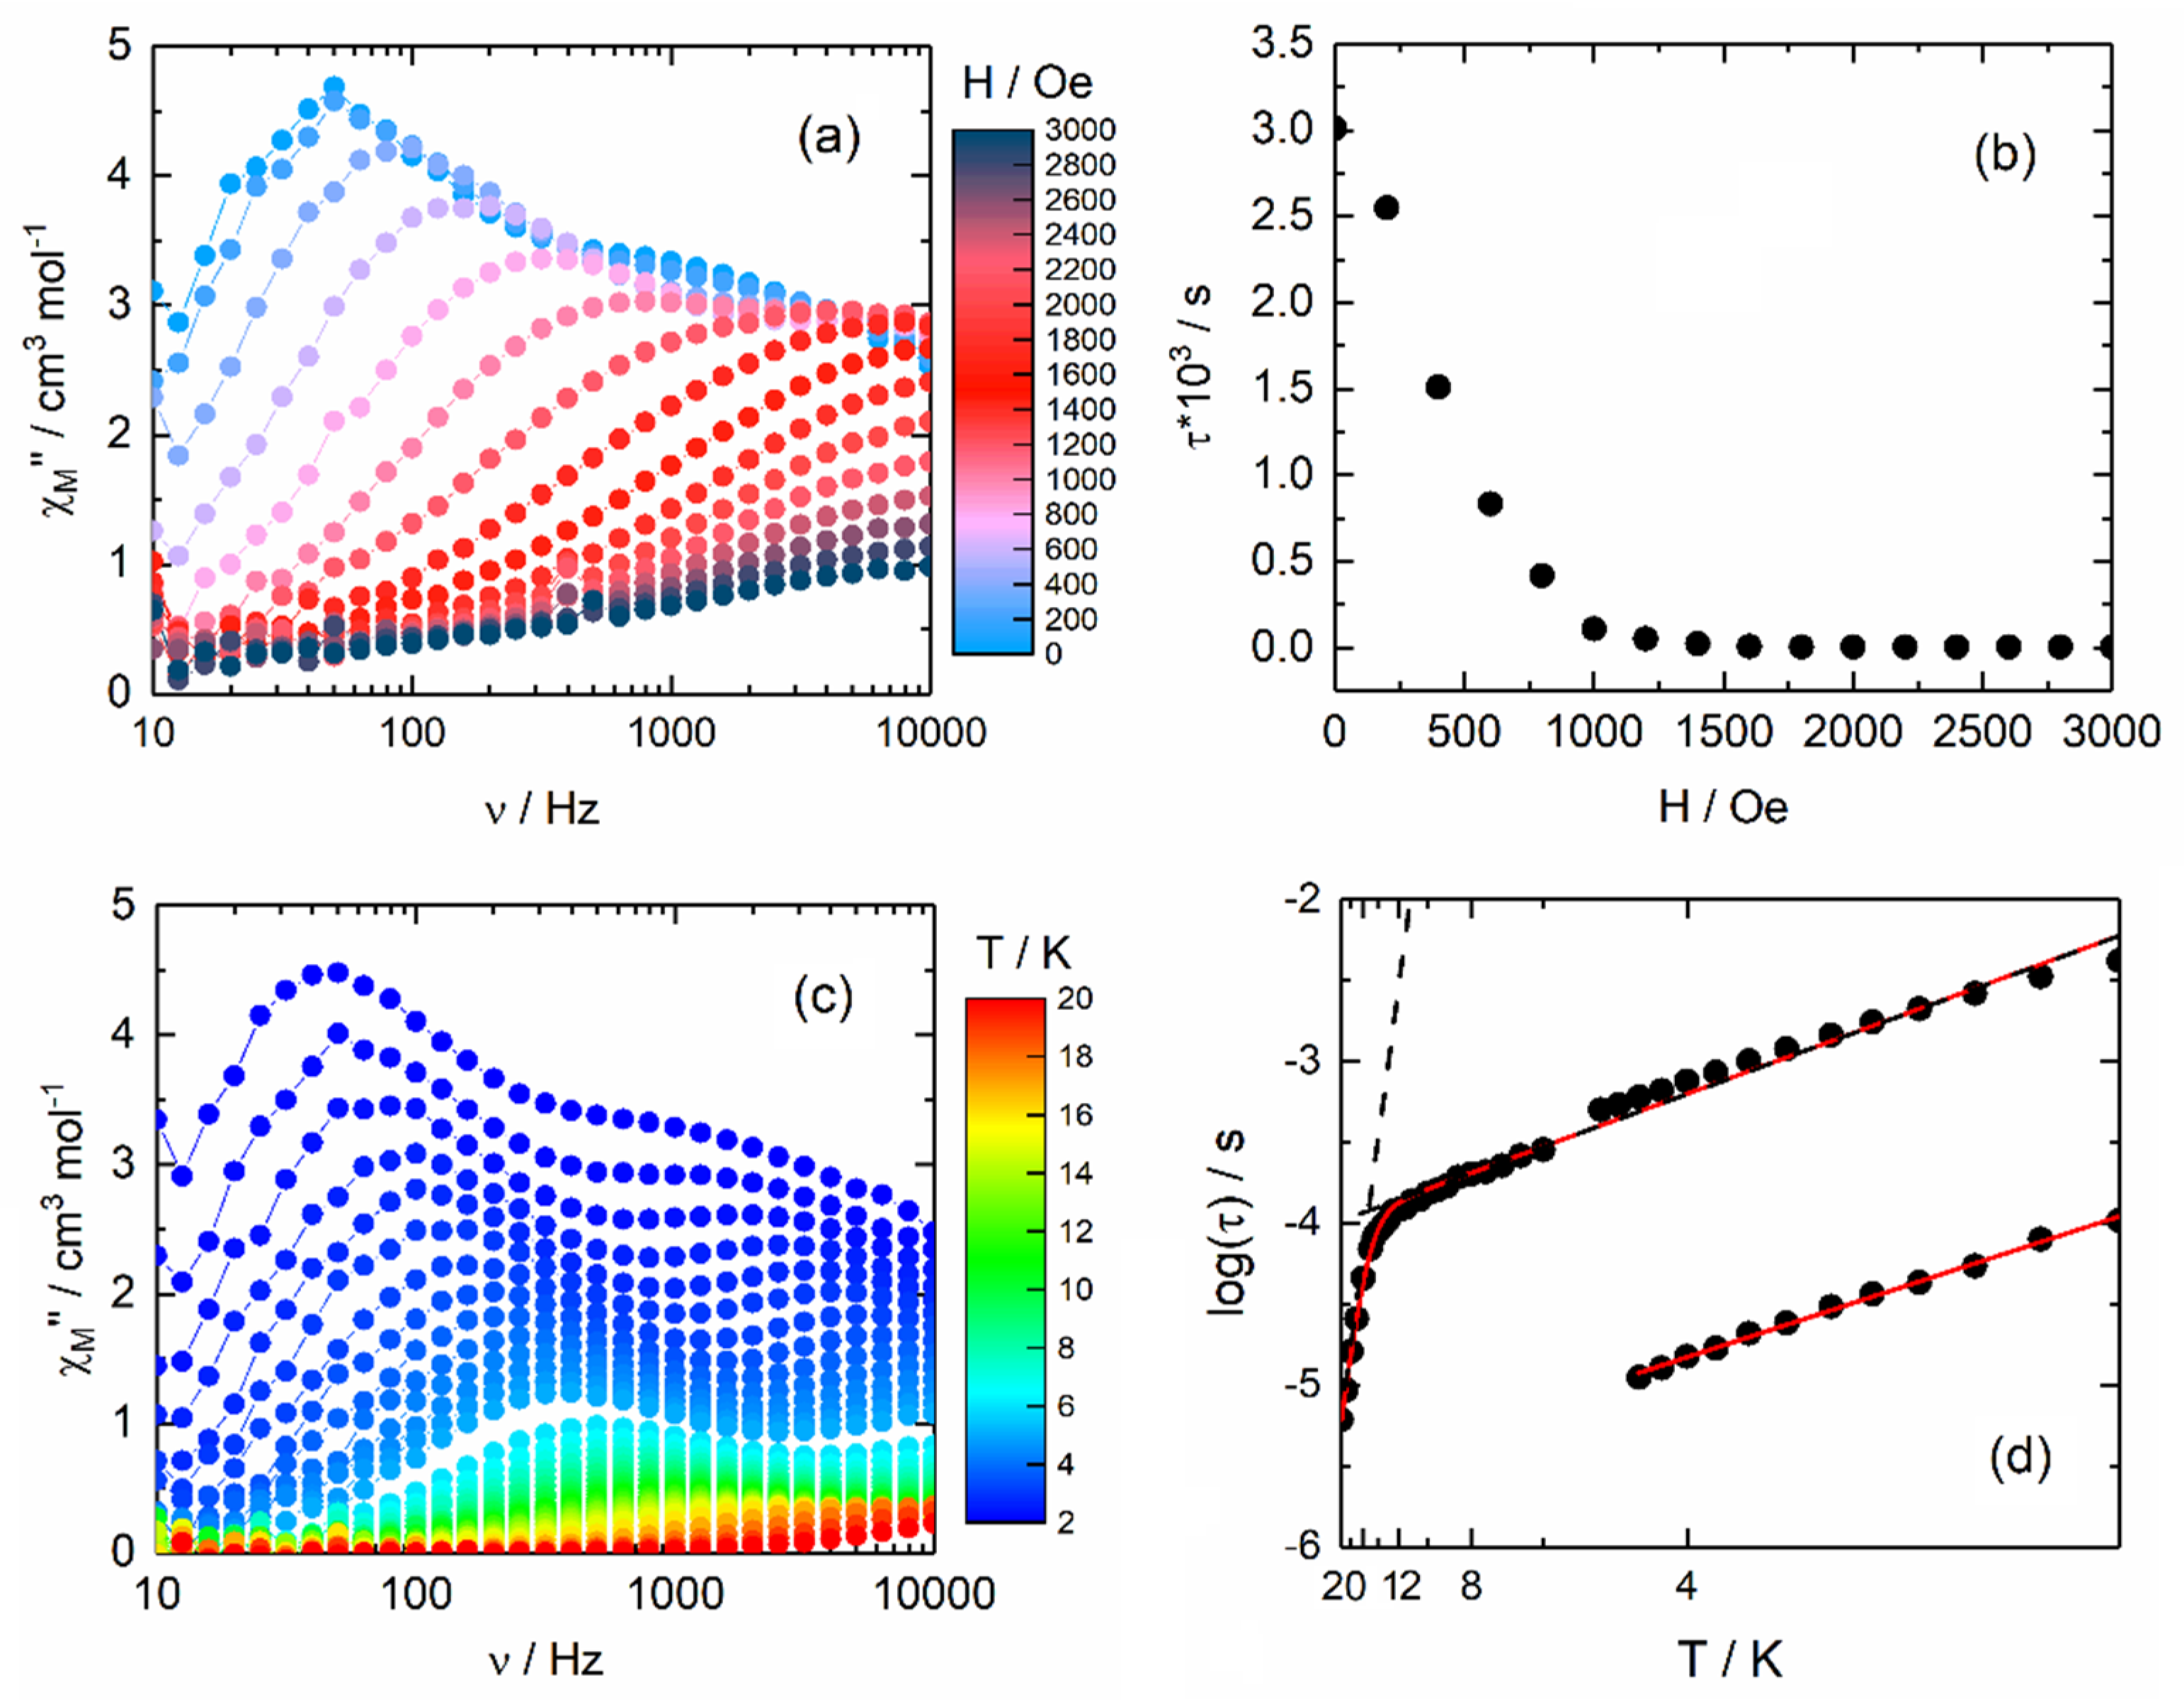
2.2.2. Dynamic Magnetic Measurements

The dynamic magnetic behavior was probed by measuring the in-phase (χM′) and out-of-phase (χM″) components of the ac susceptibility for compounds 14. Such measurements were carried out using immobilized selected and crunched single crystals. Moreover, in the 1 Hz–10 kHz frequency range, no out-of-phase signal of the magnetic susceptibility was detected in the zero and the applied magnetic fields for both compounds 3 and 4.
On the contrary, the two compounds 1 and 2 displayed a slow magnetic relaxation in the zero applied dc field (Figure 6a and Figure 7a). One of the possible explanations for the difference in magnetic behavior between 1 and 2 and 3 and 4 might be the lack of ferromagnetic interactions in 3 and 4. A frequency dependence of the magnetic susceptibility in the temperature range of 2–8 K in the 100 Hz–10 kHz frequency window of the oscillating field was also observed at zero dc magnetic field for 1 (Figure 6c and Figure S6). An extended Debye model was used to extract the relaxation time (τ) [26,27,28] (Table S2), fitting simultaneously the two in-phase (χM′) and out-of-phase (χM″) components of the magnetic susceptibility. Furthermore, the Argand plot confirms that the observed slow magnetic relaxation corresponds to more than 90% of the sample (Figure S7). The corresponding thermal variation of the log(τ) is depicted in Figure 6d and could be fitted using the following equation (Equation (1)) for which the Orbach contribution was neglected:
τ 1 = C T n R a m a n + τ 0 1 exp K T O r b a c h + τ T I 1 Q T M
The best-fitted curves are represented in Figure 6d for C = 246.2(74) Kn s−1 with n = 3.11(16) and τTI = 6.62(35) × 10−5 s, where C and n are constant parameters for the Raman relaxation process and τTI is the thermal independent relaxation time of the QTM. One could notice that the n constant parameter is lower than the expected n value for Kramers’ ions. Indeed, such a parameter value should be nine [29], but it is well known that, for molecular systems, lower values comprised between 2 and 7 could be found in the presence of both acoustic and optical phonons [30,31,32]. In order to enhance the magnetic performance of 1, the QTM could be cancelled by applying an external dc field [33]. Thus, the field dependence of the magnetic susceptibility is studied (Figure 6a,b and Figure S8) and the relaxation time is extracted using the extended Debye model (Table S3). The application of a small magnetic field (<1000 Oe) led to the increase of the magnetic relaxation time (τ) (Figure 6b) due to the cancelling of the QTM, while, for a higher magnetic field value, τ decreases due to the direct process activation. To keep a significant χM″ signal intensity, an 800 Oe value was selected. Under an applied field of H = 800 Oe, 1 highlighted a frequency dependence of the magnetization (Figure 6e and Figure S9). Both in-phase and out-of-phase signals of the magnetic susceptibility can be analyzed in the framework of the extended Debye model [26,27,28]. The temperature dependence of the relaxation time is plotted and depicted in Figure 6d (Table S4). At H = 800 Oe, it was determined by analyzing the normalized Argand (Figure S10) that more than 90% of the sample was involved in the slow magnetic relaxation. The thermal variation of the relaxation time could also be fitted considering a combination of Orbach and Raman processes. The best fit was obtained with τ0 = 1.50(16) × 10−7 s, Δ = 32.1(7) K and C = 496.3(26) Kn s−1 with n = 1.83(6), where τ0 and Δ are the relaxation time and the energy barrier of the Orbach relaxation process (Figure 6d). One could remark that the 800 Oe external applied dc field cancelled efficiently the QTM and both Raman processes in 0 (light blue dashed line) and 800 Oe (dark blue dashed line) are similar as expected since such a process is field independent. It is also worth noticing that the Orbach process might be involved in the zero applied dc field but is almost negligible compared to the Raman and QTM processes, making it difficult to determine the relevant parameters for it.
Moving on, 2 displayed a non-zero χM″ component sign of slow magnetic relaxation in a zero applied dc field at 2 K (Figure 7a). As soon as a dc field was applied, the maxima of the χM″(ν) curve shifted to a higher frequency, as attested by the τ vs. H plot (Figure 7b). The τ values of the latter plot were extracted by fitting only the LF contribution of the magnetic susceptibility. The acceleration of the relaxation time of the magnetization could be due to the suppression of the ferromagnetic interaction under the applied dc field [12,34] and/or the appearance of a direct process. Since the best magnetic performances for 2 are observed under a zero applied dc field, the magnetic investigation was carried out only in such conditions. The thermal dependence of the magnetic susceptibility in a zero applied field showed two contributions with different intensities (Figure 7c and Figure S12). Such behavior might be attributed to the two Dy(III) centers with different surroundings i.e., one Dy(III) in a O8 environment, while the two others adopted a O6N2 environment. Thus, an extended Debye model considering two τ (see Supporting Information) was used (Table S6) for 2. The temperature dependence of the relaxation time is plotted and depicted in Figure 7d for both low frequency (LF) and high frequency (HF) contributions.
The best fit of the thermal variation of the relaxation time for the HF contribution was obtained for an Orbach process only with τHF0 = 2.01(11) × 10−6 s and ΔHF = 8.0(2) K, while two Orbach processes were needed to fit the log(τ) vs. T plot for the LF contribution with τ10 = 6.63(32) × 10−5 s and Δ1 = 9.0(2) K, τ20 = 6.55(44) × 10−10 s and Δ2 = 184.4(12) K. The presence of two Orbach processes was already observed for a few SMMs involving Dy(III) in a N2O6 environment [35]. Moreover, such behavior was recently explained as a graphical problem for which the low temperature regime is close to a linear thermal dependence but, in fact, should correspond to a Raman process [36]. The absence of QTM in zero fields could also be attributed to the ferromagnetic interaction which has been identified in this complex.

3. Materials and Methods

3.1. Synthesis: General Procedures and Materials

The precursor Dy(hfac)3·2H2O (hfac = 1,1,1,5,5,5-hexafluoroacetonate anion), the 1,2-Bis(2-hydroxy-3-methoxybenzylidene) hydrazine (H2bmh) and ((E)-N′-(2-hyborxy-3-methoxybenzylidene)pyrazine-2-carbohydrazide) (H2opch) were synthesized following previously reported methods [19,20,37]. All other reagents were commercially available and used without further purification.

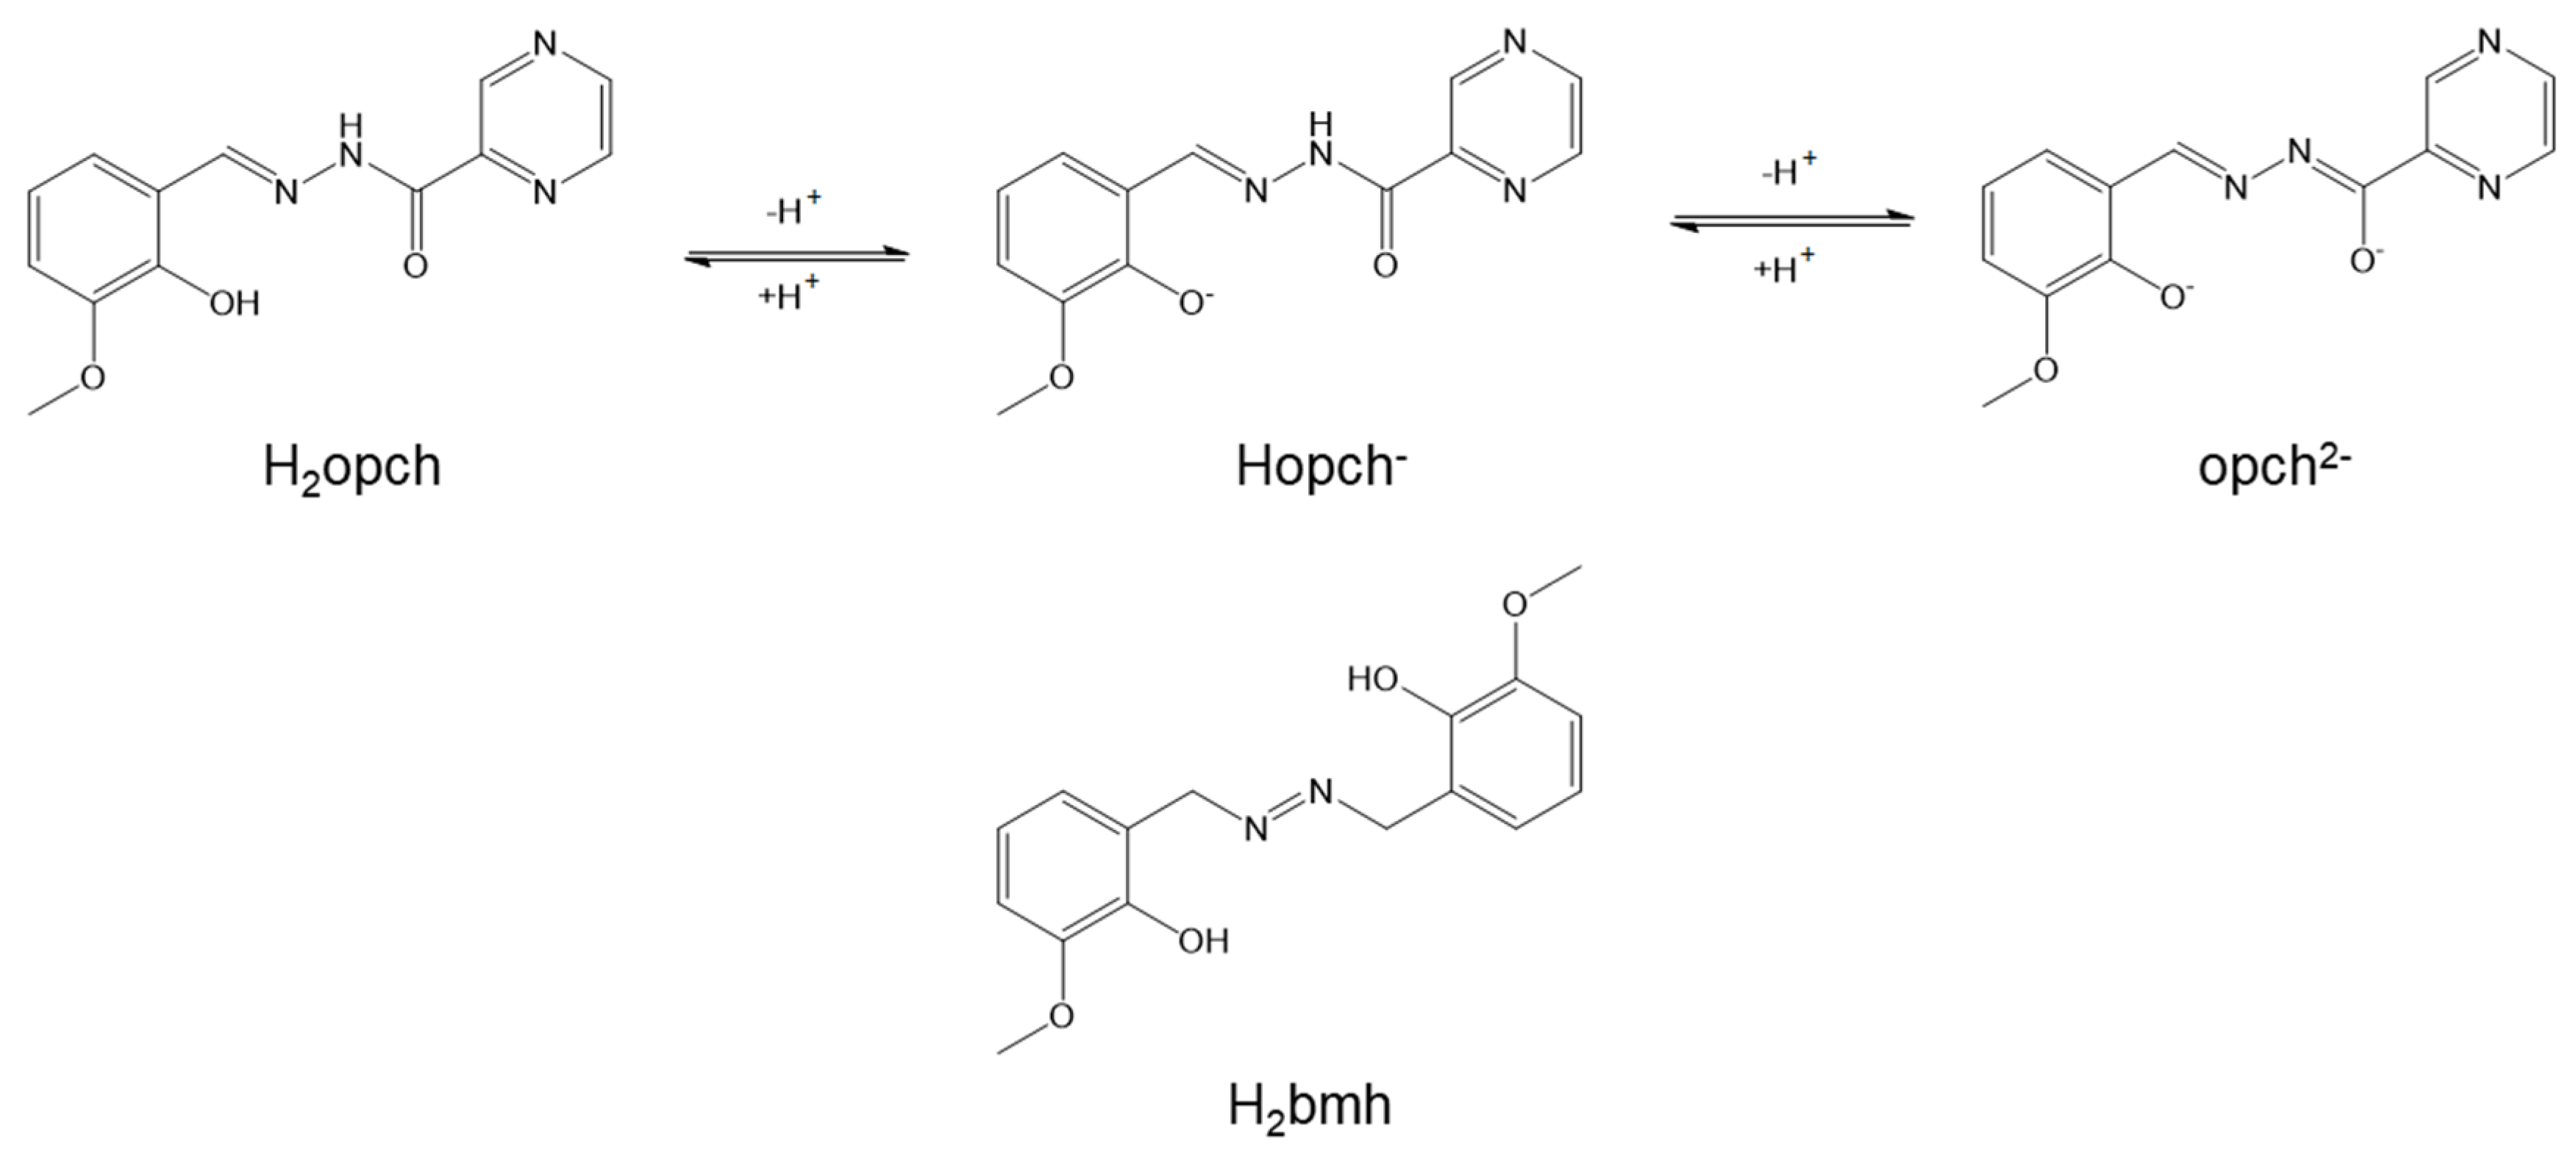
3.2. Synthesis of Complex [Dy2(hfac)3(H2O)(Hopch)2]·[Dy(hfac)4] (1)

To start, 82 mg of Dy(hfac)3·2H2O (0.1 mmol) and 27.1 mg of H2opch (0.1 mmol) were dissolved in 10 mL of CH2Cl2 and stirred at room temperature for 1 h. n-heptane was layered at room temperature in the dark. Slow diffusion leads to light yellow single crystals of (1), which are suitable for X-ray studies. The following measurements were reported: yield (determined from isolated single crystals) = 104.9 mg (42%). Anal. Calcd (%) for C61H31Dy3F42N8O21—C = 29.31, H = 1.24, N = 4.48; found—C = 29.09, H = 1.32, N = 4.41.

3.3. Synthesis of Complex [FeDy3(hfac)8(H2O)2(opch)2] (2)

For synthesis of complex 2, 27.1 mg of H2opch (0.1 mmol) and 19.9 mg of FeCl2·4H2O (0.01 mmol) were dissolved in 20 mL of CH3CN. The solution turned dark brown after the addition of the iron salt. Then, a solution of 10 mL of CH2Cl2 containing 82 mg of Dy(hfac)3·2H2O (0.1 mmol) was added. The reaction was stirred for 1 h at room temperature and solvents evaporated under vacuum. Subsequently, 15 mL of CH2Cl2 was added to the residue. After filtration, diffusion of n-heptane to the filtrate led to the formation of dark brown single crystals suitable for X-ray studies. The following measurements were reported: yield (determined from isolated single crystals) = 85.9 mg (31%). Anal. Calcd (%) for C66H28Dy3F48N8O24—C = 28.57, H = 1.01, N = 4.04; found—C = 28.77, H = 1.09, N = 4.01.

3.4. Synthesis of Complex [Fe3Dy(hfac)6(opch)2(H2bmh)]·C6H14 (3)·C6H14

For synthesis of complex 3, 27.1 mg of H2opch (0.1 mmol), 30 mg of H2bmh (0.1 mmol) and 82 mg of Dy(hfac)3·2H2O (0.1 mmol) were dissolved in 10 mL of CH2Cl2. Then, a solution of 10 mL of CH3OH containing 19.9 mg of FeCl2·4H2O (0.1 mmol) was added. The solution turned dark brown after the addition of the iron salt. The reaction was stirred for 1 h at room temperature and solvents evaporated under a vacuum. Following this, 15 mL of CH2Cl2 was added to the residue. After filtration, diffusion of n-hexane to the filtrate led to the formation of dark brown single crystals suitable for X-ray studies. The following measurements were reported: yield (determined from isolated single crystals) = 72.4 mg (29%). Anal. Calcd (%) for C72H41DyF36Fe3N10O22—C = 35.82, H = 1.70, N = 5.80; found—C = 35.89, H = 1.74, N = 5.88.

3.5. Synthesis of Complex [Fe2Dy2(hfac)7(opch)2(H2bmh)]·0.5C7H16 (4)·0.5C7H16

(4)·C7H16 was obtained from a protocol similar to (3)·C6H14, except that n-heptane was used instead of n-hexane for the crystallization process. The following measurements were reported: yield (determined from isolated single crystals) = 72.4 mg (21%). Anal. Calcd (%) for C77H42Dy2F42Fe2N10O24—C = 33.91, H = 1.54, N = 5.14; found—C = 33.80, H = 1.59, N = 5.18.

3.6. Crystallography

Single crystals of 1 and 2 were mounted on an APEXII Bruker-AXS diffractometer, while single crystals of 3 and 4 were mounted on an APEXIII D8 VENTURE Bruker-AXS diffractometer for data collection (MoKα radiation source, λ = 0.71073 Å) received from the Centre de Diffractométrie (CDIFX), Université de Rennes, France (Table S1). A direct method using the SHELXT program [38] and a refined step with a full matrix least-squares method on F2 using the SHELXL-14/7 program [39] were used to solve and refine the structures. For structures containing large solvent accessible voids in which residual peaks of diffraction were observed, a SQUEEZE procedure of PLATON [40] was performed. Bond lengths, angles and atomic coordinates are included in CIF files for complete crystal structure results. These files are deposited as Supporting Information. CCDC numbers are 2281070 for 1, 2281069 for 2, 2281071 for (3)·C6H14 and 2281072 for (4)·0.5C7H16.

3.7. Physical Measurements

The Centre Régional de Mesures Physiques de l’Ouest (Rennes) performed the elemental analyses of the compounds. The dc magnetic susceptibility measurements were performed on solid polycrystalline samples with a Quantum Design MPMS-XL SQUID magnetometer between 2 and 300 K in applied magnetic fields of 200 Oe, 2000 Oe and 10,000 Oe for the 2–20, 20–80 K and 80–300 K temperature ranges, respectively. The microcrystallites are immobilized in a pellet made with Teflon tape. Quantum Design PPMS magnetometers were used to measure the ac magnetic susceptibility for frequencies between 10 and 10 kHz. Finally, these measurements were all corrected for the diamagnetic contribution, as calculated with Pascal’s constants.

4. Conclusions

The ligand ((E)-N′-(2-hyborxy-3-methoxybenzylidene)pyrazine-2-carbohydrazide) (H2opch) was used to design an homometallic Dy(III) dinuclear complex, [Dy2(hfac)3(H2O)(Hopch)2]·[Dy(hfac)4] (1), and three heterobimetallic 3d4f complexes: [FeDy3(hfac)8(H2O)2(opch)2] (2), [Fe3Dy(hfac)6(opch)2(H2bmh)] (3) and [Fe2Dy2(hfac)7(opch)2(H2bmh)] (4). The four compounds have been characterized by single crystal X-ray diffraction. The combination of dc magnetic investigations with the single-crystal X-ray diffraction structures allowed the identification of both Fe(II) and Fe(III) centers in the heterobimetallic 3d4f complexes 3 and 4. The two compounds 1 and 2 displayed single-molecule magnet behavior in a zero applied dc field with magnetic relaxation occurring through thermally activated processes, such as Orbach and Raman. To end, our efforts to design heterobimetallic Fe(II/III)Dy(III) complexes with exciting magnetic properties, such as SMM and spin-crossover behavior, are in progress.

Supplementary Materials

The following supporting information can be downloaded at: https://www.mdpi.com/article/10.3390/molecules28176359/s1, Figure S1. Crystal packing of 1 highlighting the hydrogen bonds (dashed lines) between the cationic fragment [Dy2(hfac)3(H2O)(Hopch)2]+ and anionic [Dy(hfac)4] moieties. Figure S2. Crystal packing of 2 highlighting the hydrogen bonds between the pyrazine ring and coordinated water molecules of the neighboring complex. Figure S3. Crystal packing of 3 highlighting both intramolecular π-π stacking between the opch2− and H2bmh ligands and intermolecular π-π stacking between the H2bmh ligands. Figure S4. Crystal packing of 4 highlighting both intramolecular π-π stacking between the opch2− and H2bmh ligands and intermolecular π-π stacking between the H2bmh ligands. Figure S5. Field dependence of the magnetization at 2 K for 1 (blue), 2 (black), 3 (green) and 4 (red). Figure S6. Frequency dependence of the in-phase component of the magnetic susceptibility under zero applied magnetic field between 2 and 8 K for 1. Figure S7. Normalized Cole–Cole plot for 1 at several temperatures between 2 and 7 K in zero applied magnetic field. Black lines are the best-fitted curves. Figure S8. In-phase component of the ac magnetic susceptibility for 1 at 2 K under a DC magnetic field from 0 to 3000 Oe. Figure S9. Frequency dependence of the in-phase component of the magnetic susceptibility under an applied magnetic field of 800 Oe between 2 and 8 K for 1. Figure S10. Normalized Cole–Cole plot for 1 at several temperatures between 2 and 7 K under an applied magnetic field of 800 Oe. Black lines are the best-fitted curves. Figure S11. In-phase component of the ac magnetic susceptibility for 2 at 2 K under a DC magnetic field from 0 to 3000 Oe. Figure S12. Frequency dependence of the in-phase component of the magnetic susceptibility in zero applied magnetic fields between 2 and 20 K for 2. Table S1: Summary of X-ray crystallographic data for 1, 2, (3)·C6H14 and (4)·0.5C7H16. Table S2: Best-fitted parameters (χT, χS, τ and α) with the extended Debye model for compound 1 at 0 Oe in the temperature range of 2–7 K. Table S3: Best-fitted parameters (χT, χS, τ and α) with the extended Debye model for compound 1 at 2 K in the magnetic field range of 0–3000 Oe. Table S4. Best-fitted parameters (χT, χS, τ and α) with the extended Debye model for compound 1 at 800 Oe in the temperature range of 2–7 K. Table S5. Best-fitted parameters (χT, χS, τ and α) with the extended Debye model for compound 1 at 2 K in the magnetic field range of 0–3000 Oe. Table S6. Best-fitted parameters (χT,1, χS,1, τ1, α1), (χT,2, χS,2, τ2 and α2) with the extended Debye model for compound 2 at 0 Oe in the temperature range of 2–20 K for LF contribution and 2–5 K for the HF.

Author Contributions

B.L. performed the organic syntheses, the coordination chemistry and crystallizations; V.D. and M.C. realized the single crystal X-ray diffraction experiments and structure refinements; T.G. performed the magnetic measurements; F.P. conceived and designed the experiments, analyzed the magnetic measurements and wrote the article. All authors have read and agreed to the published version of the manuscript.

Funding

This work was supported by Rennes Métropole, CNRS, Université de Rennes, and the European Commission through the ERC-CoG 725184 MULTIPROSMM (project n. 725184).

Institutional Review Board Statement

Not applicable.

Informed Consent Statement

Not applicable.

Data Availability Statement

Data are available from the authors.

Conflicts of Interest

The authors declare no conflict of interest. The funding sponsors had no role in the design of the study; in the collection, analyses, or interpretation of data; in the writing of the manuscript, and in the decision to publish the results.

Sample Availability

Samples of the compounds are not available from the authors.

References

  1. Sessoli, R.; Gatteschi, D.; Caneschi, A.; Novak, M.A. Magnetic bistability in a metal-ion cluster. Nature 1993, 365, 141–143. [Google Scholar] [CrossRef]
  2. Ishikawa, N.; Sugita, M.; Ishikawa, T.; Koshihara, S.; Kaizu, Y. Lanthanide Double-Decker Complexes Functioning as Magnets at the Single-Molecular Level. J. Am. Chem. Soc. 2003, 125, 8694–8695. [Google Scholar] [CrossRef] [PubMed]
  3. Mannini, M.; Pineider, F.; Sainctavit, P.; Danieli, C.; Otero, E.; Sciancalepore, C.; Talarico, A.M.; Arrio, M.-A.; Cornia, A.; Gatteschi, D.; et al. Magnetic memory of a single-molecule quantum magnet wired to a gold surface. Nat. Mater. 2009, 8, 194–197. [Google Scholar] [CrossRef] [PubMed]
  4. Rinehart, J.D.; Fang, M.; Evans, W.K.; Long, J.R. Strong exchange and magnetic blocking in N23−-radical-bridged lanthanide complexes. Nat. Chem. 2011, 3, 538–542. [Google Scholar] [CrossRef]
  5. Demir, S.; Zadrozny, J.M.; Nippe, M.; Long, J.R. Exchange Coupling and Magnetic Blocking in Bipyrimidyl Radical-Bridged Dilanthanide Complexes. J. Am. Chem. Soc. 2012, 134, 18546–18549. [Google Scholar] [CrossRef] [PubMed]
  6. Chilton, N.F.; Goodwin, C.A.P.; Mills, D.P.; Winpenny, R.E.P. The first near-linear bis(amide) f-block complex: A blueprint for a high temperature single molecule magnet. Chem. Commun. 2015, 51, 101–103. [Google Scholar] [CrossRef] [PubMed]
  7. Randall McClain, K.; Gould, C.A.; Chakarawet, K.; Teat, S.J.; Groshens, T.J.; Long, J.R.; Harvey, B.G. High-temperature magnetic blocking and magneto-structural correlations in a series of dysprosium(III) metallocenium single-molecule magnets. Chem. Sci. 2018, 9, 8492–8503. [Google Scholar] [CrossRef]
  8. Goodwin, C.A.P.; Ortu, F.; Reta, D.; Chilton, N.F.; Mills, D.P. Molecular magnetic hysteresis at 60 kelvin in dysprocenium. Nature 2017, 548, 439–442. [Google Scholar] [CrossRef]
  9. Vincent, A.H.; Whyatt, Y.L.; Chilton, N.F.; Long, J.R. Strong Axiality in a Dysprosium(III) Bis(borolide) Complex Leads to Magnetic Blocking at 65 K. J. Am. Chem. Soc. 2023, 145, 1572–1579. [Google Scholar] [CrossRef]
  10. Guo, F.S.; Day, B.M.; Chen, Y.C.; Tong, M.L.; Mansikkamäki, A.; Layfield, R. Magnetic hysteresis up to 80 kelvin in a dysprosium metallocene single-molecule magnet. Science 2018, 362, 1400–1403. [Google Scholar] [CrossRef]
  11. Gould, C.A.; McClain, K.R.; Reta, D.; Kragskow, J.G.C.; Marchiori, D.A.; Lachman, E.; Choi, E.-S.; Analytis, J.G.; Britt, R.D.; Chilton, N.F.; et al. Ultrahard magnetism from mixed-valence dilanthanide complexes with metal-metal bonding. Science 2022, 375, 198–202. [Google Scholar] [CrossRef] [PubMed]
  12. Maity, S.; Mondal, A.; Konar, S.; Ghosh, A. The role of 3d−4f exchange interaction in SMM behaviour and magnetic refrigeration of carbonato bridged CuII2LnIII2 (Ln = Dy, Tb and Gd) complexes of an unsymmetrical N2O4 donor ligand. Dalton Trans. 2019, 48, 15170–15183. [Google Scholar] [CrossRef] [PubMed]
  13. Ferbinteanu, M.; Kajiwara, T.; Choi, K.-Y.; Nojiri, H.; Nakamoto, A.; Kojima, N.; Cimpoesu, F.; Fujimura, Y.; Takaishi, S.; Yamashita, M. A Binuclear Fe(III)Dy(III) Single Molecule Magnet. Quantum Effects and Models. J. Am. Chem. Soc. 2006, 128, 9008–9009. [Google Scholar] [CrossRef]
  14. Chen, S.; Mereacre, V.; Anson, C.E.; Powell, A.K. A single molecule magnet to single molecule magnet transformation via a solvothermal process: Fe4Dy2 → Fe6Dy3. Dalton Trans. 2016, 45, 98–106. [Google Scholar] [CrossRef]
  15. Liu, J.-L.; Wu, J.-Y.; Chen, Y.-C.; Mereacre, V.; Powell, A.K.; Ungur, L.; Chibotaru, L.F.; Chen, X.-M.; Tong, M.-L. A Heterometallic FeII-DyIII Single-Molecule Magnet with a record Anisotropy Barrier. Angew. Chem. Int. Ed. 2014, 53, 12966–12970. [Google Scholar] [CrossRef]
  16. Chen, W.-B.; Chen, Y.-C.; Huang, G.-Z.; Liu, J.-L.; Jia, J.-H.; Tong, M.-L. Cyclic OFF/Part/ON switching of single-molecule magnet behaviours via multistep single-crystal-to-crystal transformation between discrete Fe(II)-Dy(III) complexes. Chem. Commun. 2018, 54, 10886–10889. [Google Scholar] [CrossRef]
  17. Liu, Y.; Chen, Y.-C.; Liu, J.; Chen, W.-B.; Huang, G.-Z.; Wu, S.-G.; Wang, J.; Liu, J.-L.; Tong, M.-L. Cyanometallate-Bridged Didysprosium Single-Molecule Magnets Constructed with Single-Ion Magnet Building Block. Inorg. Chem. 2020, 59, 687–694. [Google Scholar] [CrossRef] [PubMed]
  18. Peng, Y.; Kaemmerer, H.; Powell, A.K. From the {FeIII2Ln2} Butterfly’s Perspective: The Magnetic Benefits and Challenges of Cooperativity within 3d-4f Based Coordination Clusters. Chem. Eur. J. 2021, 27, 15044–15066. [Google Scholar] [CrossRef]
  19. Lin, P.-H.; Burchell, T.J.; Ungur, L.; Chibotaru, L.F.; Wernsdorfer, W.; Murugesu, M. A Polynuclear Lanthanide Single-Molecule Magnet with a record Anisotropic Barrier. Angew. Chem. Int. Ed. 2009, 48, 9489–9492. [Google Scholar] [CrossRef]
  20. Tian, H.; Zhao, L.; Guo, Y.-N.; Guo, Y.; Tang, J.; Liu, Z. Quadruple-CO32− bridged octanuclear dysprosium(III) compound showing single-molecule magnet behavior. Chem. Commun. 2012, 48, 708–710. [Google Scholar] [CrossRef]
  21. Tian, H.; Wang, M.; Zhao, L.; Guo, Y.-N.; Guo, Y.; Tang, J.; Liu, Z. A Discrete Dysprosium Trigonal Prism Showing Single-Molecule Magnet Behaviour. Chem. Eur. J. 2012, 18, 442–445. [Google Scholar] [CrossRef]
  22. Tian, H.; Zhao, L.; Lin, H.; Tang, J.; Li, G. Butterfly-Shaped Pentanuclear Dysprosium Single-Molecule Magnets. Chem. Eur. J. 2013, 19, 13235–13241. [Google Scholar] [CrossRef] [PubMed]
  23. Busch, R.; Carter, A.B.; Konidaris, K.F.; Kühne, I.A.; Gonzalez, R.; Anson, C.E.; Powell, A.K. The first Use of a ReX5 Synthon to Modulate FeIII Spin Crossover via Supramolecular Halogen⋅⋅⋅Halogen Interactions. Chem. Eur. J. 2020, 26, 11835–11840. [Google Scholar] [CrossRef] [PubMed]
  24. Benelli, C.; Gatteschi, D. Introduction to Molecular Magnetism: From Transition Metals to Lanthanides; Wiley-VCH Verlag GmbH & Co. KGaA: Weinheim, Germany, 2015. [Google Scholar]
  25. Kahn, O. Molecular Magnetism; VCH: Weinhem, Germany, 1993. [Google Scholar]
  26. Cole, K.S.; Cole, R.H. Dispersion and absorption in dielectrics I. Alternating current characteristics. J. Chem. Phys. 1941, 9, 341–351. [Google Scholar] [CrossRef]
  27. Orbach, R. Spin-lattice relaxation in rare-earth salts. Proc. R. Soc. Lond. A Math. Phys. Eng. Sci. 1961, 264, 458–484. [Google Scholar]
  28. Orbach, R. On the theory of spin-lattice relaxation in paramagnetic salts. Proc. Phys. Soc. 1961, 77, 821–826. [Google Scholar] [CrossRef]
  29. Dekker, C.; Arts, A.F.M.; de Wijn, H.W.; van Duyneveldt, A.J.; Mydosh, J.A. Activated dynamics in a two-dimensional Ising spin glass: Rb2Cu1−xCoxF4. Phys. Rev. B Condens. Matter Mater. Phys. 1989, 40, 11243–11251. [Google Scholar] [CrossRef]
  30. Tang, J.; Zhang, P. Lanthanide Single Molecule Magnets; Springer: Berlin, Germany, 2015. [Google Scholar]
  31. Evans, P.; Reta, D.; Whitehead, G.F.S.; Chilton, N.F.; Mills, D.P. Bis-Monophospholyl Dysprosium Cation Showing Magnetic Hysteresis at 48 K. J. Am. Chem. Soc. 2019, 141, 19935–19940. [Google Scholar] [CrossRef]
  32. Reta, D.; Chilton, N.F. Uncertainty estimates for magnetic relaxation times and magnetic relaxation parameters. Phys. Chem. Chem. Phys. 2019, 21, 23567–23575. [Google Scholar] [CrossRef]
  33. Poneti, G.; Bernot, K.; Bogani, L.; Caneschi, A.; Sessoli, R.; Wernsdorfer, W.; Gatteschi, D. A rational approach to the modulation of the dynamics of the magnetisation in a dysprosium-nitronyl-nitroxide radical complex. Chem. Commun. 2007, 18, 1807–1809. [Google Scholar] [CrossRef]
  34. Yi, X.; Bernot, K.; Cador, O.; Luzon, J.; Calvez, G.; Daiguebonne, C.; Guillou, O. Influence of ferromagnetic connection of Ising-type DyIII-based single ion magnets on their magnetic slow relaxation. Dalton Trans. 2013, 42, 6728–6731. [Google Scholar] [CrossRef] [PubMed]
  35. Ou-Yang, J.-K.; Saleh, N.; Fernandez Garcia, G.; Norel, L.; Pointillart, F.; Guizouarn, T.; Cador, O.; Totti, F.; Ouahab, L.; Crassous, J.; et al. Improved slow magnetic relaxation in optically pure helicene-based DyIII single molecule magnets. Chem. Commun. 2016, 52, 14474–14477. [Google Scholar] [CrossRef] [PubMed]
  36. Briganti, M.; Santanni, F.; Tesi, L.; Totti, F.; Sessoli, R. A Complete Ab Initio View of Orbach and Raman Spin-Lattice Relaxation in a Dysprosium Coordination Compound. J. Am. Chem. Soc. 2021, 143, 13633–13645. [Google Scholar] [CrossRef] [PubMed]
  37. Richardson, M.F.; Wagner, W.F.; Sands, D.E. Rare-earth trishexafluoroacetylacetonates and related compounds. J. Inorg. Nucl. Chem. 1968, 30, 1275–1289. [Google Scholar] [CrossRef]
  38. Sheldrick, G.L. SHELXT—Integrated space-group and crystal-structure determination. Acta Crystallogr. Sect. A Found. Adv. 2015, 71, 3–8. [Google Scholar] [CrossRef] [PubMed]
  39. Sheldrick, G.M. Crystal structure refinement with SHELXL. Acta Crystallogr. Sect. C Struct. Chem. 2015, 71, 3–8. [Google Scholar] [CrossRef]
  40. Spek, A.L. Single-crystal structure validation with the program PLATON. J. Appl. Crystallogr. 2003, 36, 7–13. [Google Scholar] [CrossRef]
Scheme 1. Molecular structures of the H2opch, Hopch, opch2− and H2bmh ligands.
Molecules 28 06359 sch001
Figure 1. Experimental molecular structure of 1. Hydrogen atoms are omitted for clarity. Code color: grey, C; blue, N; green, F; red, oxygen; dark blue, dysprosium.
Molecules 28 06359 g001
Figure 2. Experimental molecular structure of 2. Hydrogen atoms are omitted for clarity. Code color: grey, C; blue, N; green, F; red, oxygen; orange, iron; dark blue, dysprosium.
Molecules 28 06359 g002
Figure 3. Experimental molecular structure of (3) C6H14. Hydrogen atoms and n-hexane molecules are omitted for clarity. Code color: grey, C; blue, N; green, F; red, oxygen; orange, trivalent iron; light green, divalent iron; dark blue, dysprosium.
Molecules 28 06359 g003
Figure 4. Experimental molecular structure of (4) 0.5C7H16. Hydrogen atoms and n-hexane molecules are omitted for clarity. Code color: grey, C; blue, N; green, F; red, oxygen; orange, trivalent iron; light green, divalent iron; dark blue, dysprosium.
Molecules 28 06359 g004
Figure 5. Temperature dependences of χMT for 1 (blue), 2 (black), 3 (green) and 4 (red).
Molecules 28 06359 g005
Figure 6. (a) Field dependence of the out-of-phase component of the magnetic susceptibility (χM″) at 2 K in the field range of 0–3000 Oe for 1. (b) Field dependence of the magnetic relaxation time at 2 K in the field range of 0–3000 Oe for 1. (c) Out-of-phase component of the ac magnetic susceptibility data for 1 in zero fields in the temperature range of 2–8 K; (d) thermal dependence of the magnetic relaxation time for 1 in zero (open black circles) and 800 Oe (full black circles) applied magnetic fields in the 2–7 K temperature range. Full red lines are the best-fitted curves (see text), while the dashed lines are the Orbach (black), Raman (light and dark blue) and QTM (red) contributions. (e) Out-of-phase component of the ac magnetic susceptibility data for 1 in 800 Oe in the temperature range of 2–8 K.
Molecules 28 06359 g006
Figure 7. (a) Field dependence of the out-of-phase component of the magnetic susceptibility (χM″) at 2 K in the field range of 0–3000 Oe for 2. (b) Field dependence of the magnetic relaxation time at 2 K in the field range of 0–3000 Oe for 2. (c) Out-of-phase component of the ac magnetic susceptibility data for 2 in zero field in the temperature range of 2–20 K. (d) Thermal dependence of the magnetic relaxation time for 2 in zero applied magnetic field in the 2–5 K and 2–20 K temperature ranges for HF and LF contributions, respectively. Full red lines are the best-fitted curves (see text), while the dashed black lines are the Orbach processes.
Molecules 28 06359 g007
Disclaimer/Publisher’s Note: The statements, opinions and data contained in all publications are solely those of the individual author(s) and contributor(s) and not of MDPI and/or the editor(s). MDPI and/or the editor(s) disclaim responsibility for any injury to people or property resulting from any ideas, methods, instructions or products referred to in the content.

