1. Introduction
Rubus idaeus L. is a perennial shrub of the genus
Rubus in the Rosacease family, and its fruit is the third most valuable small berry in the world, second only to strawberries and blueberries [
1,
2]. Although raspberry leaves are a by-product of raspberry production, due to their high content of active ingredients, they are also recorded in the British Pharmacopoeia [
3] and in monographs on European herbal medicine [
4]. Raspberry shoots have also shown biological activity, and have traditionally been used as medicinal herbs in Eastern Europe [
5]. Our previous results showed that raspberry leaf extract with 50% total phenolic content (TPC) had positive effects on gut microbiota during in vitro digestion and fermentation, and reduced the ratio of Firmicutes/Bacteroidetes and the relative abundance of potential pathogens in the feces of all volunteers. The extract also increased the relative abundance of some bacteria, e.g., Enterococcus and Prevotella, that have been shown to have beneficial value in maintaining intestinal health [
6]. Moreover, it was shown to have a potential role in HFD-induced body weight control in mice [
7]. In addition, the extract of sweet leaf tea (
Rubus Suavissimus) is also rich in gallic acid, ellagic acid, and rutin, and can effectively alleviate low-grade chronic inflammation, reduce metabolic disorders, and ameliorate the obesity phenotype [
8,
9]. Among 25 kinds of ellagitannin from unripe raspberry (
Rubus chingii), Chingiitannin A showed the best inhibitory activities against α-amylase and α-glucosidase [
10]. Raspberry leaves are rich in polyphenols, ellagictannins, quercetin, and kaempferol derivatives, and have good antioxidant, anti-inflammatory, and anti-diabetic properties, as well as the ability to improve obesity and intestinal flora balance, thus being of high healthcare value and industrial value [
6,
10,
11,
12,
13].
With the deepening of the research on raspberry leaves and their extract activity and active ingredients, the required contents of phenolic compounds are becoming increasingly high. How can the yield be improved, the time shortened, and the energy consumption reduced? There are three possible solutions: (1) Optimization of raw material: We found that the leaves of both annual and biennial raspberries harvested in late autumn contained highly active ingredients. Among them, the apical and middle leaves contained more polyphenols, while the old leaves contained more saponins. Their hydrolyzable tannin contents were 1.4–1.6 times those of free phenols, with a maximum of about 300 mg/g, with quercetin-3-glucuronide (Q3GR) being the highest, at about 5–10 mg/g DW [
14]. (2) Optimization of the extraction process: As an example, the effects of high-speed homogenization (HG), ultrasonic (US)-assisted extraction, and their combination processes on the extraction of coconut mesocarp polyphenols were compared and analyzed. The TPC of the extract obtained using HG + US reached about 300 mg GAE/g, which is approximately double that of the extract obtained using a single process [
15]. Wang et al. [
16] also extracted phenolic compounds from the roots and leaves of peony using a combined process. The TPCs from the roots and leaves reached about 80 mg GAE/g and 150 mg GAE/g, respectively, values which were about 50% higher than those obtained using a single process. In addition, steam explosion (SE) technology can be used to convert the saturated vapor pressure of the closed chamber into mechanical energy, so that the tissue gap can be expanded and further exploded. This not only leads to the formation of micropores in the cell wall, so that small molecular substances can be more easily released from the cell, but also depolymerizes the macromolecular polyphenols into small molecules and improves their biological activity [
17,
18]. For example, Hu et al. [
19] reported that, after proper treatment with SE, the TPC of okra seed extract increased from 294.57 to 619.07 mg GAE/100 g, and the ·OH radical scavenging rate increased from 18.78% to 67.34%. It may be that the increased content of phenolic compounds after SE treatment leads to enhanced antioxidant activity [
20]. Sui et al. treated tea extracts under different pressures for 3 min, and reported that the DPPH and ·OH scavenging rates reached their highest values when the pressure was 0.2 MPa. However, with a continuous increase in pressure, the scavenging rate decreased [
21]. (3) Optimization of the purification process: Macroporous resin is an environmentally friendly styrene derivative with stable physical and chemical properties, a large adsorption capacity, good selectivity, and reusability. It is widely used to remove proteins, polysaccharides, pigments, and lipids from extracts in order to obtain a purified extract with higher bioactivity in theoretical research and industrial production [
22]. For example, after purification with D101 macroporous resin, the tannin content of
Coriaria nepalensis bark increased significantly from 32.5% to 70.6%. Its minimum inhibitory concentrations for
Staphylococcus aureus and
Escherichia coli were only 32 μg mL
−1, values which are lower than those of commercial tannic acid [
23].
Therefore, in this work, the apical and middle leaves of annual raspberry (Heritage) were collected in late autumn as the raw material. The extraction process of polyphenols from raspberry leaves was optimized by the combination of US + HG + SE, and then the purification process was optimized with respect to macroporous resin screening, loading sample concentration, volume and pH, elution solvent, and other factors to increase the TPC in the extracts. The effects of the secondary SE on the TPC, antioxidant activity, and anti-amylase and anti-glucosidase activities of the extracts were thoroughly investigated. The results will provide basic data for the large-scale preparation of raspberry leaf extracts, provide raw materials for the downstream application of extracts, and lay a foundation for the comprehensive development of the raspberry industry.
3. Materials and Methods
3.1. Plant Materials and Reagents
The apical and middle raspberry leaves (Rubus ideaus L. cv. Heritage) were collected at the plantation of the North University of China, Taiyuan, Shanxi Province (38°01′71″ N, 112°44′46″ E), in October 2022. The leaves were air-dried naturally and stored at room temperature until further analysis.
MS-grade acetonitrile and methanol were purchased from Thermo Fisher Scientific—CN. Other reagents were purchased from Shanghai Aladdin Biochemical Technology Co., Ltd. and Yuanye Biotechnology Ltd. (Shanghai, China).
3.2. Total Phenolic Content (TPC)
The TPC was determined using the Folin phenol method: 100 μL of sample, 300 μL of Folin phenol, 1.5 mL of 7% Na2CO3, and 3.1 mL of deionized water were added to the centrifuge tube and incubated for 2 h at room temperature and in the dark. The TPC was calculated using A = 1.808C + 0.056, where A is the absorbance of the sample and C is the concentration of the sample, with TPC expressed as mg GAE/g.
3.3. The Extraction Process
A schematic diagram of raspberry leaf polyphenols extracted under different conditions is shown in
Figure 13.
3.3.1. SE-Assisted Extraction
Raspberry leaf powder (1 g) was passed through a 50 mm sieve and 32 mL deionized water was added and both were mixed together in the flask. Sample solutions were placed in a high-pressure device (BXM-30R, Shanghai Boxun Biotechnology Co., Ltd., Shanghai, China) with a maximum temperature of 125 °C. The effects of temperature, time, and liquid–solid ratio of SE treatment on TPC in the extract were studied in sequence. The single-factor experiment design is displayed in
Table 7. The other basic conditions were 110 °C, 10 min, and 32 mL/g.
According to the results of the single-factor experiment, time A, temperature B, and liquid–solid ratio C were selected as the three factors of RSE of SE, and the sample TPC was used as the response value Y. The three levels of each factor with 1, 0, and −1 were designed using the Box–Behnken model in
Table 8.
3.3.2. HG-Assisted Extraction
Raspberry leaf powder (1 g) was passed through a 50 mm sieve and 40 mL 60% ethanol solution was added and both were mixed. Sample solutions were homogenized using a high-speed disperser at 3000, 4000, 5000, 6000, and 7000 r/min for 1 min, respectively. The HG condition was provided using a high-speed disperser (XHF-DY, Ningbo Xinzhi Biotechnology Co., Ltd., Ningbo, China) with a maximum speed of 10,000 r/min. After centrifugation (4000 rpm × 5 min), the sample TPC was determined.
3.3.3. Combination Processes
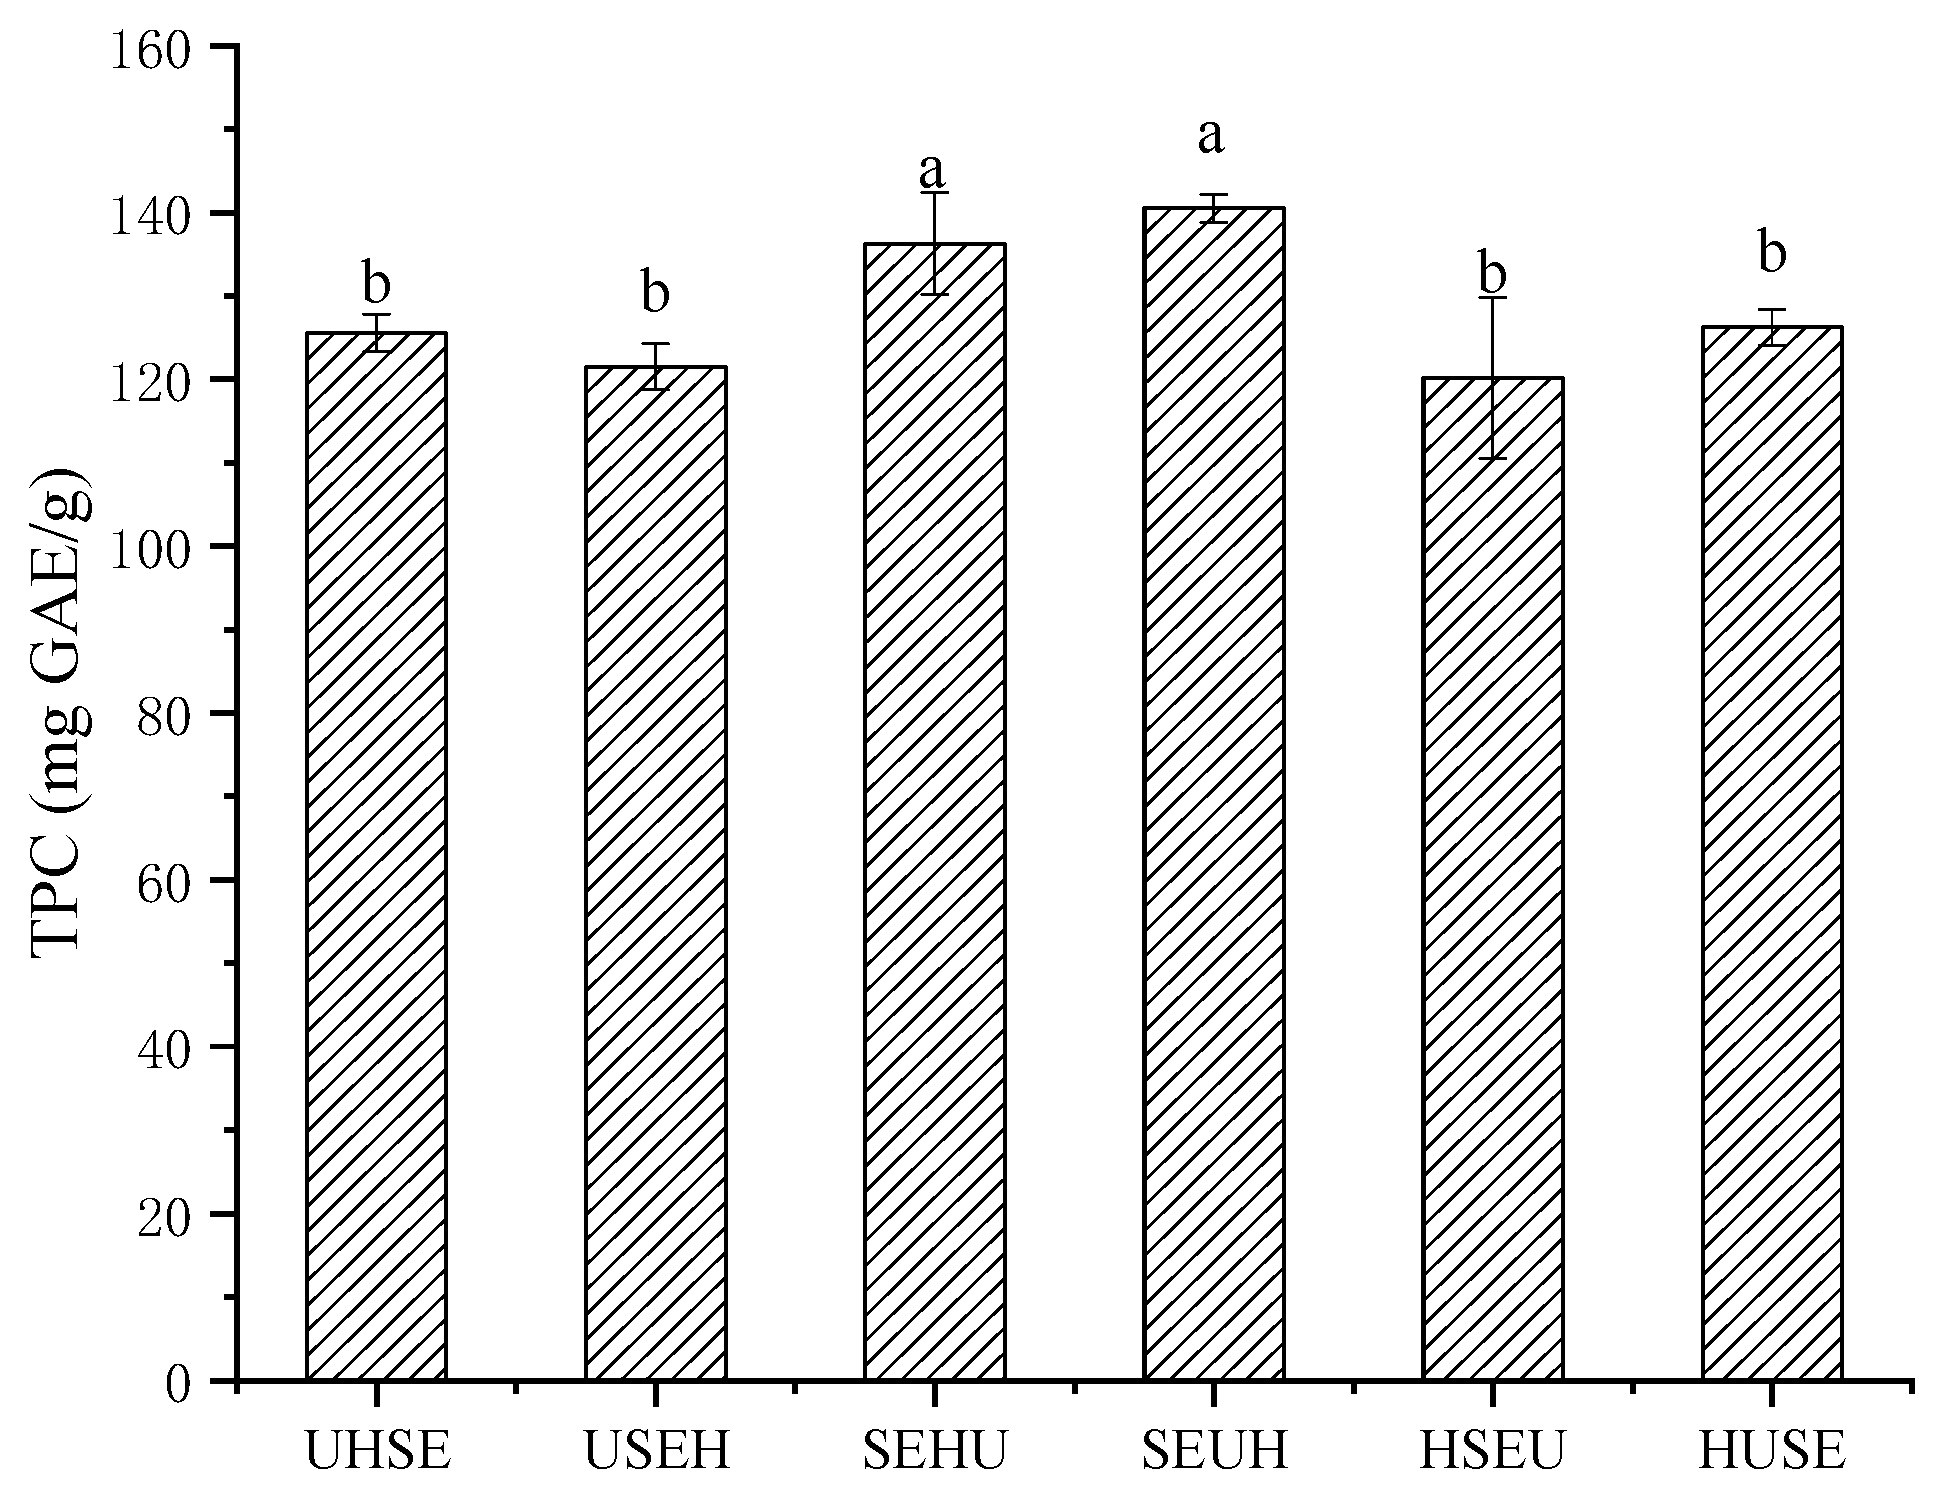
The US condition was provided using a thermostatic water-bath US device (SB-5200 DTD, Ningbo Xinzhi Biotechnology Co., Ltd.) with a maximum power of 360 W. Moreover, the US + SE + HG combinations are displayed in
Table 3, and the steps were as follows.
Combination 1:
① HG: Raspberry leaf powder (1 g) and 40 mL/g of 60% ethanol solution under 4000 r/min HG treatment for 1 min, obtaining sample solution 1 (SS1).
② US: SS1 was treated under 120 W US for 30 min, obtaining sample solution 2 (SS2).
③ SE: After the ethanol of SS2 was removed via rotary evaporation, about 15 mL of deionized water was added to obtain 29 mL/g. This was treated under 115 °C for 15 min, obtaining sample solution 3 (SS3). Combination 6: Exchange ① and ②.
Combination 2:
① HG: Raspberry leaf powder (1 g) and 40 mL/g of 60% ethanol solution under 4000 r/min HG treatment for 1 min, obtaining sample solution 1 (SS1).
② SE: After the ethanol of SS1 was removed via rotary evaporation, about 15 mL of deionized water was added to obtain 29 mL/g. This was treated under 115 °C for 15 min, obtaining sample solution 2 (SS2).
③ US: After drying SS2 to 16 mL, 24 mL absolute ethanol was added to reach approximately 40 mL/g of 60% ethanol solution. This was treated using 120 W US treatment for 30 min, obtaining sample solution 3 (SS3). Combination 5: Exchange ① and ③.
Combination 3:
① SE: Raspberry leaf powder (1 g) and 29 mL deionized water under 115℃ for 15 min, obtaining sample solution 1 (SS1).
② HG: After drying SS1 to 16 mL, 24 mL absolute ethanol was added to reach approximately 40 mL/g of 60% ethanol solution. This was treated under 4000 r/min HG treatment for 1 min, obtaining sample solution 2 (SS2).
③ US: SS2 was treated under 120 W US for 30 min, obtaining sample solution 3 (SS3). Combination 4: Exchange ② and ③.
Finally, the TPC of SS3 was determined.
3.4. The Purification Process using Macroporous Resin
A schematic diagram of purified raspberry leaf polyphenols is shown in
Figure 13.
3.4.1. Macroporous Resin Pretreatment
The macroporous resin was soaked in 95% ethanol overnight, and then washed with deionized water until becoming neutral. Secondly, the resin was soaked in 4% HCl (
v/
v) and 4% NaOH (w/v) for 4–6 h in turns, and washed with deionized water until neutralization each time. Finally, it was stored in 95% ethanol solution. The properties of the six macroporous resins are shown in
Table 9.
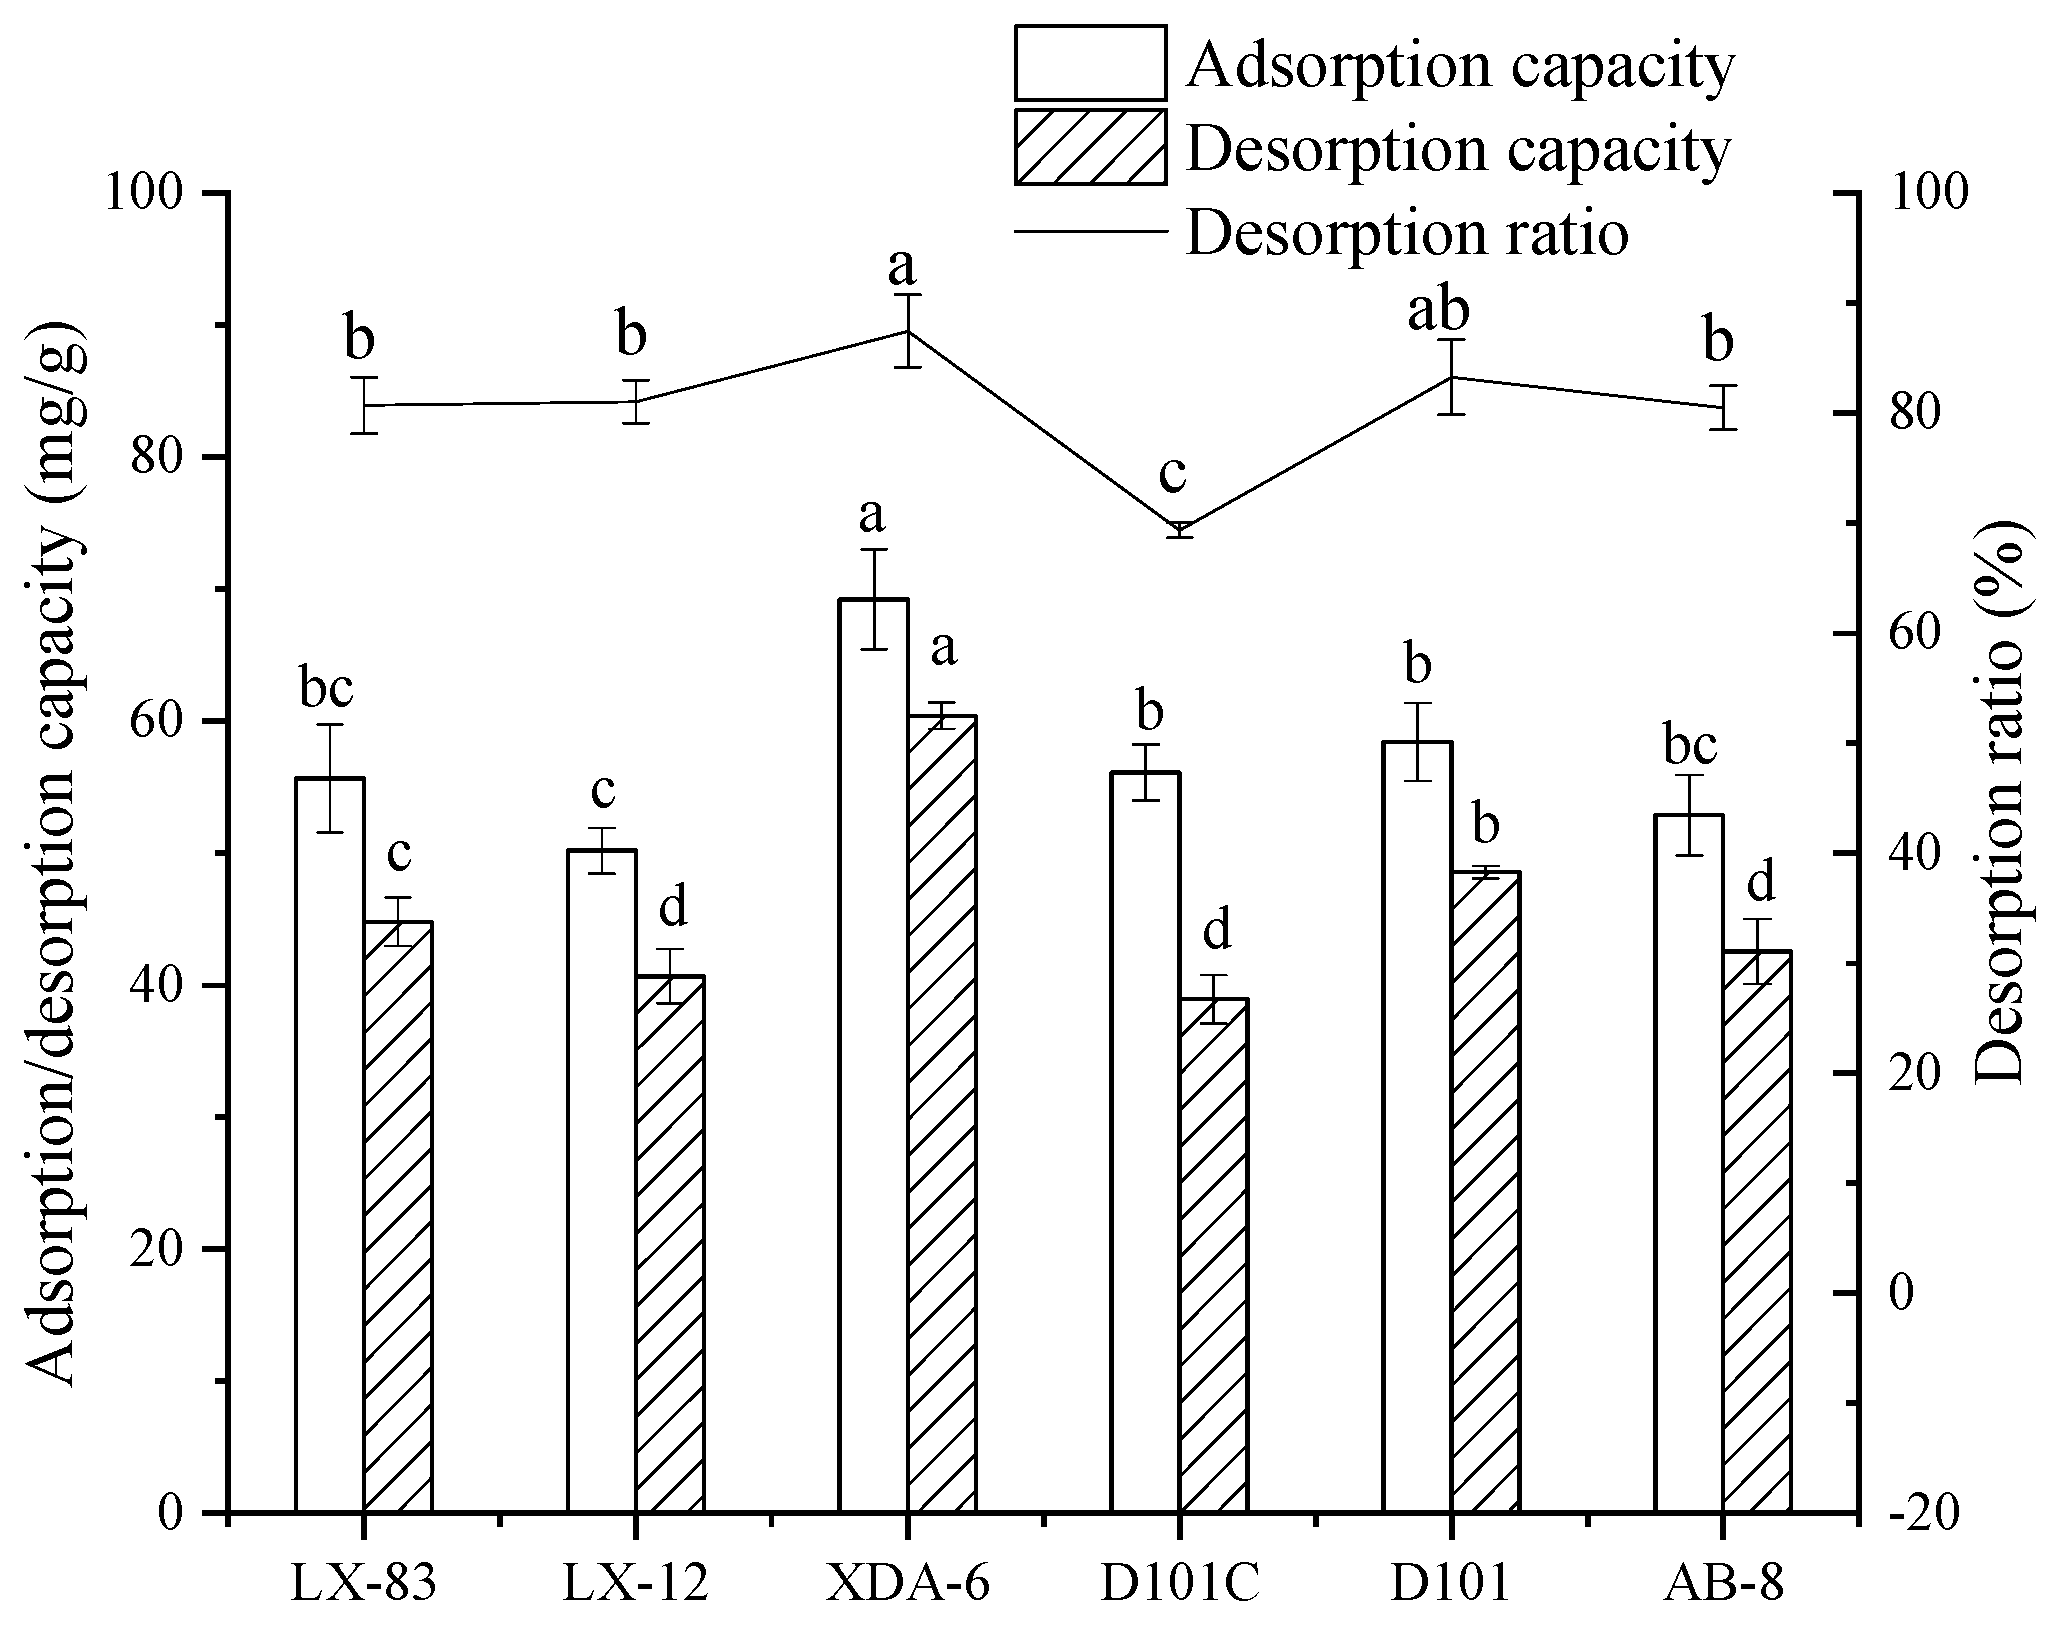
3.4.2. Screening Macroporous Resins
One gram of macroporous resin and 20 mL of extraction solution were added to a 250 mL conical flask. The flask was shaken in an air bath incubator at 25 °C and 150 rpm for 12 h. The adsorption capacity was calculated according to Equation (1). After the solution was removed, the macroporous resin was washed with deionized water, and then 30 mL of 60% ethanol was added. The resin was shaken at 25 °C and 150 rpm for 12 h. The desorption capacity was calculated according to Equation (2), and the desorption ratio was calculated according to Equation (3).
qa and qb are the equilibrium adsorption capacity and desorption capacity, respectively. C0, Ca, and Cb are the TPCs of the initial extract solution, the solution after adsorption, and the desorption solution, respectively. Va and Vb are the volumes of extraction solution and desorption solution, respectively. m is the mass of resin and D is the desorption ratio.
3.4.3. The pH of the Extract Solution
The pH of the extract solution was adjusted to 1, 2, 3, 4, 5, 6, 7, and 8 using 4% HCl or 4% NaOH. Other treatments were as used, as shown in
Section 3.4.2. Their corresponding adsorption capacities were calculated using their TPC.
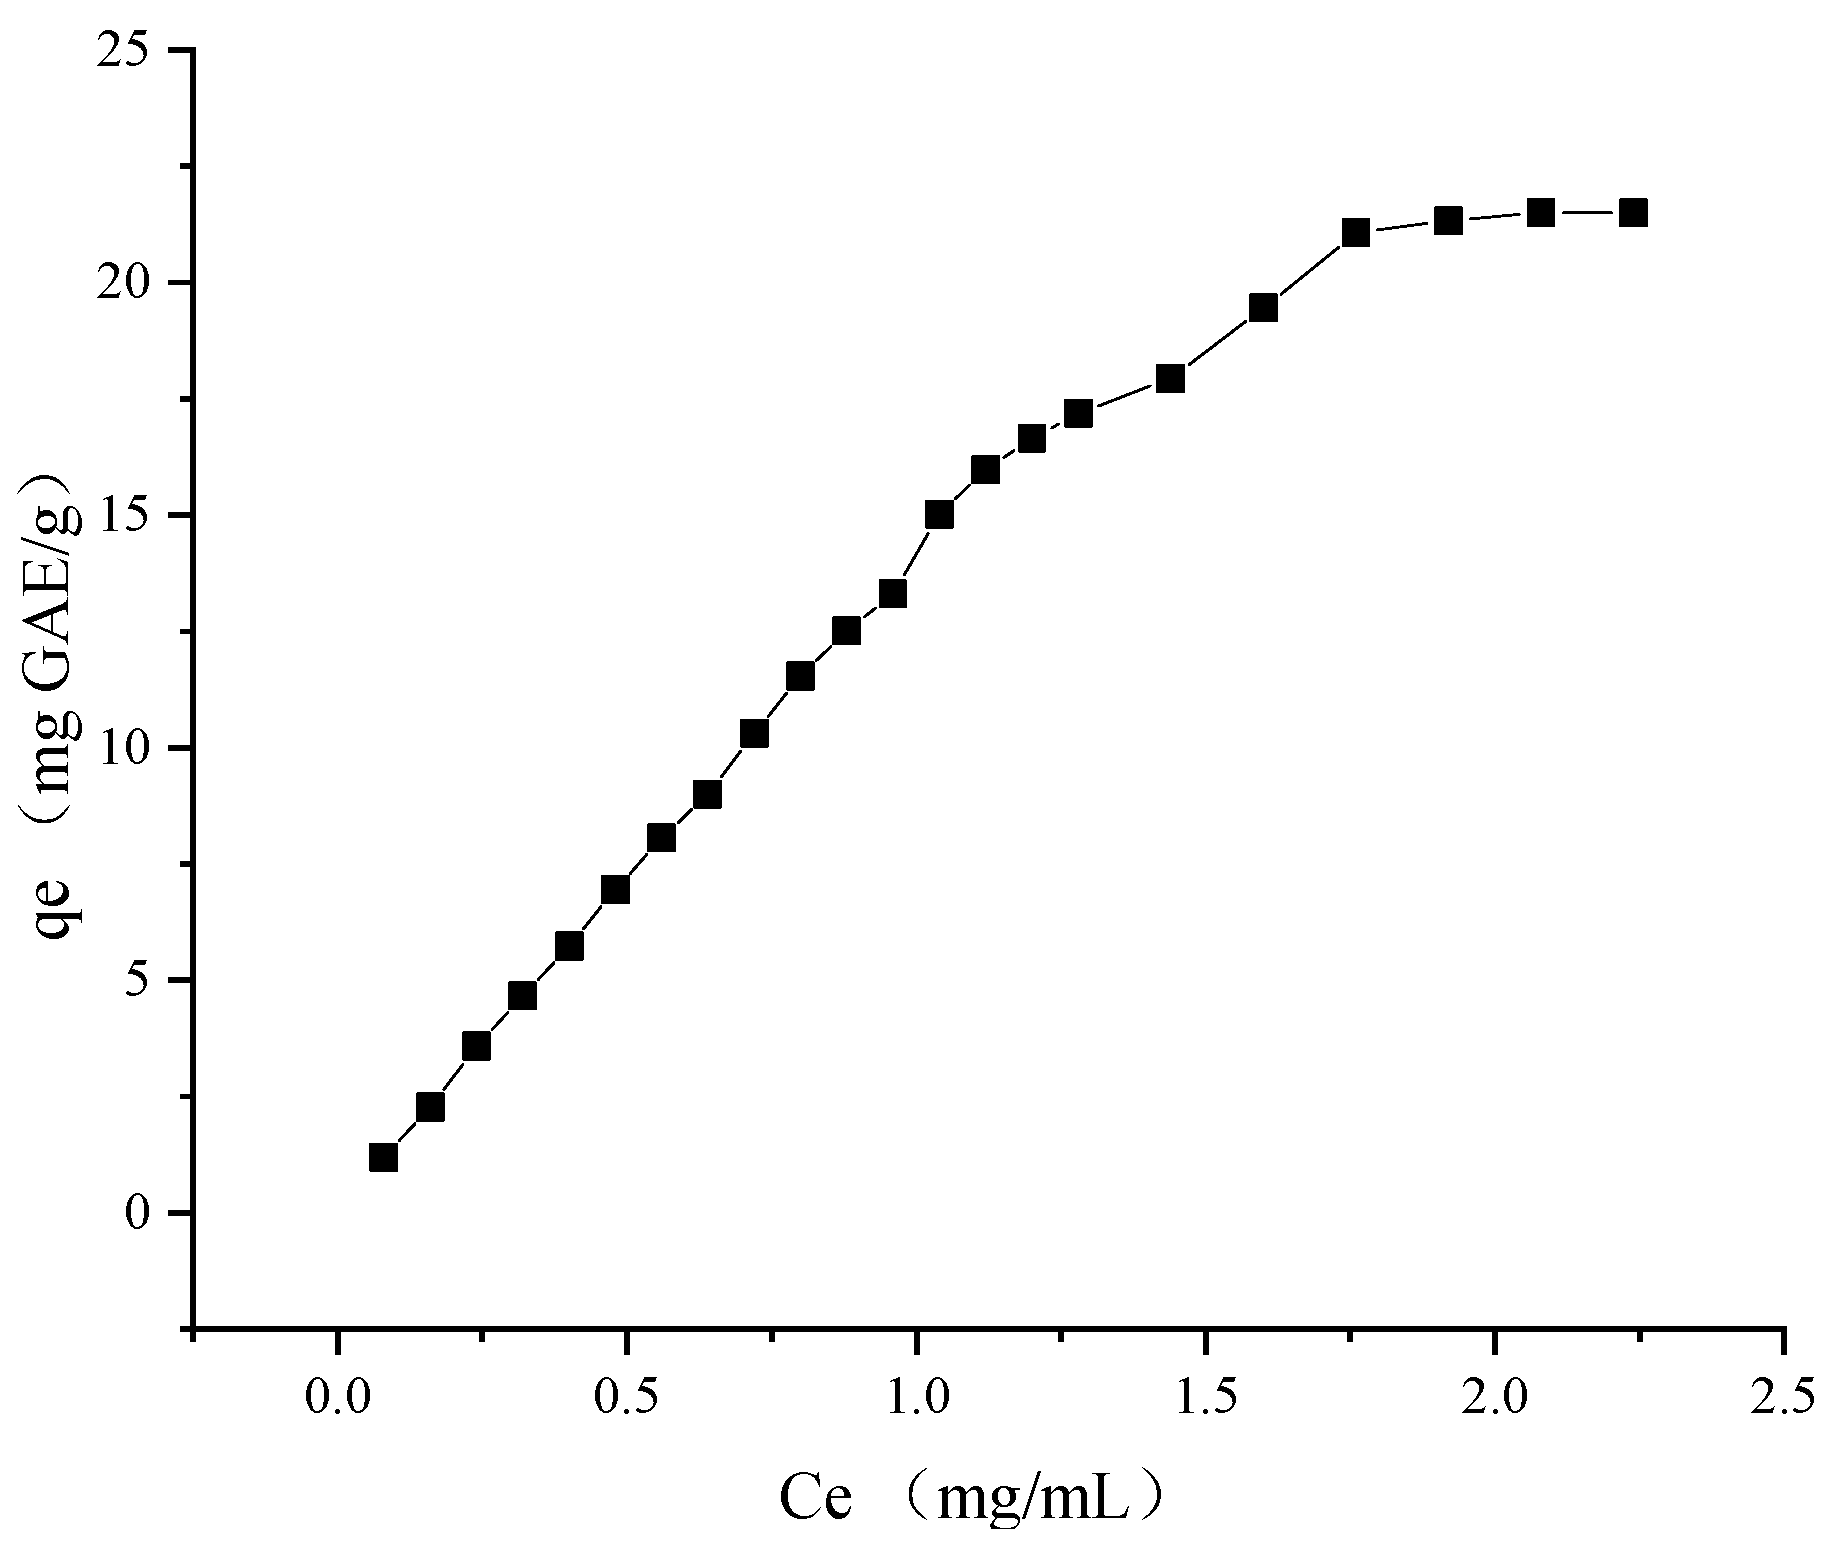
3.4.4. Adsorption Isotherm
The TPC of RLE was diluted to 0.32, 0.48, 0.64, 0.80, 0.96, 1.12, 1.28, 1.44, 1.60, 1.76, and 1.92 mg GAE/mL, respectively. Other treatments were used, as shown in
Section 3.4.2. The adsorption capacity of each sample was calculated according to Equation (1).
To further investigate the adsorption properties of the resin, Langmuir (Equation (4)) and Freundlich (Equation (5)) models were used to analyze the data.
qe is the adsorption equilibrium capacity (mg). Ce is the TPC of the solution after the adsorption equilibrium (mg/mL). qm is the maximum theoretical adsorption capacity (mg). KL is the Langmuir constant. KF is the theoretical saturation adsorption capacity. n is the adsorption driving force.
3.4.5. Adsorption Kinetics
The mixtures of the extraction solution and resin were shaken for 0, 5, 10, 15, 30, 60, 90, 120, and 180 min, respectively. Other treatments were used, as shown in
Section 3.4.2. Their adsorption kinetic properties were analyzed using pseudo-first-order (Equation (6)) and pseudo-second-order (Equation (7)) models.
qe is the adsorption equilibrium capacity (mg). qt is the adsorption capacity (mg) at interval time t. k1 and k2 are the rate constants of pseudo-first-order kinetic and pseudo-second-order kinetic models, respectively.
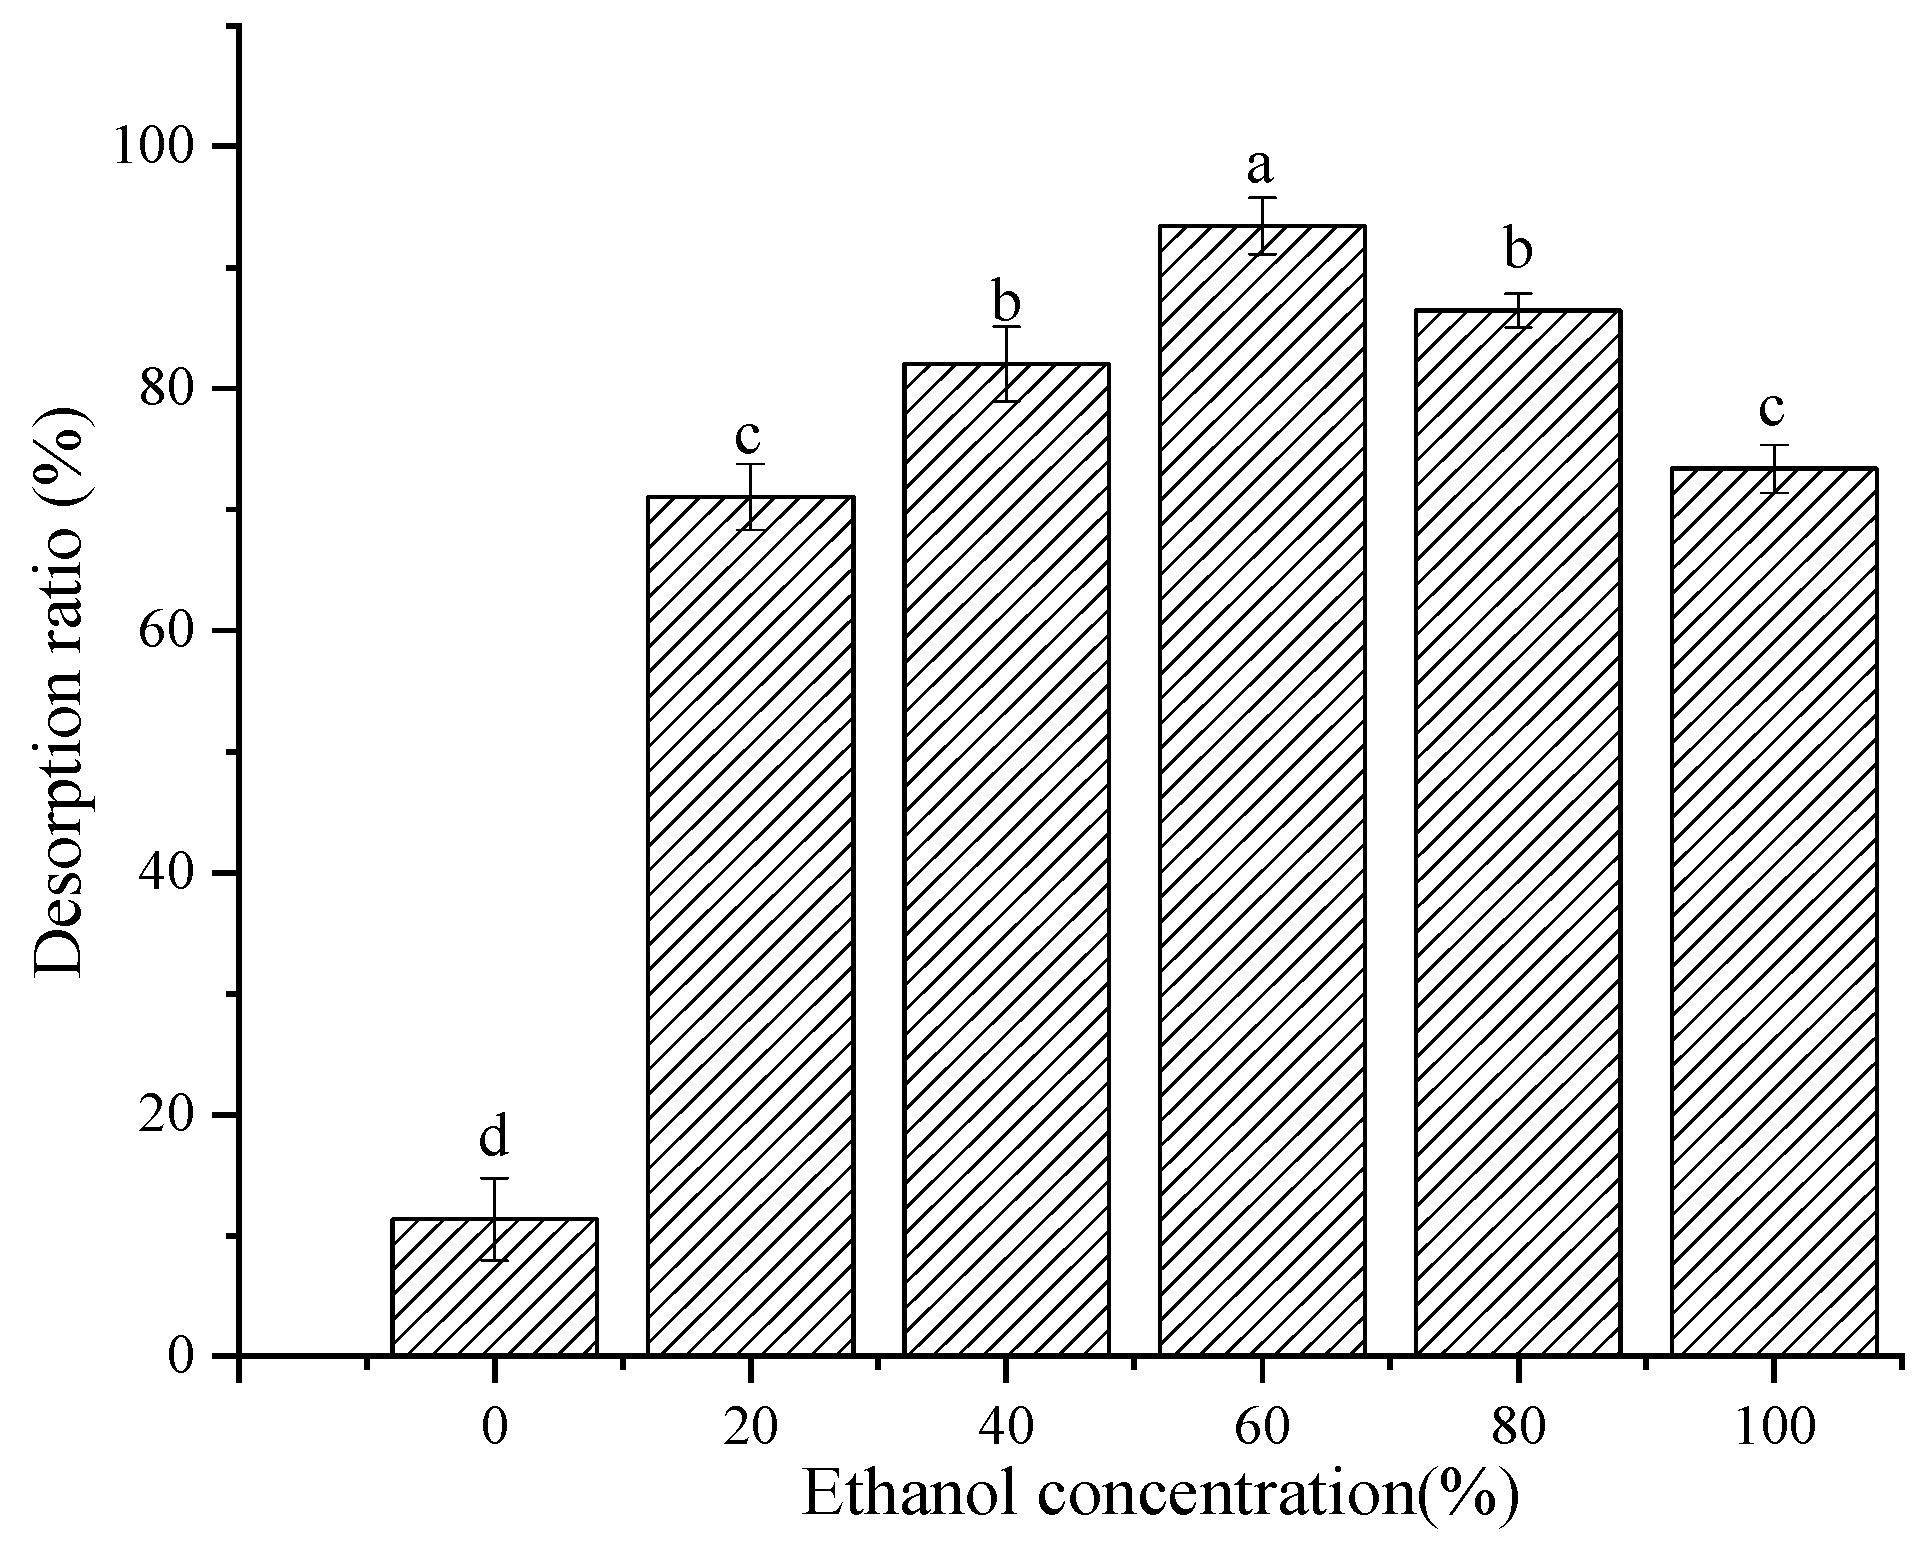
3.4.6. Desorption Solution
Adsorption saturated macroporous resins were desorbed with 0%, 20%, 40%, 60%, 80%, and 100% ethanol solutions, respectively. The solutions were shaken at 25 °C and 150 rpm for 12 h. The desorption capacity was calculated according to Equation (2).
3.4.7. Dynamic Adsorption and Desorption
A glass column with an inner diameter of 1.5 cm and a length of 60 cm was selected for dynamic adsorption and desorption experiments. The experiment was carried out by filling the macroporous resin with a height of 9 cm (diameter/height ratio 1:6) (
Figure 13).
Dynamic adsorption: RLE solution was added to the column at flow rates of 2, 3, and 4 BV/h, respectively. The effluent of each column volume was collected and TPC values were determined.
Dynamic desorption: The adsorption column was washed with deionized water until the effluent was colorless, and the optimal desorption solution was added at flow rates of 4, 5, and 6 BV/h, respectively. The effluents were collected every 0.5 BV (bed volume) and their TPC was determined.
3.5. HPLC–MS Analysis
The extract solution (1 mL) was filtered through a 0.22 μm membrane and stored at 4 °C until HPLC–MS analysis. The solutions were analyzed using a Thermo Scientific QE Orbitrap mass spectrometry system (Thermo Fisher Scientific Inc., Waltham, MA, USA) equipped with an electrospray interface. The column was Hypersil GOLD (C18 column, 100 mm × 2.1 mm, 3 μm). The sample injection volume was 1 µL, and the gradient process was divided into phase A (water + 0.1% formic acid) and phase B (acetonitrile). The chromatography and mass spectrometry conditions were set according to Yang et al. [
40].
3.6. Antioxidant Activity
The scavenging activity of DPPH/ABTS was identified according to the experimental method of Yang et al. [
40] and calculated using Equation (8):
A1 is the sample + DPPH/ABTS. A0 is the sample. A is the DPPH/ABTS solution.
3.7. Anti-Enzyme Activity
α-Amylase and α-glucosidase inhibition activities were determined according to Li et al. [
15] and calculated according to Equation (9).
A is the PBS + enzyme. B is the PBS. C is the PBS + enzyme + sample. D is the PBS + sample.
3.8. Statistical Analysis
Each experiment was repeated at least three times, and the experimental data were expressed as the mean ± standard deviation. The RSE data were analyzed using Design-Expert 11 software. Analysis of variance (ANOVA) was performed using IBM SPSS statistics 22.0 software. HPLC–MS analysis was performed using Xcalibur software 3.0 (Thermo Fisher Scientific Inc., Waltham, MA, USA).


