
Removal of Methylene Blue and Methyl Red from Aqueous Solutions Using Activated Carbons Obtained by Chemical Activation of Caraway Seed

 ,
, 
Abstract
:1. Introduction
2. Results and Discussion
2.1. Chemical Composition of the Activated Carbons
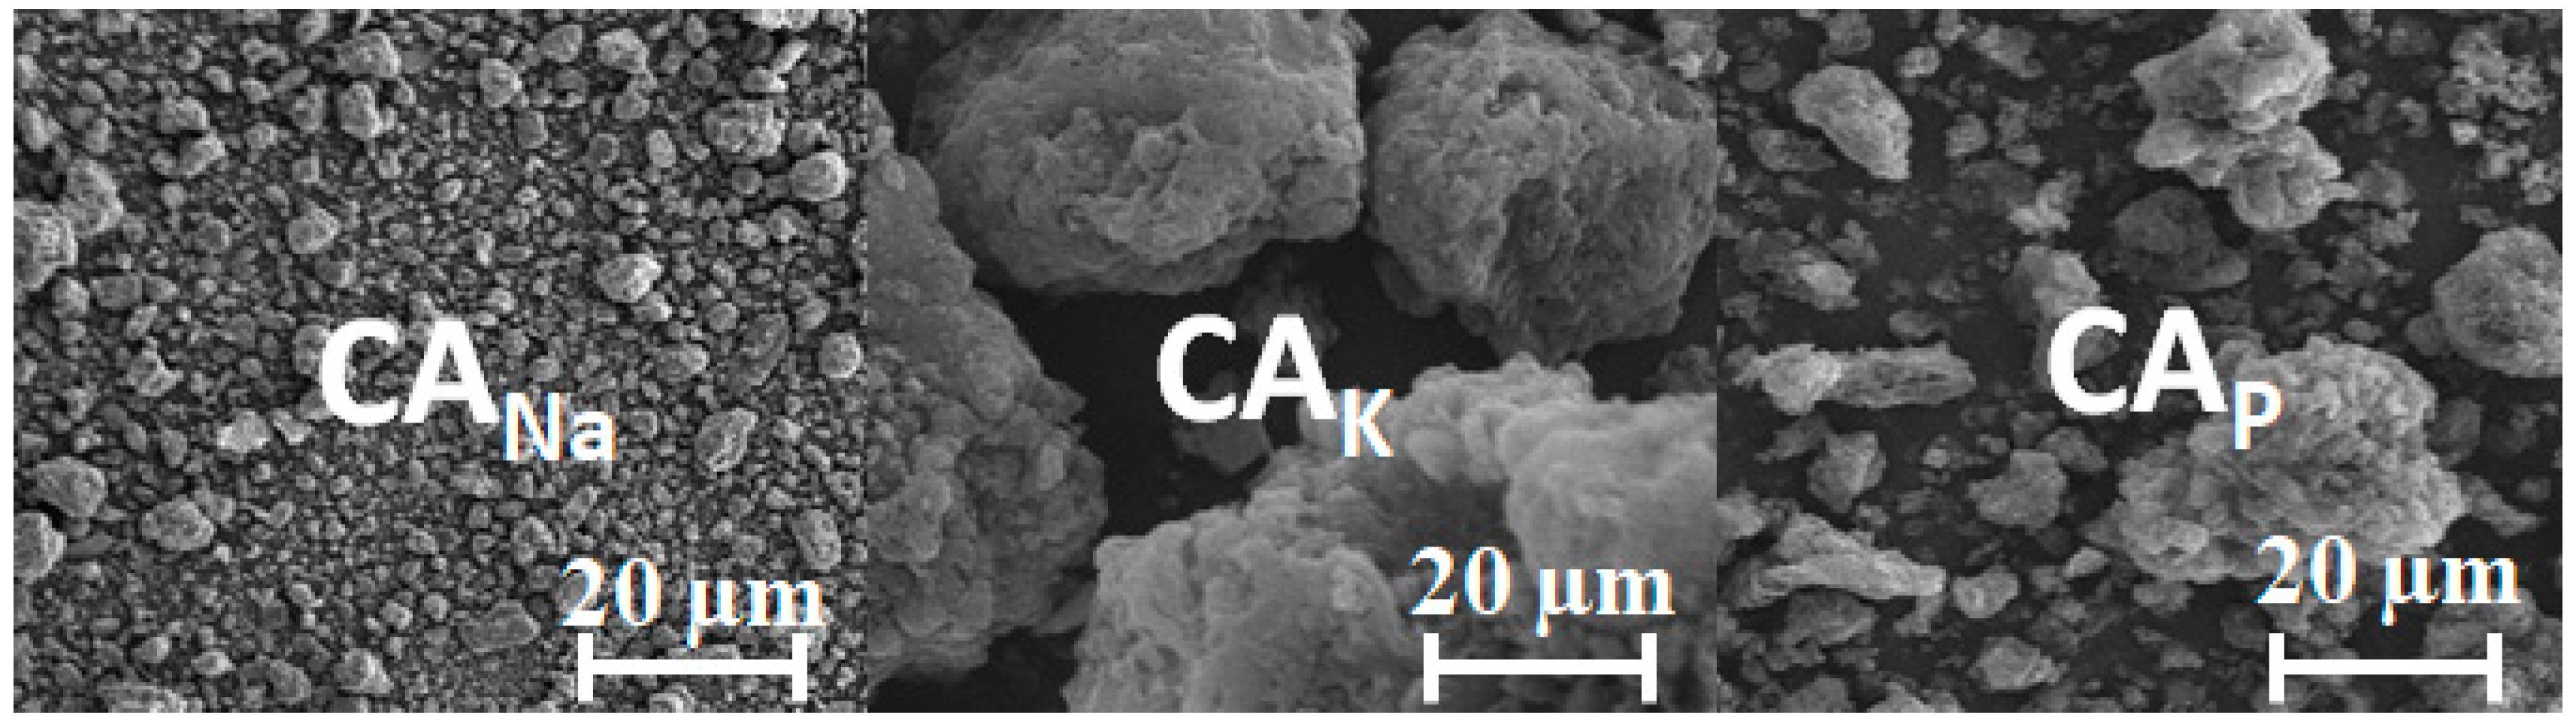
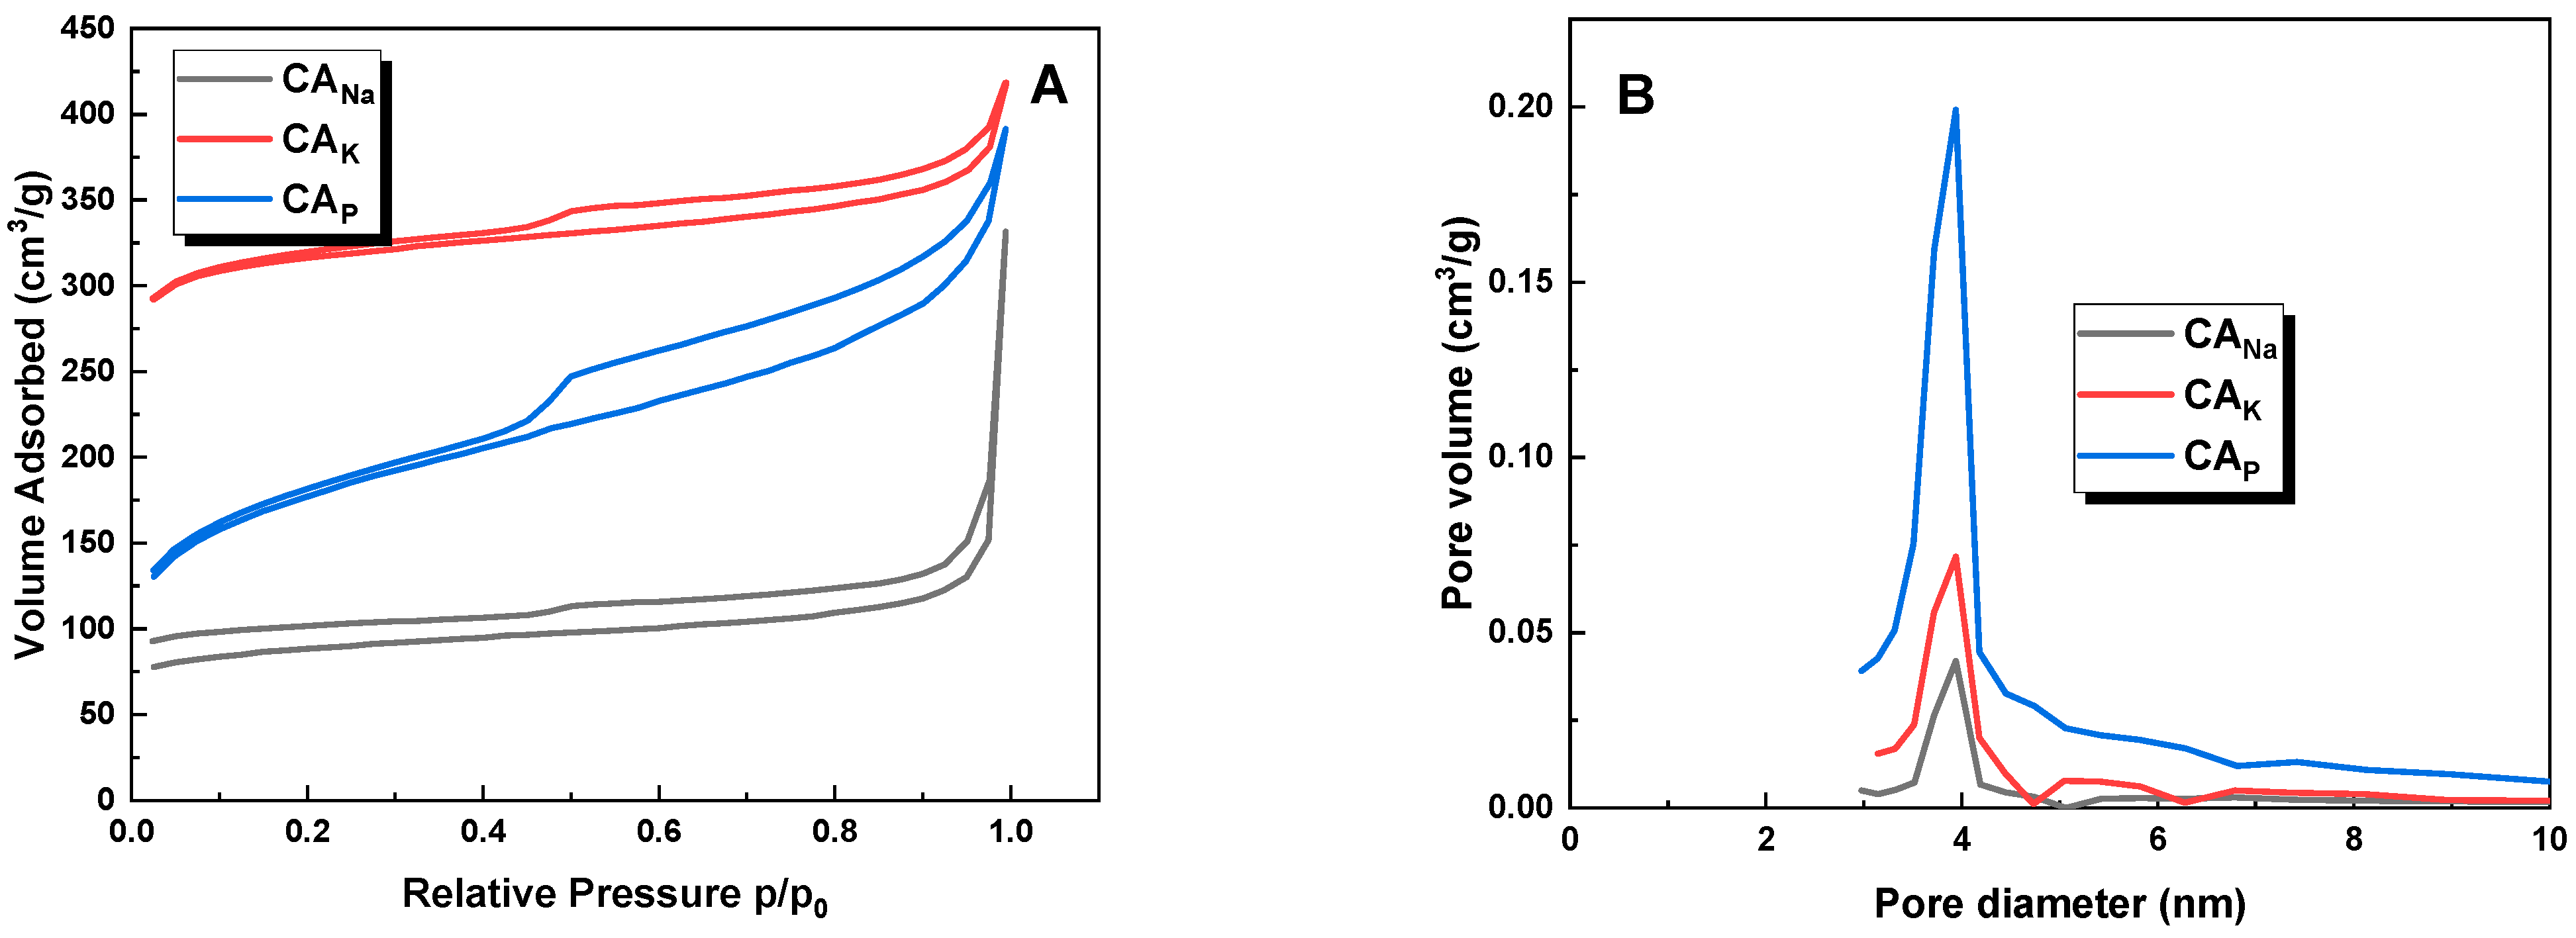
2.2. Physiochemical Properties of the Obtained Activated Carbons
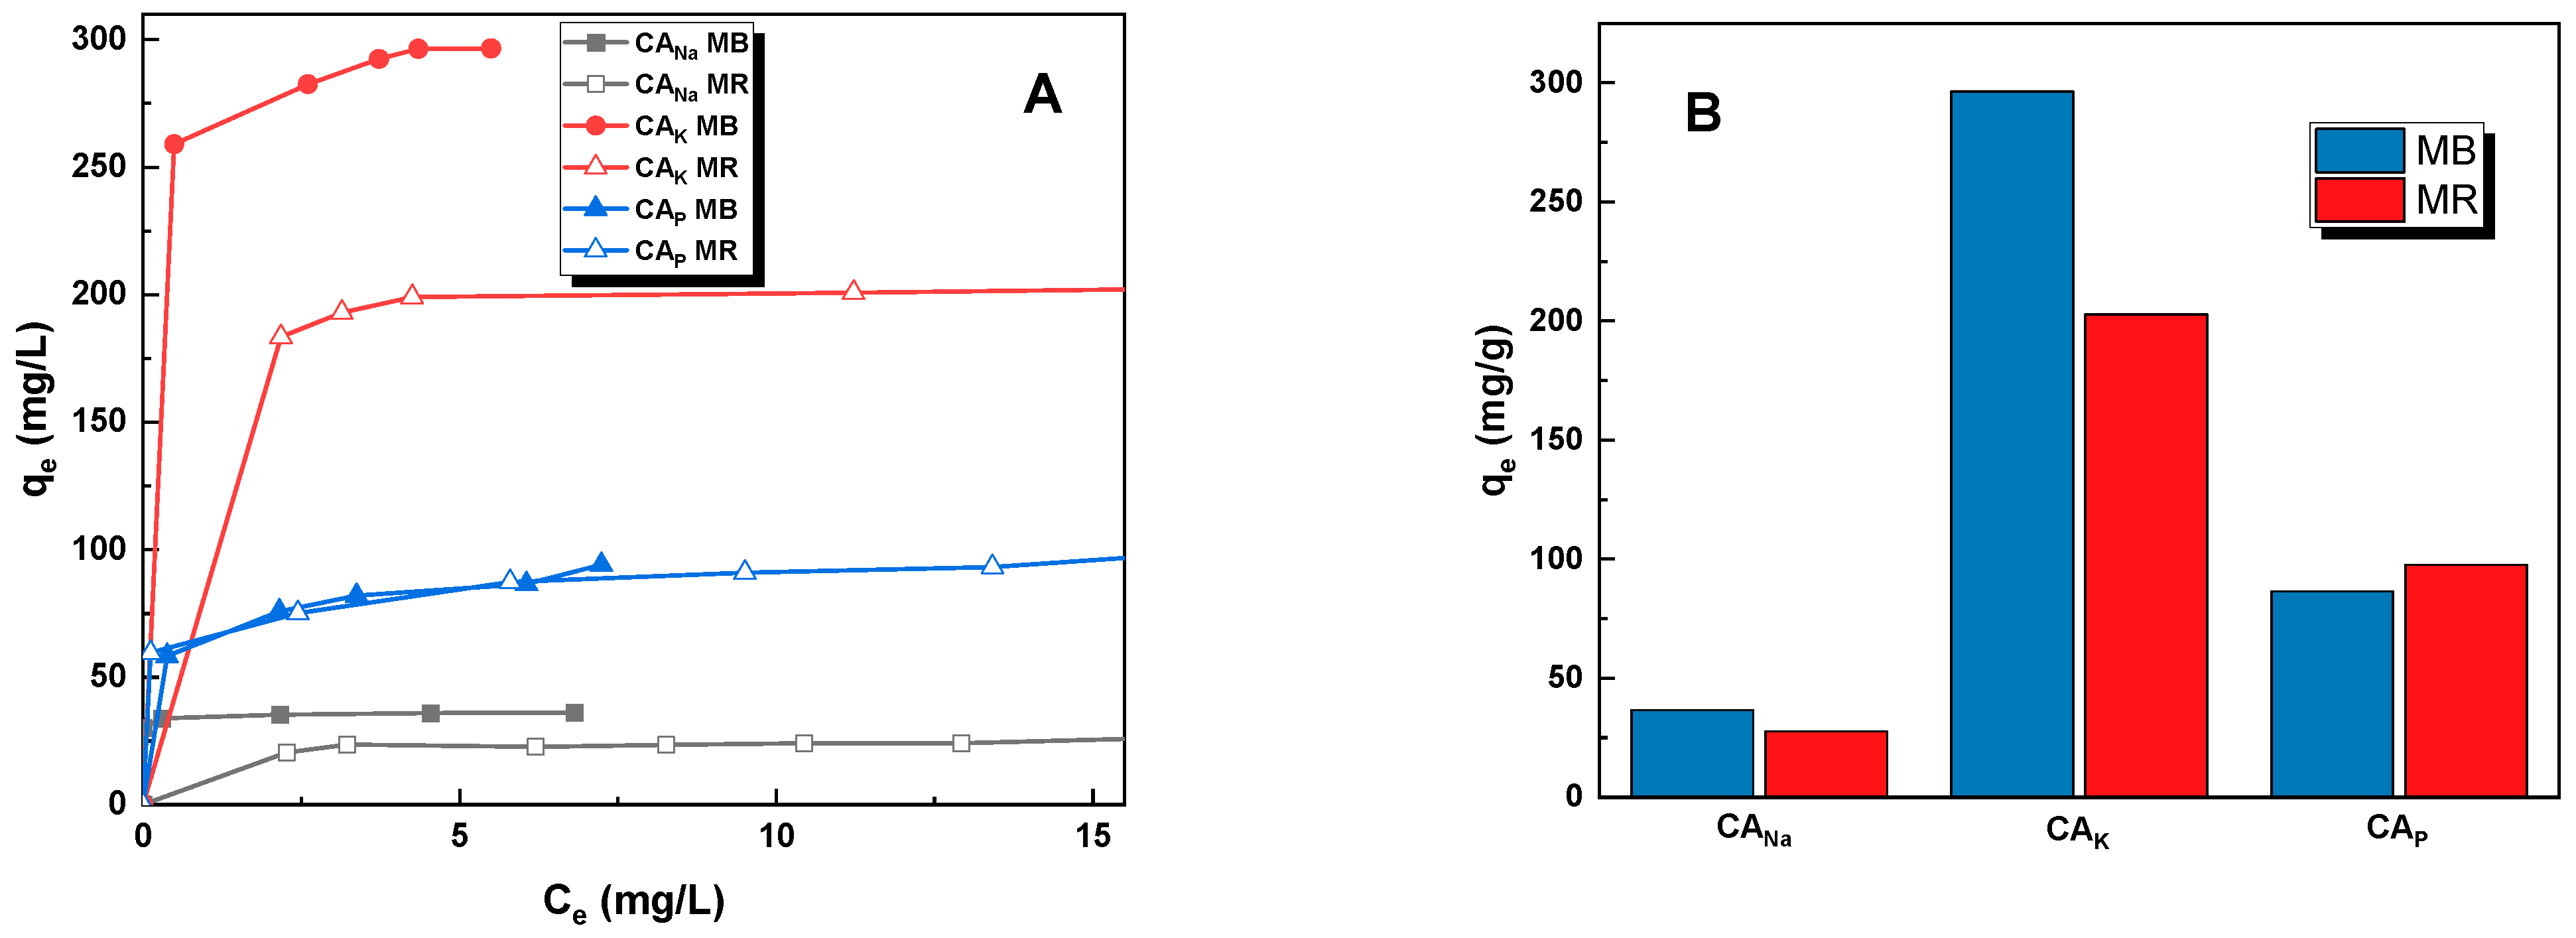
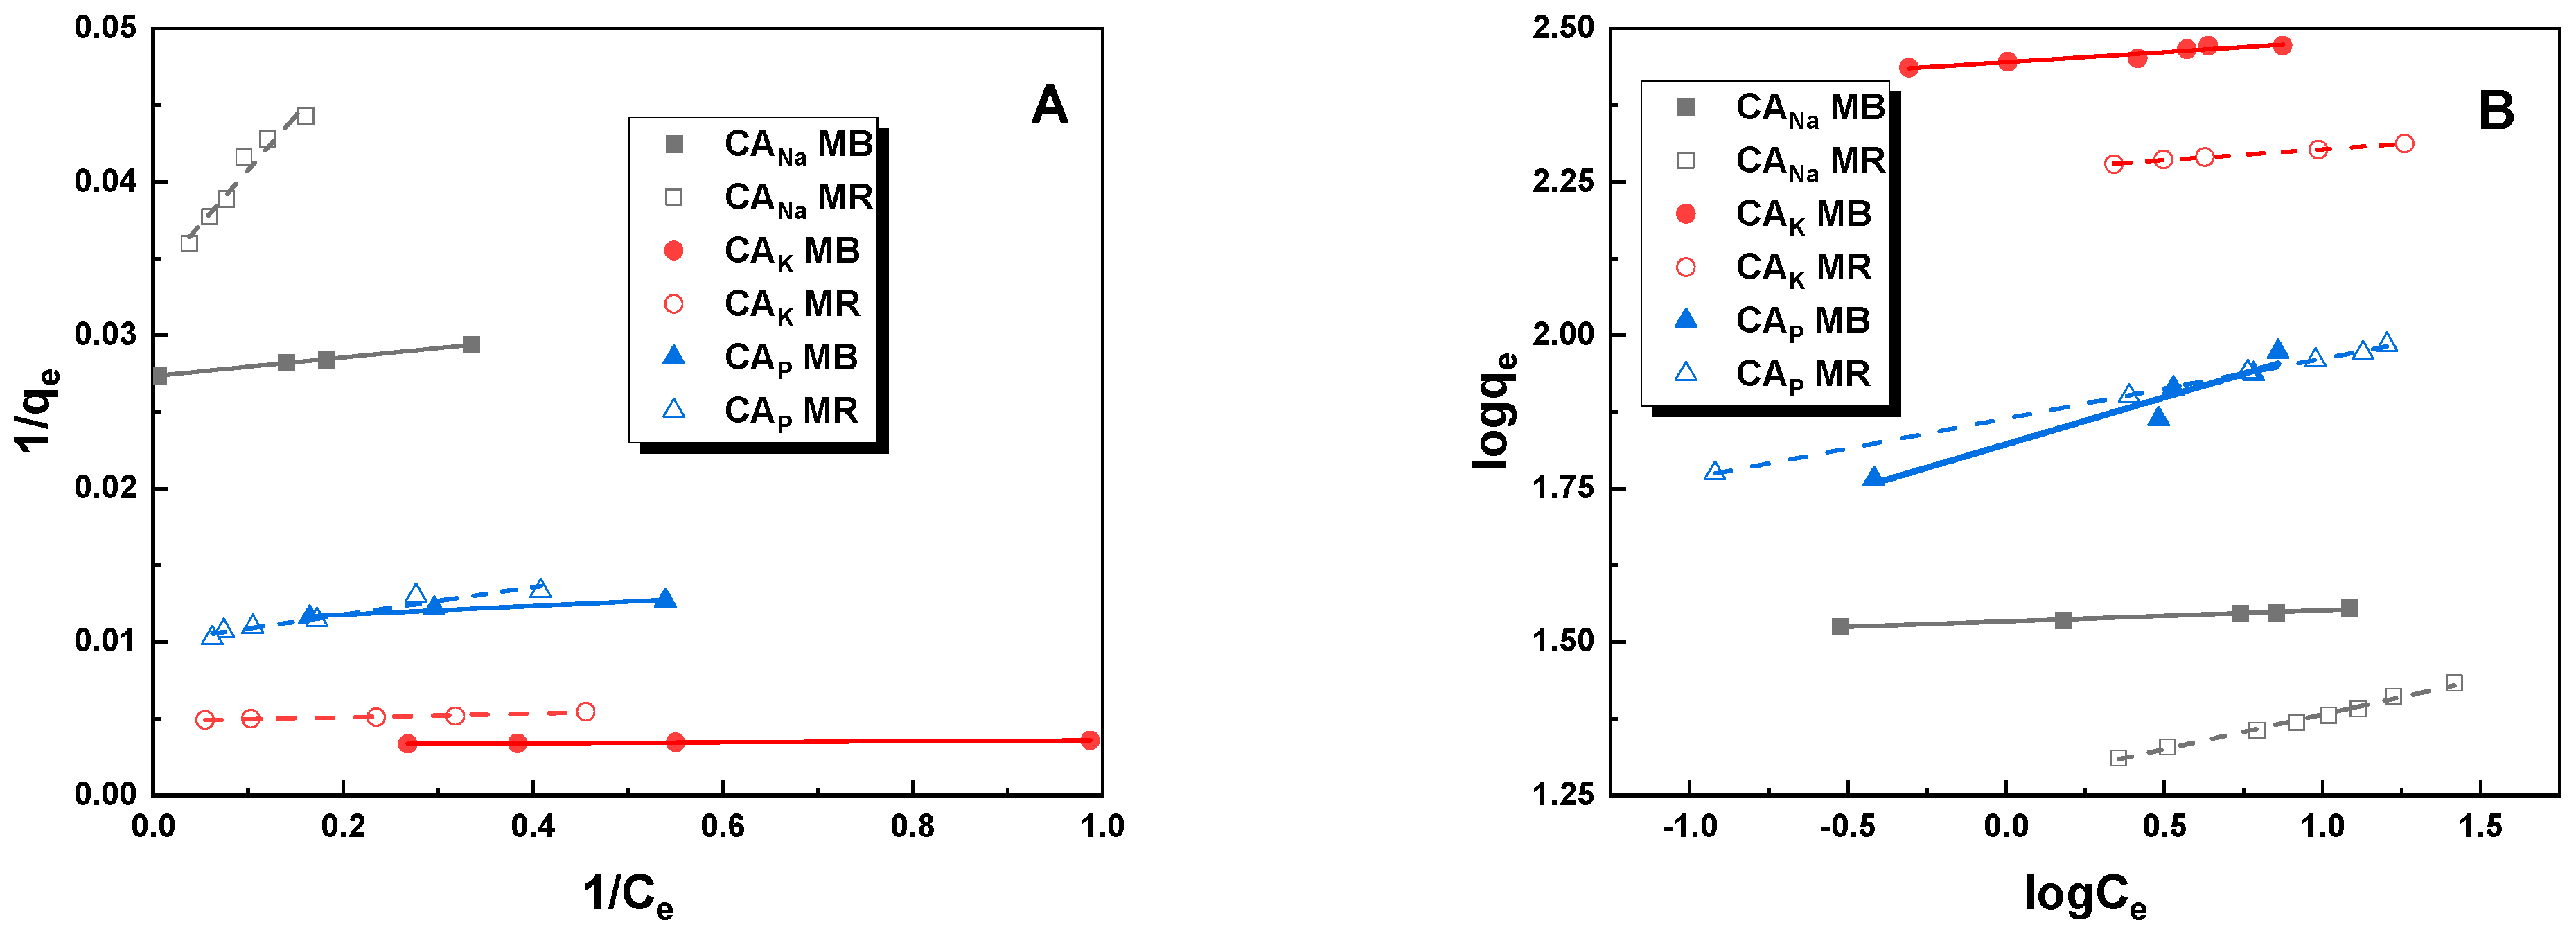
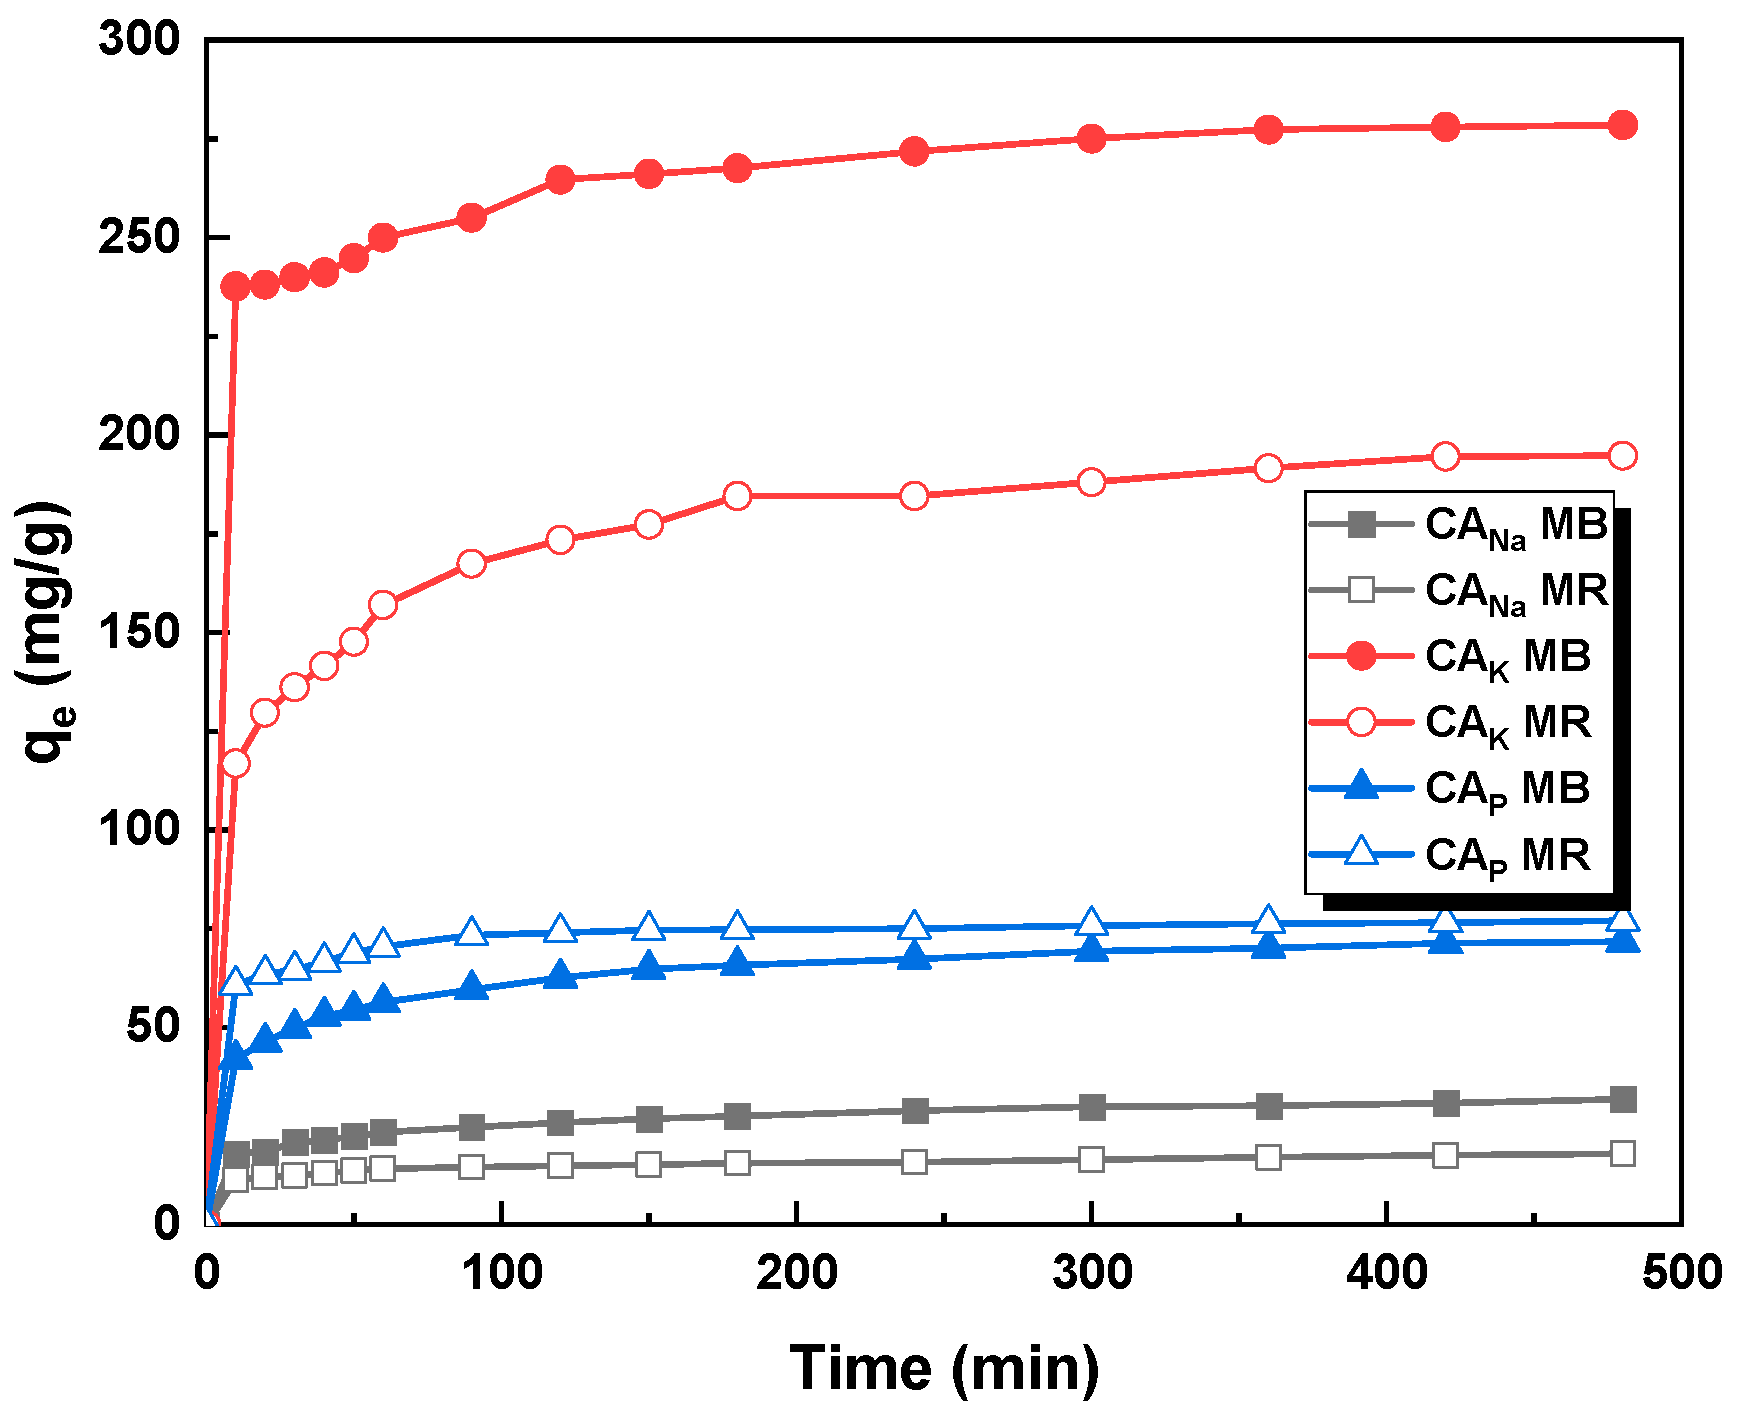
2.3. Adsorption of Dyes
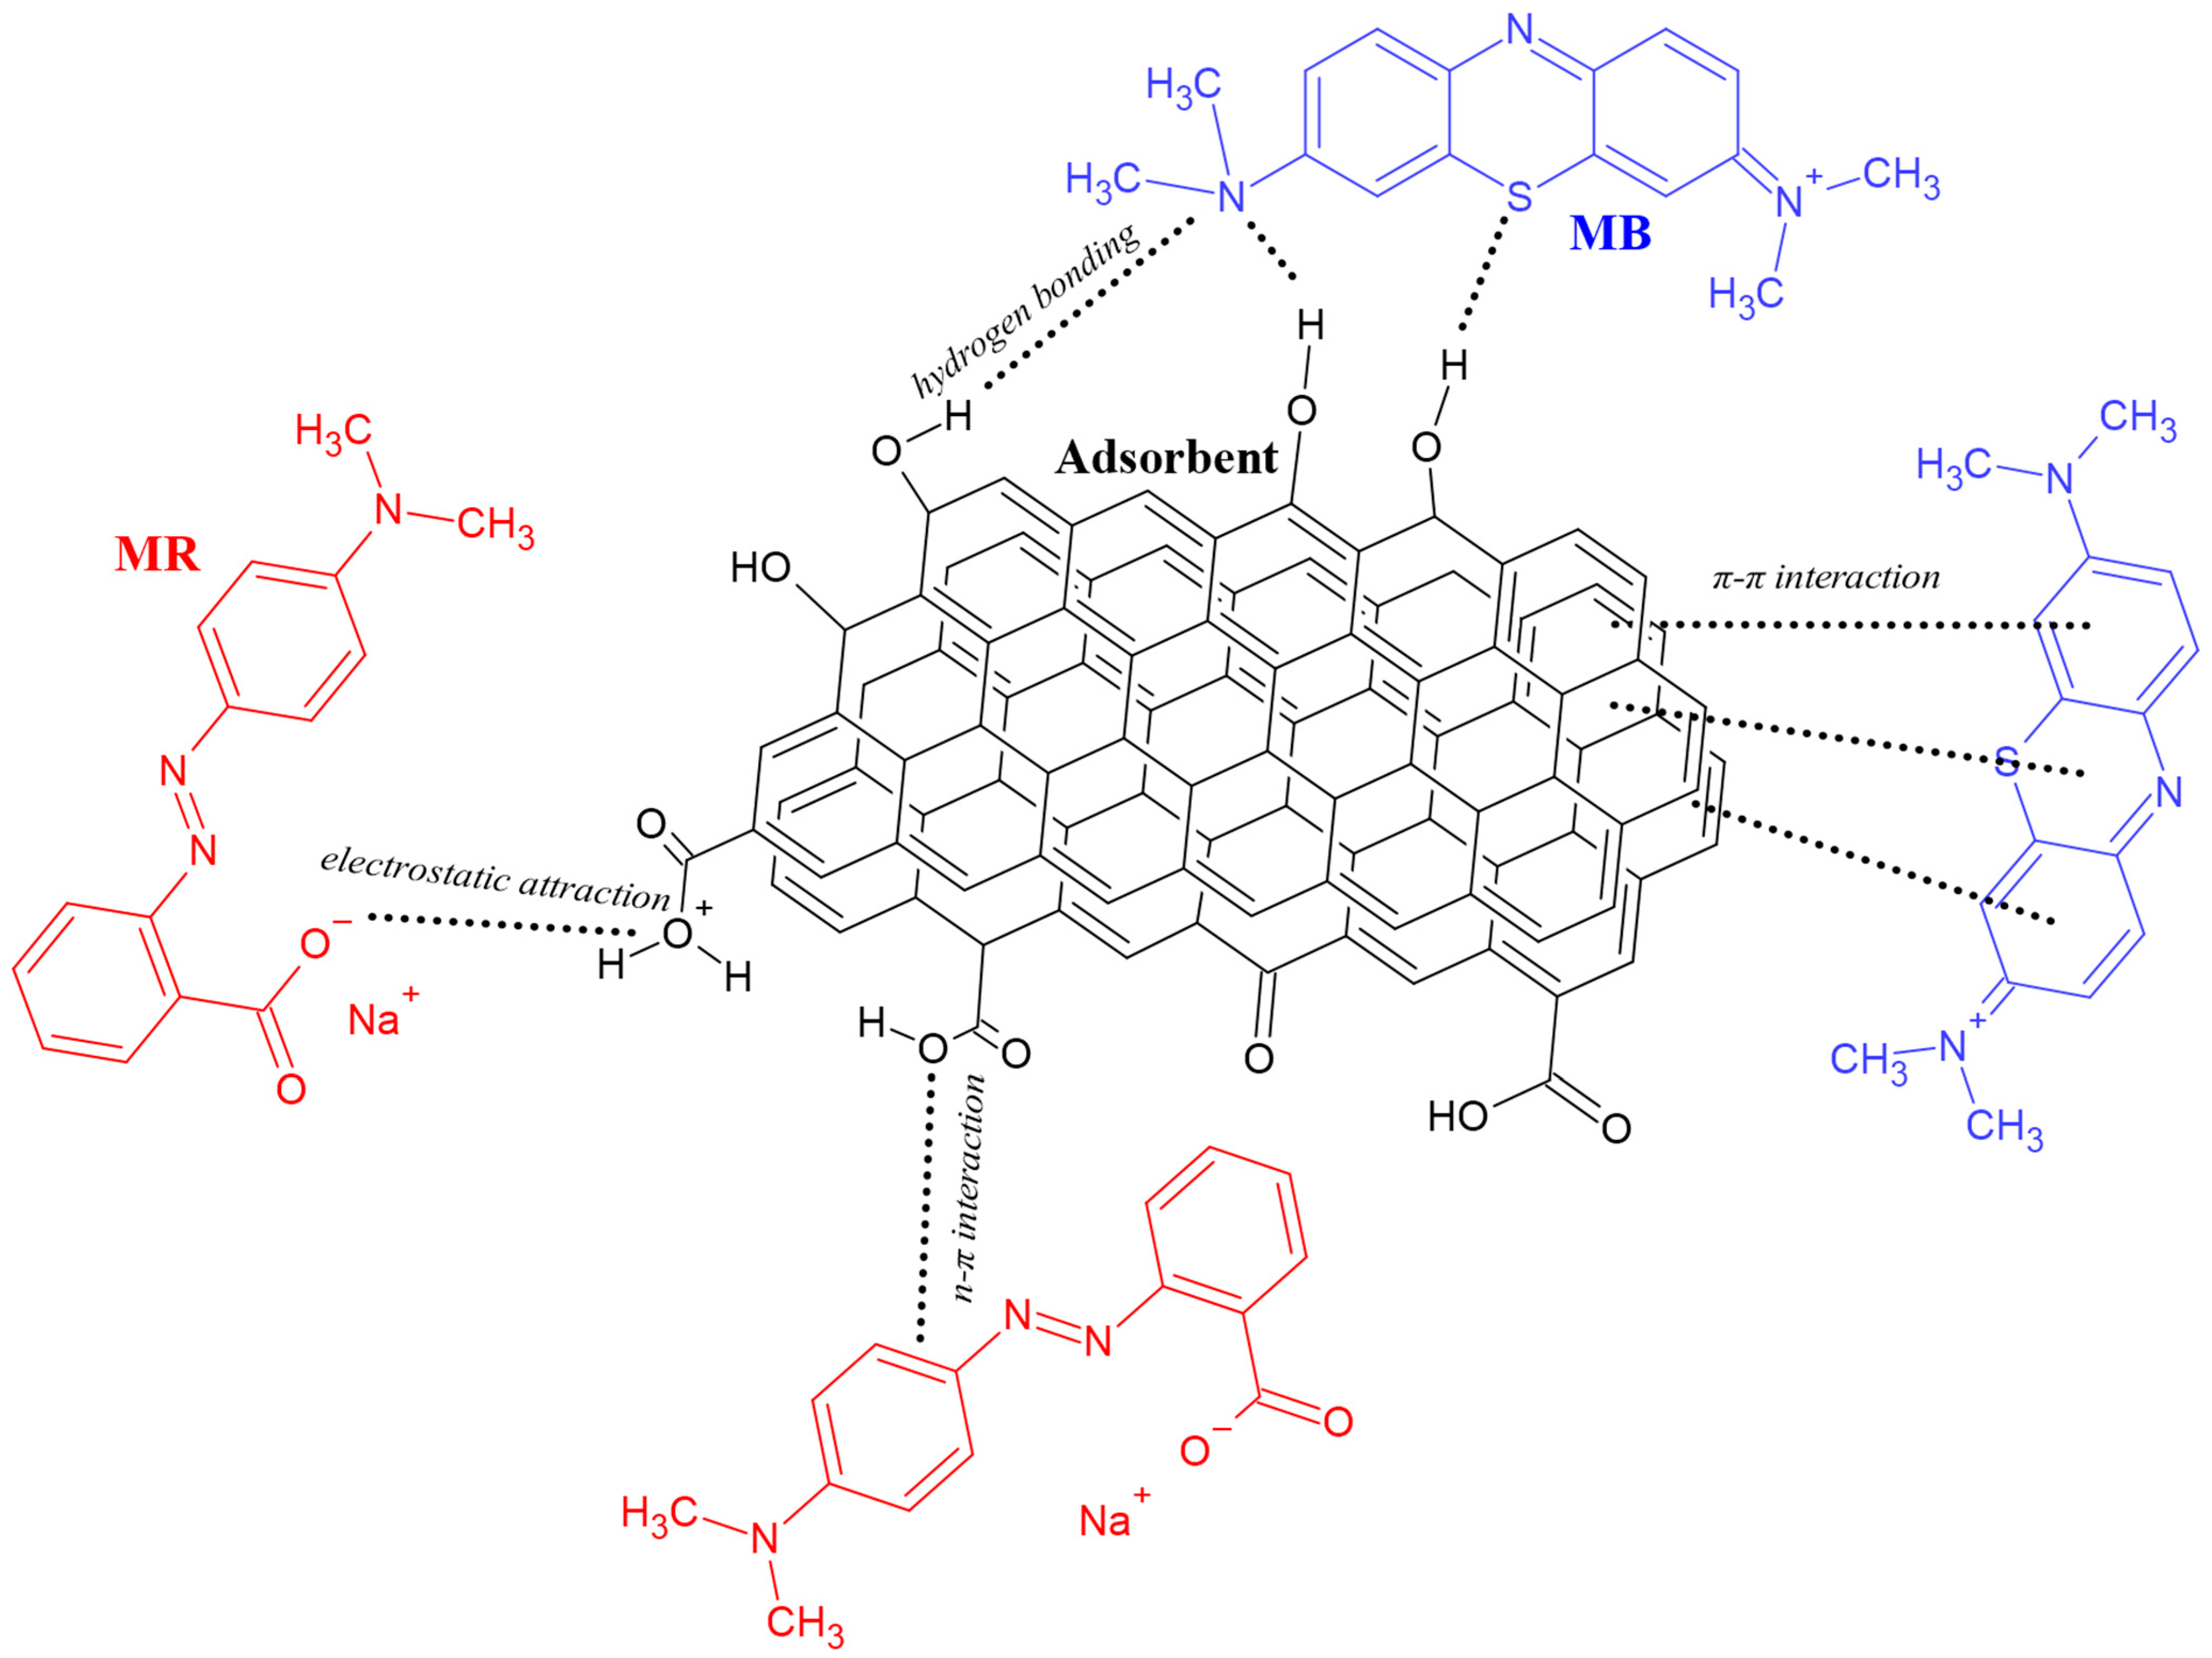
2.4. Mechanism of Adsorption
3. Materials and Methods
3.1. Materials
3.2. Characterization Techniques
3.3. Preparation of Activated Carbons
3.4. Adsorption Studies
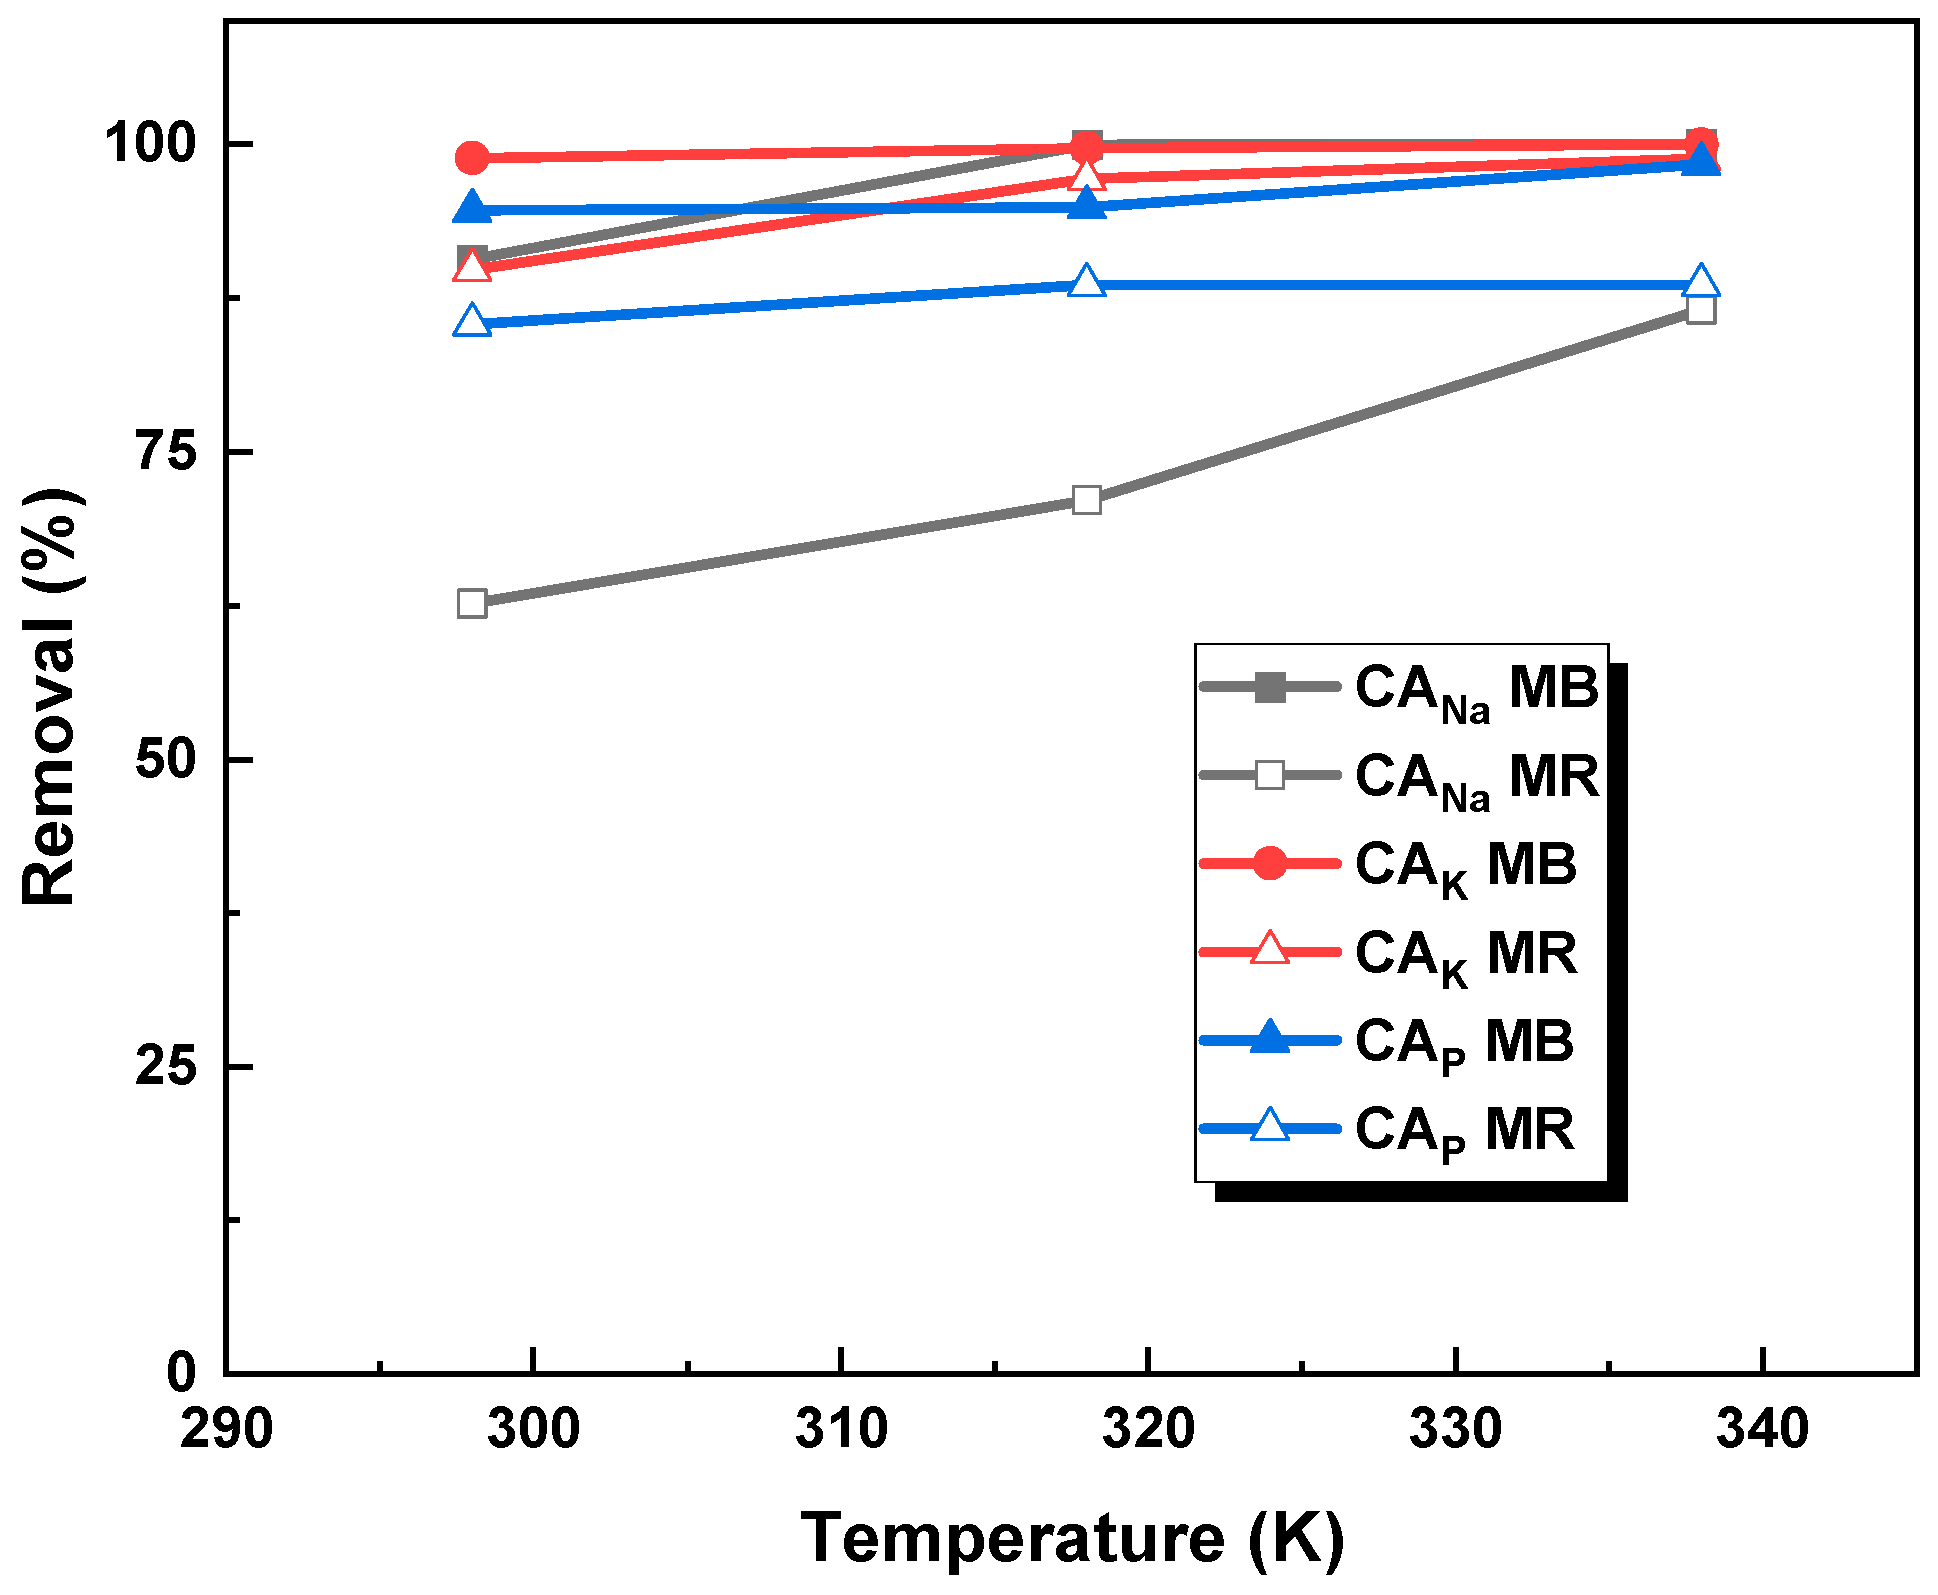
3.5. Thermodynamic Study
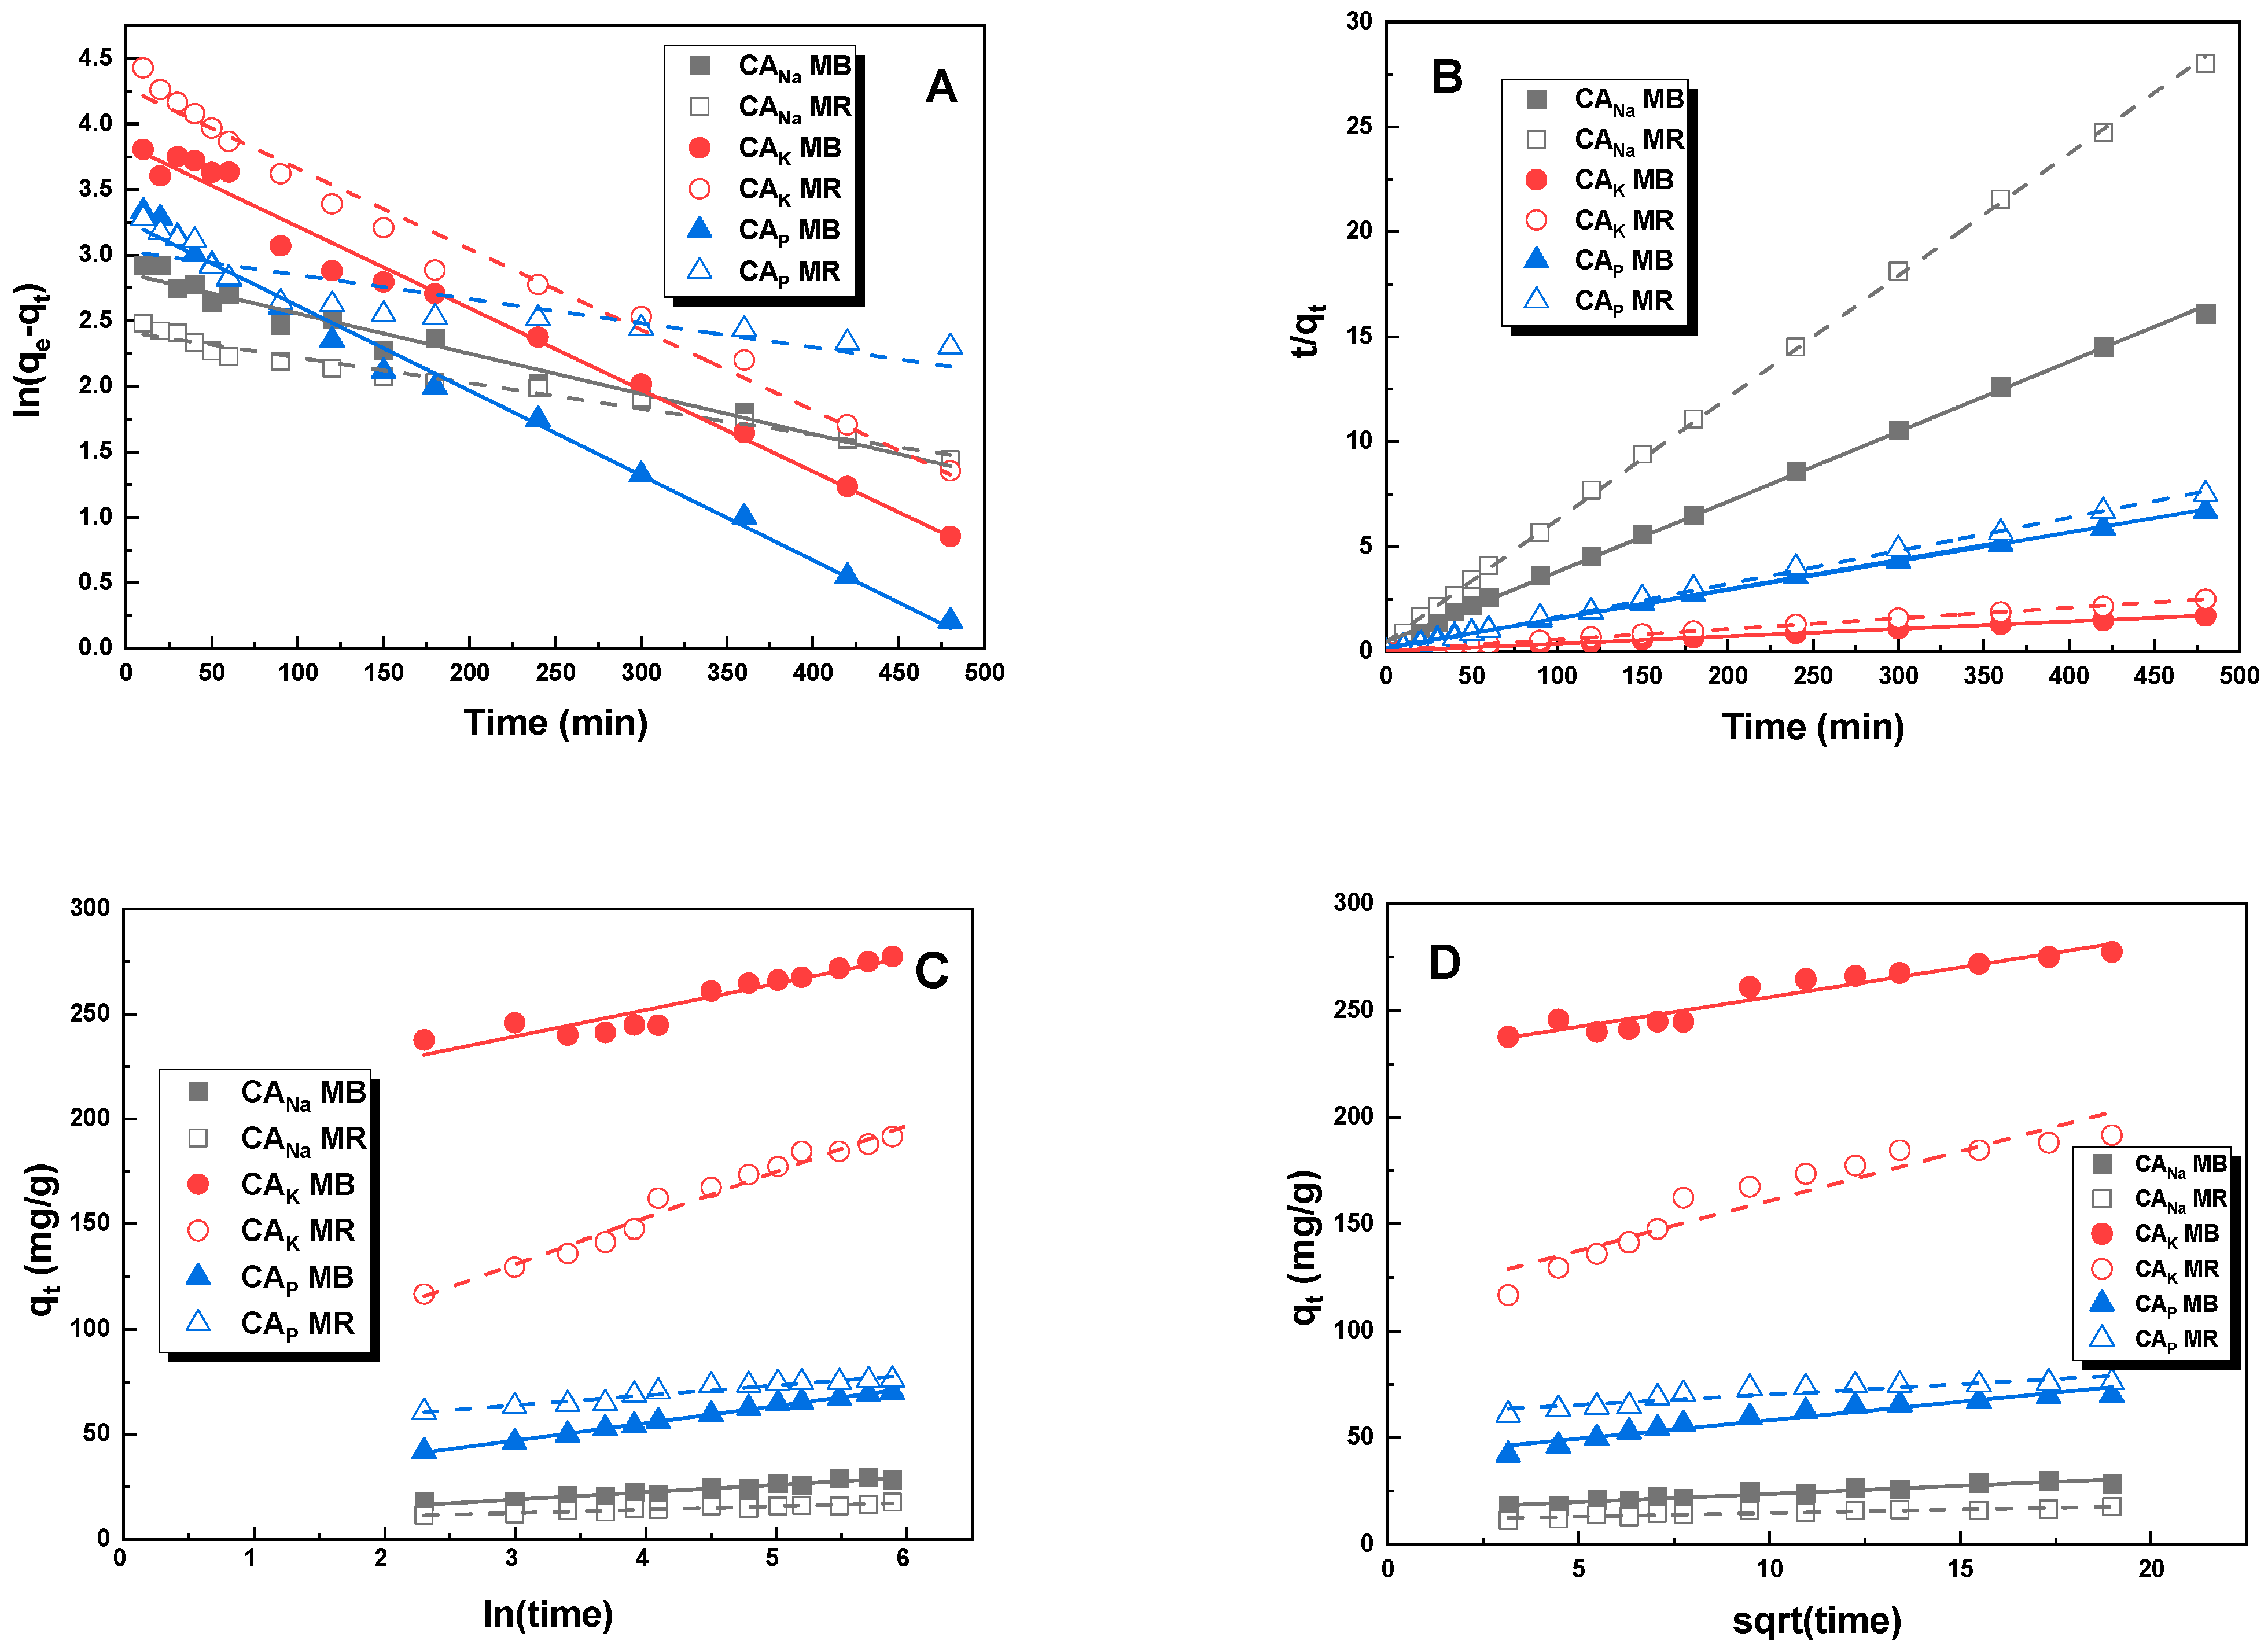
3.6. Adsorption Kinetics
4. Conclusions
Author Contributions
Funding
Institutional Review Board Statement
Informed Consent Statement
Data Availability Statement
Conflicts of Interest
References
- Benkhaya, S.; M’rabet, S.; El Harfi, A. A review on classifications, recent synthesis and applications of textile dyes. Inorg. Chem. Commun. 2020, 115, 107891. [Google Scholar] [CrossRef]
- Ardila-Leal, L.D.; Poutou-Piñales, R.A.; Pedroza-Rodríguez, A.M.; Quevedo-Hidalgo, B.E. A brief history of colour, the environmental impact of synthetic dyes and removal by using laccases. Molecules 2021, 26, 3813. [Google Scholar] [CrossRef] [PubMed]
- Slama, H.B.; Chenari Bouket, A.; Pourhassan, Z.; Alenezi, F.N.; Silini, A.; Cherif-Silini, H.; Belbahri, L. Diversity of synthetic dyes from textile industries, discharge impacts and treatment methods. Appl. Sci. 2021, 11, 6255. [Google Scholar] [CrossRef]
- Islam, T.; Repon, M.R.; Islam, T.; Sarwar, Z.; Rahman, M.M. Impact of textile dyes on health and ecosystem: A review of structure, causes, and potential solutions. Environ. Sci. Pollut. Res. 2023, 30, 9207–9242. [Google Scholar] [CrossRef]
- Bhatia, D.; Sharma, N.R.; Singh, J.; Kanwar, R.S. Biological methods for textile dye removal from wastewater: A review. Crit. Rev. Environ. Sci. Technol. 2017, 47, 1836–1876. [Google Scholar] [CrossRef]
- Tkaczyk, A.; Mitrowska, K.; Posyniak, A. Synthetic organic dyes as contaminants of the aquatic environment and their implications for ecosystems: A review. Sci. Total Environ. 2020, 717, 137222. [Google Scholar] [CrossRef]
- Shindhal, T.; Rakholiya, P.; Varjani, S.; Pandey, A.; Ngo, H.H.; Guo, W.; Taherzadeh, M.J. A critical review on advances in the practices and perspectives for the treatment of dye industry wastewater. Bioengineered 2021, 12, 70–87. [Google Scholar] [CrossRef]
- Vilén, A.; Laurell, P.; Vahala, R. Comparative life cycle assessment of activated carbon production from various raw materials. J. Environ. Manag. 2022, 324, 116356. [Google Scholar] [CrossRef]
- Zhou, Y.; Lu, J.; Zhou, Y.; Liu, Y. Recent advances for dyes removal using novel adsorbents: A review. Environ. Pollut. 2019, 252, 352–365. [Google Scholar] [CrossRef]
- El Maguana, Y.; Elhadiri, N.; Benchanaa, M.; Chikri, R. Activated carbon for dyes removal: Modeling and understanding the adsorption process. J. Chem. 2020, 2020, 2096834. [Google Scholar] [CrossRef]
- Stavropoulos, G.G.; Zabaniotou, A.A. Minimizing activated carbons production cost. Fuel Process. Technol. 2009, 90, 952–957. [Google Scholar] [CrossRef]
- Negara, D.N.K.P.; Nindhia, T.G.T.; Surata, I.W.; Hidajat, F.; Sucipta, M. Textural characteristics of activated carbons derived from tabah bamboo manufactured by using H3PO4 chemical activation. Mater. Today Proc. 2020, 22, 148–155. [Google Scholar] [CrossRef]
- Khan, E.A.; Khan, T.A. Adsorption of methyl red on activated carbon derived from custard apple (Annona squamosa) fruit shell: Equilibrium isotherm and kinetic studies. J. Mol. Liq. 2018, 249, 1195–1211. [Google Scholar] [CrossRef]
- Paluch, D.; Bazan-Wozniak, A.; Pietrzak, R. The effect of activator type on physicochemical and sorption properties of nanostructured carbon adsorbents obtained from fennel seed by chemical activation. Appl. Nanosci. 2023, 1–16. [Google Scholar] [CrossRef]
- González-García, P.; Gamboa-González, S.; Andrade Martinez, I.; Hernández-Quiroz, T. Preparation of activated carbon from water hyacinth stems by chemical activation with K2CO3 and its performance as adsorbent of sodium naproxen. Environ. Prog. Sustain. 2020, 39, e13366. [Google Scholar] [CrossRef]
- Sajjadi, B.; Zubatiuk, T.; Leszczynska, D.; Leszczynski, J.; Chen, W.Y. Chemical activation of biochar for energy and environmental applications: A comprehensive review. Rev. Chem. Eng. 2019, 35, 777–815. [Google Scholar] [CrossRef]
- Thommes, M.; Kaneko, K.; Neimark, A.V.; Olivier, J.P.; Rodriguez-Reinoso, F.; Rouquerol, J.; Sing, K.S. Physisorption of gases, with special reference to the evaluation of surface area and pore size distribution (IUPAC Technical Report). Pure Appl. Chem. 2015, 87, 1051–1069. [Google Scholar] [CrossRef]
- Bazan-Wozniak, A.; Pietrzak, R. Adsorption of organic and inorganic pollutants on activated bio-carbons prepared by chemical activation of residues of supercritical extraction of raw plants. J. Chem. Eng. 2020, 393, 124785. [Google Scholar] [CrossRef]
- Rajoriya, S.; Saharan, V.K.; Pundir, A.S.; Nigam, M.; Roy, K. Adsorption of methyl red dye from aqueous solution onto eggshell waste material: Kinetics, isotherms and thermodynamic studies. Curr. Opin. Green Sustain. Chem. 2021, 4, 100180. [Google Scholar] [CrossRef]
- Djilani, C.; Zaghdoudi, R.; Djazi, F.; Bouchekima, B.; Lallam, A.; Modarressi, A.; Rogalski, M. Adsorption of dyes on activated carbon prepared from apricot stones and commercial activated carbon. J. Taiwan Inst. Chem. Eng. 2015, 53, 112–121. [Google Scholar] [CrossRef]
- Mbarki, F.; Selmi, T.; Kesraoui, A.; Seffen, M. Low-cost activated carbon preparation from Corn stigmata fibers chemically activated using H3PO4, ZnCl2 and KOH: Study of methylene blue adsorption, stochastic isotherm and fractal kinetic. Ind. Crops Prod. 2022, 178, 114546. [Google Scholar] [CrossRef]
- Rosli, N.A.; Ahmad, M.A.; Noh, T.U.; Ahmad, N.A. Pineapple peel–derived carbon for adsorptive removal of dyes. Mater. Chem. Phys. 2023, 306, 128094. [Google Scholar] [CrossRef]
- Alam, M.Z.; Faisal Anwar, A.H.M. Nutrients adsorption onto biochar and alum sludge for treating stormwater. J. Water Environ. Technol. 2020, 18, 132–146. [Google Scholar] [CrossRef]
- Villabona-Ortíz, Á.; Figueroa-Lopez, K.J.; Ortega-Toro, R. Kinetics and adsorption equilibrium in the removal of azo-anionic dyes by modified cellulose. Sustainability 2022, 14, 3640. [Google Scholar] [CrossRef]
- Bello, O.S.; Adegoke, K.A.; Sarumi, O.O.; Lameed, O.S. Functionalized locust bean pod (Parkia biglobosa) activated carbon for Rhodamine B dye removal. Heliyon 2019, 5, e02323. [Google Scholar] [CrossRef] [PubMed]
- Wang, J.; Guo, X. Adsorption kinetic models: Physical meanings, applications, and solving methods. J. Hazard. Mater. 2020, 390, 122156. [Google Scholar] [CrossRef]
- PubChem, Methylene Blue. 2021. Available online: https://pubchem.ncbi.nlm.nih.gov/compound/Methylene-blue (accessed on 17 July 2023).
- PubChem, Methyl Red. 2021. Available online: https://pubchem.ncbi.nlm.nih.gov/compound/Methyl-red (accessed on 17 July 2023).
- Shahrokhi-Shahraki, R.; Benally, C.; El-Din, M.G.; Park, J. High efficiency removal of heavy metals using tire-derived activated carbon vs commercial activated carbon: Insights into the adsorption mechanisms. Chemosphere 2021, 264, 128455. [Google Scholar] [CrossRef]
- Shrestha, L.K.; Thapa, M.; Shrestha, R.G.; Maji, S.; Pradhananga, R.R.; Ariga, K. Rice husk-derived high surface area nanoporous carbon materials with excellent iodine and methylene blue adsorption properties. C 2019, 5, 10. [Google Scholar] [CrossRef]
- Guo, X.; Wang, J. Comparison of linearization methods for modeling the Langmuir adsorption isotherm. J. Mol. Liq. 2019, 296, 111850. [Google Scholar] [CrossRef]
- Kalam, S.; Abu-Khamsin, S.A.; Kamal, M.S.; Patil, S. Surfactant adsorption isotherms: A review. ACS Omega 2021, 6, 32342–32348. [Google Scholar] [CrossRef]
- Selambakkannu, S.; Othman, N.A.F.; Bakar, K.A.; Ming, T.T.; Segar, R.D.; Karim, Z.A. Modification of radiation grafted banana trunk fibers for adsorption of anionic dyes. Fibers Polym. 2019, 20, 2556–2569. [Google Scholar] [CrossRef]
- Marciniak, M.; Goscianska, J.; Norman, M.; Jesionowski, T.; Bazan-Wozniak, A.; Pietrzak, R. Equilibrium, kinetic, and thermodynamic studies on adsorption of rhodamine B from aqueous solutions using oxidized mesoporous carbons. Materials 2022, 15, 5573. [Google Scholar] [CrossRef] [PubMed]
- Chien, S.H.; Clayton, W.R. Application of Elovich equation to the kinetics of phosphate release and sorption in soils. Soil Sci. Soc. Am. J. 1980, 44, 265–268. [Google Scholar] [CrossRef]
- Obey, G.; Adelaide, M.; Ramaraj, R. Biochar derived from non-customized matamba fruit shell as an adsorbent for wastewater treatment. J. Bioresour. Bioprod. 2022, 7, 109–115. [Google Scholar] [CrossRef]
- Masinga, T.; Moyo, M.; Pakade, V.E. Removal of hexavalent chromium by polyethyleneimine impregnated activated carbon: Intra-particle diffusion, kinetics and isotherms. J. Mater. Res. Technol. 2022, 18, 1333–1344. [Google Scholar] [CrossRef]


| Sample | % N | % C | % H | % S | % O * | % Ash |
|---|---|---|---|---|---|---|
| Caraway seed | 2.89 | 52.72 | 7.41 | 0.44 | 36.54 | 4.67 |
| CANa | 4.39 | 76.25 | 1.60 | 0.55 | 17.21 | 2.09 |
| CAK | 2.83 | 74.89 | 1.91 | 0.23 | 20.14 | 0.53 |
| CAP | 1.71 | 73.76 | 2.66 | 0.58 | 21.29 | 9.79 |
| Sample | Surface Area 1 (m2/g) | Pore Volume (cm3/g) | Vm/Vt | Average Pore Size (nm) | Iodine Number (mg/g) | ||
|---|---|---|---|---|---|---|---|
| Total | Microporous | Total | Microporous | ||||
| CANa | 269 | 224 | 0.55 | 0.12 | 0.22 | 7.61 | 278 |
| CAK | 926 | 865 | 0.65 | 0.47 | 0.73 | 2.80 | 1107 |
| CAP | 580 | 411 | 0.67 | 0.23 | 0.34 | 4.15 | 1103 |
| Sample | Acidic Oxygen Functional Groups (mmol/g) | Basic Oxygen Functional Groups (mmol/g) | pH |
|---|---|---|---|
| Caraway seed | 5.19 | 3.34 | 6.6 |
| CANa | 2.15 | 0.70 | 6.3 |
| CAK | 1.60 | 0.35 | 5.3 |
| CAP | 2.05 | 0.35 | 3.0 |
| Precursor | Activator | Precursor: Activator Ratio | Activation Temperature (°C) | Total Surface Area (m2/g) | Dye | Sorption Capacity (mg/g) | Source |
|---|---|---|---|---|---|---|---|
| Caraway seed | Na2CO3 | 1:2 | 700 | 269 | MR | 28 | This study |
| MB | 37 | ||||||
| K2CO3 | 1:2 | 700 | 926 | MR | 203 | ||
| MB | 296 | ||||||
| H3PO4 | 1:2 | 500 | 580 | MR | 98 | ||
| MB | 87 | ||||||
| Fennel seed | Na2CO3 | 1:2 | 700 | 345 | MB | 77 | [14] |
| K2CO3 | 1:2 | 700 | 1052 | MB | 474 | ||
| H3PO4 | 1:2 | 500 | 518 | MB | 122 | ||
| Pineapple peel | KOH | 1:3 | 700 | 1160 | MR | 95 | [12] |
| MB | 165 | ||||||
| Green tea leaves | Na2CO3 | 1:2 | 700 | 254 | MR | 70 | [18] |
| MB | 85 | ||||||
| Corn Stigmata | H3PO4 | 1:2 | 500 | 820 | MB | 331 | [21] |
| Custard apple fruit shell | H3PO4 | 1:1.5 | 700 | 1065 | MR | 435 | [13] |
| Sample | Dye | qe (mg/g) | Langmuir | Freundlich | |||||||
|---|---|---|---|---|---|---|---|---|---|---|---|
| R2 | qmax (mg/g) | KL (L/mg) | Reduced Chi- Square | RL | R2 | KF (mg/g(L/mg)1/n) | 1/n | Reduced Chi- Square | |||
| CANa | MB | 36 | 0.999 | 36 | 13.24 | 6.87 × 10⁻¹⁰ | 6.02 × 10⁻³ | 0.973 | 34.72 | 0.02 | 4.66 × 10⁻⁶ |
| CAK | 296 | 0.997 | 298 | 1.36 | 5.96 × 10⁻¹¹ | 4.80 × 10⁻³ | 0.898 | 272.79 | 0.05 | 2.53 × 10⁻⁵ | |
| CAP | 94 | 0.997 | 94 | 1.91 | 3.28 × 10⁻⁸ | 1.04 × 10⁻² | 0.967 | 69.18 | 0.01 | 5.34 × 10⁻⁴ | |
| CANa | MR | 28 | 0.948 | 30 | 0.48 | 6.60 × 10⁻⁷ | 4.91 × 10⁻² | 0.993 | 18.97 | 0.10 | 1.43 × 10⁻⁵ |
| CAK | 202 | 0.907 | 208 | 3.72 | 3.14 × 10⁻⁹ | 1.32 × 10⁻³ | 0.998 | 176.81 | 0.05 | 8.44 × 10⁻⁷ | |
| CAP | 87 | 0.935 | 120 | 0.28 | 1.28 × 10⁻⁷ | 5.25 × 10⁻² | 0.999 | 73.40 | 0.10 | 5.95 × 10⁻⁶ | |
| Sample | Dye | Temperature (K) | Kd | ∆G0 (kJ/mol) | ∆H0 (kJ/mol) | ∆S0 (J/mol × K) |
|---|---|---|---|---|---|---|
| CANa | MB | 298 | 20.85 | −7.34 | 217.16 | 753.96 |
| 318 | 5.17 × 10³ | −23.04 | ||||
| 338 | 6.67 × 10⁵ | −37.44 | ||||
| CAK | 298 | 177.36 | −12.83 | 28.06 | 137.20 | |
| 318 | 361.54 | −17.22 | ||||
| 338 | 677.42 | −15.93 | ||||
| CAP | 298 | 29.05 | −8.82 | 25.54 | 113.70 | |
| 318 | 55.55 | −9.55 | ||||
| 338 | 98.37 | −13.50 | ||||
| CANa | MR | 298 | 3.00 | −2.98 | 27.93 | 102.88 |
| 318 | 6.10 | −4.20 | ||||
| 338 | 11.40 | −7.17 | ||||
| CAK | 298 | 18.61 | −7.11 | 47.63 | 184.15 | |
| 318 | 62.36 | −11.23 | ||||
| 338 | 181.09 | −14.44 | ||||
| CAP | 298 | 12.10 | −6.07 | 6.12 | 41.26 | |
| 318 | 14.13 | −7.24 | ||||
| 338 | 16.20 | −7.69 |
| Sample | Dye | qe (mg/g) | Pseudo-First-Order Kinetic | Pseudo-Second-Order Kinetic | ||||||
|---|---|---|---|---|---|---|---|---|---|---|
| k1 (1/min) | R2 | qe/cal (mg/g) | Reduced Chi- Square | k2 (g/mg × min) | R2 | qe/cal (mg/g) | Reduced Chi- Square | |||
| CANa | MB | 37 | 5.94 × 10⁻⁶ | 0.956 | 17 | 6.19 × 10⁻³ | 1.90 × 10⁻³ | 0.998 | 33 | 4.02 × 10⁻² |
| CAK | 277 | 1.74 × 10⁻⁵ | 0.970 | 47 | 1.42 × 10⁻² | 7.32 × 10⁻³ | 0.999 | 279 | 1.47 × 10⁻⁴ | |
| CAP | 73 | 1.33 × 10⁻⁵ | 0.986 | 26 | 9.76 × 10⁻³ | 2.54 × 10⁻³ | 0.999 | 73 | 6.62 × 10⁻³ | |
| CANa | MR | 23 | 3.83 × 10⁻⁶ | 0.938 | 11 | 2.87 × 10⁻³ | 3.32 × 10⁻³ | 0.997 | 18 | 4.70 × 10⁻² |
| CAK | 201 | 2.38 × 10⁻³ | 0.949 | 67 | 1.77 × 10⁻² | 2.93 × 10⁻³ | 0.999 | 199 | 6.23 × 10⁻⁴ | |
| CAP | 76 | 7.86 × 10⁻⁶ | 0.770 | 23 | 2.76 × 10⁻² | 9.01 × 10⁻³ | 0.999 | 74 | 9.30 × 10⁻³ | |
| Sample | Dye | Elovich | Intraparticle Diffusion Model | ||||||
|---|---|---|---|---|---|---|---|---|---|
| α (mg/g × min) | R2 | β (g/mg) | Reduced Chi- Square | kid (mg/g × min1/2) | R2 | C (mg/g) | Reduced Chi- Square | ||
| CANa | MB | 0.267 | 0.948 | 28.72 | 1.13 | 0.763 | 0.927 | 16.12 | 18.81 |
| CAK | 0.080 | 0.886 | 351.28 | 26.62 | 2.78 | 0.920 | 228.49 | 18.81 | |
| CAP | 0.124 | 0.995 | 143.16 | 0.48 | 1.73 | 0.930 | 40.99 | 1.28 | |
| CANa | MR | 0.623 | 0.927 | 207.50 | 0.29 | 4.63 | 0.897 | 114.50 | 68.62 |
| CAK | 0.046 | 0.978 | 431.06 | 15.11 | 0.33 | 0.847 | 11.44 | 0.56 | |
| CAP | 0.202 | 0.941 | 11.49 | 1.80 | 0.968 | 0.830 | 60.65 | 5.34 | |
| Dye | Chemical Formula | Structure | Mass (g/mol) | λmax (nm) |
|---|---|---|---|---|
| Methylene blue | [C16H18N3S]+Cl− | 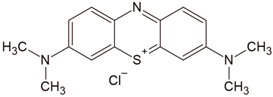 | 319.85 | 665 |
| Methyl red sodium salt | [C15H14N3O2]−Na+ | 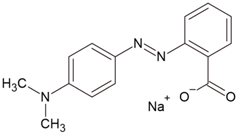 | 291.31 | 443 |
Disclaimer/Publisher’s Note: The statements, opinions and data contained in all publications are solely those of the individual author(s) and contributor(s) and not of MDPI and/or the editor(s). MDPI and/or the editor(s) disclaim responsibility for any injury to people or property resulting from any ideas, methods, instructions or products referred to in the content. |
© 2023 by the authors. Licensee MDPI, Basel, Switzerland. This article is an open access article distributed under the terms and conditions of the Creative Commons Attribution (CC BY) license (https://creativecommons.org/licenses/by/4.0/).
Share and Cite
Paluch, D.; Bazan-Wozniak, A.; Nosal-Wiercińska, A.; Pietrzak, R. Removal of Methylene Blue and Methyl Red from Aqueous Solutions Using Activated Carbons Obtained by Chemical Activation of Caraway Seed. Molecules 2023, 28, 6306. https://doi.org/10.3390/molecules28176306
Paluch D, Bazan-Wozniak A, Nosal-Wiercińska A, Pietrzak R. Removal of Methylene Blue and Methyl Red from Aqueous Solutions Using Activated Carbons Obtained by Chemical Activation of Caraway Seed. Molecules. 2023; 28(17):6306. https://doi.org/10.3390/molecules28176306
Chicago/Turabian StylePaluch, Dorota, Aleksandra Bazan-Wozniak, Agnieszka Nosal-Wiercińska, and Robert Pietrzak. 2023. "Removal of Methylene Blue and Methyl Red from Aqueous Solutions Using Activated Carbons Obtained by Chemical Activation of Caraway Seed" Molecules 28, no. 17: 6306. https://doi.org/10.3390/molecules28176306
APA StylePaluch, D., Bazan-Wozniak, A., Nosal-Wiercińska, A., & Pietrzak, R. (2023). Removal of Methylene Blue and Methyl Red from Aqueous Solutions Using Activated Carbons Obtained by Chemical Activation of Caraway Seed. Molecules, 28(17), 6306. https://doi.org/10.3390/molecules28176306