
Quantitative and Differential Analysis between Bupleurum chinense DC. and Bupleurum scorzonerifolium Willd. Using HPLC-MS and GC-MS Coupled with Multivariate Statistical Analysis

Abstract
1. Introduction
2. Results and Discussion
2.1. Differences in Saikosaponin Content between North and South RB
2.1.1. Optimization of Extraction and Analysis Conditions
2.1.2. Results of Method Validation
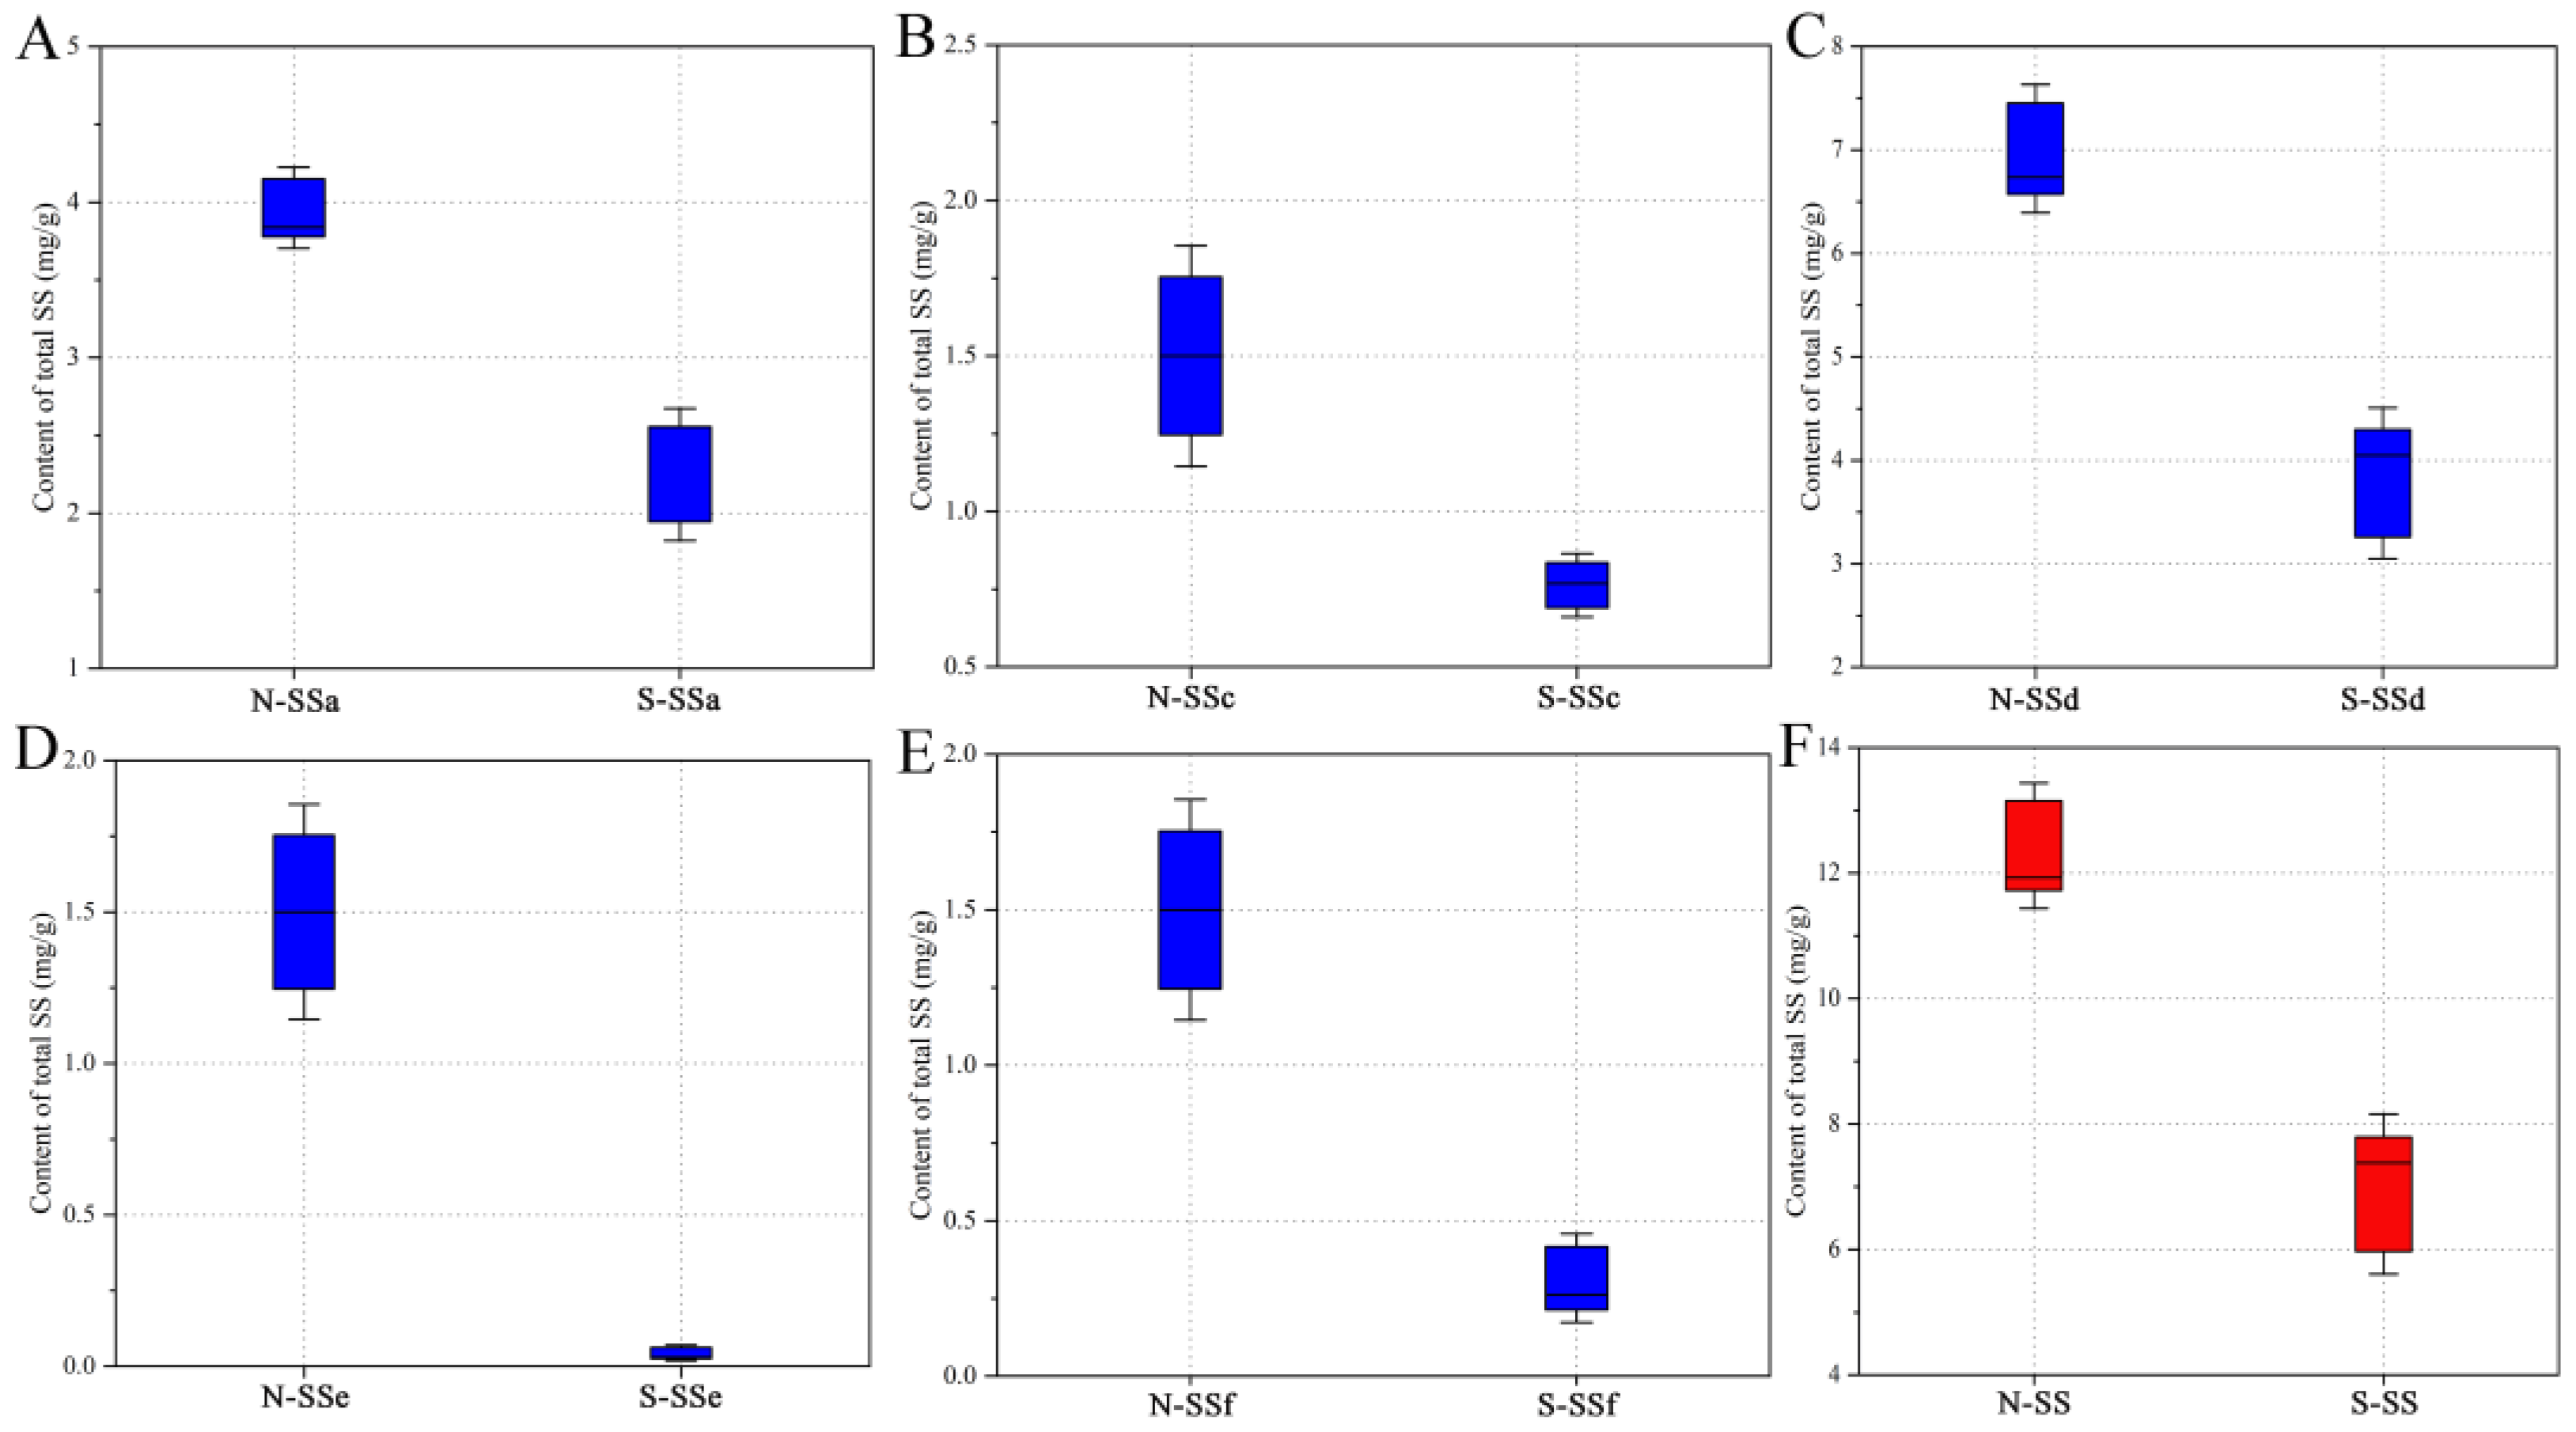
2.1.3. Quantitative Analysis of Saikosaponins in North and South RB
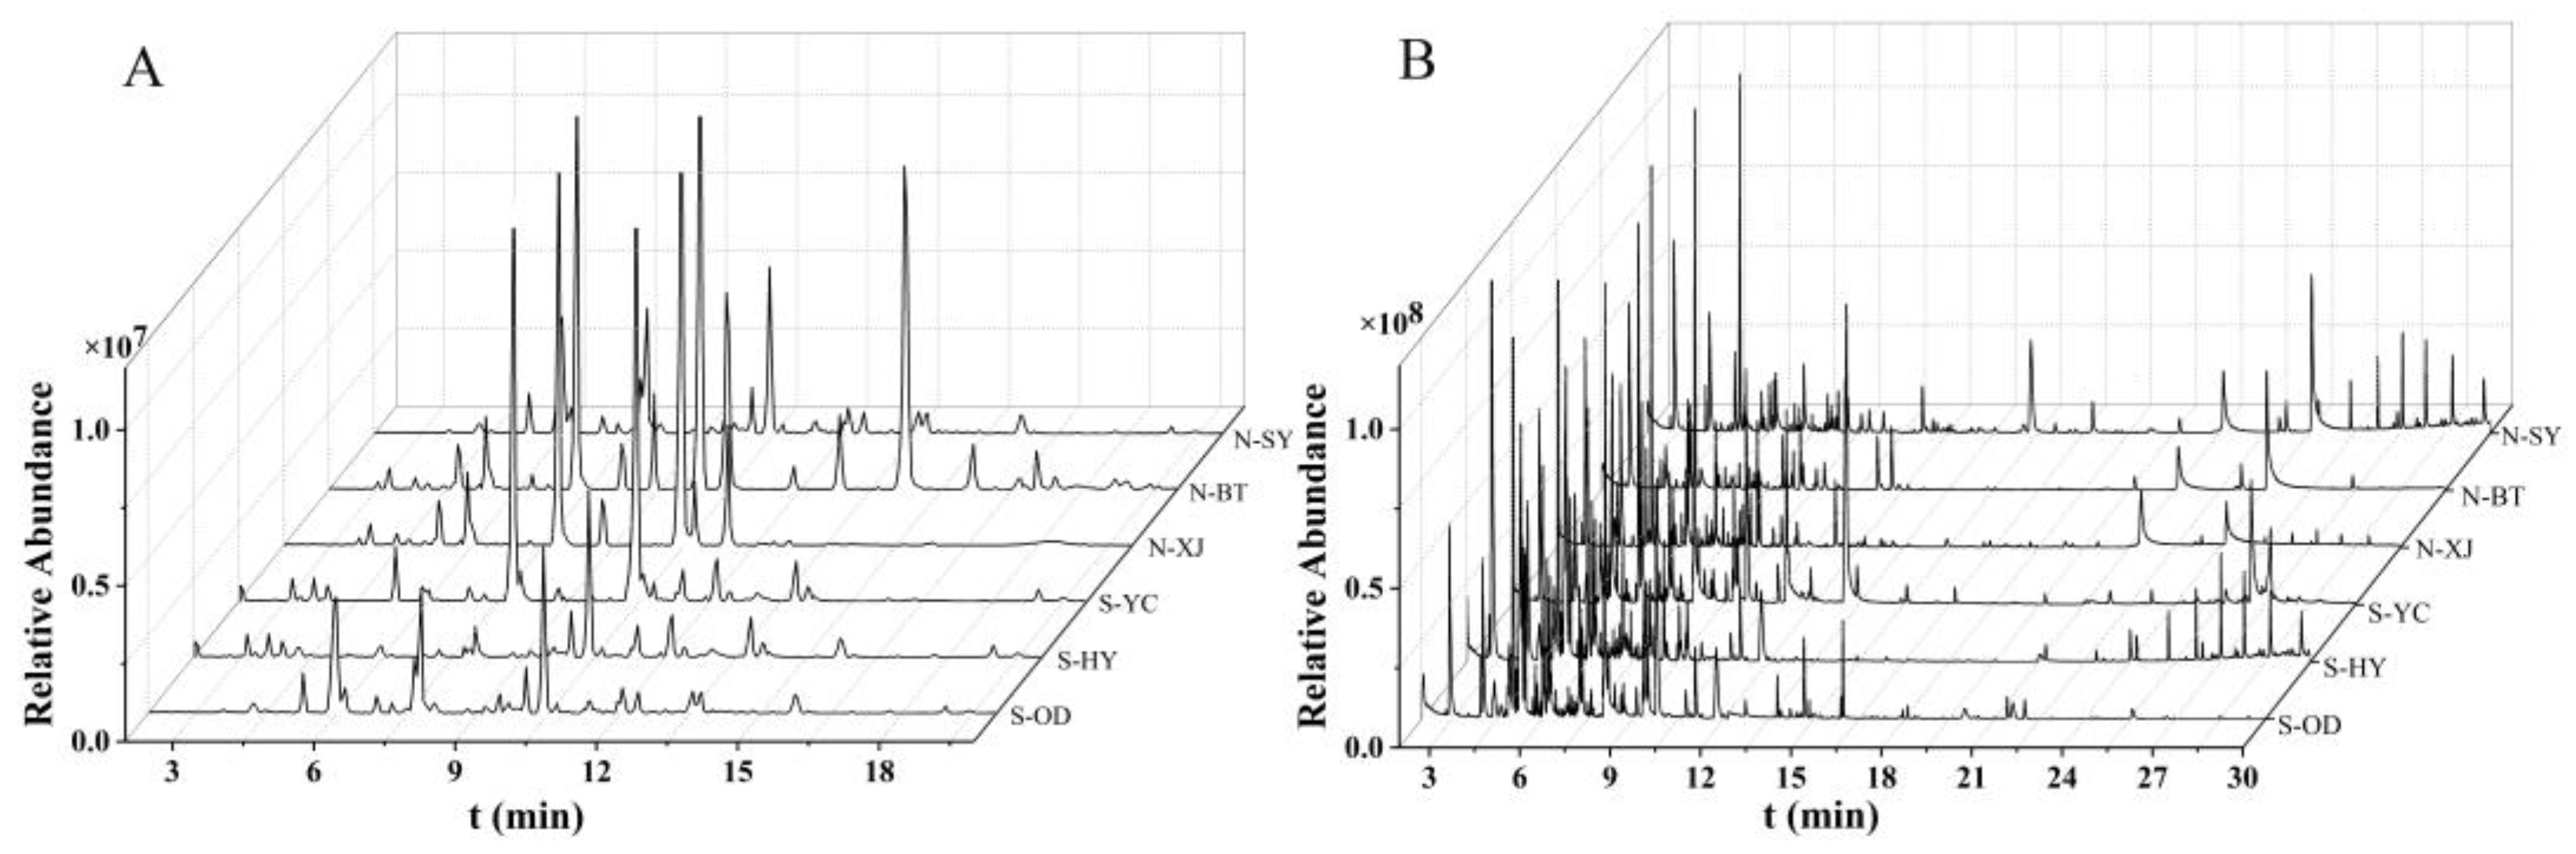
2.2. Differences in Saponin and Volatile Oil Profiles between North and South RB
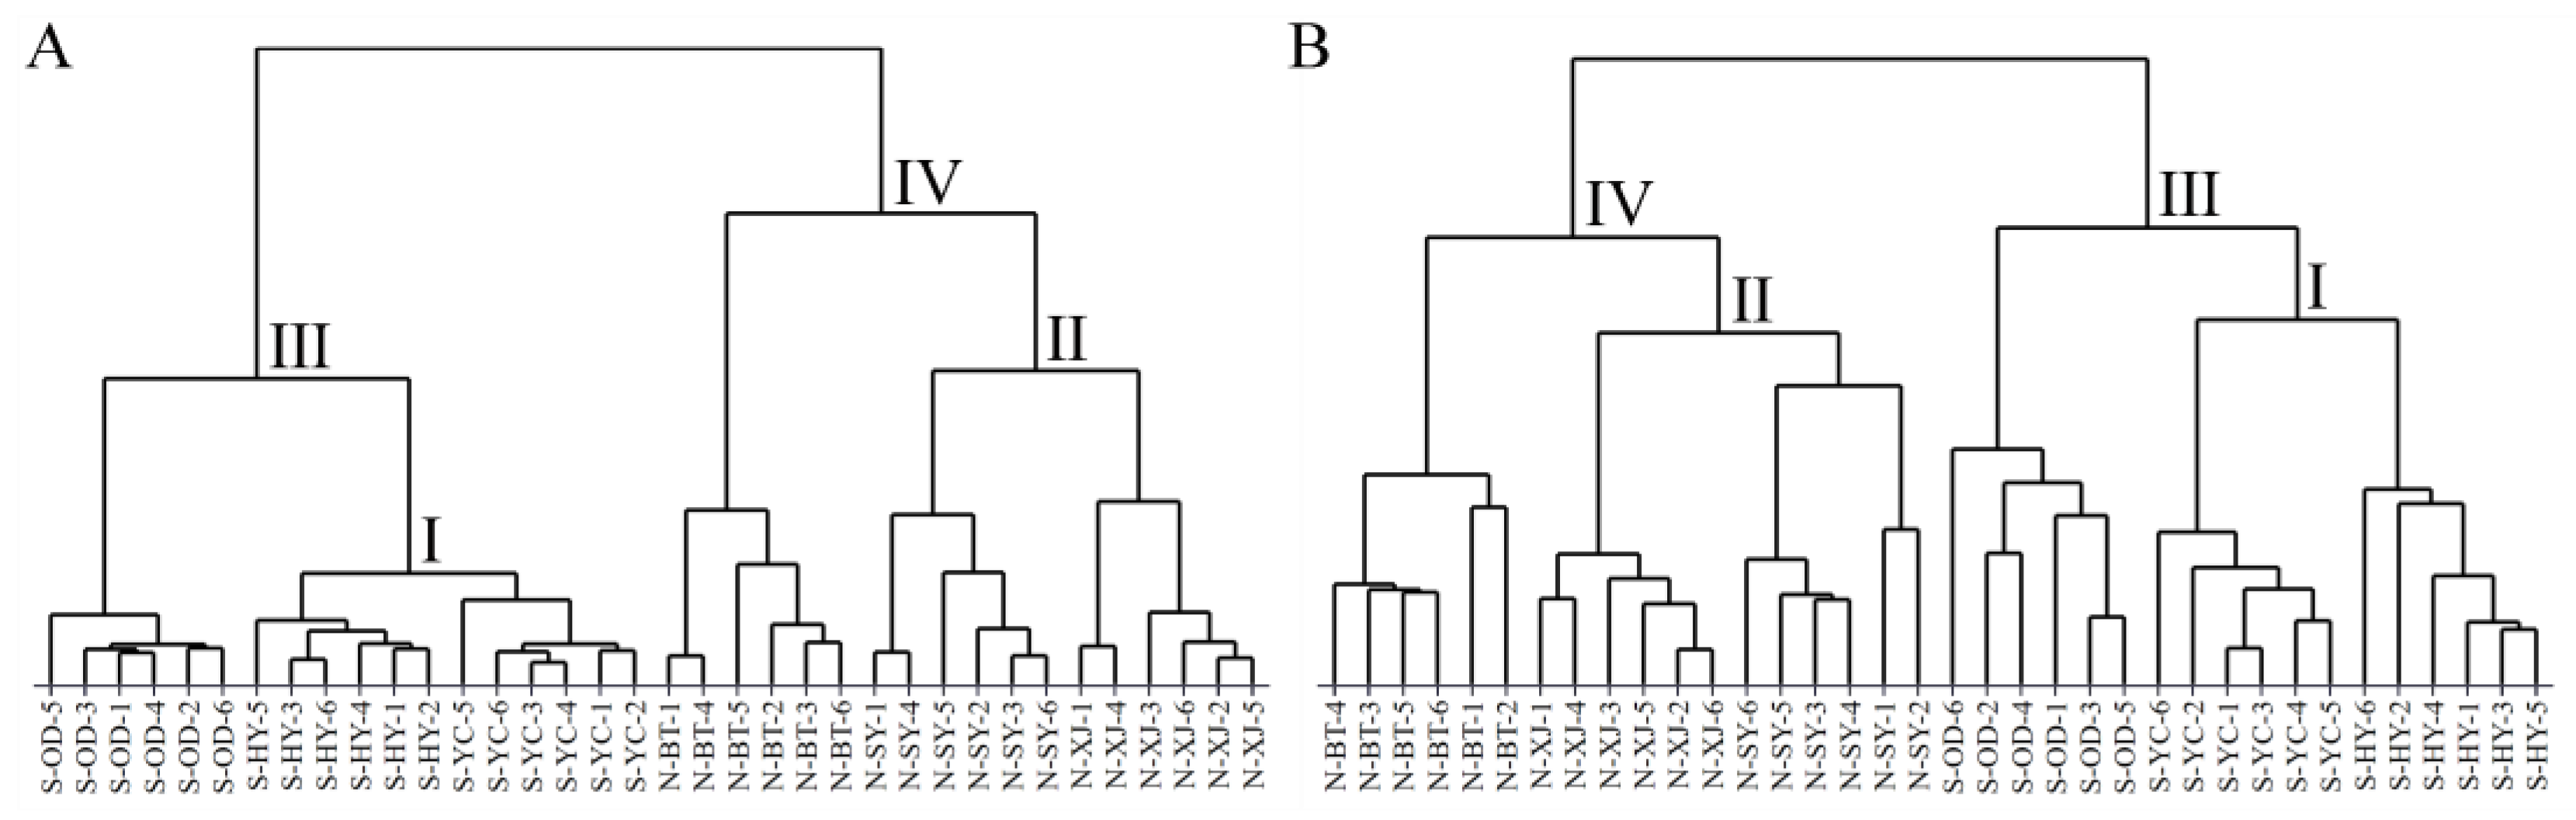
2.2.1. Hierarchical Cluster Analysis (HCA)
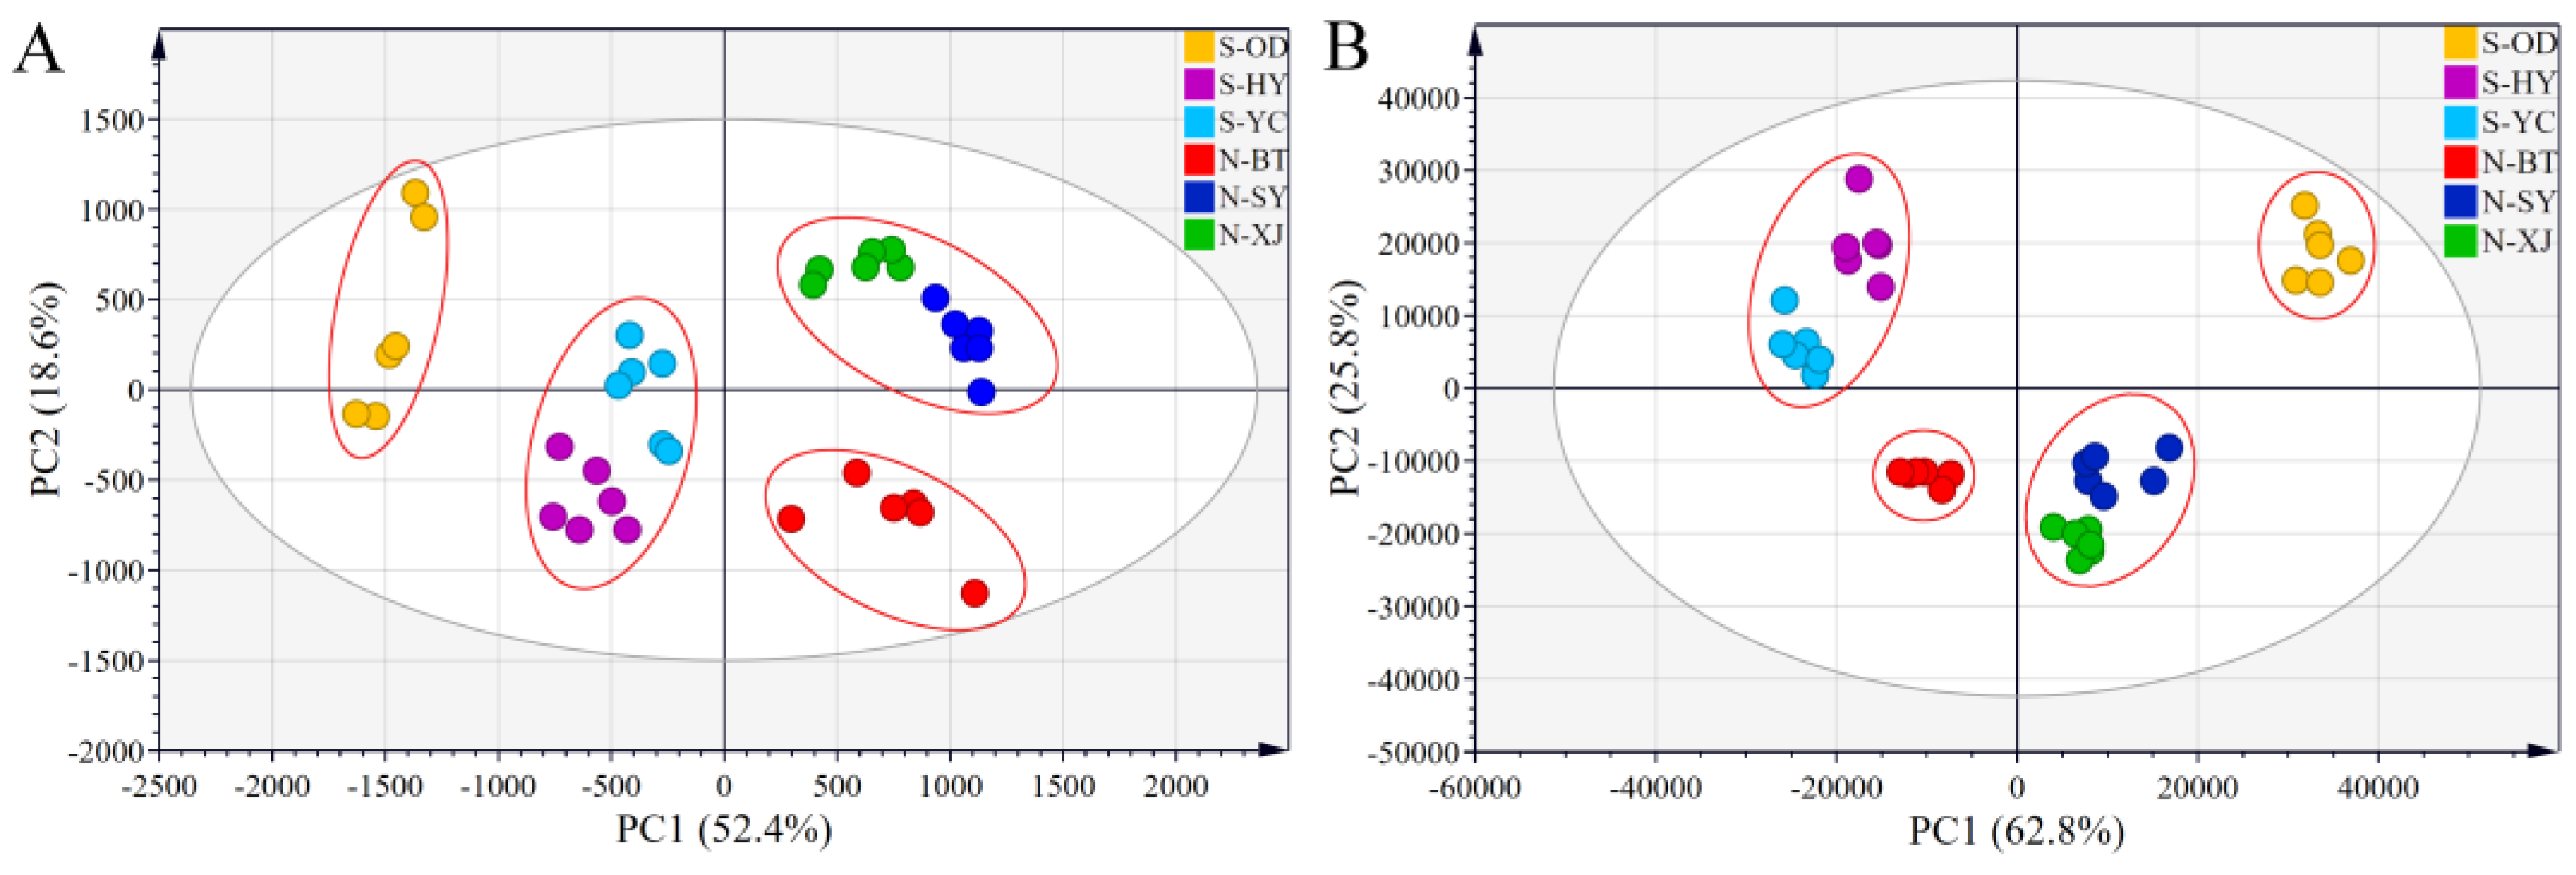
2.2.2. Principal Component Analysis (PCA)
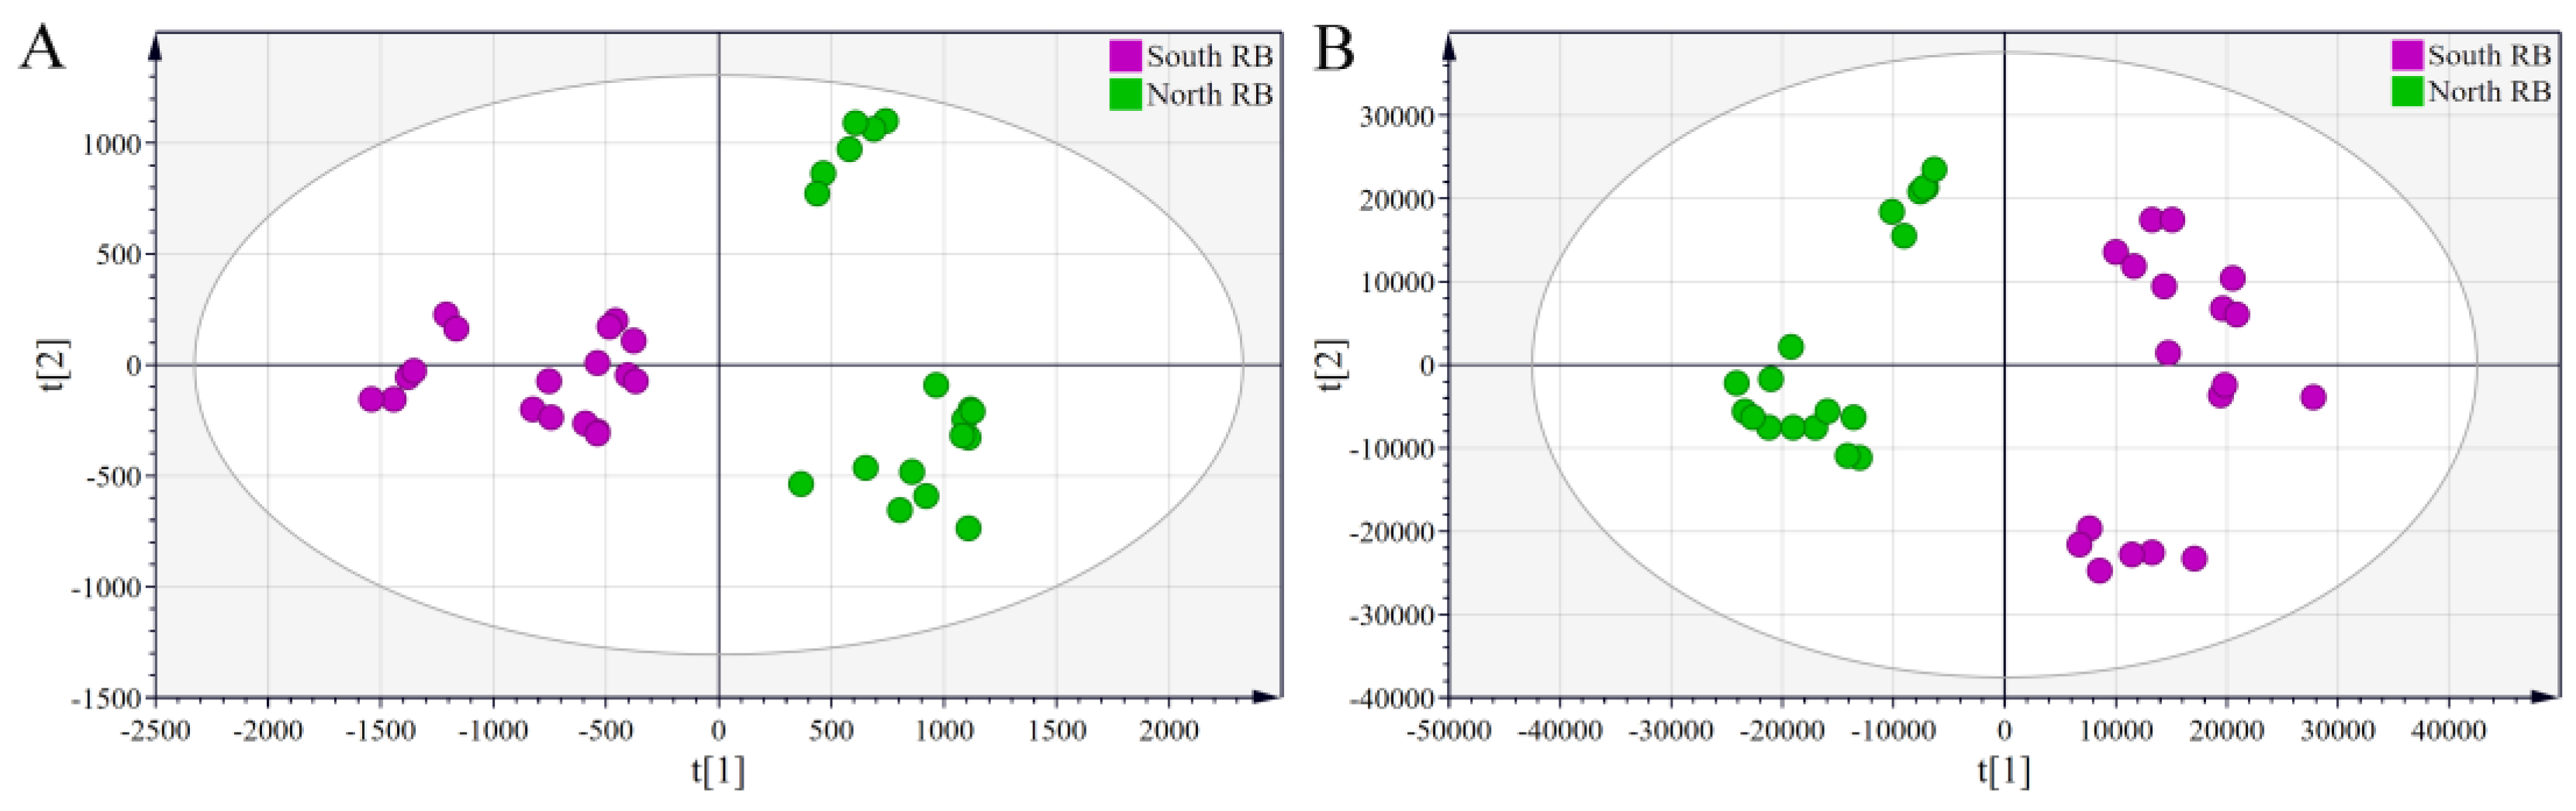
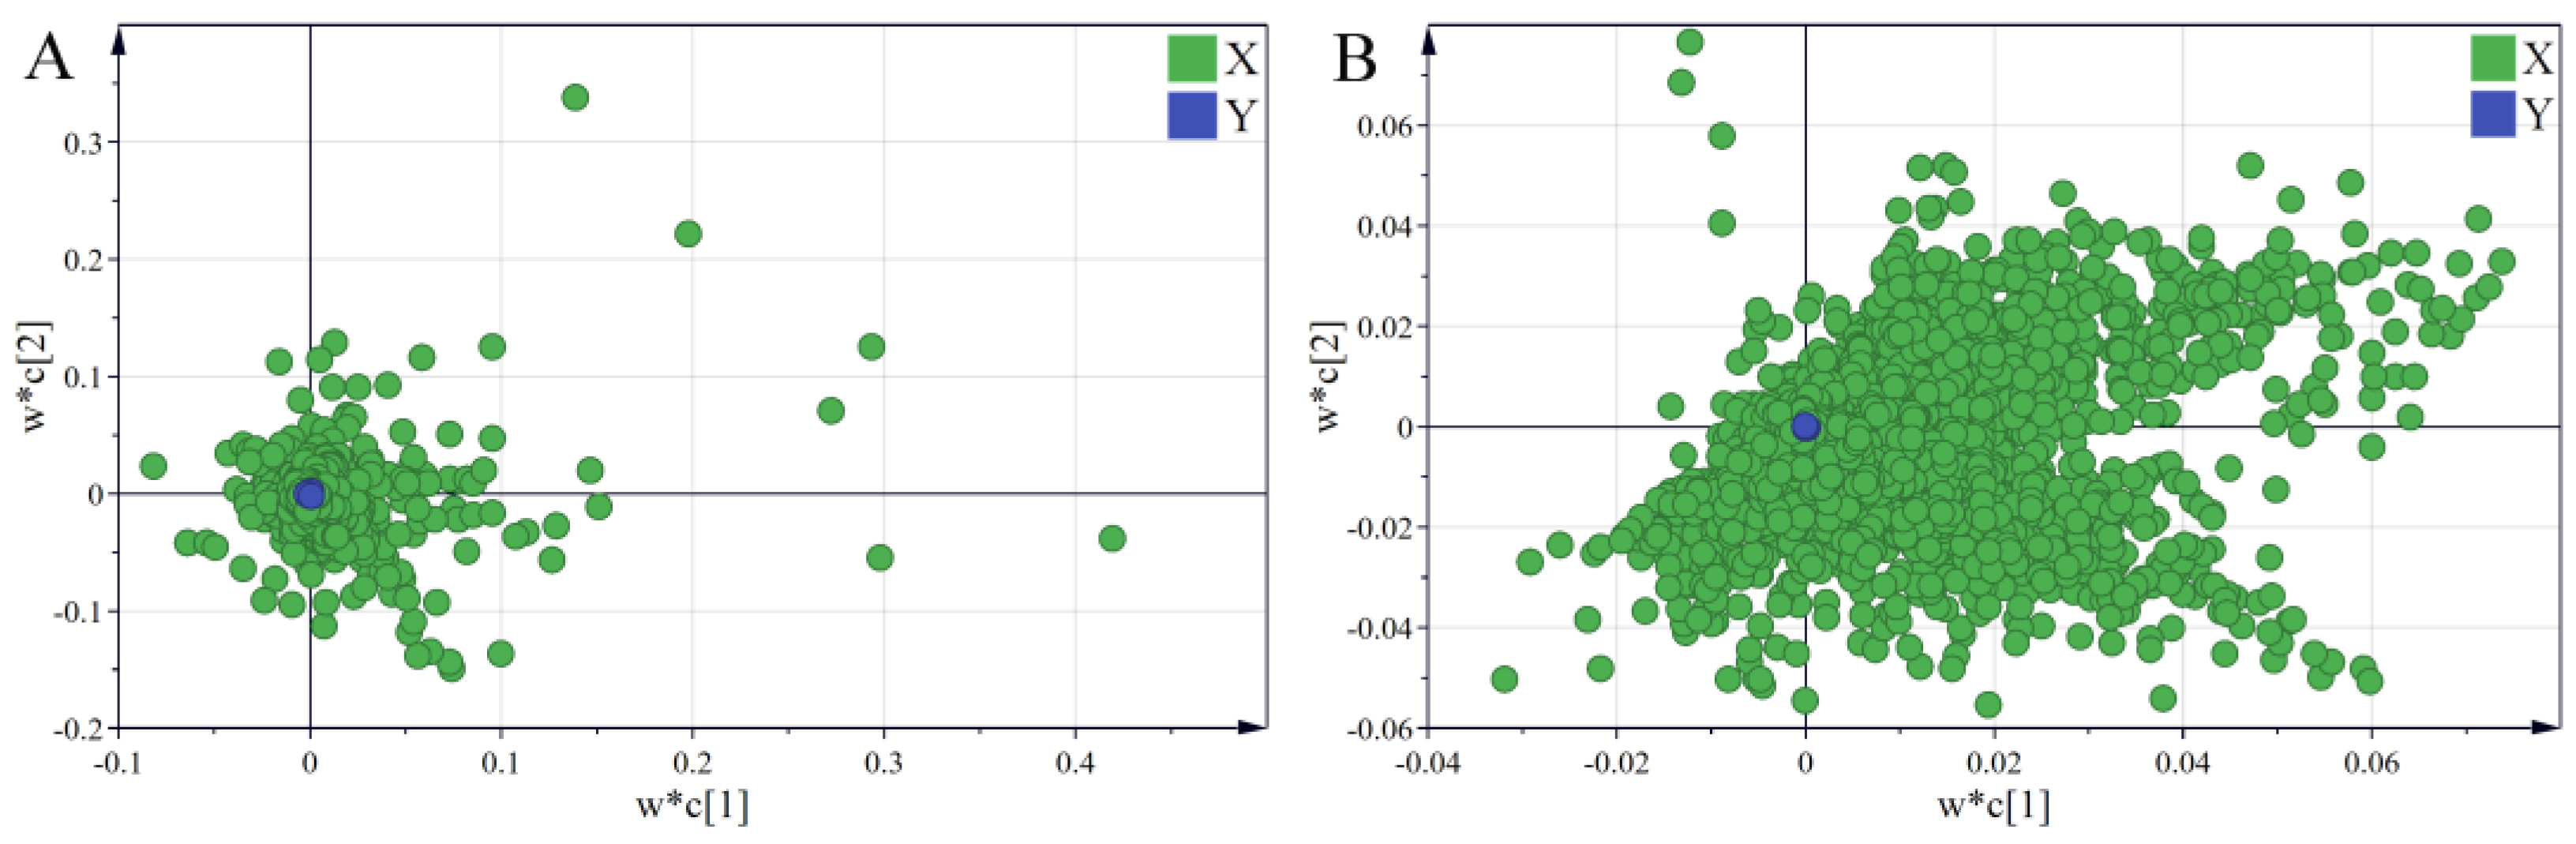
2.2.3. Partial Least-Squares–Discriminant Analysis (PLS-DA)
3. Materials and Methods
3.1. Samples and Chemicals
3.2. Sample Extraction
3.2.1. Extraction of Saponins
3.2.2. Extraction of Volatile Oils
3.3. Instrument Conditions
3.3.1. HPLC-MS Conditions
3.3.2. GC-MS Conditions
3.4. Qualitative and Quantitative Analysis
3.5. Method Validation
3.6. Data Processing and Statistical Analysis
4. Conclusions
Supplementary Materials
Author Contributions
Funding
Institutional Review Board Statement
Informed Consent Statement
Data Availability Statement
Conflicts of Interest
Sample Availability
References
- Jiang, H.; Yang, L.; Hou, A.; Zhang, J.; Wang, S.; Man, W.; Zheng, S.; Yu, H.; Wang, X.; Yang, B.; et al. Botany, traditional uses, phytochemistry, analytical methods, processing, pharmacology and pharmacokinetics of Bupleuri Radix: A systematic review. Biomed. Pharmacother. 2020, 131, 110679. [Google Scholar] [CrossRef]
- Zhu, L.; Liang, Z.T.; Yi, T.; Ma, Y.; Zhao, Z.Z.; Guo, B.-L.; Zhang, J.Y.; Chen, H.-B. Comparison of chemical profiles between the root and aerial parts from three Bupleurum species based on a UHPLC-QTOF-MS metabolomics approach. BMC Complement. Altern. Med. 2017, 17, 305. [Google Scholar] [CrossRef]
- Teng, L.; Guo, X.; Ma, Y.; Xu, L.; Wei, J.; Xiao, P. A comprehensive review on traditional and modern research of the genus Bupleurum (Bupleurum L., Apiaceae) in recent 10 years. J. Ethnopharmacol. 2023, 306, 116129. [Google Scholar] [CrossRef]
- Stoyanov, S. Contribution to the taxonomy and distribution of Bupleurum boissieri, B. aequiradiatum and B-gerardi (Apiaceae) in the Balkans. Phytotaxa 2019, 392, 197–216. [Google Scholar] [CrossRef]
- Chinese Pharmacopoeia Committee. Pharmacopoeia of People’s Republic of China, Part 1; China Medical Science Press: Beijing, China, 2020; p. 263. [Google Scholar]
- Qu, X.; Hu, S.; Li, T.; Zhang, J.; Wang, B.; Liu, C. Metabolomics Analysis Reveals the Differences between Bupleurum chinense DC. and Bupleurum scorzonerifolium Willd. Front. Plant Sci. 2022, 13, 933849. [Google Scholar] [CrossRef]
- Sui, C.; Chen, M.; Xu, J.; Wei, J.; Jin, Y.; Xu, Y.; Sun, J.; Gao, K.; Yang, C.; Zhang, Z.; et al. Comparison of root transcriptomes and expressions of genes involved in main medicinal secondary metabolites from Bupleurum chinense and Bupleurum scorzonerifolium, the two Chinese official Radix bupleuri source species. Physiol. Plant. 2015, 153, 230–242. [Google Scholar] [CrossRef]
- Yang, F.; Dong, X.; Yin, X.; Wang, W.; You, L.; Ni, J. Radix Bupleuri: A Review of Traditional Uses, Botany, Phytochemistry, Pharmacology, and Toxicology. BioMed Res. Int. 2017, 131, 110679. [Google Scholar] [CrossRef]
- Xiao, L.X.; Zhou, H.N.; Jiao, Z.Y. Present and Future Prospects of the Anti-cancer Activities of Saikosaponins. Curr. Cancer Drug Targets 2023, 23, 2–14. [Google Scholar]
- Gu, Y.; Duan, S.; Ding, M.; Zheng, Q.; Fan, G.; Li, X.; Li, Y.; Liu, C.; Sun, R.; Liu, R. Saikosaponin D attenuates metabolic associated fatty liver disease by coordinately tuning PPAR alpha and INSIG/SREBP1c pathway. Phytomedicine 2022, 103, 154219. [Google Scholar] [CrossRef]
- Chen, X.Q.; Chen, S.J.; Liang, W.N.; Wang, M.; Li, C.F.; Wang, S.S.; Dong, S.Q.; Yi, L.T.; Li, C.D. Saikosaponin A attenuates perimenopausal depression-like symptoms by chronic unpredictable mild stress. Neurosci. Lett. 2018, 662, 683–689. [Google Scholar] [CrossRef]
- Zhang, X.; Liu, Z.; Chen, S.; Li, H.; Dong, L.; Fu, X. A new discovery: Total Bupleurum saponin extracts can inhibit the proliferation and induce apoptosis of colon cancer cells by regulating the PI3K/Akt/mTOR pathway. J. Ethnopharmacol. 2022, 283, 114742. [Google Scholar] [CrossRef]
- Liu, W.; Cheng, X.; Kang, R.; Wang, Y.; Guo, X.; Jing, W.; Wei, F.; Ma, S. Systematic Characterization and Identification of Saikosaponins in Extracts from Bupleurum marginatum var. stenophyllum Using UPLC-PDA-Q/TOF-MS. Front. Chem. 2021, 9, 747987. [Google Scholar] [CrossRef]
- Rustaiyan, A.; Masnabadi, N.; Masoudi, S.; Samadizadeh, M.; Firouznia, A.; Larijani, K. Composition of the Essential Oils of Bupleurum falcatum L. and Bupleurum gerardi All. from Iran. J. Essent. Oil Bear. Plants 2010, 13, 727–731. [Google Scholar] [CrossRef]
- Liu, S.; Lu, S.; Su, Y.; Guo, Y. Analysis of Volatile Compounds in Radix Bupleuri Injection by GC-MS-MS. Chromatographia 2011, 74, 497–502. [Google Scholar] [CrossRef]
- Sun, P.; Li, Y.; Wei, S.; Zhao, T.; Wang, Y.; Song, C.; Xue, L.; Wang, F.; Xiao, L.; Wu, J.; et al. Pharmacological Effects and Chemical Constituents of Bupleururn. Mini-Rev. Med. Chem. 2019, 19, 34–55. [Google Scholar] [CrossRef]
- Cai, T.; Guo, Z.Q.; Xu, X.Y.; Wu, Z.J. Developments in the analysis of minor unknown natural products based on characteristic fragment information using LC-MS. Mass Spectrom. Rev. 2018, 37, 202–216. [Google Scholar] [CrossRef]
- Wang, H.; Tang, M.; Qiu, X.; Tan, Y.; Guo, Y.; Liu, K.; Li, X.; Wu, W.; Wan, L. Identification of in vivo metabolites of a potential anti-rheumatoid arthritis compound, the quinazolinone derivative PD110, using ultra-high performance liquid chromatography coupled with Q-Exactive plus mass spectrometrys. Xenobiotica 2022, 52, 284–294. [Google Scholar] [CrossRef]
- Xia, Z.; Liu, X.; Tong, L.; Wang, H.; Feng, M.; Xi, X.; He, P.; Qin, X. Comparison of chemical constituents of Bupleurum marginatum var. stenophyllum and Bupleurum chinense DC. using UHPLC-Q-TOF-MS based on a metabonomics approach. Biomed. Chromatogr. 2021, 35, e5133. [Google Scholar] [CrossRef]
- Wang, Z.; Zhao, H.; Tian, L.; Zhao, M.; Xiao, Y.; Liu, S.; Xiu, Y. Quantitative Analysis and Differential Evaluation of Radix Bupleuri Cultivated in Different Regions Based on HPLC-MS and GC-MS Combined with Multivariate Statistical Analysis. Molecules 2022, 27, 4830. [Google Scholar] [CrossRef]
- Xiu, Y.; Li, X.; Sun, X.; Xiao, D.; Miao, R.; Zhao, H.; Liu, S. Simultaneous determination and difference evaluation of 14 ginsenosides in Panax ginseng roots cultivated in different areas and ages by high-performance liquid chromatography coupled with triple quadrupole mass spectrometer in the multiple reaction-monitoring mode combined with multivariate statistical analysis. J. Ginseng Res. 2019, 43, 508–516. [Google Scholar]
- Zhao, H.; Wang, X.; Zhang, Y.; Huang, X.; Jiang, Y.; Ma, H.; An, L.; Wu, X.; Wang, Q. Quantitative H-1 NMR for the Direct Quantification of Saikosaponins in Bupleurum chinense DC. Anal. Sci. 2021, 37, 1413–1418. [Google Scholar] [CrossRef]
- Sun, B.S.; Gu, L.J.; Fang, Z.M.; Wang, C.Y.; Wang, Z.; Lee, M.R.; Li, Z.; Li, J.J.; Sung, C.K. Simultaneous quantification of 19 ginsenosides in black ginseng developed from Panax ginseng by HPLC–ELSD. J. Pharm. Biomed. Anal. 2009, 50, 15–22. [Google Scholar] [CrossRef]
- Fan, S.; Yang, G.; Zhang, J.; Li, J.; Bai, B. Optimization of Ultrasound-Assisted Extraction Using Response Surface Methodology for Simultaneous Quantitation of Six Flavonoids in Flos Sophorae Immaturus and Antioxidant Activity. Molecules 2020, 25, 1767. [Google Scholar] [CrossRef]
- Cole, R.B. Electrospray and MALDI Mass Spectrometry; Wiley John & Sons: Toronto, ON, Canada, 2010. [Google Scholar]
- Meng, J.; Chen, X.; Yang, W.; Song, J.; Zhang, Y.; Li, Z.; Yang, X.; Yang, Z. Gas chromatography-mass spectrometry analysis of essential oils from five parts of Chaihu (Radix Bupleuri Chinensis). J. Tradit. Chin. Med. 2014, 34, 741–748. [Google Scholar] [CrossRef]
- Le Mapihan, K.; Vial, J.; Jardy, A. Reversed-phase liquid chromatography column testing and classification: Physicochemical interpretation based on a wide set of stationary phases. J. Chromatogr. A 2007, 1144, 183–196. [Google Scholar] [CrossRef]
- Worley, B.; Powers, R. Multivariate Analysis in Metabolomics. Curr. Metabolomics 2013, 1, 92–107. [Google Scholar]
- Triba, M.N.; Le Moyec, L.; Amathieu, R.; Goossens, C.; Bouchemal, N.; Nahon, P.; Rutledge, D.N.; Savarin, P. PLS/OPLS models in metabolomics: The impact of permutation of dataset rows on the K-fold cross-validation quality parameters. Mol. Biosyst. 2015, 11, 13–19. [Google Scholar] [CrossRef]
- Zhang, D.Y.; Liang, J.; Zhang, Y.; Kuang, H.X.; Xia, Y.G. Effects of various processed methods on chemical constituents and anti-hepatitis activity of Bupleurum scorzonerifolium Willd. by metabonomics and molecular docking. J. Pharmaceut. Biomed. 2022, 218, 114837. [Google Scholar] [CrossRef]
- Huang, H.Q.; Zhang, X.; Lin, M.; Shen, Y.H.; Yan, S.K.; Zhang, W.D. Characterization and identification of saikosaponins in crude extracts from three Bupleurum species using LC-ESI-MS. J. Sep. Sci. 2008, 31, 3190–3201. [Google Scholar] [CrossRef]


| Saikosaponin | Calibration Curve | R2 | Linear Range (μg/mL) | LOD (μg/mL) | LOQ (μg/mL) |
|---|---|---|---|---|---|
| SSa | y = 117,587 + 5695.15x | 0.9959 | 0.1–100.0 | 0.008 | 0.025 |
| SSc | y = 102,954 + 8278.13x | 0.9957 | 0.05–10.0 | 0.007 | 0.020 |
| SSd | y = 97,594 + 5994.61x | 0.9925 | 0.1–100.0 | 0.012 | 0.050 |
| SSe | y = 232,657 + 12,748.1x | 0.9944 | 0.03–3.0 | 0.008 | 0.018 |
| SSf | y = 98,469.8 + 8989.99x | 0.9966 | 0.05–10.0 | 0.006 | 0.020 |
| Saikosaponin | Intraday Precision RSD (n = 9, %) | Interday Precision RSD (n = 6, %) | Repeatability RSD (n = 6, %) | Stability RSD (n = 7, %) | Recovery (%)/RSD (n = 3, %) | ||
|---|---|---|---|---|---|---|---|
| 80% | 100% | 120% | |||||
| SSa | 2.89 | 1.85 | 2.12 | 2.03 | 98.62/1.68 | 99.68/1.98 | 101.13/2.09 |
| SSc | 1.96 | 2.06 | 1.81 | 1.65 | 98.91/1.85 | 101.34/1.47 | 97.65/1.98 |
| SSd | 1.62 | 2.16 | 1.26 | 1.46 | 101.03/1.42 | 99.85/1.25 | 98.73/1.93 |
| SSe | 3.24 | 3.36 | 3.13 | 3.28 | 101.07/1.35 | 98.90/2.19 | 98.46/1.29 |
| SSf | 3.15 | 3.03 | 3.20 | 2.92 | 97.83/2.13 | 102.13/1.98 | 96.34/2.64 |
| No. | tR (min) | VIP | Compound Name | [M − H]− Ion (m/z) | Fragment Ions (m/z) | Molecular Formula | References |
|---|---|---|---|---|---|---|---|
| 1 | 3.63 | 1.6 | SSs | 941.5 | 941.5, 780.5, 617.4, 454.4 | C48H78O18 | [2] |
| 2 | 3.98 | 1.1 | isorhamnetin-3-O-β-D glucoside | 477.4 | 477.4, 317.3 | C22H22O12 | [2] |
| 3 | 4.24 | 3.7 | SSt (Bupleuroside IX) | 795.5 | 795.5, 633.4, 557.4, 487.4, 455.4, 407.4 | C42H68O14 | [20] |
| 4 | 4.64 | 1.2 | SSi | 925.5 | 779.5, 763.5, 617.4, 455.4 | C48H78O17 | [31] |
| 5 | 4.72 | 2.6 | isomer of hydroxy SSc | 943.5 | 943.5, 781.5, 797.5, 635.4, 617.4, 599.4, 455.4 | C48H80O18 | [31] |
| 6 | 5.67 | 3.6 | malonyl-acetyl-hydroxy SSa or d | 883.5 | 797.5, 635.4, 559.4 | C45H72O17 | [2] |
| 7 | 6.69 | 1.7 | SSc | 925.5 | 925.5, 779.5, 763.5, 617.4, 455.4 | C48H78O17 | [20] |
| 8 | 7.56 | 3.4 | SSf | 927.5 | 927.5, 781.5, 765.5, 619.4, 457.4 | C48H80O17 | [20] |
| 9 | 9.08 | 1.1 | SSb4 | 811.5 | 811.5, 649.4, 503.4 | C43H72O14 | [20] |
| 10 | 9.36 | 1.9 | 2″-O-acetyl SSb3 | 853.5 | 853.5, 811.5, 793.5, 649.4, 471.4, 439.4 | C45H74O15 | [31] |
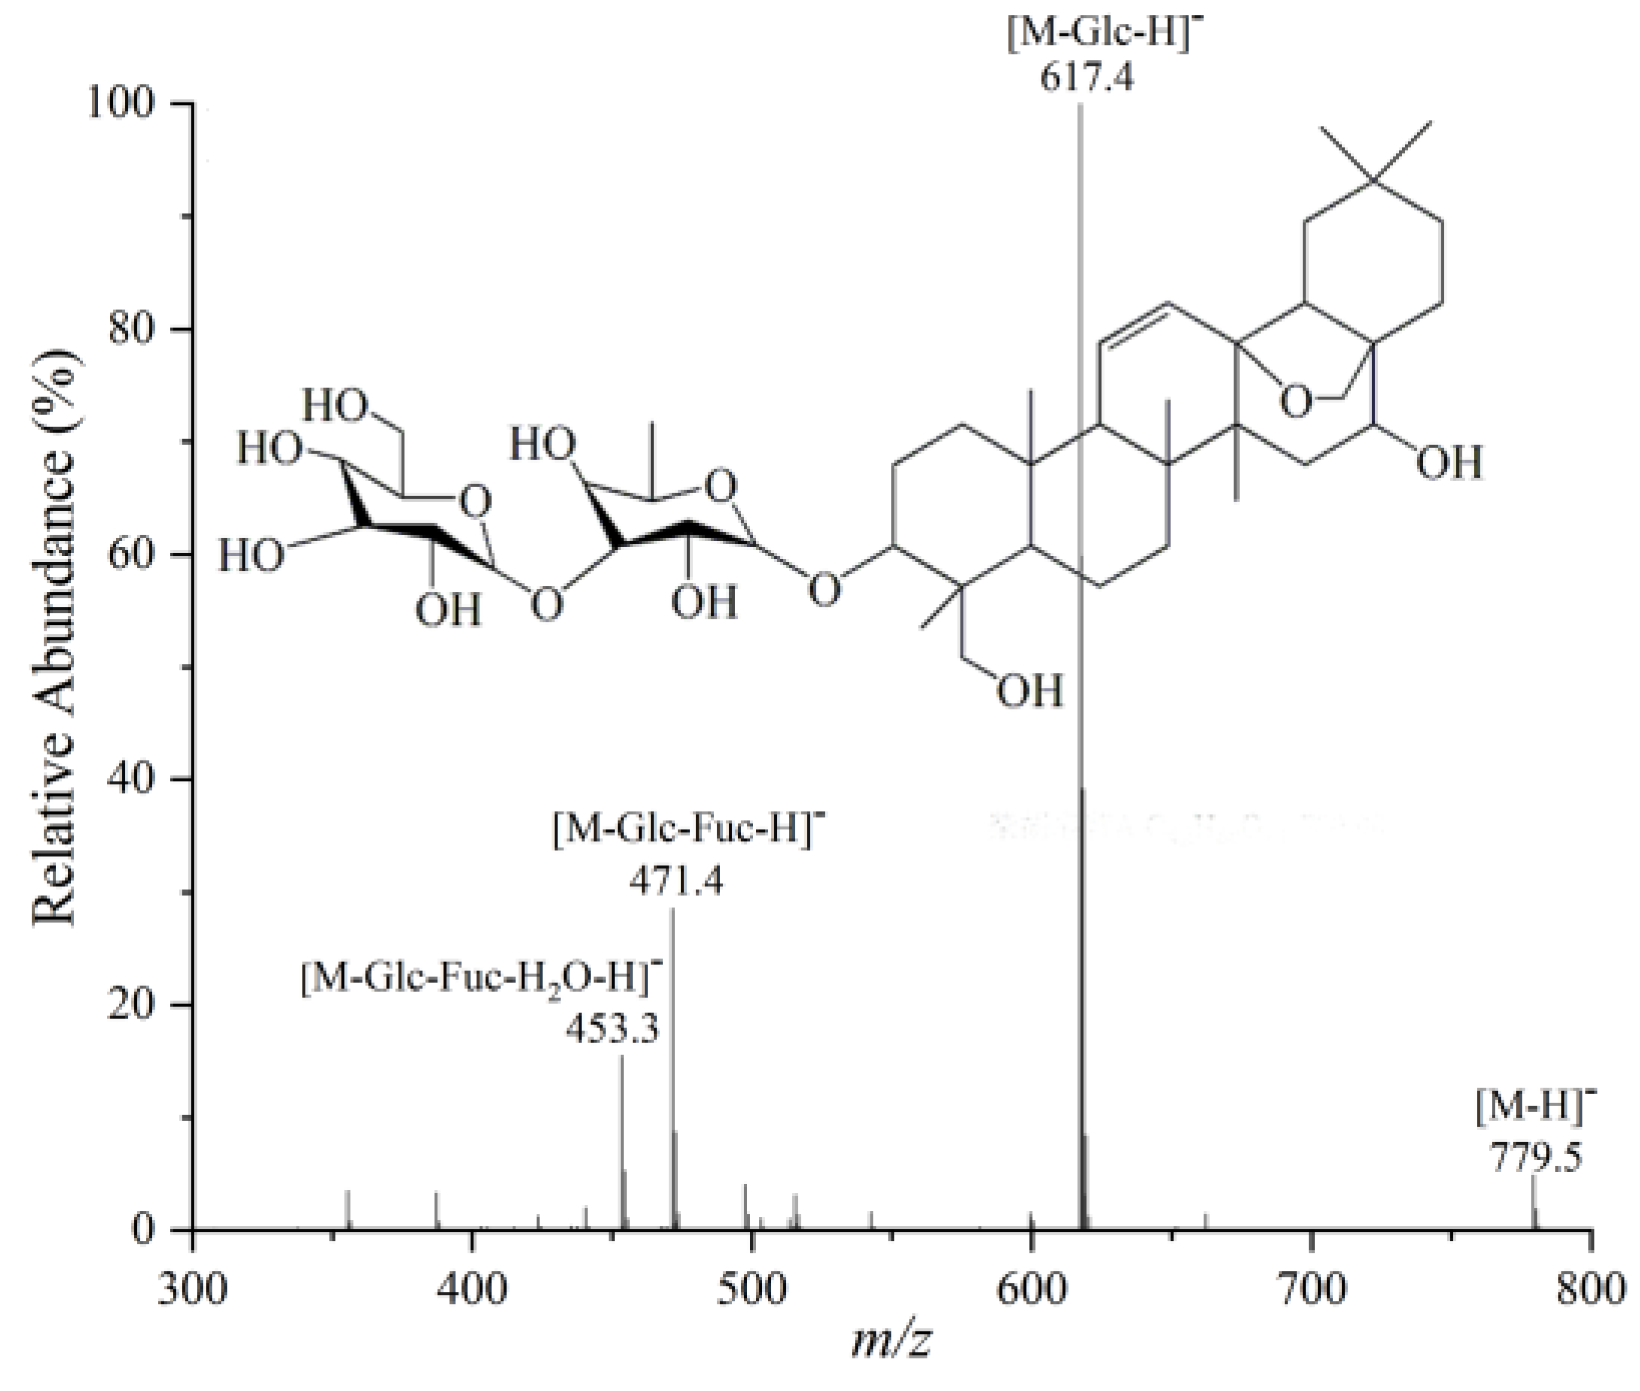
| 11 | 10.33 | 1.6 | SSa | 779.5 | 779.5, 617.4, 471.4, 453.4 | C42H68O13 | [20] |
| 12 | 10.5 | 18.3 | SSb2 | 779.5 | 779.5, 617.4, 541.4, 471.4 | C42H68O13 | [19] |
| 13 | 11.43 | 2.7 | 2″-O-acetyl SSa | 821.5 | 821.5, 779.5, 761.5, 617.4, 471.4 | C44H70O14 | [13] |
| 14 | 11.66 | 1.5 | malonyl-SSa | 865.5 | 865.5, 821.5, 779.5, 761.5, 617.4, 471.4 | C45H70O16 | [2] |
| 15 | 11.85 | 18.5 | SSb1 | 779.5 | 779.5, 617.4, 471.4 | C42H68O13 | [13] |
| 16 | 12.75 | 3.4 | SSe | 779.5 | 763.5, 601.54 455.4 | C42H68O13 | [13] |
| 17 | 14.14 | 2.7 | SSd | 779.5 | 779.5, 617.4, 471.4 | C42H68O13 | [20] |
| 18 | 14.82 | 2.7 | 6″-O-acetyl-SSa | 821.5 | 821.5, 779.5, 761.5, 617.4, 471.4 | C44H70O14 | [13] |
| 19 | 15.51 | 1.5 | malonyl-SSd | 865.5 | 865.5, 821.5, 779.5, 761.5, 617.4, 471.4 | C45H70O16 | [2] |
| 20 | 17.11 | 1.5 | malonyl-SSb2 | 865.5 | 821.5, 779.5, 617.4, 541.4 | C42H68O13 | [31] |
| 21 | 20.9 | 2.8 | prosaikogenin g | 617.5 | 617.4, 541.4, 471.4, 439.4 | C36H58O8 | [31] |
| No. | tR (min) | VIP | Compound Name | M+• Ion (m/z) | Molecular Formula |
|---|---|---|---|---|---|
| 1 | 2.55 | 1.8 | 1,3,5-cycloheptatriene | 92.1 | C7H8 |
| 2 | 4.03 | 2.3 | 2-butene | 56.1 | C4H8 |
| 3 | 4.03 | 1.8 | methylsuccinic anhydride | 114.1 | C5H6O3 |
| 4 | 4.07 | 1.5 | pyrrolidine | 71.1 | C4H9N |
| 5 | 4.4 | 1.2 | cyclohexa-1,4-diene | 152.3 | C10H16O |
| 6 | 4.89 | 1.6 | phenacyl thiocyanate | 177.2 | C9H7NOS |
| 7 | 4.91 | 1.1 | (bromomethyl) cyclopropane | 135.0 | C4H7Br |
| 8 | 4.98 | 1.8 | (Z)-2-pentene | 70.1 | C5H10 |
| 9 | 5.01 | 1.5 | 1,7,7-trimethylbicyclo heptane-2,3-dione | 166.2 | C10H14O2 |
| 10 | 5.06 | 1.6 | n-methylhexan-1-amine | 115.2 | C7H17N |
| 11 | 5.29 | 1.5 | 2,3,3-trimethyl-1-butene | 98.2 | C7H14 |
| 12 | 5.38 | 2.5 | hexanoic acid | 116.2 | C6H12O2 |
| 13 | 5.41 | 1.4 | bis(chloromethyl) ether | 115.0 | C2H4Cl2O |
| 14 | 5.46 | 1.8 | 2,2,4,4,6-pentamethylheptane | 170.3 | C12H26 |
| 15 | 5.49 | 1.9 | 1-methyl-2-(1-methylethyl)-benzene | 134.2 | C10H14 |
| 16 | 5.81 | 1.1 | 4,5-dihydro-2-pentalenone | 120.2 | C8H8O |
| 17 | 6.05 | 2.7 | hexanoic acid,1-cyclopentylethyl ester | 212.3 | C13H24O2 |
| 18 | 6.05 | 2.0 | 2-methyl-2-nitro-1-propanol | 119.1 | C4H9NO3 |
| 19 | 6.05 | 2.7 | trans-2-undecenoic acid | 184.3 | C11H20O2 |
| 20 | 6.09 | 1.3 | dimethyl sulfate | 126.1 | C2H6O4S |
| 21 | 6.1 | 1.1 | acetophenone | 120.2 | C8H8O |
| 22 | 6.12 | 3.4 | chloromethyl cyanide | 75.5 | C2H2ClN |
| 23 | 6.17 | 3.5 | 2-tetradecyloxirane | 240.4 | C16H32O |
| 24 | 6.86 | 1.6 | undecanoic acid, | 184.3 | C11H20O2 |
| 25 | 6.86 | 1.2 | isopinocarveol | 152.2 | C10H16O |
| 26 | 7.21 | 3.1 | octanoic acid | 144.2 | C8H16O2 |
| 27 | 7.21 | 3.1 | isopulegol | 154.3 | C10H18O |
| 28 | 7.61 | 1.3 | didodecyl phthalate | 502.8 | C32H54O4 |
| 29 | 8.04 | 2.7 | geosmin | 182.3 | C12H22O |
| 30 | 8.09 | 1.2 | dibutyl methanephosphonate | 208.2 | C9H21O3P |
| 31 | 8.11 | 1.6 | 1,2-dimethylcyclohexane | 112.2 | C8H16 |
| 32 | 8.68 | 1.6 | 5-isopropyl-3-methylphenol | 150.2 | C10H14O |
| 33 | 9.41 | 1.4 | 5-propyldihydro-2-furanone | 128.2 | C7H12O2 |
| 34 | 9.80 | 1.5 | lauraldehyde | 184.3 | C12H24O |
| 35 | 10.81 | 1.8 | chloral hydrate | 165.4 | C2H3Cl3O2 |
| 36 | 11.11 | 2.2 | hexyl octyl ether | 214.4 | C14H30O |
| 37 | 11.11 | 2.2 | (Z)-dodec-5-enol | 184.3 | C12H24O |
| 38 | 11.8 | 2.2 | (11Z)-11-hexadecenoic acid | 254.4 | C16H30O2 |
| 39 | 11.81 | 2.5 | 2-hexyl-(1R,2R)-cyclopropaneacetic acid | 184.3 | C11H20O2 |
| 40 | 12.83 | 2.3 | 10-heneicosene | 294.6 | C21H42 |
| 41 | 12.83 | 2.3 | 10-methyldodec-2-en-4-olide | 210.3 | C13H22O2 |
| 42 | 12.86 | 2.8 | (2Z,6E)-farnesyl acetate | 264.4 | C17H28O2 |
| 43 | 24.06 | 2.0 | methyl heptadecadienoate | 280.0 | C18H32O2 |
| 44 | 24.06 | 2.0 | ethyl oleate | 310.5 | C20H38O2 |
| 45 | 24.07 | 2.1 | 2-chlorocyclohexanol | 134.6 | C6H11ClO |
| 46 | 24.26 | 2.4 | (8Z,10Z)-hexadecadien-1-ol acetate | 238.4 | C16H30O |
| 47 | 24.27 | 3.0 | 2-methyl-octadecane | 268.5 | C19H40 |
| 48 | 24.3 | 2.6 | methyl octadeca-9,12-dienoate | 294.5 | C19H34O2 |
| 49 | 29.74 | 2.9 | hentriacontane | 436.8 | C31H64 |
| 50 | 31.55 | 3.1 | cyclopentadecanol | 226.4 | C15H30O |
| 51 | 32.59 | 2.1 | decane | 142.2 | C10H22 |
| 52 | 37.07 | 3.3 | digitoxin | 764.9 | C41H64O13 |
| Growing Region | Administrative District | Variety | Abbreviation |
|---|---|---|---|
| Xinjiang County | Shanxi | North RB | N-XJ |
| Sanyuan County | Shaanxi | North RB | N-SY |
| Baotou City | Inner Mongolia | North RB | N-BT |
| Yuncheng City | Shanxi | South RB | S-YC |
| Heyang County | Shaanxi | South RB | S-HY |
| Ordos City | Inner Mongolia | South RB | S-OD |
| Saikosaponin | tR (min) | Precursor Ion (m/z) | Product Ion I (m/z)/ Collision Energy (eV) | Product Ion II (m/z)/ Collision Energy (eV) |
|---|---|---|---|---|
| SSc | 6.69 | 971.5 | 779.3/38.9 | 925.4/23.7 |
| SSf | 7.56 | 973.5 | 781.3/39.9 | 927.4/23.4 |
| SSa | 10.33 | 779.5 | 439.6/52.0 | 617.3/32.2 |
| SSe | 12.75 | 809.5 | 601.3/33.0 | 763.3/21.3 |
| SSd | 14.14 | 779.5 | 439.2/55.0 | 617.3/33.1 |
Disclaimer/Publisher’s Note: The statements, opinions and data contained in all publications are solely those of the individual author(s) and contributor(s) and not of MDPI and/or the editor(s). MDPI and/or the editor(s) disclaim responsibility for any injury to people or property resulting from any ideas, methods, instructions or products referred to in the content. |
© 2023 by the authors. Licensee MDPI, Basel, Switzerland. This article is an open access article distributed under the terms and conditions of the Creative Commons Attribution (CC BY) license (https://creativecommons.org/licenses/by/4.0/).
Share and Cite
Wang, Z.; Tian, L.; Xiao, Y.; Zhao, M.; Chang, Y.; Zhou, Y.; Liu, S.; Zhao, H.; Xiu, Y. Quantitative and Differential Analysis between Bupleurum chinense DC. and Bupleurum scorzonerifolium Willd. Using HPLC-MS and GC-MS Coupled with Multivariate Statistical Analysis. Molecules 2023, 28, 5630. https://doi.org/10.3390/molecules28155630
Wang Z, Tian L, Xiao Y, Zhao M, Chang Y, Zhou Y, Liu S, Zhao H, Xiu Y. Quantitative and Differential Analysis between Bupleurum chinense DC. and Bupleurum scorzonerifolium Willd. Using HPLC-MS and GC-MS Coupled with Multivariate Statistical Analysis. Molecules. 2023; 28(15):5630. https://doi.org/10.3390/molecules28155630
Chicago/Turabian StyleWang, Zhenhuan, Lu Tian, Yusheng Xiao, Mengya Zhao, Yanyan Chang, Yujiang Zhou, Shuying Liu, Huanxi Zhao, and Yang Xiu. 2023. "Quantitative and Differential Analysis between Bupleurum chinense DC. and Bupleurum scorzonerifolium Willd. Using HPLC-MS and GC-MS Coupled with Multivariate Statistical Analysis" Molecules 28, no. 15: 5630. https://doi.org/10.3390/molecules28155630
APA StyleWang, Z., Tian, L., Xiao, Y., Zhao, M., Chang, Y., Zhou, Y., Liu, S., Zhao, H., & Xiu, Y. (2023). Quantitative and Differential Analysis between Bupleurum chinense DC. and Bupleurum scorzonerifolium Willd. Using HPLC-MS and GC-MS Coupled with Multivariate Statistical Analysis. Molecules, 28(15), 5630. https://doi.org/10.3390/molecules28155630