Article

Determination of Lincomycin in Milk Using Cu-Based Metal-Organic Framework Adsorbent and Liquid Chromatography-Tandem Mass Spectrometry

1
College of Food Science Sciences, Shanxi Normal University, Taiyuan 030000, China
2
Tianjin Key Laboratory of Risk Assessment and Control Technology for Environment and Food Safety, Tianjin Institute of Environmental and Operational Medicine, Tianjin 300050, China
*
Authors to whom correspondence should be addressed.
These authors contributed equally to this work.
Molecules 2023, 28(14), 5307; https://doi.org/10.3390/molecules28145307
Submission received: 22 May 2023 / Revised: 16 June 2023 / Accepted: 21 June 2023 / Published: 10 July 2023
(This article belongs to the Section Materials Chemistry)

Abstract

:
Antibiotic drug residues can adversely affect the human body. Lincomycin is a common veterinary drug that can form residues in foods of animal origin. However, the detection of trace residue levels of lincomycin residues in real samples is challenging. Here, a simple solid phase extraction (SPE) method was developed for the enrichment of lincomycin from cow milk samples before its detection by high-performance liquid chromatography-tandem mass spectrometry (HPLC-MS/MS). The adsorbent used in the SPE was a Cu-based metal-organic framework (Cu-MOF) prepared by the solvothermal synthesis approach. The prepared MOFs were characterized using scanning electron microscopy (SEM), Fourier-transform infrared spectroscopy (FT-IR), X-ray diffractometry (XRD), differential thermogravimetric analysis (TG-DTA), and N2 adsorption-desorption experiments. The adsorption capacity (adsorption equilibrium, extraction time, pH), and elution solvent parameters were investigated. Under the optimized conditions of the HPLC-MS/MS method, lincomycin was detected in the linear range of 10–200 g/L with a detection limit of 0.013 ng/mL. Commercial milk samples were spiked with lincomycin, and a recovery rate between 92.3% and 97.2% was achieved. Therefore, the current method can be successfully applied for the enrichment and determination of lincomycin from milk samples.

1. Introduction

Antibiotics differ from common drugs in the manner of their poisoning and death. Very small doses of antibiotics may cause poisoning and death because of the manner of administration and the contraindications of drug formulations [1]. Lincomycin is a lincosamide antibiotic produced by Streptomyces lincomycetes. This antibiotic binds to the 50S ribosomal subunit on the ribosome and blocks prokaryotic translation, thereby inhibiting protein synthesis in the bacterial cells [2]. Lincomycin is a common antibiotic used worldwide. It is generally used as a veterinary drug and remains in animal-derived foods, causing allergies, toxicity, and other adverse symptoms. Therefore, the use of lincomycin has been restricted in various countries and regions. The European Union (EU) has established the limits for lincomycin content in foodstuffs, wherein the maximum residue levels (MRL) for all producing species are 100 g/kg (muscle), 50 g/kg (fat), 500 g/kg (liver), 1500 g/kg (kidney), 150 g/kg (milk), and 50 g/kg (eggs) [3]. It is essential to develop a simple, rapid, and sensitive extraction and detection method for lincomycin [4,5].
Food sample substrates are complex and involve complicated pretreatment steps before detection. Hence, extraction and separation steps are necessary. The extraction and separation techniques commonly used in traditional sample pretreatment include Soxhlet extraction, supercritical fluid extraction [6], sonication-assisted extraction, etc. [7]. However, these methods require a large number of samples, consume large amounts of organic solvents, and are complicated to operate, thus generating a large number of toxic waste solvents [8,9]. Hence, sample preparation techniques are the focus of recent research. Solid-phase extraction (SPE) is a simple sample preparation method with the advantages of high extraction recovery, high enrichment rate, and easy operation [10]. Particularly, adsorbents and other related materials can be recycled, greatly reducing the cost of disposal of waste pollutants [4,8,11]. Traditional adsorbents, such as activated carbon, chitosan, natural zeolite, and silicon microspheres, are commonly used by the wastewater industry for water treatment. These materials possess poor adsorption capacity and, hence, are generally suitable for low concentrations of dye or heavy metal contamination. The MOF (metal-organic framework) coordination polymer has developed rapidly in the past decade. It is advantageous in terms of high porosity, low density, a large specific surface area, regular and adjustable pore sizes, and a variety of topological structures [12]. It is widely used in photoelectric catalysis, gas separation, energy storage sensing, and the adsorption of organic pollutants [2,13,14]. An important advantage of MOF, in contrast to traditional adsorbents, is the ability to regulate their properties through the selection of ligands and metal ions of different structures and various methods of combining them to obtain different diameter holes and change the size of the cavity in the three-dimensional structure, which greatly improves the adsorption efficiency toward target pollutants [15].
Furthermore, the ease of synthesis of MOF makes it unique in the selection of adsorbents. Therefore, as a new adsorbent, MOF has significant advantages and broad application prospects in the solid-phase extraction of antibiotic pollutants [16,17].
Cu-based metal-organic frameworks (Cu-MOFs) are composed of oxygen, nitrogen, other organic ligands, and copper ions that are self-assembled by coordination polymers. In the structures of Cu-MOFs, the arrangement of organic ligands and metal ions shows obvious directions, which can form different pore structures and have different adsorption, optical, and electromagnetic properties. Therefore, Cu-MOFs demonstrate great potential and attractive prospects in the field of modern materials science [18].
Presently, lincomycin is chiefly detected using high-performance liquid chromatography (HPLC) [19,20], gas chromatography-mass spectrometry (GC-MS) [4,21,22] and liquid chromatography-tandem mass spectrometry (HPLC-MS/MS) [23,24]. HPLC-MS/MS overcomes the background interference, and its multi-reaction detection mode (MRM) improves the signal-to-noise ratio. Thus, high sensitivity can be achieved for complex samples. Currently, this is the ideal method for drug residue analysis.
In this study, Cu-MOFs were prepared using solvothermal methods, and the products were characterized. Cu-MOF functioned as an effective adsorbent to extract lincomycin from milk, and the important factors that affected the adsorption efficiency were systematically optimized. Finally, an HPLC-MS/MS method was established for lincomycin detection. Additionally, the SPE-HPLC-MS/MS method was validated under the optimized conditions and applied for analyzing lincomycin in different milk samples.

2. Results and Discussion

2.1. Characterization of Cu-MOFs

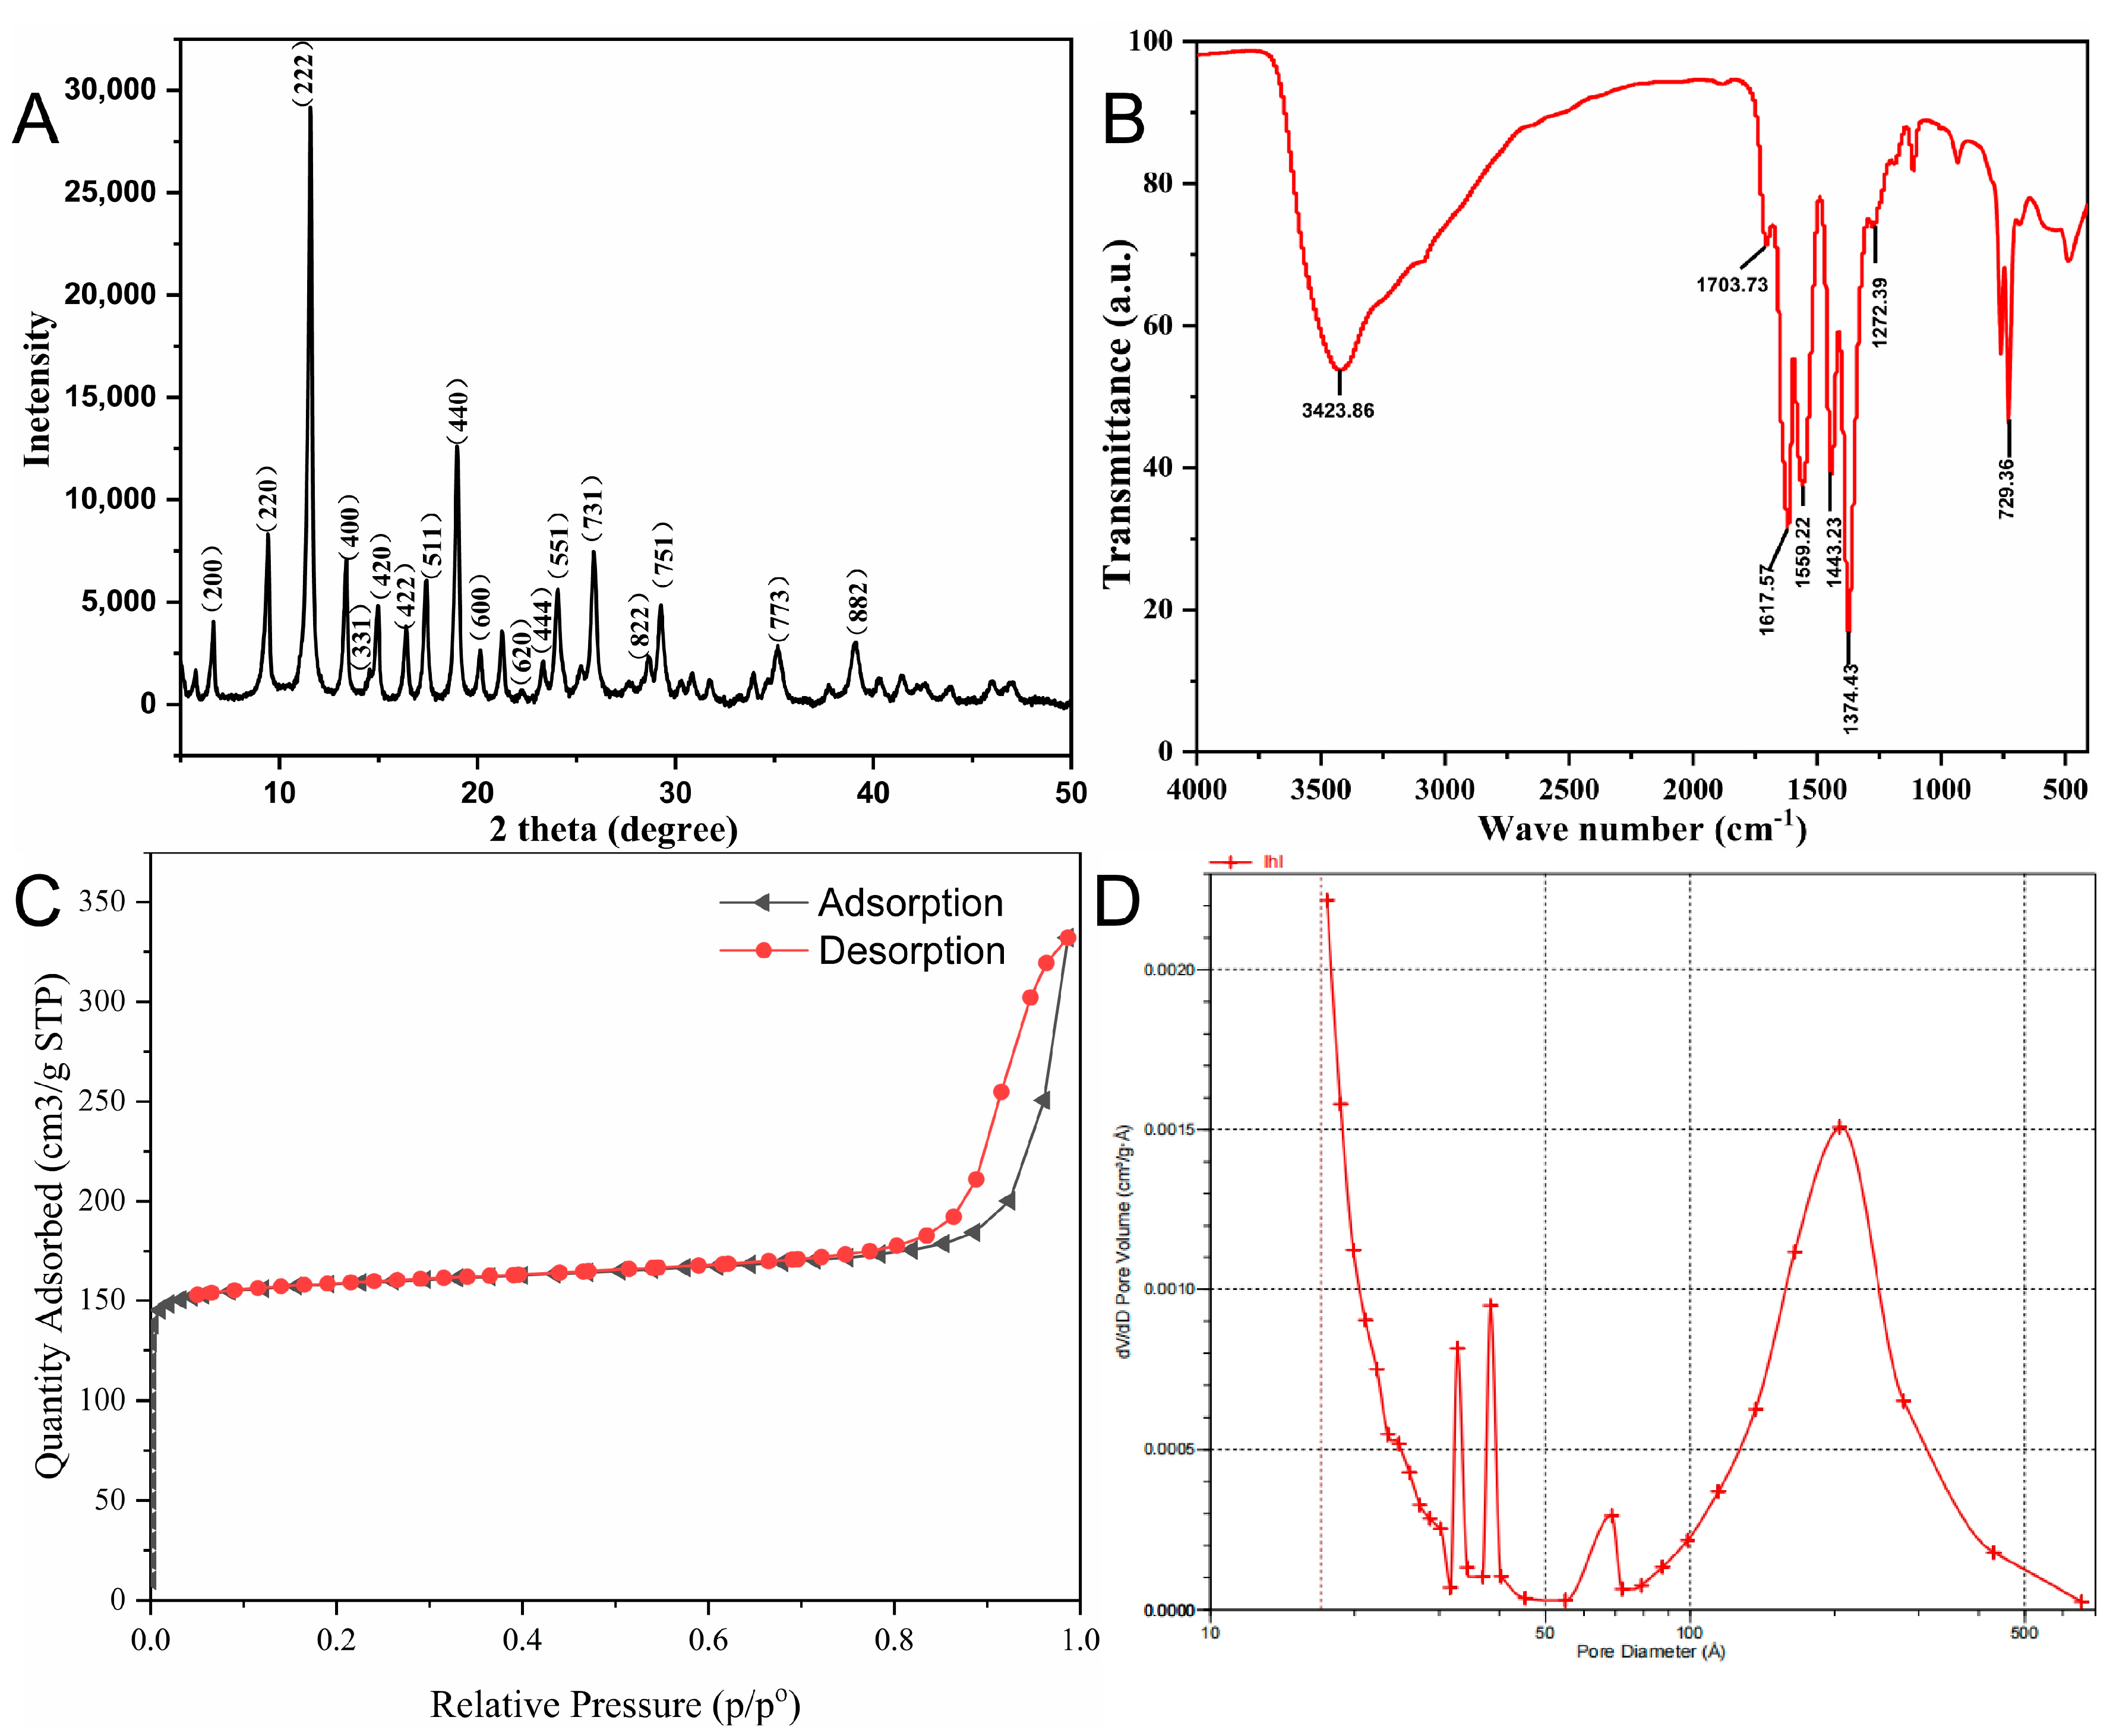
The morphology of Cu-MOFs was characterized by scanning electron microscopy (SEM). The Cu-MOF exhibited a typical octahedral shape with a pore structure on the surface (Figure 1) [25,26]. The XRD pattern of the as-prepared Cu-MOFs layer is shown in Figure 2A. As-prepared Cu-MOFs consist of a face-centered cubic (FCC) crystal lattice, with reflections of (222), (400), (331), (420), (422), (511), (440), (600), (444), (551), (731), (822), (751), (773), and (882) planes at 2 of 11.56°, 13.38°, 14.54°, 14.96°, 16.38°, 17.42°, 18.96°, 20.14°, 23.32°, 24.06°, 25.86°, 28.62°, 29.26°, 35.16°, and 39.1°; these results were consistent with the literature reports [27,28,29]. Thus, the results implied the successful synthesis of Cu-MOFs crystals with a topological structure.
The functional group composition of the prepared Cu-MOFs was characterized by Fourier transform infrared spectroscopy (FTIR). As revealed in Figure 2B, the sample exhibit the characteristic asymmetric stretching vibrations of carboxylate groups in the range of 1559–1443 cm−1 and the symmetric stretching vibrations around 1374 cm−1. However, in the same wave number range, the vibration band could also result from the stretching vibrations of the benzene ring as well as the deformation vibration of water molecules. Beside bands related to COO- groups, the band at 1443 cm−1 is ascribed to the C-C vibration in the aromatic ring. A wide peak at 3423 cm−1 was due to the OH groups stretching vibration of water molecules. The presence of characteristic absorption bands of free BTC at 1703–1617 cm−1 and at 1272 cm−1, is due to the stretching vibration of the C=O group and the C-OH group, respectively. As well, the peak around 730 cm−1 is related to the bending vibration of C-H. These results were consistent with the reported results [25,30], confirming the successful synthesis of the Cu-MOFs materials.
To study the specific surface area and pore size of the Cu-MOF samples, N2 adsorption-desorption isotherm curves were tested, and they displayed a type IV isotherm (Figure 2C). The adsorption capacity increases rapidly at a lower relative pressure, and the saturation value appears when the relative pressure reaches a certain level. At an approximate relative pressure (P/P0) of 0.8, capillary condensation occurred in the pores of the material, and hysteric loops appeared in the adsorption-desorption isotherm curve. It is proven that the material has microporous and mesoporous structures. As well, the specific surface area (630.08 m2/g) and pore volume (0.30 cm3/g) of Cu-MOFs porous materials were obtained. The pore size distribution is shown in Figure 2D, and the average pore size within the mesoporous range is about 20 nm according to the BJH calculation. Additionally, the large specific surface area and pore volume of the Cu-MOFs would provide more space and sites for target molecules.
Further, the thermal stability of Cu-MOFs was studied by the TG-DSC method. Under the nitrogen atmosphere, the heating rate was 5 °C/min, and the quality was monitored from room temperature to 900 °C. The weight of the Cu-MOFs decreased slightly with an increase in the temperature around 100 °C (Figure 3). This could be due to the evaporation of water molecules in the material during the heating process. When the temperature was increased from 100 °C to 300 °C, there was no change in the weight of the Cu-MOFs. Further increase in the temperature destroyed the Cu-MOF structure resulting in a 35.58% decrease in weight. Therefore, Cu-MOFs show superior thermodynamic stability in the range of 300 °C.

2.2. Adsorption Experiment of Cu-MOFs

2.2.1. Saturated Adsorption Capacity

The adsorption equilibrium curve of Cu-MOFs for lincomycin is shown in Figure 4A. At low lincomycin concentrations, the adsorption capacity increased rapidly with increasing concentration. When the lincomycin concentration was increased to 200 mg/L, the adsorption amount of lincomycin no longer changed. Further increases in the concentrations did not significantly increase the adsorption amount, indicating that the reaction had reached equilibrium. The adsorption of antibiotics at different concentrations was investigated according to the Langmuir (Figure 4B) and Freundlich (Figure 4C) models [31,32].
C e Q e = 1 Q max C e + 1 Q max × b
lg Q = 1 n lg C + lg K f
where Ce (mg/L) is the concentration of the adsorbate at adsorption equilibrium. Qe (mg/g) is the amount of adsorbed pharmaceuticals on the adsorbent at equilibrium (mg/g), Qmax (mg/g) is the saturated adsorption capacity of the adsorbent at adsorption equilibrium, b is the Langmuir constant, and n and Kf are the Freundlich constants.
As seen in Table 1, the R2 (=0.98) value of the Langmuir model was higher, indicating a monolayer adsorption process. The adsorption capacity of all sites on the solid surface was identical. When the concentration of the target substance was low, the antibiotic quickly adsorbed on the surface of the material and occupied the surface adsorption site. Upon increasing the target concentration, the surface adsorption site gradually became saturated and lost its adsorption effect. According to the Langmuir isothermal adsorption equation, the saturated adsorption capacity of lincomycin was calculated to be about 131.41 mg/g. The adsorption capacity is higher than the adsorption capacity of chitosan and magnetic nanomaterials for antibiotics reported in the literature [33,34].

2.2.2. Adsorption Kinetics

The effect of different adsorption times on lincomycin adsorption capacity was studied with 2.0 mg Cu-MOFs (Figure 5A). When the oscillation time was between 5 and 90 min, the adsorption capacity increased with an increase in the oscillation time. The adsorption took nearly 90 min to attain equilibrium but continued for 150 min, to check the fluctuations in adsorption equilibrium, but the adsorption stayed constant. To further analyze and calculate the kinetic parameters, the experimental data were fitted by two kinetic models: the pseudo-first-order (3) and pseudo-second-order (4) kinetic models [31,35]:
ln ( q q t ) = ln q k 1 t
t q t = 1 k 2 × q 2 + t q
where qt (mg·g−1) and q (mg·g−1) are the amounts of lincomycin adsorbed at time t(min) and the amount at adsorption equilibrium, respectively; and k1 (min−1) and k2 (g·mg−1·min−1) are the pseudo-first-order and pseudo-second-order rate constants, respectively.
Although adsorption was very quick and spontaneous at the start, it progressively slowed down until equilibrium was established. Although adsorption was very quick and spontaneous at the start, it progressively slowed down until equilibrium was established. In the case of Cu-MOFs, there was a big difference in the values of both k1 and k2 but the experimental values were very close to the pseudo-second-order kinetics model such as q1 was 112.97 mg·g−1 and q2 was 68.21 mg·g−1 compared to experimental values. Consequently, the pseudo-second-order model tailored this process in terms of the association factor (R2) being superior to the pseudo-first-order. The adsorption graph for both orders is presented in Figure 5B,C. The data obtained from the experiment and pseudo-first-order and pseudo-second-order kinetics models are enclosed in Table 2. Therefore, it shows that the target reaching the surface of the adsorbent from the solution was controlled by the chemisorption mechanism, and there were two types of binding sites on the surface of the adsorbent [36,37,38,39].

2.2.3. Optimization of the Eluent Solution

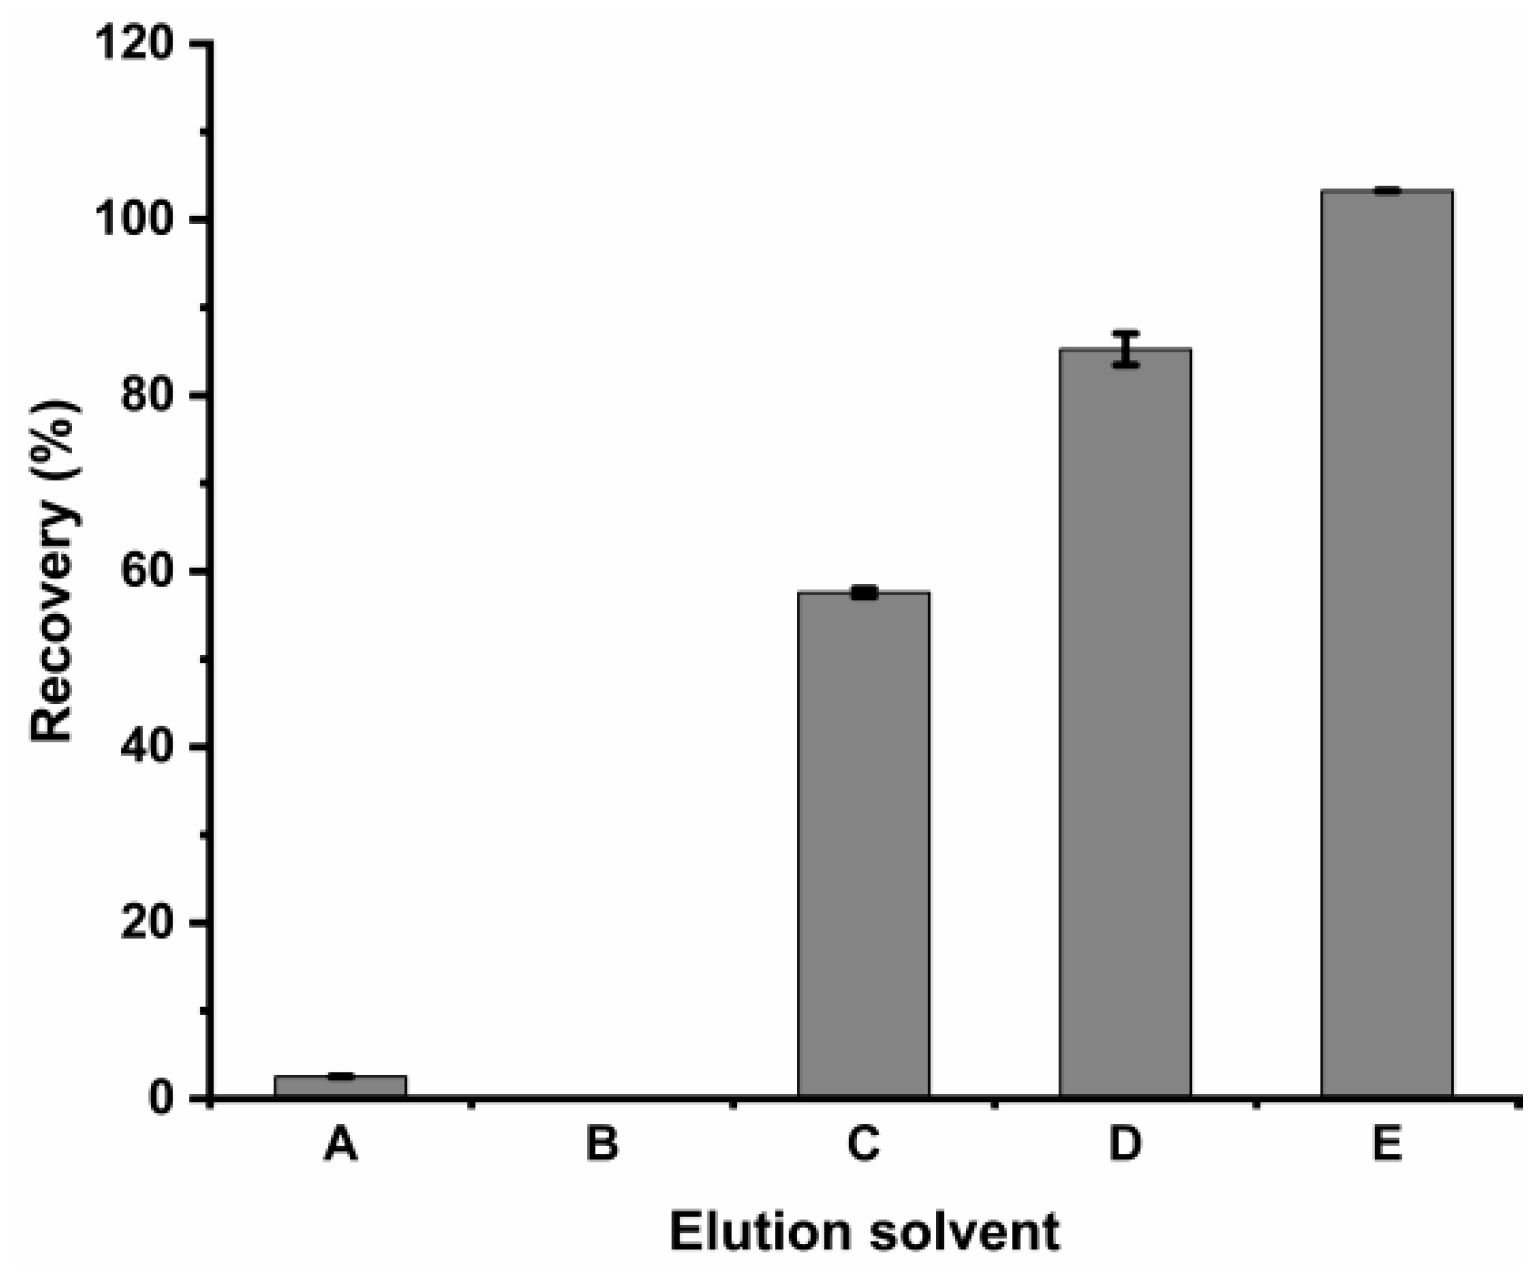
In this experiment, five elution solvents were investigated (Figure 6). When acetonitrile with 1% formic acid was used as the elution solvent, the recovery rate was almost 100%. The dependence of the adsorption between antibiotics and adsorbents on a variety of interactions could be the probable reason. The hydrogen bonding, electrostatic interactions, and π-π interactions between the antibiotic and the adsorbent were destroyed by adding a small amount of formic acid, and a satisfactory elution effect was achieved. However, when the 1% formic acid in water was used as the eluent, the Cu-MOF material was completely dissolved, and the structure of the material was destroyed. Therefore, 3 mL of acetonitrile with 1% formic acid was selected as the best elution solvent.

2.2.4. Effect of pH on the Adsorption Process

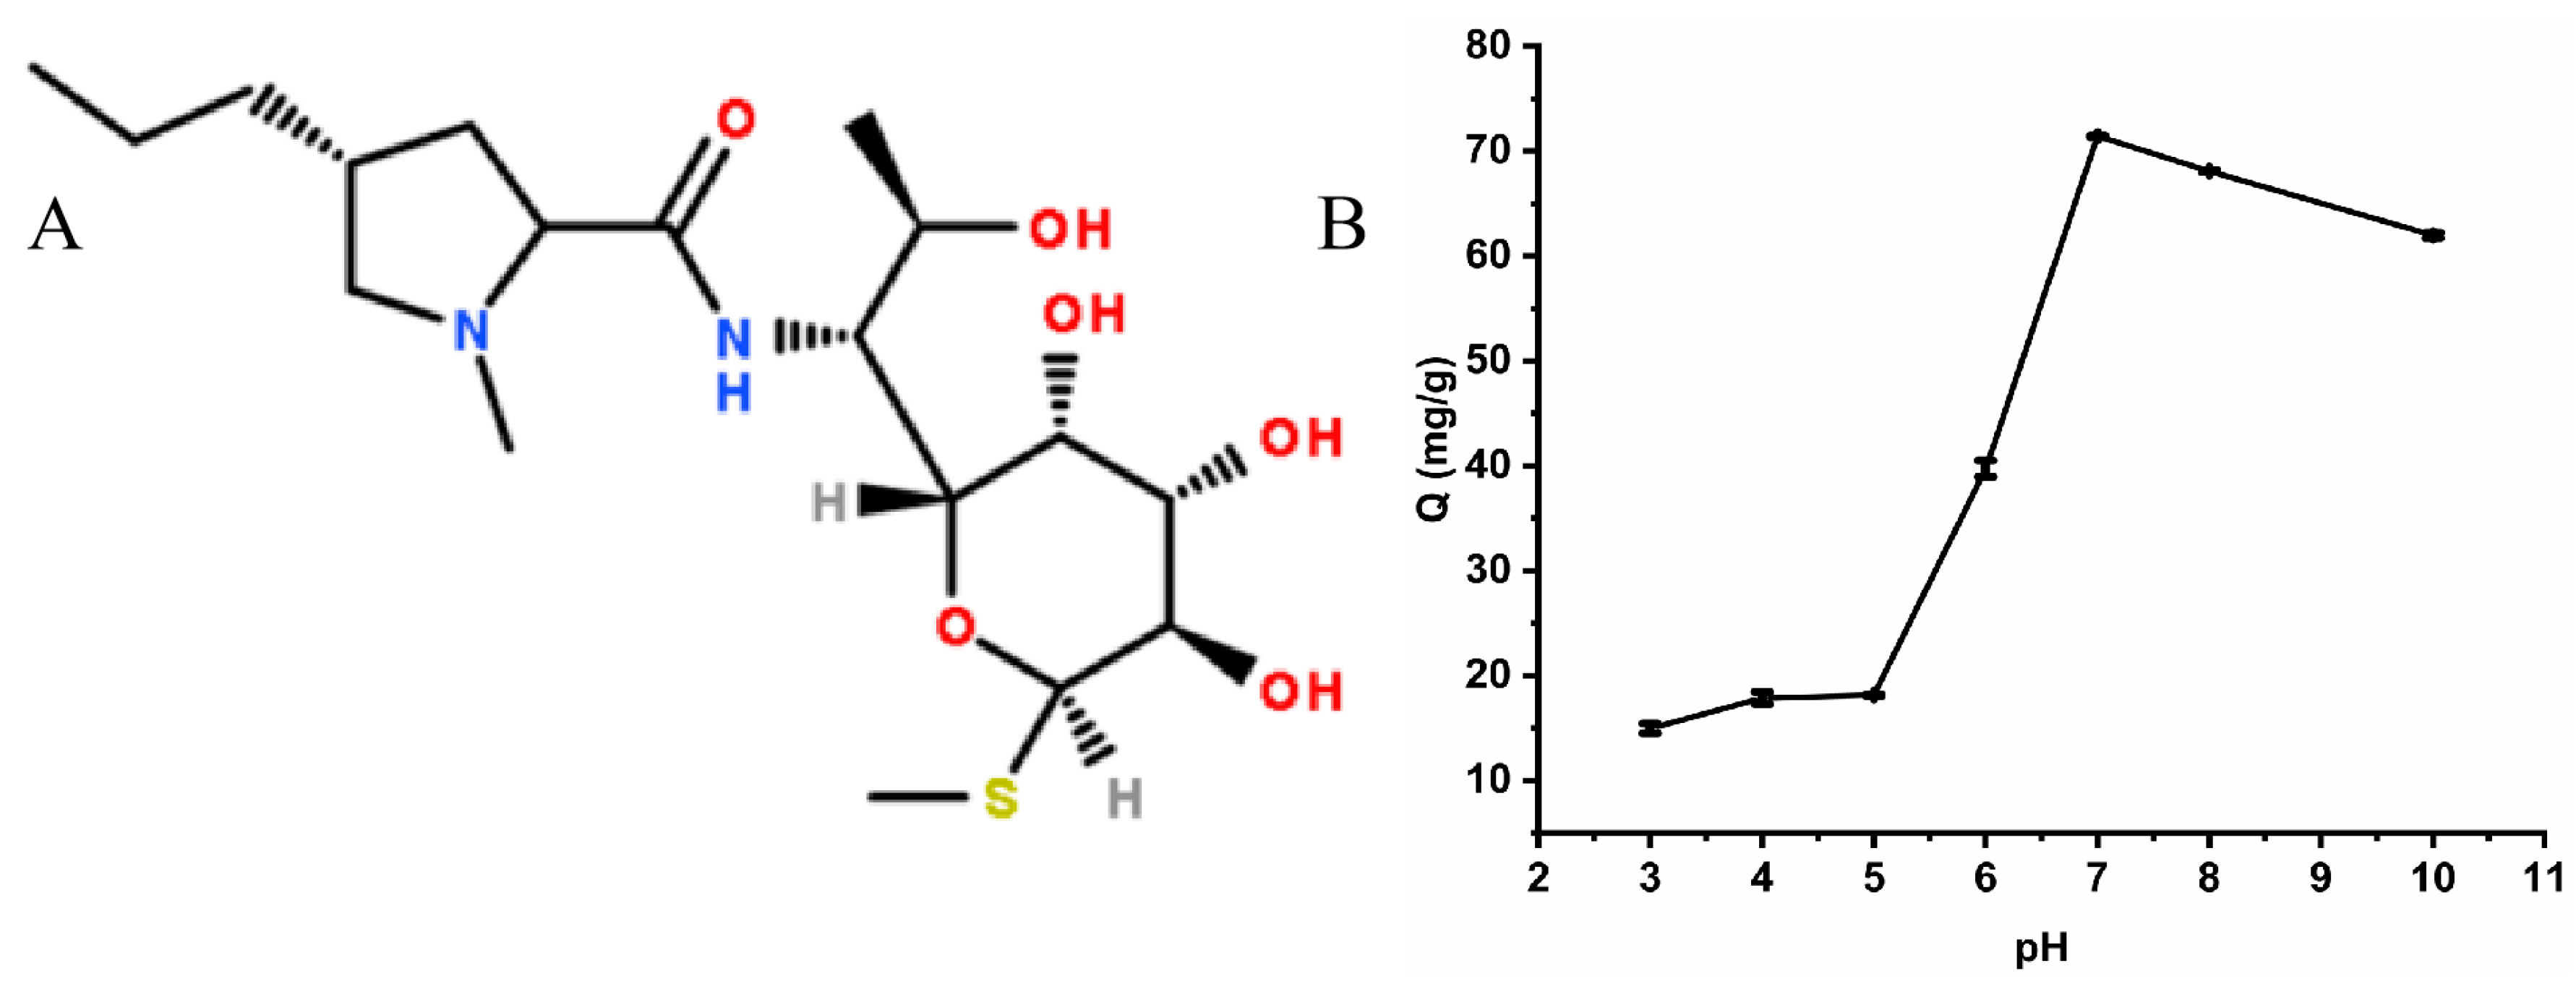
The pH value affects the adsorption process. The charge state on the surface of the material and the chemical form of the antibiotic are both impacted by the pH value of the solution, thus affecting the adsorption performance of the material on the antibiotic. In this study, the adsorption experiments between Cu-MOFs and lincomycin were performed under different pH conditions (pH = 4~10) (Figure 7B). Upon increasing the pH of the solution, the adsorption of Cu-MOFs on lincomycin initially increased and then decreased. The maximum adsorption was achieved at pH 7. The structural formula of lincomycin is shown in Figure 7A. The molecule is unstable under acidic conditions, and the functional groups are easily protonated with a positive charge. Moreover, the functional groups on the surface of the adsorbent are easily protonated under acidic conditions. Therefore, the interaction between lincomycin and the adsorbent was reduced in an acidic solution due to a similar surface charge. As the pH of the solution increased, the functional groups on the adsorbent surface were deprotonated. This increased the negative charge density on the adsorbent surface and enhanced the binding of lincomycin on the adsorbent surface. Additionally, at higher pH values, the lincomycin adsorption capacity was higher due to a decrease in the H-adsorbed competitors on the active site of the adsorbent. The results showed that Cu-MOF adsorbents had excellent adsorption capacity toward lincomycin. This was probably due to the strong hydrogen bond interaction between the adsorbent surface’s COOH functional group and the OH of the lincomycin molecule at pH 7.

2.3. Method Validation

2.3.1. Linear Range and Detection Limit

Under optimal experimental conditions, the analytical performance of the developed method was evaluated by establishing calibration curves and calculating the limit of detection (LOD), linear range, relative standard deviation (RSD), and recovery rate. Good linear relationships were obtained in the concentration range of 10~200 μg/L, with correlation coefficients (R) of lincomycin in milk samples exceeding 0.99. The limits of detection (LODs) of lincomycin were determined by considering the signal-to-noise ratio (S/N) = 3.

2.3.2. Detection of Real Samples

To verify the accuracy and precision of the method, three blank milk samples were spiked with 100 μg/L, 500 μg/L, and 1000 μg/L lincomycin, respectively. A recovery of 92.3~97.2% of lincomycin was achieved by this method and the precision (n = 3) was 0.25~1.96% (Table 3). Thus, the current method demonstrated good accuracy and precision and could meet the requirements of analysis.

2.3.3. Comparison of the Developed Method with Reported Methods

The developed method was compared with previous reports describing the determination of lincomycin in different real samples (Table 4). From an analytical aspect, the linear range and LOD of the proposed method were approximately similar to or better than those of the reported methods. The added level of lincomycin in this experiment was lower than the maximum residue level in the European Union limit, the method proposed in this study led to greater accuracy and precision compared with other methods (the recoveries of lincomycin were 92.3–97.2%, the RSDs were 0.25–1.96%). Thus, this method represents a promising future for the application of Cu-MOFs in determining lincomycin from complicated cow milk samples. The proposed method requires no expensive equipment, and the materials and reagents are easily available. Some of the previously reported methods require multiple steps and are time-consuming, while the present method is one-step.

3. Experimental

3.1. Chemicals and Instruments

Cu(NO3)2·3H2O and formic acid were purchased from Merck (Shanghai, China); 1,3,5-benzenetricarboxylic acid (H3BTC, 98%) was obtained from Aladdin Reagent Corporation (Shanghai, China). Ultrapure water was purchased from Hangzhou Wahaha Group Co., Ltd. (Hangzhou, China). HPLC-grade acetonitrile and methanol were supplied by Thermo Fisher Scientific (Waltham, MA, USA). Ethyl alcohol was obtained from J&K Chemicals (Beijing, China); Lincomycin (98.8%) powder was obtained from Stanford Chemicals Company (Beijing, China); three milk samples were purchased from the local supermarket and stored under refrigeration (−4 °C) until further use.
The functional groups in the Cu-MOF were investigated using Fourier transform infrared spectroscopy (Nicolet FT-IR 6700, Shanghai Larui Company, Shanghai, China). The morphology of the prepared Cu-MOFs was examined using Scanning electron microscopy (SEM) (VISUCAM PRONM microscope from ZEISS, Jena, Germany). The phase and structure of the prepared Cu-MOFs were characterized using X-ray powder diffraction (XRD, Rigaku, Tokyo, Japan) using SmartLab (9 kW) at angles ranging from 5° to 80°. The heat stability of the Cu-MOFs was evaluated using the Simultaneous thermal analyzer NETZSCH STA 449 F3 Jupiter (Kassel, Germany). The Brunauere–Emmette–Teller (BET) surface area was calculated from the N2 adsorption-desorption isotherms at 77 K using an ASAP 2020 Surface Area Analyzer (Mike, GA, USA). The chromatography analysis process was performed with a Waters Company system equipped with Xevo TQ-S micro.

3.2. Instrument Conditions

HPLC conditions: ACQUITY UPLC BEH C18 column (50 mm × 2.1 mm, 1.7 μm Waters Company, Milford, MA, USA), Mobile phase A: methanol, mobile phase B: 0.1% formic acid aqueous solution. A previously described elution scheme was adapted, and the elution method was optimized according to the results of the total ion diagram. The elution method obtained is shown in Table 5. The total analysis time was 5.0 min. The flow rate was 0.3 mL/min, and the injection volume was 2 μL.
Mass spectrometric conditions: ionization mode: ESI+, Ionization voltage: 3.0 kV, taper hole voltage: 32 V; Ion source temperature: 150 °C, desolventing temperature: 350 °C, desolventing gas velocity: 650 L/h, impact chamber pressure: 3.6 × 10⁻⁵ Pa; the MRM analysis.

3.3. Synthesis of Cu-MOFs

Cu-MOFs were prepared by the solvothermal method according to the previous literature with modifications [21,22]. Cu (NO3)2·3H2O (1.05 g) was added to 30 mL (v/v, 1:1) water-ethanol mixture, followed by the addition of H3BTC (0.5 g). The solution was transferred into the lining of Poly Tetra Fluoro Ethylene (PTFE) and then sealed in the autoclave for reaction at 120 °C for 24 h. After cooling to room temperature, the product was collected and stirred in a water-ethanol mixture (v/v, 1:1) for 5 min. The supernatant was centrifuged and discarded. Finally, the product was dried in a vacuum drying oven at 80 °C for 6 h.

3.4. Adsorption Equilibrium and Adsorption Kinetics Experiments

The standard solutions of lincomycin were prepared at 5, 15, 20, 50, 80, 150, 200, and 300 mg/L. Next, 2.0 mg of Cu-MOFs were dispersed in 3 mL of these lincomycin standard solutions of different concentrations. The two components were allowed to be mixed at 25 °C and 200 r/min for 24 h. Later, the mixture was centrifuged at 6000 r/min for 8 min and the supernatant was collected and filtered through a 0.22 µm microporous filtration membrane. The concentration of lincomycin in the supernatant was determined by HPLC-MS/MS.
In the adsorption kinetics experiments, 2.0 mg of Cu-MOFs were dispersed in a series of 3 mL solutions containing 50 mg/L of the lincomycin standard. Subsequently, the mixture was incubated for 3 h, and the remaining lincomycin concentration was detected at different points in time. The supernatant was collected by centrifugation at 6000 r/min for 8 min. The supernatant was then filtered through a 0.22-m microporous membrane. The concentration of lincomycin in the supernatant was determined by HPLC-MS/MS.

3.5. Optimization of the Eluent

The desorption efficiency of lincomycin on Cu-MOFs will depend on the type of elution solvent used. Methanol, acetonitrile, pure water, methanol with 1% formic acid, and acetonitrile containing 1% formic acid were selected as the elution solvents in this experiment. The amount of adsorbent, the adsorption time, and the elution volume were 2 mg, 12 h, and 3 mL, respectively. Five elution solvents were investigated.

3.6. Effect of pH on the Adsorption Process

For this experiment, 2.0 mg of Cu-MOFs were dispersed in 3 mL of a solution containing 50 mg/L of the antibiotic solution. NaOH (0.1 mol/L) and HCl (0.1 mol/L) solutions were added to adjust the pH of the solutions (4–10). After oscillating at 25 °C for 12 h, the supernatant was collected by high-speed centrifugation involving speeds above 7000 r/min and the concentration of the antibiotics was determined.

3.7. Pretreatment of the Milk Samples and SPE-HPLC-MS/MS Method for Determination of Lincomycin in Cow Milk Samples

The three milk samples (A, B, and C) were obtained from local supermarkets in Tianjin, China. The milk samples were extracted with two volumes of acetonitrile. The mixture was refrigerated for 20 min and then centrifuged at 12,000 r/min for 10 min to remove the precipitate. The supernatant was stored at 4 °C until further analysis.
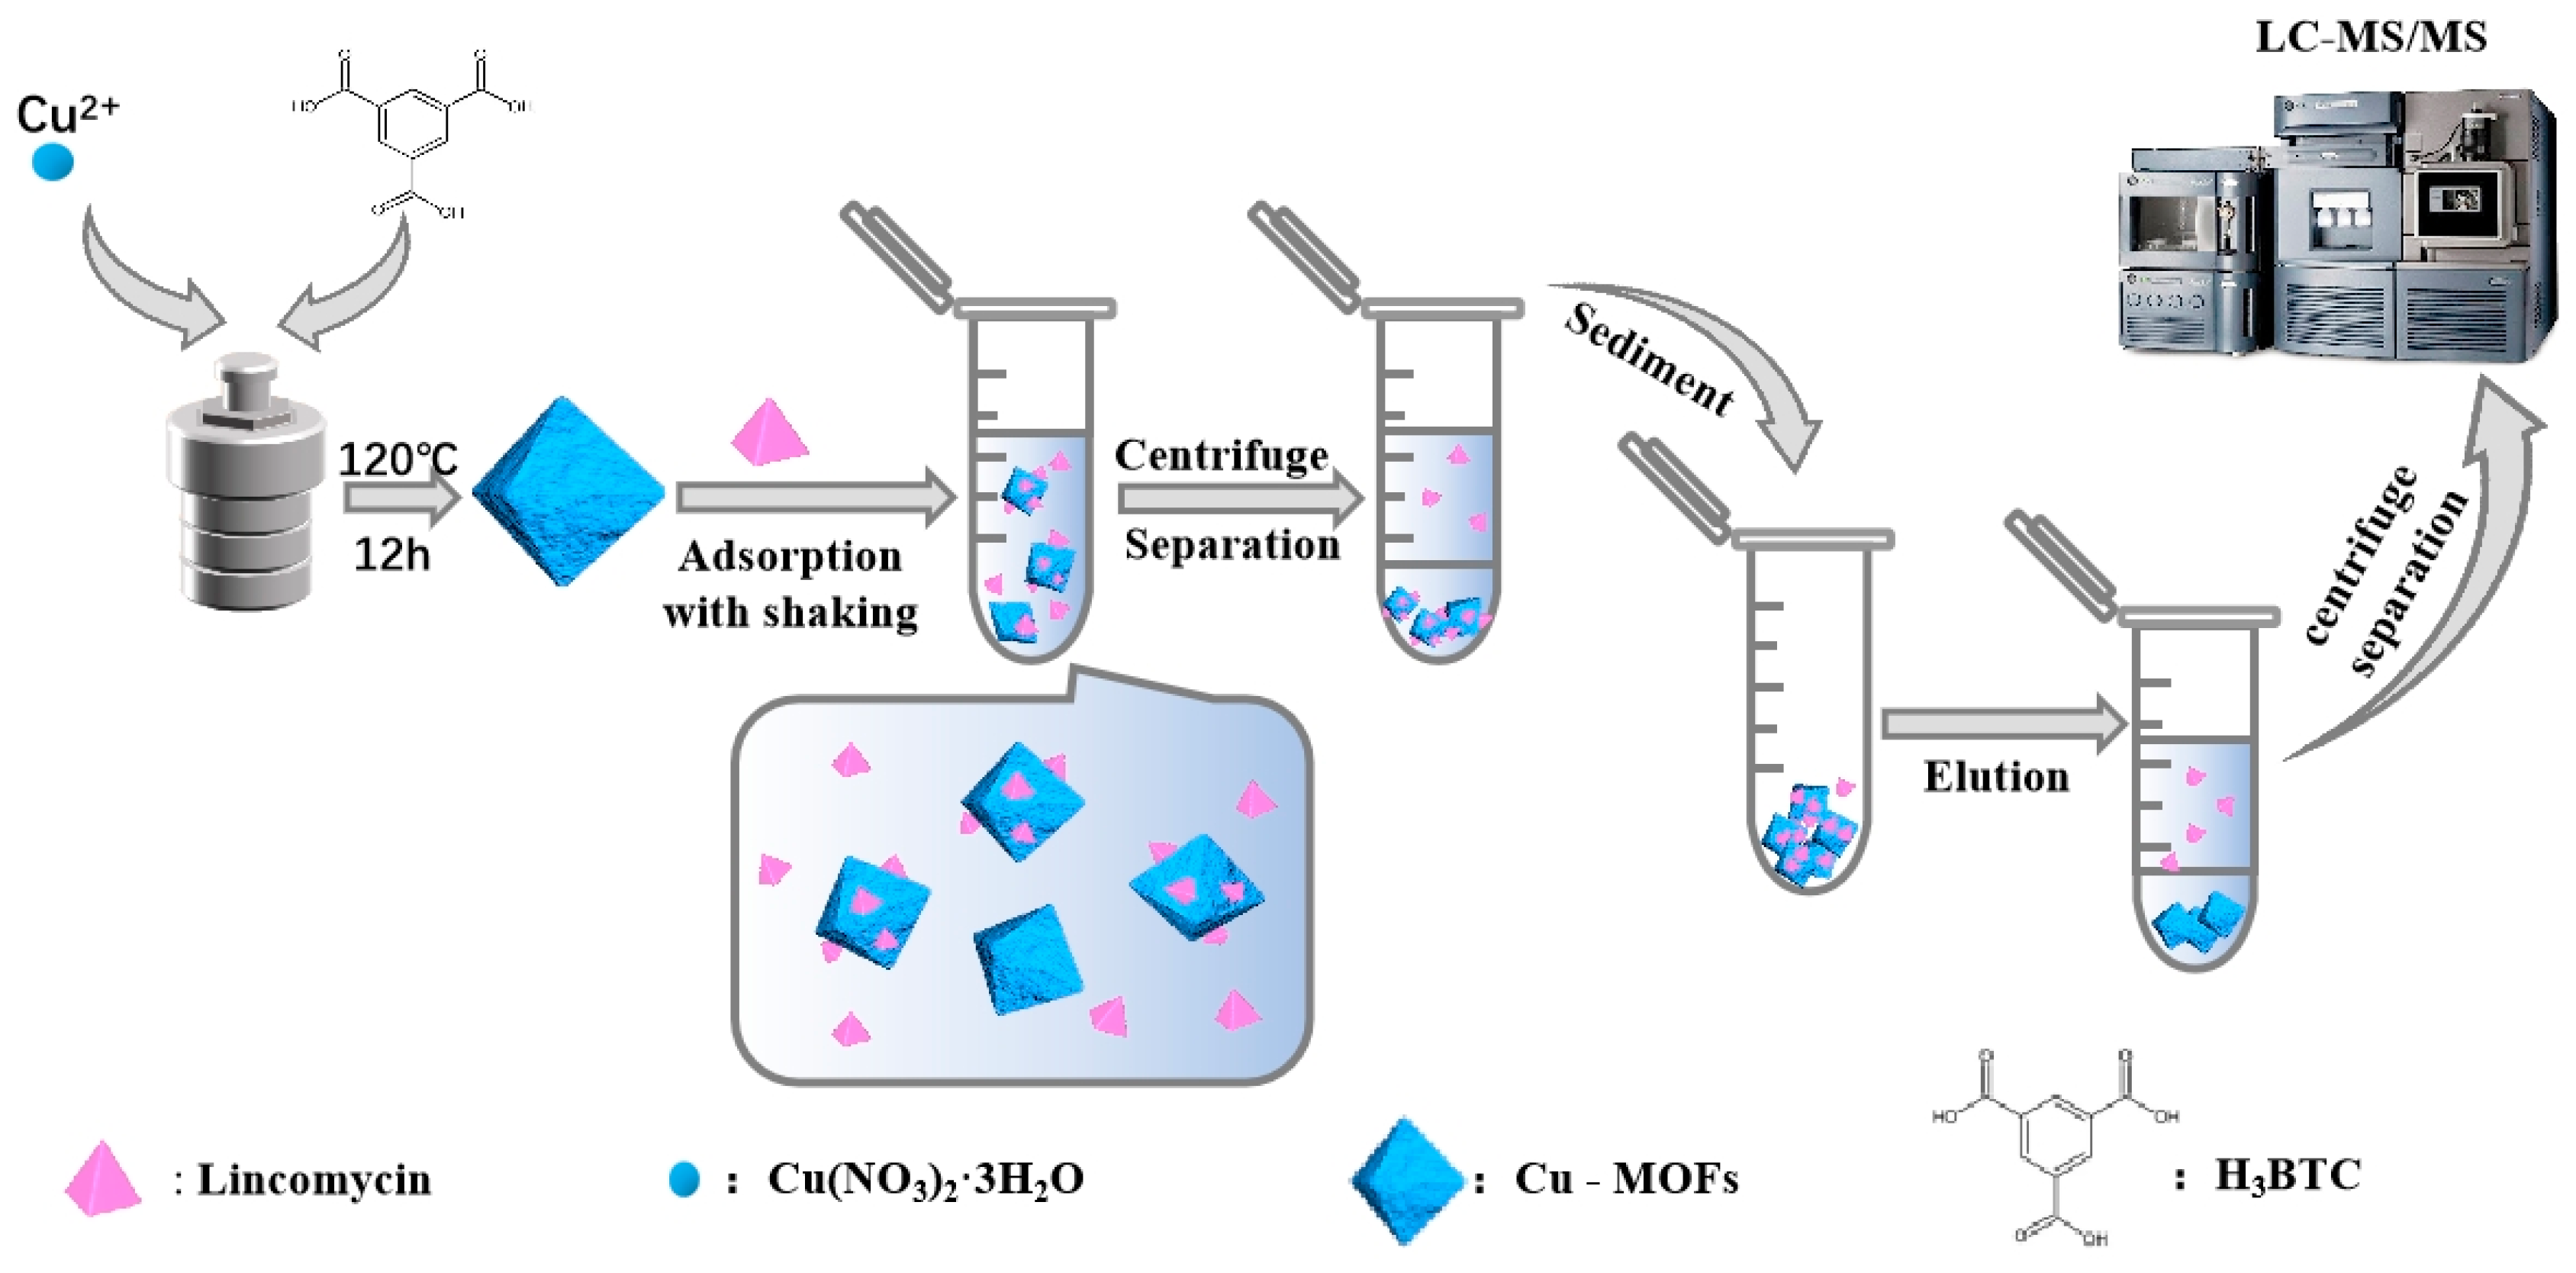
The schematic of SPE-HPLC-MS/MS and the extraction procedure are described in Figure 8. A fixed volume of the standard analyte solution was added to 10 mL of the milk extract samples, and 2.0 mg of the Cu-MOFs was homogeneously dispersed into the sample solution. The extraction was performed simultaneously with vortex oscillation for 12 h. Subsequently, high-speed spinning centrifugation was applied to separate the adsorbent from the sample solution. The sorbents were then eluted with 3 mL of 1% formic acid in acetonitrile with oscillation for 1.5 h. Finally, the collected eluent was filtered through a 0.22 µm filter membrane for HPLC-MS/MS analysis.

4. Conclusions

In this study, Cu-MOFs were prepared by the solvothermal method and successfully applied for the first time for the detection of lincomycin in milk samples. The adsorption capacity of lincomycin was 131.41 mg/g, which followed the Langmuir isothermal adsorption equation and the pseudo-second-order adsorption kinetics model. Cu-MOFs exhibited the best adsorption performance at pH = 7 and exhibited optimal extraction efficiency, enrichment and stability. The method was advantageous in terms of good precision, low detection limit, high recovery rate, and easy operation. Therefore, Cu-MOF is a promising adsorbent material for the enrichment and extraction of other antibiotics from different samples.

Author Contributions

Writing—original draft, H.L.; Writing—review & editing, J.W. (Jin Wu); Project administration, J.W. (Jinhai Wu), J.B. and J.W. (Jianhu Wu). All authors have read and agreed to the published version of the manuscript.

Funding

The authors thank the Natural Science Foundation of Tianjin (No. 20JCQNJC00860, 2019GGRC03, and 2019CXTD03) for funding this research project.

Institutional Review Board Statement

Not applicable.

Informed Consent Statement

Not applicable.

Data Availability Statement

Not available.

Conflicts of Interest

The authors declare no conflict of interest.

Sample Availability

Not available.

References

  1. Du, C.; Zhang, Z.; Yu, G.; Wu, H.; Chen, H.; Zhou, L.; Zhang, Y.; Su, Y.; Tan, S.; Yang, L.; et al. A review of metal organic framework (MOFs)-based materials for antibiotics removal via adsorption and photocatalysis. Chemosphere 2021, 272, 129501. [Google Scholar] [CrossRef] [PubMed]
  2. Du, L.; Li, G.; Gong, W.; Zhu, J.; Liu, L.; Zhu, L.; Liu, Z. Establishment and validation of the LC-MS/MS method for the determination of lincomycin in human blood: Application to an allergy case in forensic science. J. Forensic. Leg. Med. 2021, 77, 102094. [Google Scholar] [CrossRef]
  3. Burkin, M.A.; Galvidis, I.A. Development of a competitive indirect ELISA for the determination of lincomycin in milk, eggs, and honey. J. Agric. Food Chem. 2010, 58, 9893–9898. [Google Scholar] [CrossRef] [PubMed]
  4. Guo, Y.; Xie, X.; Diao, Z.; Wang, Y.; Wang, B.; Xie, K.; Wang, X.; Zhang, P. Detection and determination of spectinomycin and lincomycin in poultry muscles and pork by ASE-SPE-GC-MS/MS. J. Food Compos. Anal. 2021, 101, 103979. [Google Scholar] [CrossRef]
  5. Mehrtens, A.; Licha, T.; Burke, V. Occurrence, effects and behaviour of the antibiotic lincomycin in the agricultural and aquatic environment—A review. Sci. Total Environ. 2021, 778, 146306. [Google Scholar] [CrossRef] [PubMed]
  6. Rathod, N.V.; Rao, A.; Kumar, P.; Ramakumar, K.L.; Malkhede, D.D. Studies on Complexation and Supercritical Fluid Extraction of Cd2+ with Calixarenes. Ind. Eng. Chem. Res. 2015, 54, 3933–3941. [Google Scholar] [CrossRef]
  7. Yang, W.; Wang, J.; Han, Y.; Luo, X.; Tang, W.; Yue, T.; Li, Z. Robust MOF film of self-rearranged UiO-66-NO2 anchored on gelatin hydrogel via simple thermal-treatment for efficient Pb(II) removal in water and apple juice. Food Control 2021, 130, 108409. [Google Scholar] [CrossRef]
  8. Mnyandu, H.M.; Mahlambi, P.N. Optimization and application of QuEChERS and SPE methods followed by LC-PDA for the determination of triazines residues in fruits and vegetables from Pietermaritzburg local supermarkets. Food Chem. 2021, 360, 129818. [Google Scholar] [CrossRef]
  9. Sammani, M.S.; Clavijo, S.; Cerdà, V. Recent, advanced sample pretreatments and analytical methods for flavonoids determination in different samples. TrAC Trends Anal. Chem. 2021, 138, 116220. [Google Scholar] [CrossRef]
  10. Liang, S.; Dai, H.; Wang, C.; Zhang, H.; Li, J.; Xu, Q.; Zhang, Q. Application of polydopamine fibers mat for simultaneous detection of multi-class drug residues in various animal-original foods. Food Control 2022, 132, 108532. [Google Scholar] [CrossRef]
  11. Wang, J.; Qi, L.; Hou, C.; Zhang, T.; Chen, M.; Meng, H.; Su, M.; Xu, H.; Hua, Z.; Wang, Y.; et al. Automatic analytical approach for the determination of 12 illicit drugs and nicotine metabolites in wastewater using on-line SPE-UHPLC-MS/MS. J. Pharm. Anal. 2021, 11, 739–745. [Google Scholar] [CrossRef] [PubMed]
  12. Deng, N.; Wang, L.; Feng, Y.; Liu, M.; Li, Q.; Wang, G.; Zhang, L.; Kang, W.; Cheng, B.; Liu, Y. Co-based and Cu-based MOFs modified separators to strengthen the kinetics of redox reaction and inhibit lithium-dendrite for long-life lithium-sulfur batteries. Chem. Eng. J. 2020, 388, 124241. [Google Scholar] [CrossRef]
  13. Liu, G.; Li, L.; Huang, X.; Zheng, S.; Xu, D.; Xu, X.; Zhang, Y.; Lin, H. Determination of triazole pesticides in aqueous solution based on magnetic graphene oxide functionalized MOF-199 as solid phase extraction sorbents. Microporous Mesoporous Mater. 2018, 270, 258–264. [Google Scholar] [CrossRef]
  14. Jia, Y.; Wang, Y.; Yan, M.; Wang, Q.; Xu, H.; Wang, X.; Zhou, H.; Hao, Y.; Wang, M. Fabrication of iron oxide@MOF-808 as a sorbent for magnetic solid phase extraction of benzoylurea insecticides in tea beverages and juice samples. J. Chromatogr. A 2020, 1615, 460766. [Google Scholar] [CrossRef] [PubMed]
  15. Uflyand, I.E.; Zhinzhilo, V.A.; Nikolaevskaya, V.O.; Kharisov, B.I.; González, C.M.; Kharissova, O.V. Recent strategies to improve MOF performance in solid phase extrac-tion of organic dyes. Microchem. J. 2021, 168, 106387. [Google Scholar] [CrossRef]
  16. Zhu, W.; Gao, L.; Zhang, Y.; Zhang, Q.; Hong, Y.; Shen, W.; Wang, Y.; Zhu, J. Insight into the liquid adsorption of tobacco specific nitrosamines on ZIF-8. Microporous Mesoporous Mater. 2022, 333, 111730. [Google Scholar] [CrossRef]
  17. Zhang, H.; Huang, C.; Zhang, Z.; Xiang, L.; Yue, S.; Shen, Z.; Li, J. Structure engineering of Zn-ZIF adsorbents for efficient and highly-selective phosphate removal from wastewater: Roles of surface mesopore and defect. Appl. Surf. Sci. 2022, 586, 152814. [Google Scholar] [CrossRef]
  18. Shi, Z.; Xu, C.; Guan, H.; Li, L.; Fan, L.; Wang, Y.; Liu, L.; Meng, Q.; Zhang, R. Magnetic metal organic frameworks (MOFs) composite for removal of lead and malachite green in wastewater. Colloids Surf. A Physicochem. Eng. Asp. 2018, 539, 382–390. [Google Scholar] [CrossRef] [Green Version]
  19. Stypulkowska, K.; Blazewicz, A.; Brudzikowska, A.; Grzeskiewicz, M.W.; Sarna, K.; Fijalek, Z. Development of high performance liquid chromatography methods with charged aerosol detection for the determination of lincomycin, spectinomycin and its impurities in pharmaceutical products. J. Pharm. Biomed. Anal. 2015, 112, 8–14. [Google Scholar] [CrossRef]
  20. Ren, X.; He, T.; Wang, J.; Wang, L.; Wang, Y.; Liu, X.; Dong, Y.; Ma, J.; Jia, J.; Song, R.; et al. UV spectroscopy and HPLC combined with chemometrics for rapid discrimination and quantification of Curcumae Rhizoma from three botanical origins. J. Pharm. Biomed. Anal. 2021, 202, 114145. [Google Scholar] [CrossRef]
  21. Wong, J.W.; Zhang, K.; Tech, K.; Hayward, D.G.; Makovi, C.M.; Krynitsky, A.J.; Schenck, F.J.; Banerjee, K.; Dasgupta, S.; Brown, D. Multiresidue pesticide analysis in fresh produce by capillary gas chromatography-mass spectrometry/selective ion monitoring (GC-MS/SIM) and -tandem mass spectrometry (GC-MS/MS). J. Agric. Food Chem. 2010, 58, 5868–5883. [Google Scholar] [CrossRef] [PubMed]
  22. Wong, J.W.; Zhang, K.; Tech, K.; Hayward, D.G.; Krynitsky, A.J.; Cassias, I.; Schenck, F.J.; Banerjee, K.; Dasgupta, S.; Brown, D. Multiresidue pesticide analysis of ginseng powders using acetonitrile- or acetone-based extraction, solid-phase extraction cleanup, and gas chromatography-mass spectrometry/selective ion monitoring (GC-MS/SIM) or -tandem mass spectrometry (GC-MS/MS). J. Agric. Food Chem. 2010, 58, 5884–5896. [Google Scholar] [CrossRef] [PubMed]
  23. McCullum, C.; Tchounwou, P.; Ding, L.S.; Liao, X.; Liu, Y.M. Extraction of aflatoxins from liquid foodstuff samples with polydopamine-coated superparamagnetic nanoparticles for HPLC-MS/MS analysis. J. Agric. Food Chem. 2014, 62, 4261–4267. [Google Scholar] [CrossRef] [PubMed]
  24. Guan, X.; Li, Q.; Maimaiti, T.; Lan, S.; Ouyang, P.; Ouyang, B.; Wu, X.; Yang, S.T. Toxicity and photosynthetic inhibition of metal-organic framework MOF-199 to pea seedlings. J. Hazard. Mater. 2021, 409, 124521. [Google Scholar] [CrossRef] [PubMed]
  25. Homayoonnia, S.; Zeinali, S. Design and fabrication of capacitive nanosensor based on MOF nanoparticles as sensing layer for VOCs detection. Sens. Actuators B Chem. 2016, 237, 776–786. [Google Scholar] [CrossRef]
  26. Niu, H.; Liu, P.; Qin, F.; Liu, X.; Akinay, Y. PEDOT coated Cu-BTC metal-organic frameworks decorated with Fe3O4 nanoparticles and their enhanced electromagnetic wave absorption. Mater. Chem. Phys. 2020, 253, 123458. [Google Scholar] [CrossRef]
  27. Liu, X.M.; Rather, S.-u.; Li, Q.; Lueking, A.; Zhao, Y.; Li, J. Hydrogenation of CuBTC Framework with the Introduction of a PtC Hydrogen Spillover Catalyst. J. Phys. Chem. C 2012, 116, 3477–3485. [Google Scholar] [CrossRef]
  28. Li, Z.-Q.; Qiu, L.-G.; Xu, T.; Wu, Y.; Wang, W.; Wu, Z.-Y.; Jiang, X. Ultrasonic synthesis of the microporous metal–organic framework Cu3(BTC)2 at ambient temperature and pressure: An efficient and environmentally friendly method. Mater. Lett. 2009, 63, 78–80. [Google Scholar] [CrossRef]
  29. Chen, Y.C.; Andrew Lin, K.Y.; Chen, K.F.; Jiang, X.Y.; Lin, C.H. In vitro renal toxicity evaluation of copper-based metal-organic framework HKUST-1 on human embryonic kidney cells. Environ. Pollut. 2021, 273, 116528. [Google Scholar] [CrossRef]
  30. Wang, F.; Guo, H.; Chai, Y.; Li, Y.; Liu, C. The controlled regulation of morphology and size of HKUST-1 by “coordination modulation method”. Microporous Mesoporous Mater. 2013, 173, 181–188. [Google Scholar] [CrossRef]
  31. Ezzati, R. Derivation of Pseudo-First-Order, Pseudo-Second-Order and Modified Pseudo-First-Order rate equations from Langmuir and Freundlich isotherms for adsorption. Chem. Eng. J. 2020, 392, 123705. [Google Scholar] [CrossRef]
  32. Chung, H.-K.; Kim, W.-H.; Park, J.; Cho, J.; Jeong, T.-Y.; Park, P.-K. Application of Langmuir and Freundlich isotherms to predict adsorbate removal efficiency or required amount of adsorbent. J. Ind. Eng. Chem. 2015, 28, 241–246. [Google Scholar] [CrossRef]
  33. Liu, C.H.; Chuang, Y.H.; Li, H.; Boyd, S.A.; Teppen, B.J.; Gonzalez, J.M.; Johnston, C.T.; Lehmann, J.; Zhang, W. Long-term sorption of lincomycin to biochars: The intertwined roles of pore diffusion and dissolved organic carbon. Water Res. 2019, 161, 108–118. [Google Scholar] [CrossRef] [PubMed]
  34. Mahmoud, M.E.; El-Ghanam, A.M.; Mohamed, R.H.A.; Saad, S.R. Enhanced adsorption of Levofloxacin and Ceftriaxone antibiotics from water by assembled composite of nanotitanium oxide/chitosan/nano-bentonite. Mater. Sci. Eng. C Mater. Biol. Appl. 2020, 108, 110199. [Google Scholar] [CrossRef]
  35. Revellame, E.D.; Fortela, D.L.; Sharp, W.; Hernandez, R.; Zappi, M.E. Adsorption kinetic modeling using pseudo-first order and pseudo-second order rate laws: A review. Clean. Eng. Technol. 2020, 1, 100032. [Google Scholar] [CrossRef]
  36. Li, F.F.; Cui, W.R.; Jiang, W.; Zhang, C.R.; Liang, R.P.; Qiu, J.D. Stable sp(2) carbon-conjugated covalent organic framework for detection and efficient adsorption of uranium from radioactive wastewater. J. Hazard. Mater. 2020, 392, 122333. [Google Scholar] [CrossRef]
  37. Li, Y.; Zhang, H.; Chen, Y.; Huang, L.; Lin, Z.; Cai, Z. Core-Shell Structured Magnetic Covalent Organic Framework Nanocomposites for Triclosan and Triclocarban Adsorption. ACS Appl. Mater. Interfaces 2019, 11, 22492–22500. [Google Scholar] [CrossRef] [PubMed]
  38. Alamgir; Talha, K.; Wang, B.; Liu, J.-H.; Ullah, R.; Feng, F.; Yu, J.; Chen, S.; Li, J.-R. Effective adsorption of metronidazole antibiotic from water with a stable Zr(IV)-MOFs: Insights from DFT, kinetics and thermodynamics studies. J. Environ. Chem. Eng. 2020, 8, 103642. [Google Scholar] [CrossRef]
  39. Zhao, F.; Fang, S.; Gao, Y.; Bi, J. Removal of aqueous pharmaceuticals by magnetically functionalized Zr-MOFs: Adsorption Kinetics, Isotherms, and regeneration. J. Colloid Interface Sci. 2022, 615, 876–886. [Google Scholar] [CrossRef]
  40. Gbylik-Sikorska, M.; Lebkowska-Wieruszewska, B.; Gajda, A.; Nowacka-Kozak, E.; Lisowski, A.; Posyniak, A. Transfer of enrofloxacin, ciprofloxacin, and lincomycin into eggshells and residue depletion in egg components after multiple oral administration to laying hens. Poult. Sci. 2021, 100, 101341. [Google Scholar] [CrossRef]
  41. Zhou, J.; Zhu, K.; Xu, F.; Wang, W.; Jiang, H.; Wang, Z.; Ding, S. Development of a microsphere-based fluorescence immunochromatographic assay for monitoring lincomycin in milk, honey, beef, and swine urine. J. Agric. Food Chem. 2014, 62, 12061–12066. [Google Scholar] [CrossRef] [PubMed]
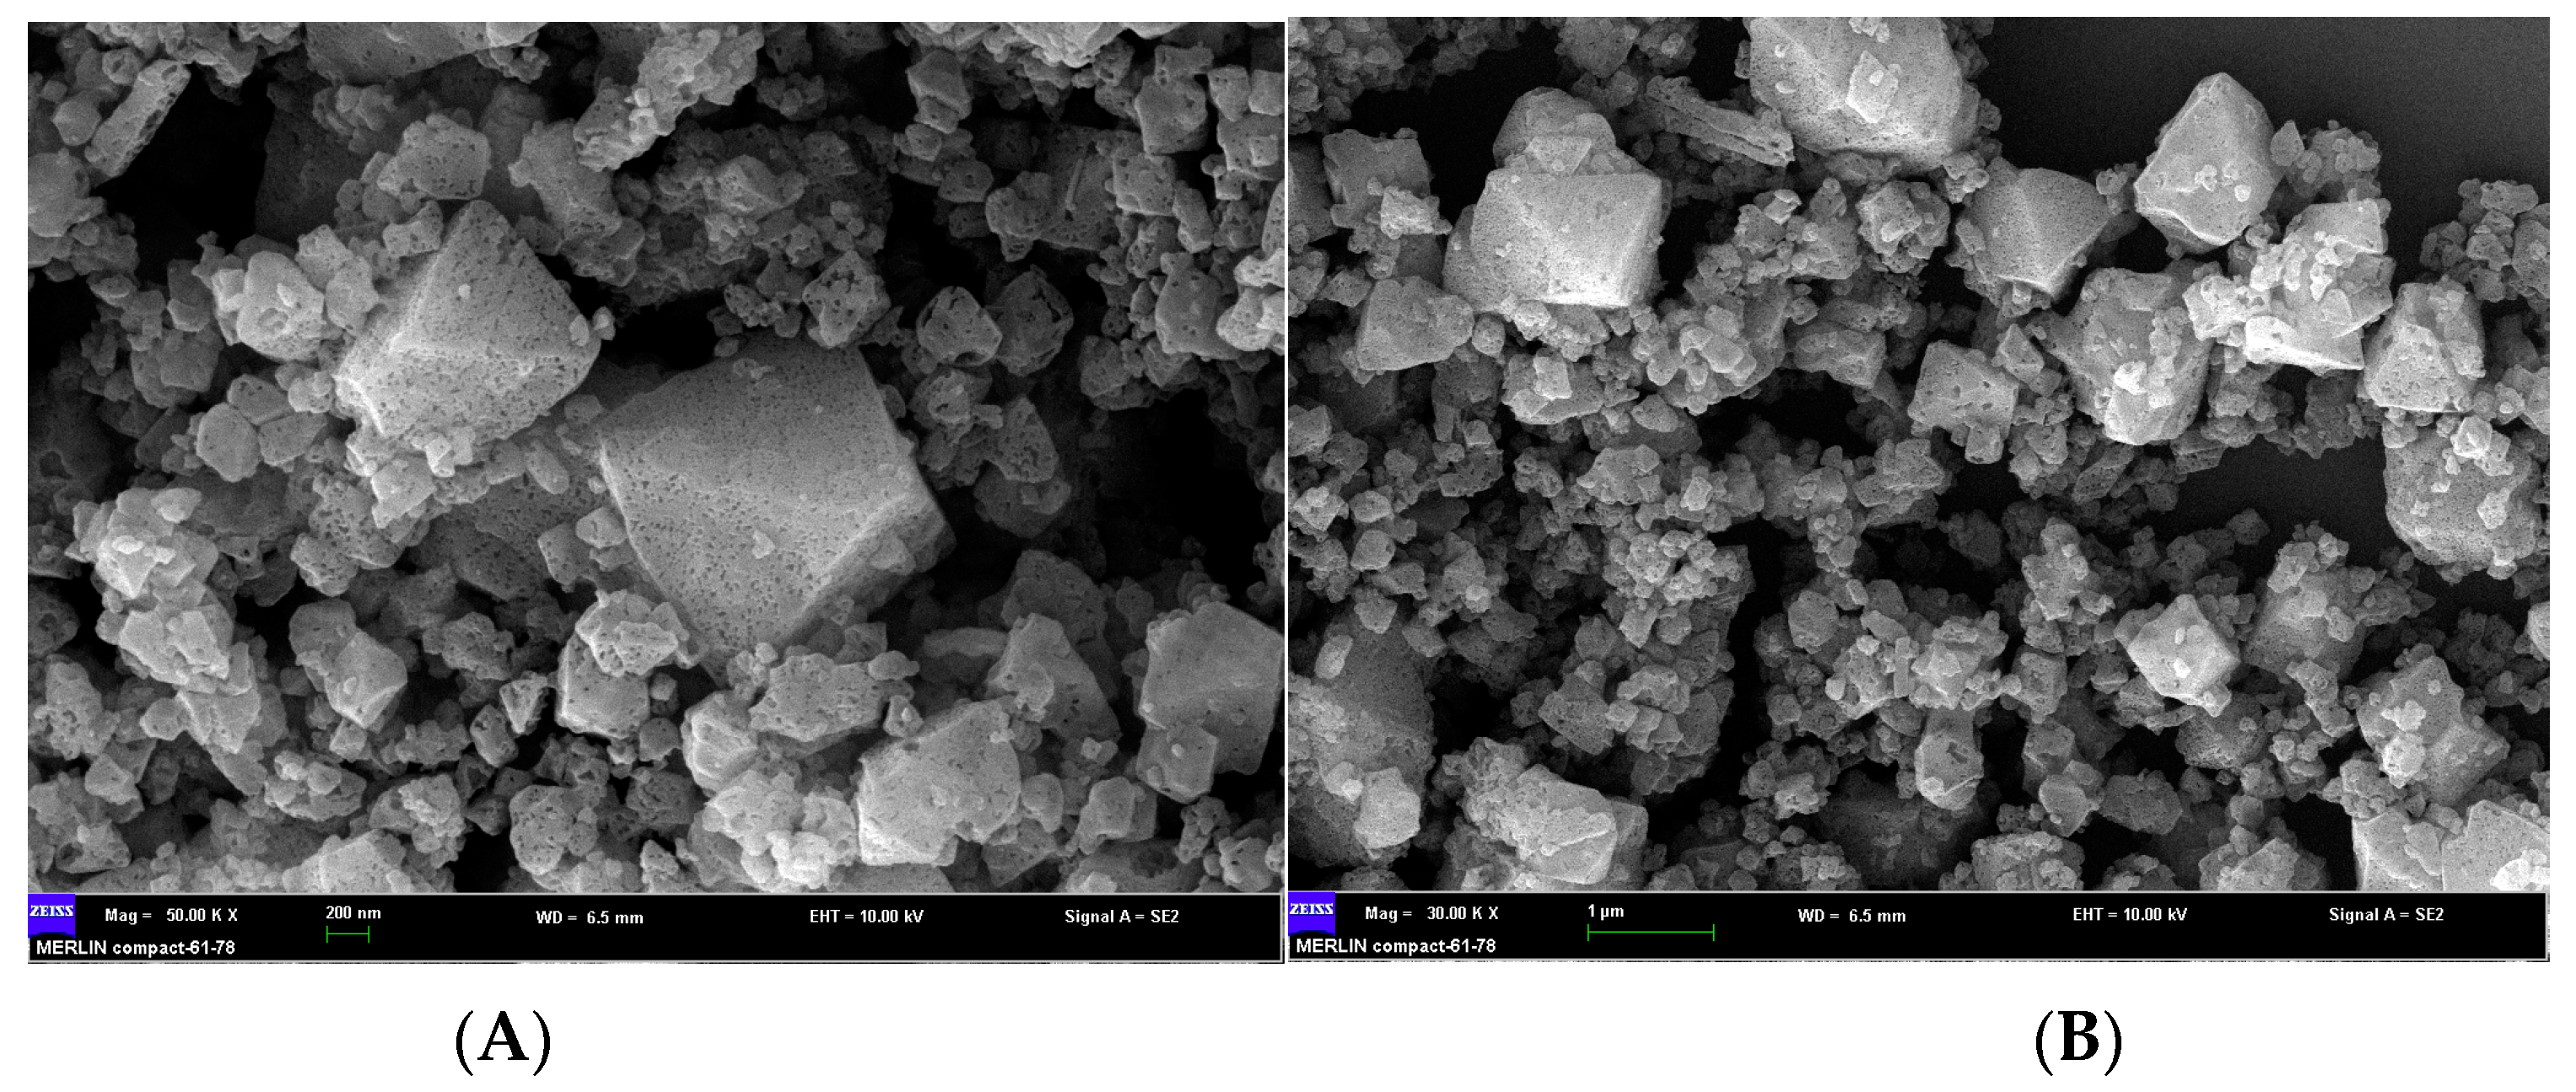
Figure 1. (A) high-magnification (50K ×) SEM. image of the Cu-MOFs; (B) low-magnification (30K ×) SEM. image of Cu-MOFs.
Molecules 28 05307 g001
Figure 2. (A) XRD patterns of Cu–MOFs, (B) FT-IR spectra of Cu–MOFs, (C) N2 adsorption-desorption isotherms of Cu–MOFs, (D) Pore size distribution of Cu–MOFs.
Molecules 28 05307 g002
Figure 3. Comprehensive Thermal Analysis of Cu-MOFs.
Molecules 28 05307 g003
Figure 4. Adsorption equilibrium of lincomycin by Cu-MOFs, (A) Adsorption equilibrium curve, (B) Langmuir isothermal adsorption fitting curves, (C) Freundlich isothermal adsorption fitting curves.
Molecules 28 05307 g004
Figure 5. The adsorption kinetic results of lincomycin by the Cu-MOFs, (A) The adsorption kinetic curve, (B) The pseudo-first-order kinetic model, (C) The pseudo second-order kinetic model.
Molecules 28 05307 g005
Figure 6. Effect of the solvent type on the recovery of lincomycin (A: MeOH. B: Acetonitrile. C: Water. D: MeOH containing 1% formic acid. E: Acetonitrile containing 1%formic acid).
Molecules 28 05307 g006
Figure 7. (A) Structure of lincomycin, (B) pH effects during the adsorption process.
Molecules 28 05307 g007
Figure 8. Schematic of the SPE-HPLC-MS/MS procedure for lincomycin extraction from milk samples based on Cu-MOFs.
Molecules 28 05307 g008
Table 1. Parameters for Langmuir and Freundlich adsorption isotherm fitting curve.
LangmuirFreundlich
b (L·mg−1)Q (mg·g−1)R2Kf/(mg·g−1·(L·mg−1)1/n)nR2
Lincomycin0.012131.410.984.2561.550.97
Table 2. Fitting parameters of adsorption kinetics.
The Pseudo First OrderThe Pseudo Second Order
k1/min−1q/(mg·g−1)R2k2/(g·mg−1·min−1)q/(mg·g−1)R2
Lincomycin0.00329112.9740.960.0005168.21280.99
Table 3. Recoveries of spiked milk samples using the current method (n = 3).
SimpleSpiked (μg/L)Recovery/%RSD/%
Milk A10092.30.83
50096.90.25
100097.01.81
Milk B10092.31.16
50096.71.29
100096.90.89
Milk C10093.11.49
50097.11.96
100097.20.97
Table 4. Comparison of the method developed in the present study with other relevant reported methods for the determination of lincomycin.
MethodSampleAdsorbentLODRecovery (%)Ref.
LC-MS/MSeggsNO0.5 μg/kg86.00–111.00[40]
ASE-SPE-GC–MS/MSpoultry
muscles and pork
diatomaceous earth4.6 μg/kg79.70–94.20 [4]
PPE-LC-MS/MShuman bloodNO0.2 ng/mL72.70–84.13[2]
FMIAMilk,
Honey, Beef, and Swine Urine
NO0.69 ng/mL73.92–120.50[41]
SPE-HPLC-MS/MSMilkCu-MOFs0.13 ng/mL92.30–97.20This work
Table 5. Elution procedure.
Time/minMobile Phase A/%Mobile Phase B/%Flow Rate/(mL·min−1)
Initial65350.300
1.0065350.300
1.2010000.300
1.5001000.300
2.0065350.300
4.0065350.300
Disclaimer/Publisher’s Note: The statements, opinions and data contained in all publications are solely those of the individual author(s) and contributor(s) and not of MDPI and/or the editor(s). MDPI and/or the editor(s) disclaim responsibility for any injury to people or property resulting from any ideas, methods, instructions or products referred to in the content.