Article

Experimental and Theoretical Estimations of Atrazine’s Adsorption in Mangosteen-Peel-Derived Nanoporous Carbons

by
Juan Matos
1,*,
Claudia P. Amézquita-Marroquín
2,3,
Johan D. Lozano
3,
Jhon Zapata-Rivera
3,
Liliana Giraldo
4,
Po S. Poon
5 and
Juan C. Moreno-Piraján
3,*
1
Instituto de Ciencias Aplicadas, Facultad de Ingeniería, Universidad Autónoma de Chile, Santiago 8900000, Chile
2
Escuela de Ingeniería de los Recursos Naturales y del Ambiente, Facultad de Ingeniería, Universidad del Valle, Calle 13 100-00, Cali 760035, Colombia
3
Departamento de Química, Facultad de Ciencias, Universidad de los Andes, Carrera Primera 18A-12, Bogotá 111711, Colombia
4
Departamento de Química, Facultad de Ciencias, Universidad Nacional de Colombia, Carrera 45, Bogotá 111231, Colombia
5
Unidad de Desarrollo Tecnológico (UDT), Universidad de Concepción, Barrio Universitario s/n, Concepción 4191996, Chile
*
Authors to whom correspondence should be addressed.
Molecules 2023, 28(13), 5268; https://doi.org/10.3390/molecules28135268
Submission received: 10 June 2023 / Revised: 2 July 2023 / Accepted: 5 July 2023 / Published: 7 July 2023

Abstract

:
Nanoporous carbons were prepared via chemical and physical activation from mangosteen-peel-derived chars. The removal of atrazine was studied due to the bifunctionality of the N groups. Pseudo-first-order, pseudo-second-order, and intraparticle pore diffusion kinetic models were analyzed. Adsorption isotherms were also analyzed according to the Langmuir and Freundlich models. The obtained results were compared against two commercially activated carbons with comparable surface chemistry and porosimetry. The highest uptake was found for carbons with higher content of basic surface groups. The role of the oxygen-containing groups in the removal of atrazine was estimated experimentally using the surface density. The results were compared with the adsorption energy of atrazine theoretically estimated on pristine and functionalized graphene with different oxygen groups using periodic DFT methods. The energy of adsorption followed the same trend observed experimentally, namely the more basic the pH, the more favored the adsorption of atrazine. Micropores played an important role in the uptake of atrazine at low concentrations, but the presence of mesoporous was also required to inhibit the pore mass diffusion limitations. The present work contributes to the understanding of the interactions between triazine-based pollutants and the surface functional groups on nanoporous carbons in the liquid–solid interface.

1. Introduction

The remarkable increase in emerging organic pollutants (EOPs) in surface and underground water sources is the consequence of different industrial activities. It has been reported that EOPs persist in drinking water even after being treated using conventional methods [1,2,3,4,5,6,7,8]. Well-known pesticides, herbicides, and fungicides are widely used in agriculture to prevent, combat, and destroy any pest. However, most of them generate negative impacts on the environment and health [1,2,3,8,9]. For instance, atrazine is one of the most widely used herbicides worldwide [10,11]. It is characterized by a triazine ring substituted with chlorine, ethylamine, and isopropylamine, which makes it recalcitrant to biological degradation in nature [12]. Atrazine and its degradation products are toxic and highly resistant; remain for many years in water, plants, and animals; and interfere with the life cycles of many species [13,14,15,16]. Animal studies have shown that atrazine causes neuroendocrine and reproductive problems and affects the development of pregnancy [17]. In rats and rabbits, the observed effects include the deterioration of neurological and reproductive systems and a decrease in the fetal body weight, and at concentrations as low as 0.1 μg·L−1, induced hermaphroditism in frogs [18]. Albuquerque et al. [19] concluded that atrazine has common toxic effects in aquatic species such as amphibians, fish, and crustaceans, among others. In humans, atrazine generates different health complications, ranging from irritations to probable alterations in the functions of some organs, reproduction problems, alterations in hormonal levels, premature births, birth defects, and low birth weight. It also affects the immune system and the endocrine system and causes highly strung sensations [10,20,21,22,23].
In the USA, Australia, and several European countries, atrazine has been prohibited or restricted due to its repercussions on the environment and health [11,15,24]. For instance, the Water Framework Directive [25] included atrazine as one of the 33 priority substances to be monitored in European waters. In addition, atrazine has been included in the list of prohibited pesticides for the year 2022, being prohibited in 44 countries, including 27 member countries of the European Union, the United States, Switzerland, Germany, and the United Kingdom, among others [26]. The tolerance limit of atrazine in water for human consumption is established in the United States at 3 μg·L−1 [11], while the World Health Organization establishes a limit of 2 μg·L−1 [27], and the European Community set the limit in 0.1 μg·L−1 for any individual pesticide and 0.5 μg·L−1 for the total pesticides used [25]. However, several works have reported atrazine concentrations in drinking water ranging from 0.02 to 1.9 μg·L−1 [28,29,30]. In rural zones in the Ebro River (Spain), atrazine concentrations of 12–170 μg·L−1 were found [31], while 2.4–8.2 μg·L−1 have been reported [32] in a coastal lagoon in the north of the Adriatic Sea. Latin American and Caribbean countries permit atrazine applications without any restriction. The permissible limit of atrazine in drinking water in Colombia is 0.1 μg·L−1 individually and 1 μg·L−1 for the total pesticides used [33]. However, according to the Central America and Caribbean regional report from the United Nations Environment Program, up to 2.9 μg·L−1 atrazine was found in groundwater with extensive sugarcane cultivation [34], while in Mexico, near an agricultural zone, concentrations of 4.6–15.0 μg·L−1 were found [35].
The aforementioned studies show that atrazine’s concentration exceeded the established limits, which reflects the need to develop an efficient technological solution for the removal of this pollutant [13,16]. In this sense, due to its high porosity and surface area, efficiency, simplicity of design, and low costs, adsorption by nanoporous carbon is one of the best technologies available for pesticide removal [1,36,37]. It is well known that the type of precursors and the parameters of activation influence porosimetry and surface chemistry, as they are responsible for the type of adsorption sites in porous carbons [38,39,40,41,42,43,44,45]. For instance, Dasgupta and coworkers [44] have reported that the surface chemistry of nanoporous carbons appears to be the most important parameter to control the interactions with polar molecules such as nitrobenzene. In an earlier study, our group [45] reported that nanoporous carbons with a high contribution of micropores are efficient to remove atrazine. However, the influence of the surface chemistry of carbons was not explored in that work.
The novelty of the present work is to verify the role of interfacial interactions between atrazine adsorption and porous carbons prepared from mangosteen-derived chars. Experimental studies for ATZ adsorption were performed, and different kinetics and equilibrium parameters were obtained and compared as a function of the textural and surface chemistry properties of carbons. Several theoretical estimations, including dipolar moments, adsorption energies, and density of states, were performed using the density functional theory for pristine and different oxygen-containing groups on graphene layers. These groups were selected from Boehm’s titrations performed on two porous carbons prepared using different methods from a mangosteen-peel-derived char. The results obtained from different kinetics/equilibrium studies of atrazine adsorption were compared against two commercially activated carbons.

2. Results and Discussion

2.1. N2 Adsorption–Desorption Isotherms

Figure 1a shows the N2 adsorption–desorption isotherms at −196 °C, and Figure 1b shows the pore size distributions of the two homemade carbons. The porous carbons presented type I(b) adsorption–desorption isotherm according to IUPAC classification [46,47], indicating that the pore size distributions (PSDs) were mainly composed of micropores [48], as can be seen in Figure 1b. The cumulative pore volume trend observed in the inset in Figure 1b suggests that the MPB-CO2 sample had a closed topology, with the main proportion comprising supermicropores (<1.0 nm). By contrast, the sample submitted to chemical activation (MPB-P50) mainly comprised large micropores (1.0–2.0 nm) and small mesopores (2.0–3.0 nm), even when the hysteresis loop was negligible. Table 1 shows a summary of the textural parameters and activation yields. For the sake of comparison, the commercially activated carbons [49] are also included.
The low yield observed in Table 1 for both MPB carbons suggests a high reactivity of the char during the activation [50,51]. For physical activation, direct gasification occurs under CO2 flow (pressure ca. 1 atm, flow ca. 100 mL·min−1) according to Equation (1).
C + CO2 → 2CO
Chemical activation is an indirect gasification reaction via steam, as shown in Equation (2), which is formed from the thermal degradation of H3PO4, according to Equation (3).
C + H2O → CO + H2
2H3PO4 → P2O5 + 3H2O
It is clear that SBET and Vtot for the char (MPB) were negligible compared with the other carbons. A higher value of SBET was observed for physical activation (ca. 1080 m2·g−1) than for chemical activation (ca. 847 m2·g−1), suggesting a more efficient interaction between the char and CO2, in agreement with a higher burn-off of ca. 76%. The present results are consistent with the experimental conditions used. In physical activation, 0.07 mols of CO2 flowed in 1 h activation at 800 °C, while only ca. 0.03 mols H2O were formed from H3PO4. Thus, keeping in mind that MPB char (for 100% C content) initially had ca. 0.083 mols, it is clear that physical activation should be more effective in the present conditions.
The PSD (Figure 1b) of the porous carbons is characterized by a large contribution to porosity in the range of 0.4 to 1.0 nm, with the highest contribution from ultramicropores, ranging from 0.4 to 0.7 nm for MPB-CO2. For MPB-P50, small mesopores had a low contribution in the range between 2 and 3 nm. The maximum contribution of micropore volume to the total volume of pores (Vmic/Vtot = 0.92) was observed for the MPB-CO2 sample, with a mean pore width ca. 0.72 nm, which was ca. 52% lower than MPB-P50 (ca. 1.38 nm). It is interesting to highlight that commercially activated carbons were selected for the present study due to their similarities with the carbons prepared from mangosteen-peel-derived char. For instance, ACM is mainly characterized by a micropore framework, with ca. 81% micropores and 0.96 nm of mean pore width, while ACPC presents only 60% microporosity and a mean pore width of ca. 1.98 nm, which corresponds to the double of ACM.

2.2. Scanning Electron Microscopy (SEM) and Surface Analysis

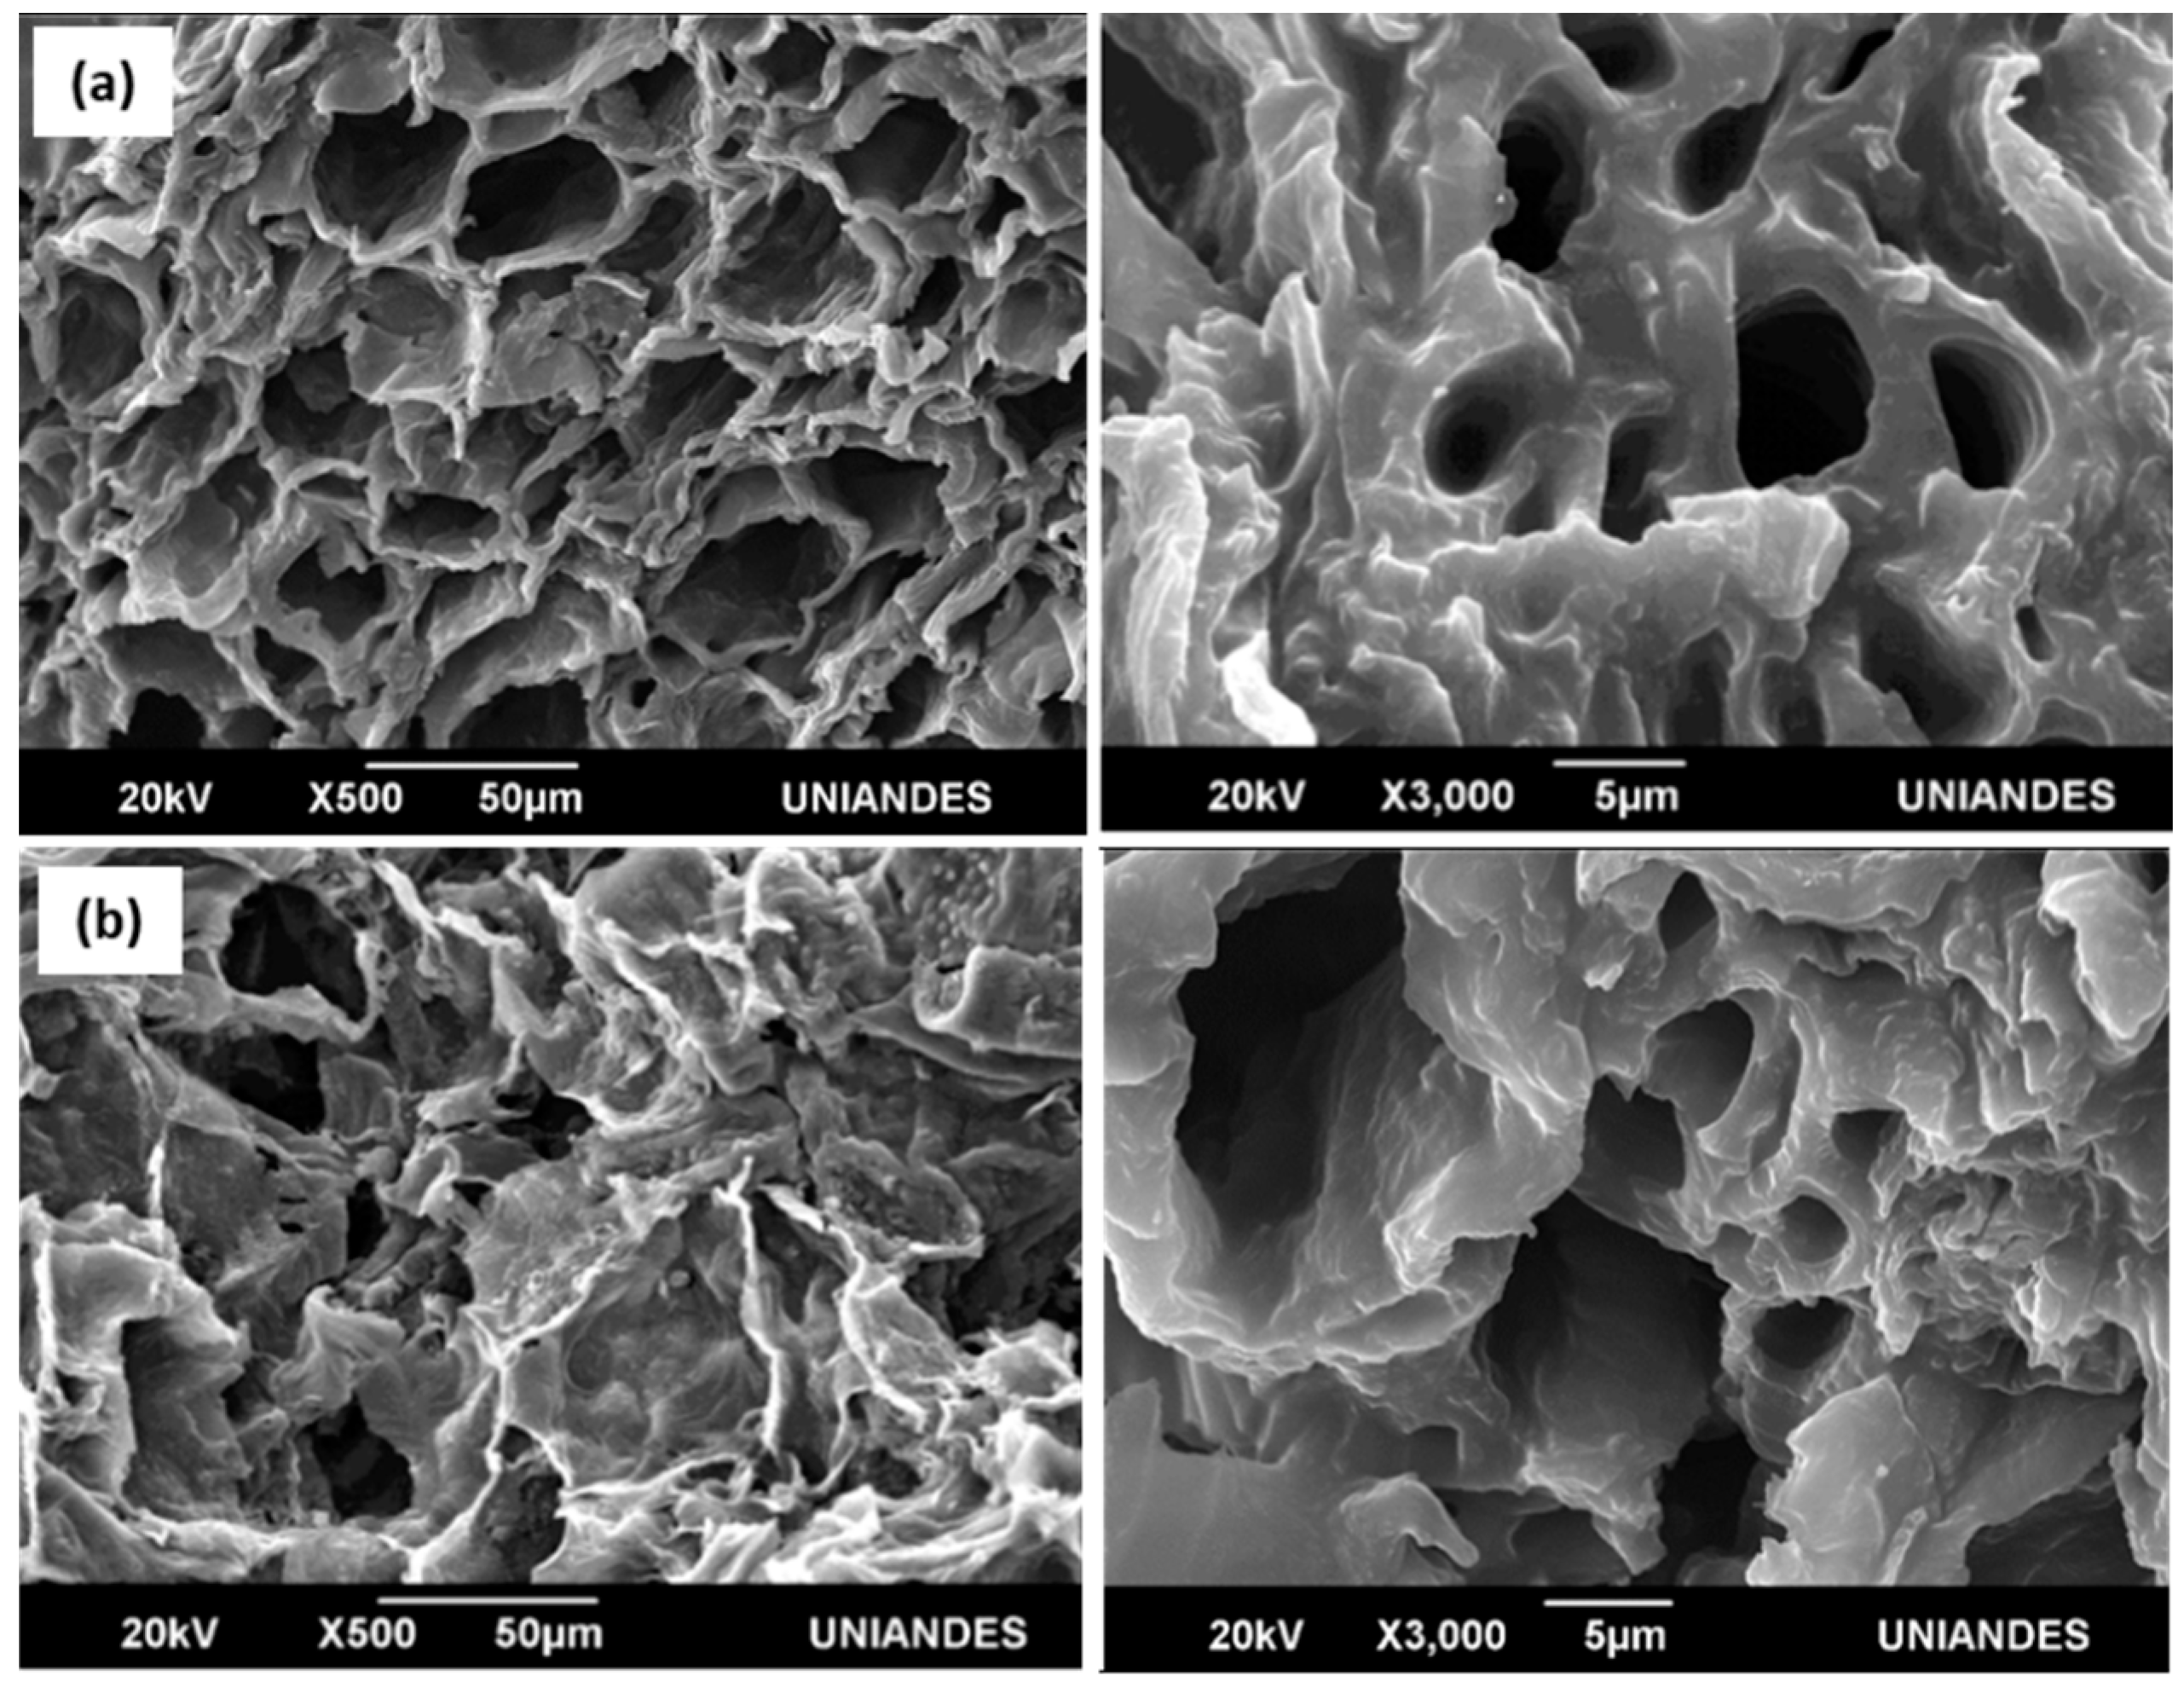
Figure 2 shows SEM images of the activated carbons. It is clear the two materials are amorphous with an important roughness on the surface. Nevertheless, micro- or mesopores are not visible when using low-resolution SEM, thus indicating the formation of macropores in the two samples. Although SEM cannot be used to analyze porosity, it can be seen that the macropore framework in the MPB-CO2 sample (Figure 2a) seems to be more ordered along the surface in comparison with that observed for the MPB-P50 sample (Figure 2b). This observation could be associated with a lower reactivity in the chemical activation due to the low quantity of steam formed from the degradation of the activator.
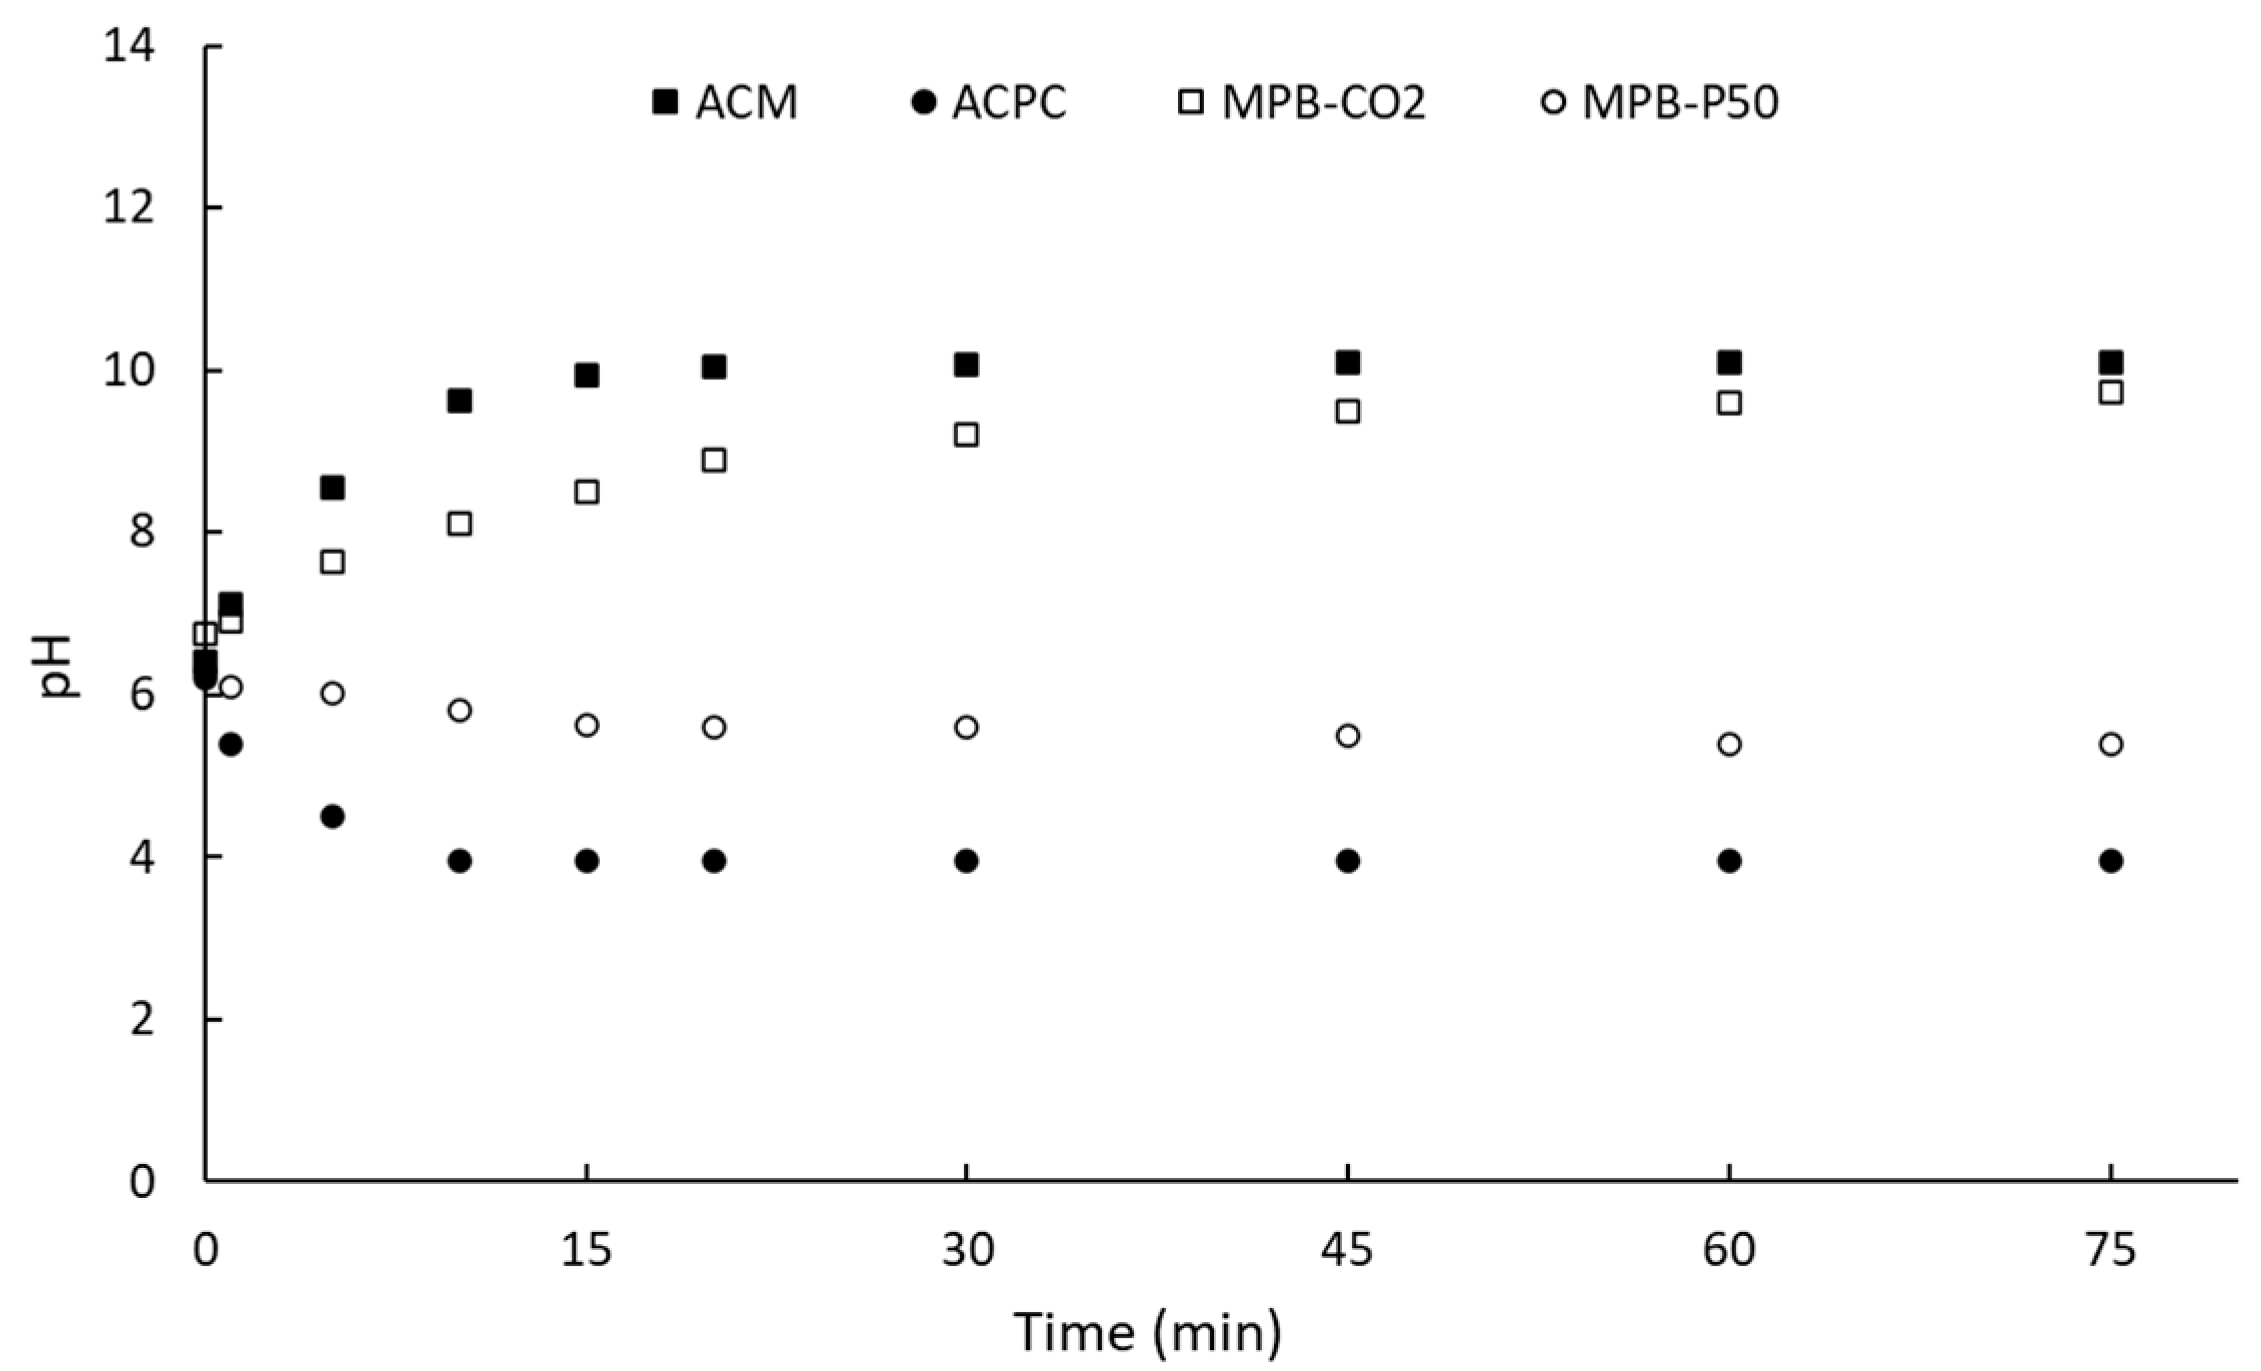
On the other hand, Figure 3 shows the evolution of pH as a function of time for an aqueous solution in contact with the activated carbons. The surface pH, also called the zero-point charge pH (pHPZC), of carbon materials can be estimated from the extrapolation of the plot at steady-state conditions [45]. For the sake of comparison, the two commercially activated carbons are also included in Figure 3.
After ca. 75 min, the steady-state condition was achieved. It is clear that commercially activated carbons and homemade nanoporous carbons had opposite surface pH. A surface pH of ca. 10.1, 3.9, 9.7, and 5.4 was observed for ACM, ACPC, MPB-CO2, and MPB-P50, respectively. This means that the surface pH of the activated carbons can be modulated as those of commercially activated carbons. Table 2 shows a summary of the surface pH (pHPZC) and the results obtained from Boehm’s titration. It is clear that the sample activated under CO2 flow had more lactone-like groups (0.532 mmol·g−1) than acidic groups, including a low proportion of carboxylic acids (0.053 mmol·g−1) and phenol (0.360 mmol·g−1).
Phenol is a weaker Brönsted acid than carboxylic acid [52], while lactone is a strong Lewis base. Therefore, it was expected to obtain a basic surface pH for MPB-CO2 in agreement with the surface pH obtained from the drift method (Figure 3). On the contrary, both carboxylic acids and phenolic groups were much higher for MPB-P50. It can be seen from Table 2 that MPB-P50 was characterized by a total acid group of ca. 1.163 mmol·g−1, which was ca. 2.8 times higher than MPB-CO2. This result agrees with the acid surface pH observed for MPB-P50 (Figure 3). Our group previously reported [44,49] the surface chemistry of the two commercially activated carbons.
ACM was characterized by low phenolic groups and mainly lactone and pyrone groups in agreement with its basic surface pH. This means that both the surface pH (Table 2, pHPZC) and porosimetry properties (Table 1) of ACM could be compared with those of MPB-CO2. By contrast, ACPC was mainly characterized by an important proportion of carboxylic and phenolic groups, and accordingly, it had an acidic pH. MPB-P50 was also characterized by an acid surface comparable to that observed on ACPC. In addition, a primary proportion of the pore framework of MPB-P50 was composed of mesopores (Table 1), which allowed for a reasonable comparison with that observed for the commercial ACPC (Table 1).

2.3. Atrazine Adsorption

2.3.1. Kinetic Studies

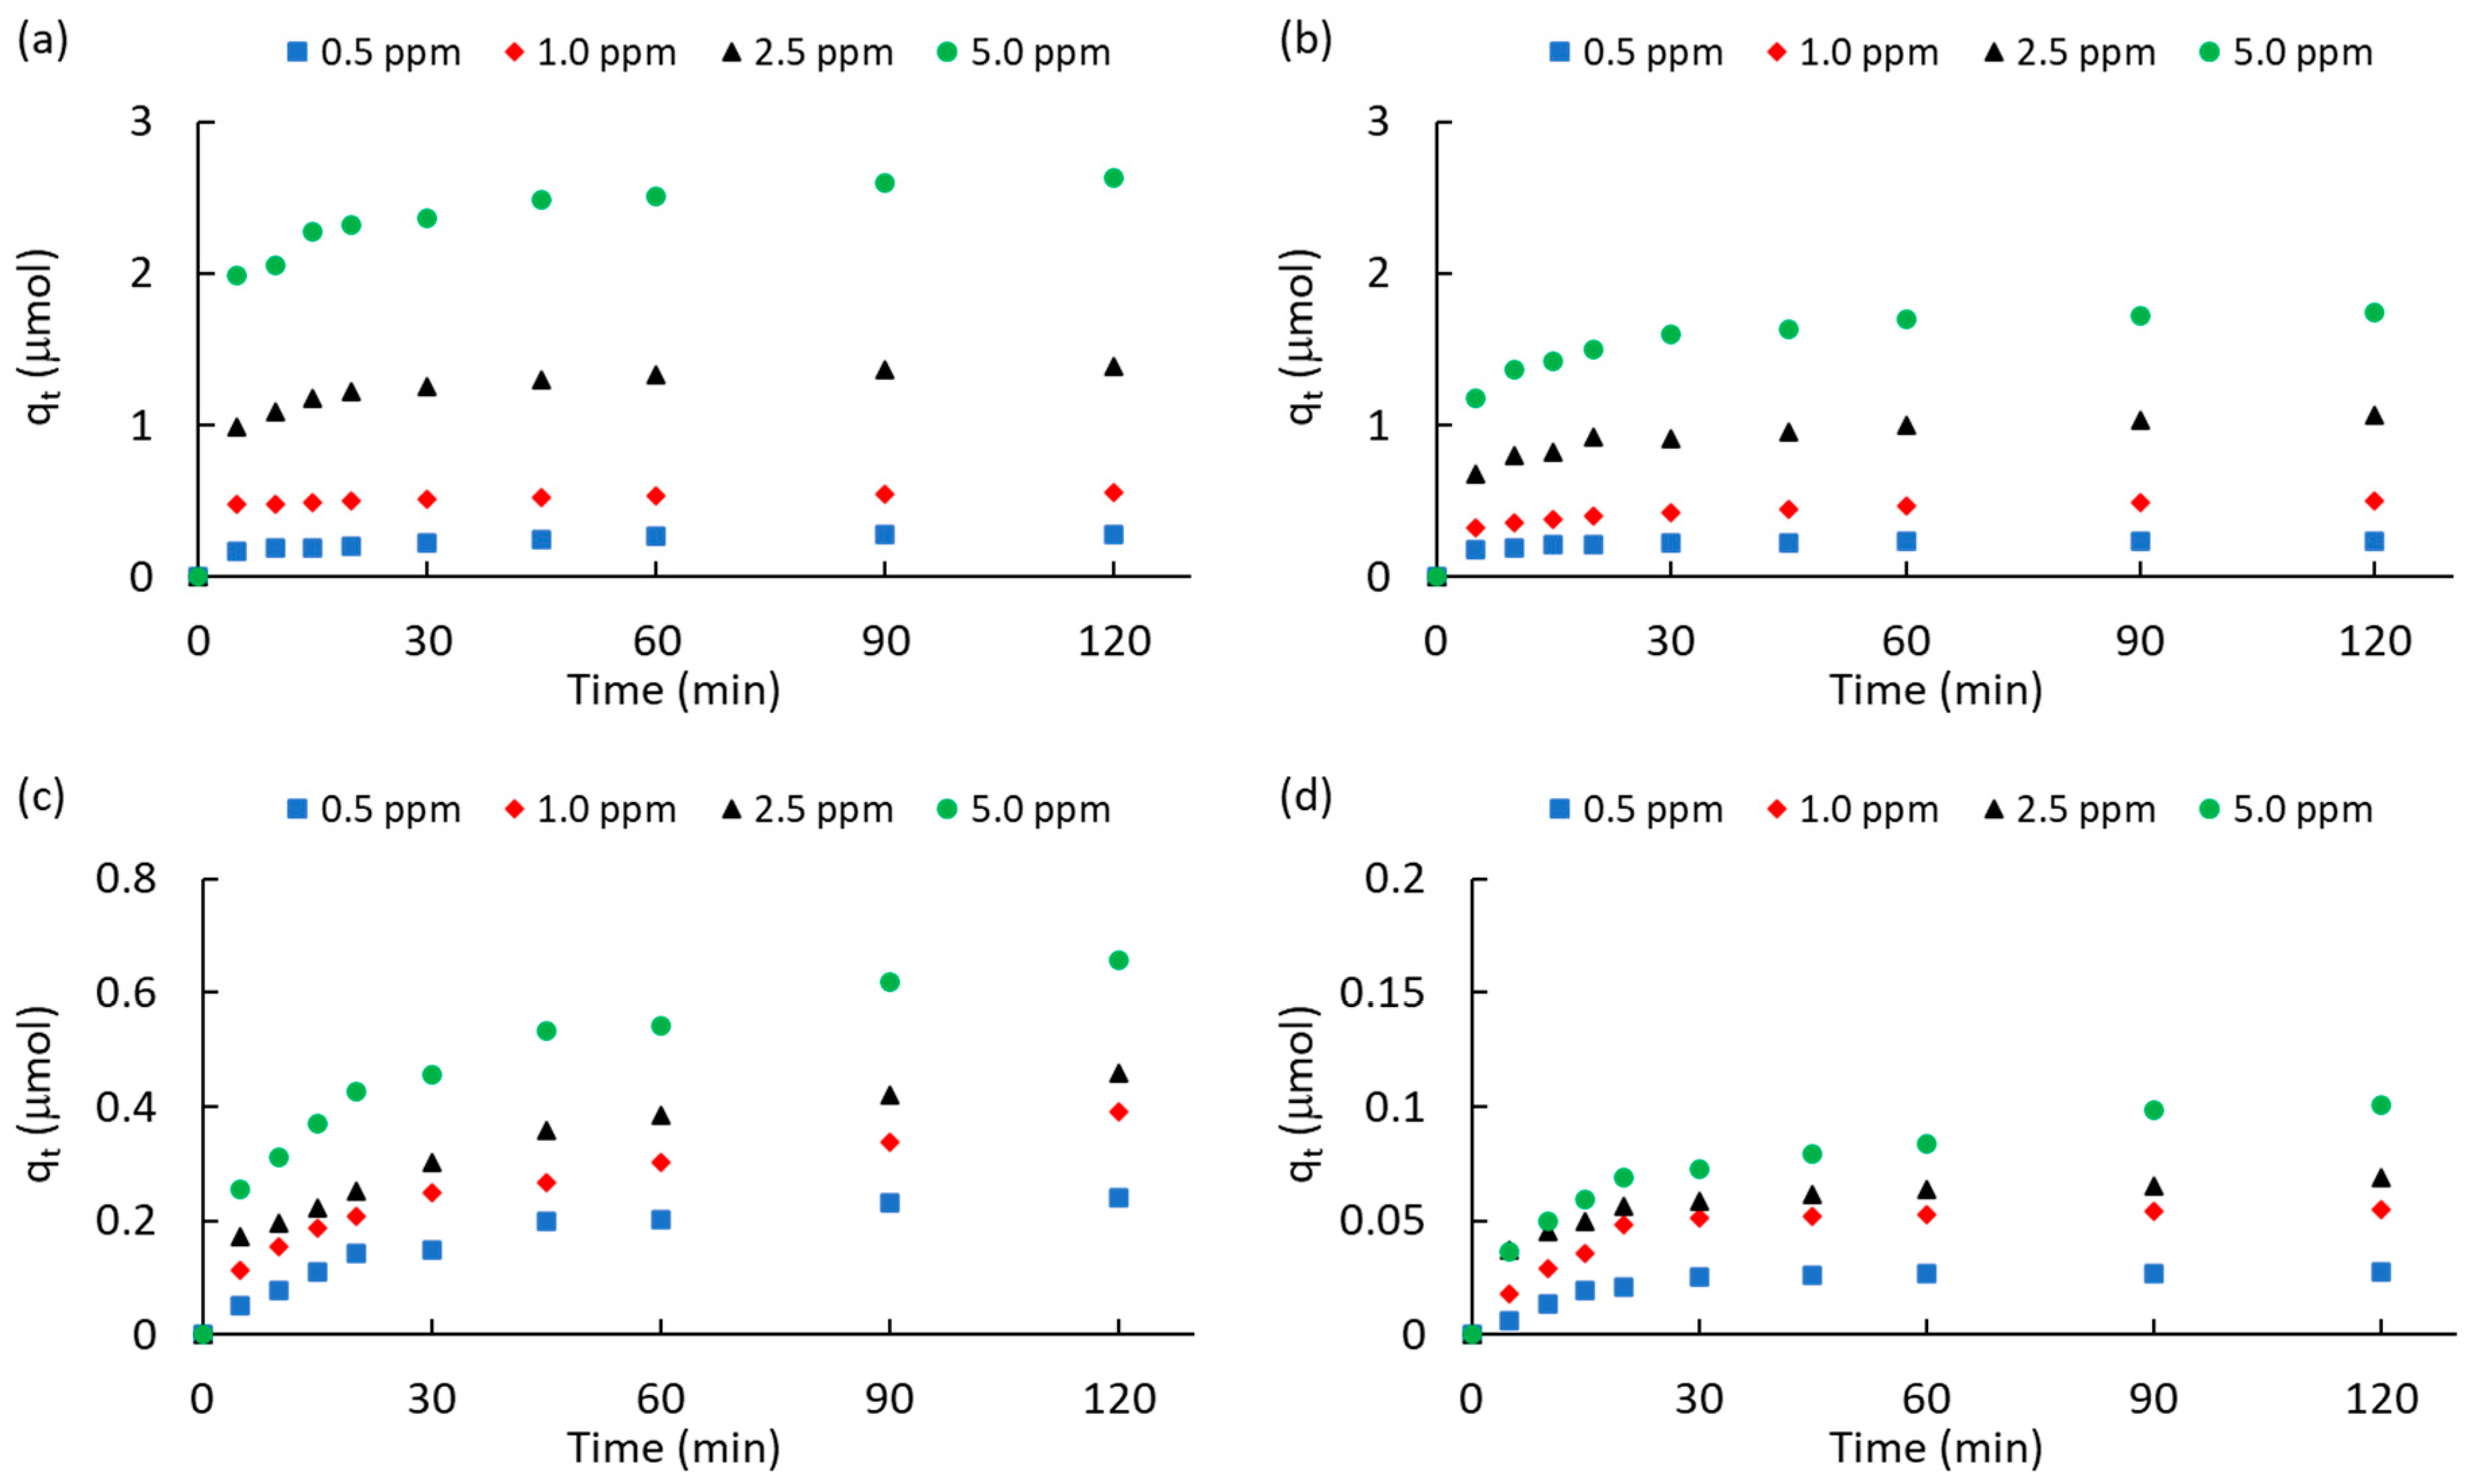
Figure 4 shows the kinetics of ATZ adsorption for different initial concentrations (0.5–5.0 ppm). Table 3 provides a summary of atrazine adsorbed at the equilibrium condition (after 120 min) and different kinetic parameters of adsorption. The two commercially activated carbons showed the highest ATZ uptake for all the initial concentrations. This result is attributed to a combination of a high surface area and a high total volume of pores (Table 1). However, although ACPC was characterized by a higher surface area and total volume of pores than ACM (Table 1), it is clear that ACPC removed less ATZ (Table 3). For instance, ACPC adsorbed ca. 15% and ca. 34% less ATZ than ACM for 0.5 ppm and 5.0 ppm. These results suggest that the diffusion of ATZ molecules from the bulk of solution to the pores of adsorbents is more efficient for low concentrations of herbicide. However, this result seems to be contradictory with the dynamics of adsorption described using the intraparticle diffusion model (IPD) [53,54,55] since ACPC had a higher number of mesopores than ACM (Table 1). On the other hand, it cannot be overlooked that the acidic functional groups of ACPC inhibited the diffusion of ATZ molecules to the pore framework. This inference seems to be reinforced by comparing the ATZ adsorbed on MPB-CO2 against MPB-P50. Although the surface area and total volume of pores of MPB-CO2 did not differ much from these values for MPB-P50, it is clear that atrazine adsorption was remarkably different. For instance, when increasing the initial concentration from 0.5 to 5.0 ppm, the ATZ adsorbed on MPB-CO2 was ca. 8.9, 7.1, 6.7, and 6.5 higher than that adsorbed on MPB-P50. This suggests that the acidic surface functional groups (mainly carboxylic acids and phenol) of MPB-P50 inhibited diffusion to the pore framework.
The molecular interactions associated with the mechanism of ATZ adsorption on the present porous carbons can also be interpreted in terms of the kinetic parameters of adsorption. Accordingly, the pseudo-first-order [53,56], pseudo-second-order [53,57], and intraparticle diffusion [53,54,55] models were analyzed. Table S1 (Supplementary Materials) shows a summary of the kinetic expressions and parameters obtained from the pseudo-first-order rate constant (k1), the pseudo-second-order rate constant (k2), the intraparticle (IPD) rate constant (kp), and the C constant attributed to the extension of the boundary layer thickness. Pseudo-first-order kinetics is associated with the reversible physisorption of molecules [58], while pseudo-second-order kinetics is associated with chemisorption phenomena [59], where strong interactions and bond formation may occur between the adsorbate and adsorbent. Figure S1 (Supplementary Materials) shows the plots for the atrazine adsorption on ACM and MPB-CO2 at 0.5 and 5.0 ppm, respectively, in terms of the pseudo-first-order, pseudo-second-order, and intraparticle diffusion models. The regression values observed in Table 3 suggest that both ACM and MPB-CO2 fitted very well with the pseudo-first-order and pseudo-second-order models, showing R2 > 0.95 in most cases. The average values for R2k1 and R2k2 were ca. 0.971 and 0.959 for ACM, while the values of 0.985 and 0.969 were estimated for MPB-CO2. Accordingly, it can be suggested that a mixture of physisorption and chemisorption mechanisms governs ATZ adsorption on carbons characterized by a basic surface and micropore framework. It is important to highlight that ACM did not fit well with the intraparticle model, with an average R2kp value of ca. 0.921, while a value of ca. 0.964 was obtained for MPB-CO2. It can be seen from Table 3 that at a low ATZ concentration (0.5 ppm), ATZ adsorbed at equilibrium conditions (qeq) was similar in both commercially activated carbons (0.282 μmol vs. 0.241 μmol).
By contrast, at high initial concentrations (5.0 ppm), qeq was higher in ACM than in ACPC and ca. 4 times higher than in MPB-CO2 (2.632 μmol vs. 0.658 μmol). This result suggests that although the micropore contribution and surface pH of ACM were almost similar to those of MPB-CO2, ACM allowed for a better diffusion of molecules from the bulk of the solution to the pore framework. This ability was stronger at high initial concentrations. This inference is reinforced when the values of the C constant from the IPD model are compared between both carbons. Table 3 shows a monotonical increase in C values as a function of initial concentrations, from 0.146 to 1.921 μmols (13.2 times higher) for ACM, while for MPB-CO2, C values increased from 0.023 μmol to 0.189 μmol (8.2 times higher). In other words, high adsorption capacities for ATZ removal led to high values of the C constant. According to the IPD model, C was a measure of the boundary layer thickness of molecules approaching or in the vicinity of the adsorbent.
A similar analysis can be performed for ACPC and MPB-P50. Figure S2 (Supplementary Materials) shows the plots for ATZ adsorption on ACPC and MPB-P50 at 0.5 and 5.0 ppm, respectively. Table 3 shows that the linear regression factors for ACPC fitted very well with the pseudo-first-order model (R2k1 of ca. 0.980). Conversely, this commercially activated carbon did not fit well with the pseudo-second-order model, showing an average R2k1 of ca. 0.927. In other words, even though the surface of ACPC was acidic, ATZ was preferentially adsorbed via a physisorption mechanism, probably due to the high number of mesopores (Table 1). By contrast, ATZ was preferentially adsorbed via a chemisorption mechanism. This suggestion can be inferred from R2k2 values in Table 3, which are clearly higher than R2k1 values. At the same time, it can be seen from Table 3 that the C constants are clearly higher in ACPC than in MPB-P50. For instance, C values increased from 0.181 μmol up to 1.181 μmol (6.5 times higher) in ACPC, while for MPB-P50, they only increased from 0.014 μmol up to 0.035 μmol when ATZ concentration increased from 0.5 up top 5.0 ppm.
Finally, with the exception of MPB-P50, k1 and k2 rate constants observed in MPB-CO2 and the commercially activated nanoporous carbons are in the same order of magnitude as values reported by Tan and coworkers [60] using corn-straw-derived porous carbons. In general, it is interesting to note that k1 and k2 values tended to decrease with an increase in concentration. This was particularly noticeable for k2 in most of the carbons studied in the present work. This result leads us to suggest that the chemisorption mechanism is favored at low concentrations, while at higher concentrations, physisorption and IPD model control the mechanism of adsorption. This result suggests that atrazine adsorption is highly dependent on the concentration of ATZ according to the intraparticle diffusion model [61]. In other words, at high concentrations, the energy required for the formation of bonds leading to chemisorption was higher since the number of surface interactions between ATZ molecules and the surface sites of adsorption decreased. These suggestions will be discussed in the following two sections using the equilibrium parameters obtained from the Langmuir and Freundlich isotherms as well as theoretical estimations.

2.3.2. Adsorption Isotherms of Atrazine

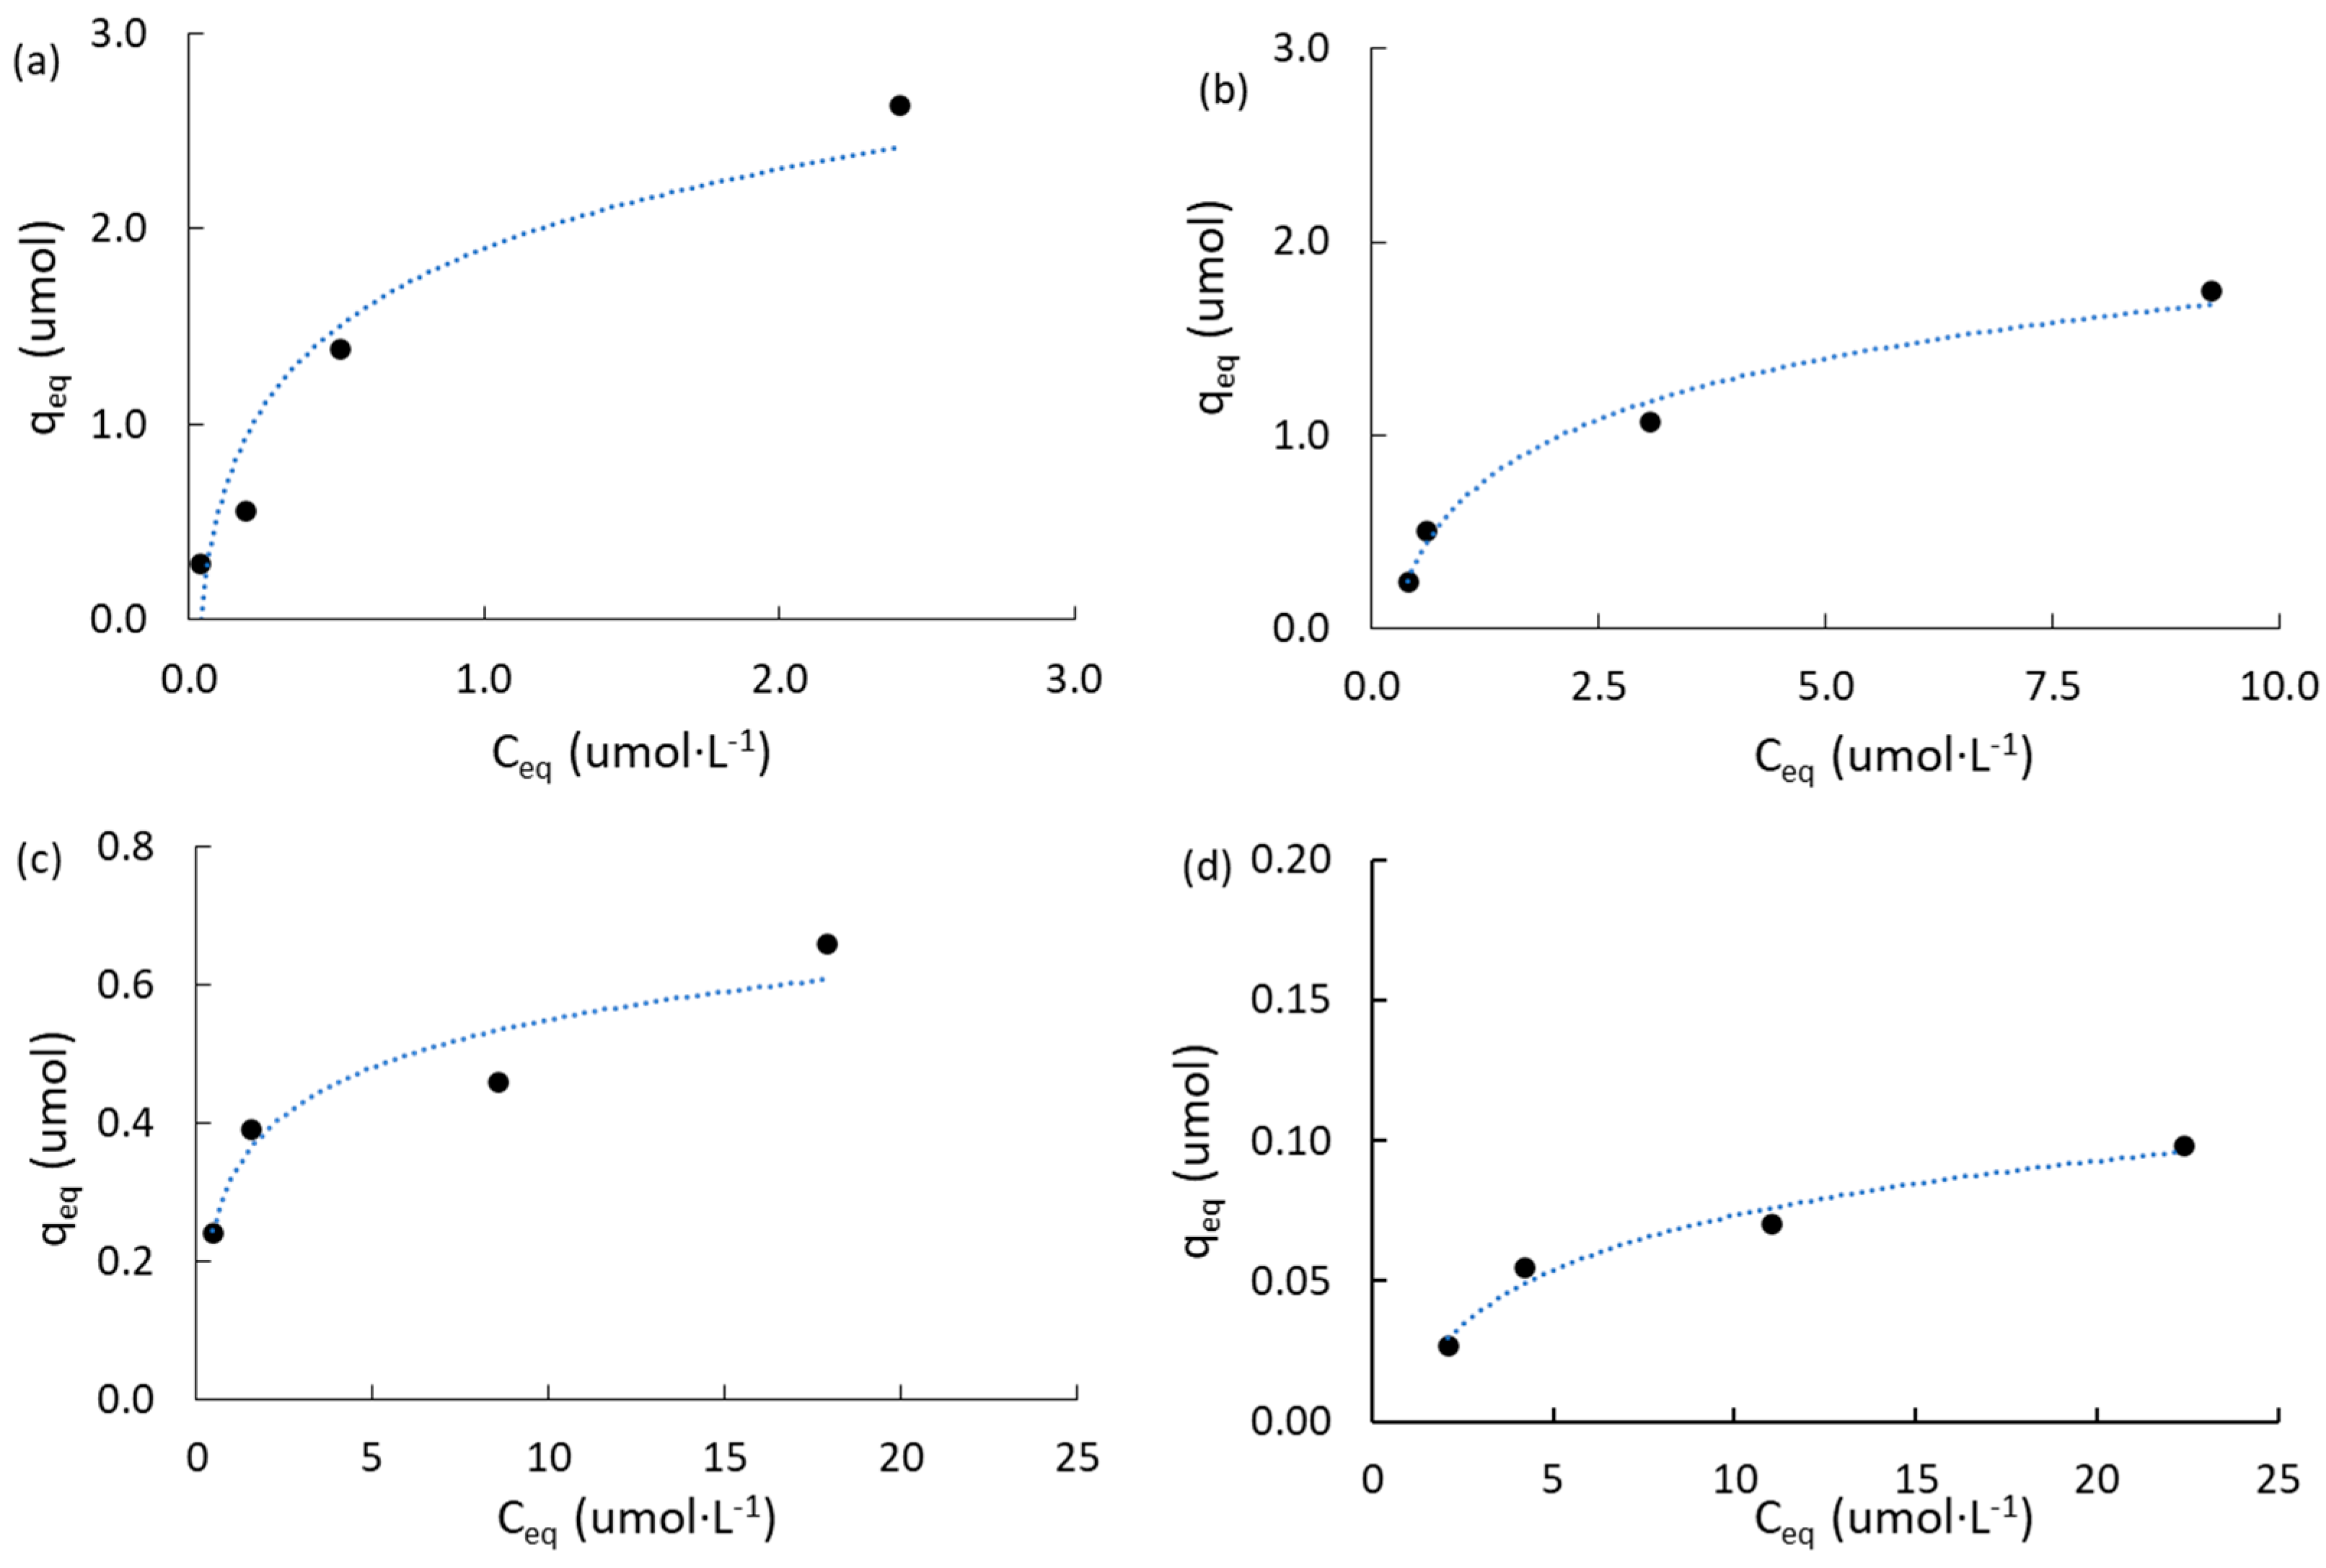
Table S2 (Supplementary Materials) shows a summary of the mathematical expressions used for equilibrium studies of atrazine adsorption according to the Langmuir model [62], and Freundlich model [63]. Figure 5 shows the adsorption isotherms obtained on commercially activated carbon and mangosteen-peel-derived carbons. The linear regression plots for both models are included in Figures S3 and S4 (Supplementary Materials). Table 4 is a summary of the equilibrium adsorption parameters obtained, including the maximum capacity for atrazine adsorption in the monolayer (qm, reported in μmol and mmol·g−1); the adsorption constant according to the Langmuir model (KL, reported in L·μmol−1); the adsorption constant according to the Freundlich model (KF, reported in mg·g−1 and mmol·g−1); and the Freundlich heterogeneity factor (n).
The linear regression factors according to the Freundlich model fit much better than those according to the Langmuir model for the commercially activated carbons (ACM and ACPC). However, the opposite trend was observed in the mangosteen-derived carbons. Figure 5a shows that ACM adsorbed more ATZ than ACPC (Figure 5b) at initial concentrations higher than 1.0 ppm. The maximum capacity for ATZ adsorption in the monolayer for ACPC was higher (0.466 mmol·g−1) than that obtained for ACM (0.250 mmol·g−1). This result agrees with the higher specific surface area of ACPC than that of ACM (Table 1) and with a higher mesopore structure that led to the enhanced diffusion of ATZ molecules from the bulk of solution to the pore framework, as suggested by the lower values of the C constant from the IPD model in ACPC than those in ACM (Table 3) when ATZ was higher than 1 ppm. However, it can be hypothesized that in the present range of study (0.5–5.0 ppm), ACM adsorbs more than one monolayer of atrazine molecules. This is inferred from the fact that the maximum capacity for ATZ adsorption in the monolayer (qm) according to the Langmuir model for ACM was clearly lower (1.573 μmol, Table 4) than the value adsorbed at equilibrium (qeq) when the initial concentration of ATZ was 5.0 ppm (2.632 μmol, Table 3).
On the other hand, in the Freundlich isotherm, it is assumed that the surface of the adsorbent is energetically heterogeneous, where the adsorption sites have similar characteristic energies. It should also be considered that there were no lateral interactions between the adsorbed molecules, and therefore, only a monolayer was adsorbed. The heterogeneity factor of the Freundlich model (nF) was similar in both commercially activated carbons (1.79 and 1.72 for ACM and ACPC), which suggests that only one monolayer should be adsorbed, which is contrary to the ATZ adsorption observed on ACM. In addition, it is clear from data in Table 4 that the adsorption constant according to the Langmuir model (KL) in ACM was ca. 22 times higher than that observed in ACPC (5.374 L·μmol−1 vs. 0.246 L·μmol−1). This result indicates that ACM was characterized by a higher thermodynamic trend to adsorb ATZ than that observed on ACPC, even though the SBET of the latter was higher. This trend is reinforced by the adsorption constant values obtained from the Freundlich model (KF), which were ca. 3 times higher in ACM than in ACPC (0.625 mmol·g−1 vs. 0.200 mmol·g−1). Accordingly, it can be suggested that the basic surface chemistry of ACM could be responsible for significant electrostatic attraction among hydrated atrazine molecules, thus playing the main role in the adsorption of ATZ.
Figure 5c,d show the results obtained for MPB-CO2 and MPB-P50, respectively, and the results obtained from the Langmuir and Freundlich models are summarized in Table 4. The linear regression plots for both models are included in Figure S4 (Supplementary Materials).
For instance, qm, KL, KF, and nF parameters were ca. 4.0, 13.1, 9.6, and 2.1 times higher in MPB-CO2 than in MPB-P50. It is clear that MPB-CO2 had a higher capacity than MPB-P50 to adsorb atrazine, and this fact can be attributed to a higher BET surface area and a higher total volume of pores (Table 1). In addition, MPB-CO2 was characterized by a basic surface with a high surface pH compared with acidic groups and acid surface pH for MPB-P50 (10.1 vs. 3.9, Table 1).
It is interesting to highlight that the adsorption parameters observed in the mangosteen-derived carbons were remarkably lower than those observed in the commercially activated carbons. The low adsorption capacity observed for MPB carbons, mainly for MPB-P50 carbon, is attributed to the high proportion of acidic groups detected using Boehm titrations of carbons (Table 2). However, a more in-depth analysis using a specific surface technique such as X-ray photoelectronic spectroscopy (XPS) should be performed to complement this inference.
For MPB-CO2 carbon, this fact can be attributed to the high value of the heterogeneity factor according to the Freundlich model (nF), which mainly indicates that not only is the material characterized by different types of adsorption sites, but more importantly, it also has a high thermodynamic trend to adsorb ATZ. However, this was not the case for MPB-P50, with a value for nF value of ca. 2.0, slightly higher than those observed in commercially activated carbons. Thus, it can be suggested that the high micropore proportion of the mangosteen-derived porous carbons, up to 92% and 78% for MPB-CO2 and MPB-P50, can be responsible for the low ATZ adsorption parameters. However, ACM and MPB-P50 had comparable surface areas and pore frameworks (Table 1). In other words, it can be concluded that the thermodynamic trend to adsorb atrazine was favored by the presence of strong basic functional groups on the surface of the carbons. In addition, it should be highlighted that the average particle size of the mangosteen-derived carbons was ca. 350 μm, ca. 5 times higher than values observed for the commercially activated nanoporous carbons (ca. 75 μm). In a previous study [45], we have shown that the lower the size of particles, the higher the capacity of atrazine’s adsorption.
Finally, according to the Freundlich model, KF values were ca. 134.9 mg·g−1, 43.2 mg·g−1, 15.3 mg·g−1, and 1.59 mg·g−1 for ACM, ACPC, MPB-CO2, and MPB-P50, respectively. Except for MPB-P50 carbon, these values are clearly higher than those reported by Tan and coworkers [60] for a porous carbon prepared from corn straw, with an adsorption capacity of ca. 4.6 mg·g−1. The loading used in the present work was ca. 0.05 g·L−1, which is similar to that reported by Tan and coworkers [60]. Thus, although the commercially activated carbons showed better capabilities to adsorb atrazine than the homemade MPB carbons, it should be noted that the mangosteen-derived porous carbon prepared via physical activation under CO2 flow (MPB-CO2) is a potential adsorbent, mainly due to its high BET surface area of ca. 1080 m2·g−1, compared with the value of 466 m2·g−1 reported for corn-straw-derived carbon [60]. In addition, the values obtained for the adsorption constant (Table 4) according to the Langmuir model (KL) were ca. 5.37 L·μmol−1, 0.25 L·μmol−1, 1.57 L·μmol−1, and 0.12 L·μmol−1, for ACM, ACPC, MPB-CO2, and MPB-P50, respectively. These values are remarkably higher than the value of ca. 0.009 L·μmol−1 reported for the corn straw-derived carbons [60] characterized by a high contribution of mesopores. Accordingly, the superior thermodynamic trend to adsorb ATZ, mainly for ACM and MPB-CO2, can be attributed to the combination of their basic surface and the low number of mesopores (Table 1).
By contrast, in this study, the commercially activated and mangosteen-peel-derived nanoporous carbons showed lower qm but higher KL (except for MPB-P50) than the carbons prepared from hemp stem [42], with values of ca. 1.05 mmol·g−1 and ca. 0.14 L·μmol−1, respectively. The higher qm reported for the hemp-stem-derived carbon can be attributed to a higher surface area (2135 m2·g−1) and to a much higher loading of adsorbent of ca. 3.0 g·L−1 (ca. 60 times higher) than that used in the present study. It should be highlighted that the KL value obtained in MPB-CO2 porous carbons was ca. 11.2 times higher than that reported for hemp stem [42]. This comparison suggests that basic surface chemistry plays the most important role in ATZ adsorption, mainly at high concentrations. This suggestion is discussed in the following section using DFT estimations.

2.4. General Discussion and Theoretical Estimations

It is well known that the Langmuir model [62] considers all adsorption sites similar and finite. This model also assumes that interactions do not occur between adsorbed molecules. This means that the molecular density (ρsurf), also called surface density [64], can be estimated using Equation (4), where qm is the maximum capacity of adsorption of atrazine obtained from Langmuir’s adsorption isotherms (Table 4), and SBET is the specific surface area (Table 1).
ρsurf = [(qm/SBET)·F]
where F is a correction factor (F = 95.6) including Avogadro’s number, the weight of carbons (6.3 mg), and conversion factors to adjust the units of ρsurf to adsorbed molecules·nm−2. The values estimated for the surface density of ATZ molecules adsorbed in the maximum capacity of adsorption (when qeq = qm = 1) were ca. 0.194, 0.226, 0.050, and 0.015 molecules·nm−2 for ACM, ACPC, MPB-CO2, and MPB-P50, respectively. Accordingly, the reciprocal of the surface density was the experimental value for the cross-sectional area (σATZ = 1/ρsurf) of one atrazine molecule according to the Langmuir model. The values estimated for σATZ were ca. 5.2, 4.4, 20.0, and 66.7 nm2·molecule−1 for ACM, ACPC, MPB-CO2, and MPB-P50, respectively. In other words, the higher qm and the lower SBET, the higher the ρsurf value and, accordingly, the lower the cross-sectional area of one atrazine molecule. These values of surface density suggest that the commercially activated carbons (ACM and ACPC) were characterized by low repulsion forces among ATZ molecules, whereas mangosteen-peel-derived carbons (MPB-CO2 and MPB-P50) were characterized by high repulsion forces. For instance, ACM adsorbed ca. 4 times more ATZ molecules than MPB-CO2. At the same time, ACPC adsorbed ca. 15 times more ATZ molecules. This means that the electrostatic repulsion among atrazine molecules is the driving force for the adsorption of the pollutant. It is interesting to point out that the values obtained for σAT are much higher than that reported by Borisover and Graber [65], which was ca. 0.544 nm2 molecule−1, suggesting that more than one atrazine molecule is adsorbed in each adsorption site. The formation of atrazine’s molecular clusters adsorbed on the surface of porous carbons has been reported by our group [45].
In the lowest adsorption capacity observed in this work (qeq values obtained from 0.5 ppm of ATZ, Table 3), the surface density values were ca. 0.035, 0.019, 0.021, and 0.003 molecules·nm−2 for ACM, ACPC, MPB-CO2, and MPB-P50, respectively. It can be seen that both ACM and MPB-CO2 showed higher surface density than ACPC, suggesting that strong basic groups of carbons led to adsorption at a low initial concentration of ATZ; however, at high concentrations, both surface chemistry and porosimetry were responsible for the adsorption of ATZ.
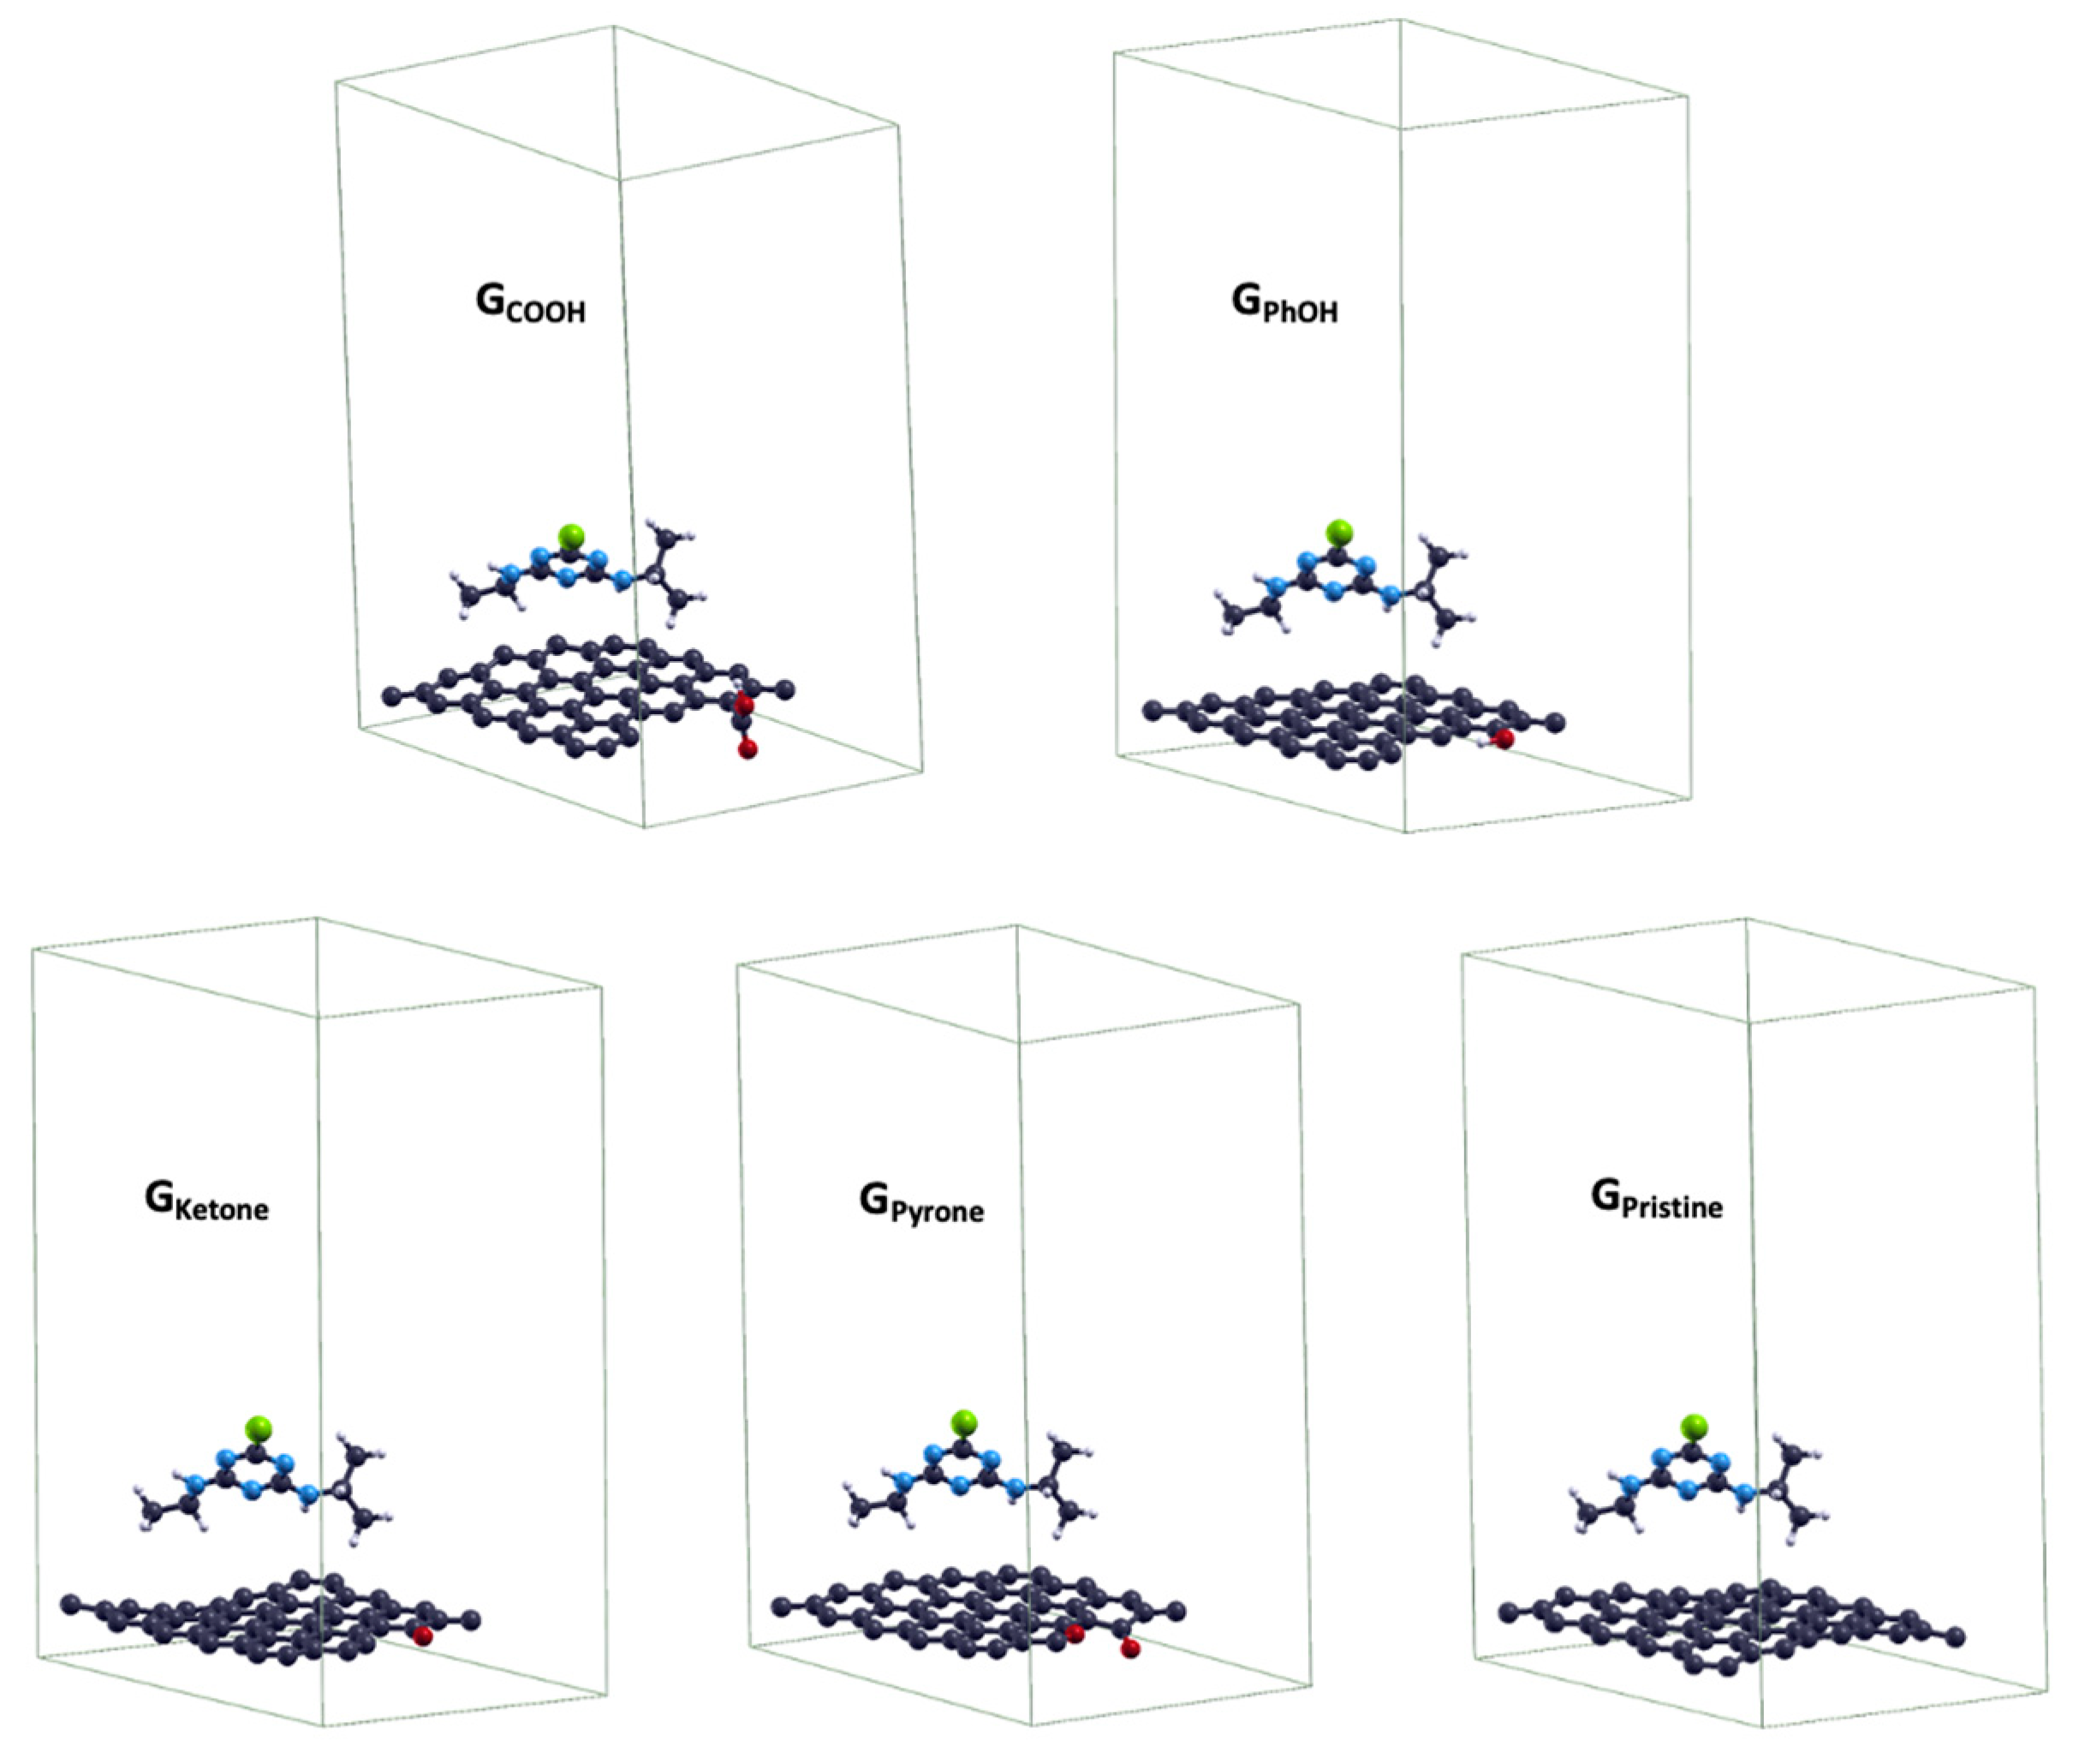
According to this analysis, to verify the influence of surface functional groups on the nanoporous carbons in this study, the adsorption energy of atrazine (Eads-ATZ) was evaluated on one layer of pristine graphene (GPristine) as well as after the introduction of different oxygen-containing functional groups. Periodic calculations were performed using the Perdew–Burke–Ernzerhof (PBE) exchange–correlation functional [66]. This functional has been proven to be reliable in the evaluation of adsorption energies of N- and Al-doped graphene [67] and carboxyl- and hydroxyl-decorated holes in graphene oxide [68]. Herein, theoretical calculations were limited to oxygen-functionalized graphene with pyrone (GPyrone), ketone (GKetone), phenol (GPhOH), and carboxylic acid (GCOOH) groups. These groups were selected since they were identified from the Boehm titration study discussed above (Table 2). Figure 6 shows the optimized geometry for the atrazine adsorbed on the selected functionalized graphene.
The images in Figure 6 were generated on the basis of highest adsorbate coverage, corresponding to a surface coverage of 1/1 monolayer using one atrazine molecule on a 5 × 5 graphene surface unit cell. The adsorption energies of atrazine (Eads-ATZ) were calculated using Equation (5).
(Eads-ATZ) = [(EAz-G) − (EG + EAz)]
According to Equation (5), Eads-ATZ can be estimated from the difference between the energy of the adsorbed system (EAz-G) containing both graphene and adsorbed atrazine and the sum of the energies of a clean graphene surface (EG) and an isolated atrazine molecule (EAz). Table 5 shows the theoretically predicted adsorption energies ranging from −0.169 eV for GPristine to −0.024 eV for GPhOH. The energy of adsorption is a thermodynamic potential that measures the spontaneous trend to adsorb molecules. Accordingly, it is clear that a higher and more negative Eads-ATZ value resulted in more spontaneous atrazine adsorption. For instance, the lowest thermodynamic susceptibility to adsorb atrazine corresponded to the functionalization of graphene with acidic groups such as GPhOH (−0.024 eV) and GCOOH (−0.048 eV). In contrast, the highest thermodynamic susceptibility corresponded to the functionalization of basic groups such as GKetone (−0.063 eV) and GPyrone (−0.099 eV).
Pristine graphene showed the highest susceptibility to remove atrazine (−0.169 eV). This trend can be explained in terms of electron density; the polarization of the electronic density was smaller in GKetone and GPyrone, and as expected, GPristine was the least polarized system. It is worth noting that the adsorption energies decreased with the dipole moment (µ) of clean graphene surfaces, except for GPhOH. In this system, the amplitude of µ was not as significant as in GCOOH due to the attenuation of the electronic delocalization in the whole layer, which was likely caused by the weak resonance of sp3 C atoms bonded to the O atom in the –OH group. Conversely, in GCOOH, the attenuation was mostly caused by the orientation of the –COOH group with respect to the carbon surface, and hence the charge was polarized toward the –COOH moiety. In fact, GCOOH showed a high dipole moment. In summary, systems with larger electron delocalization led to large Eads-ATZ values.
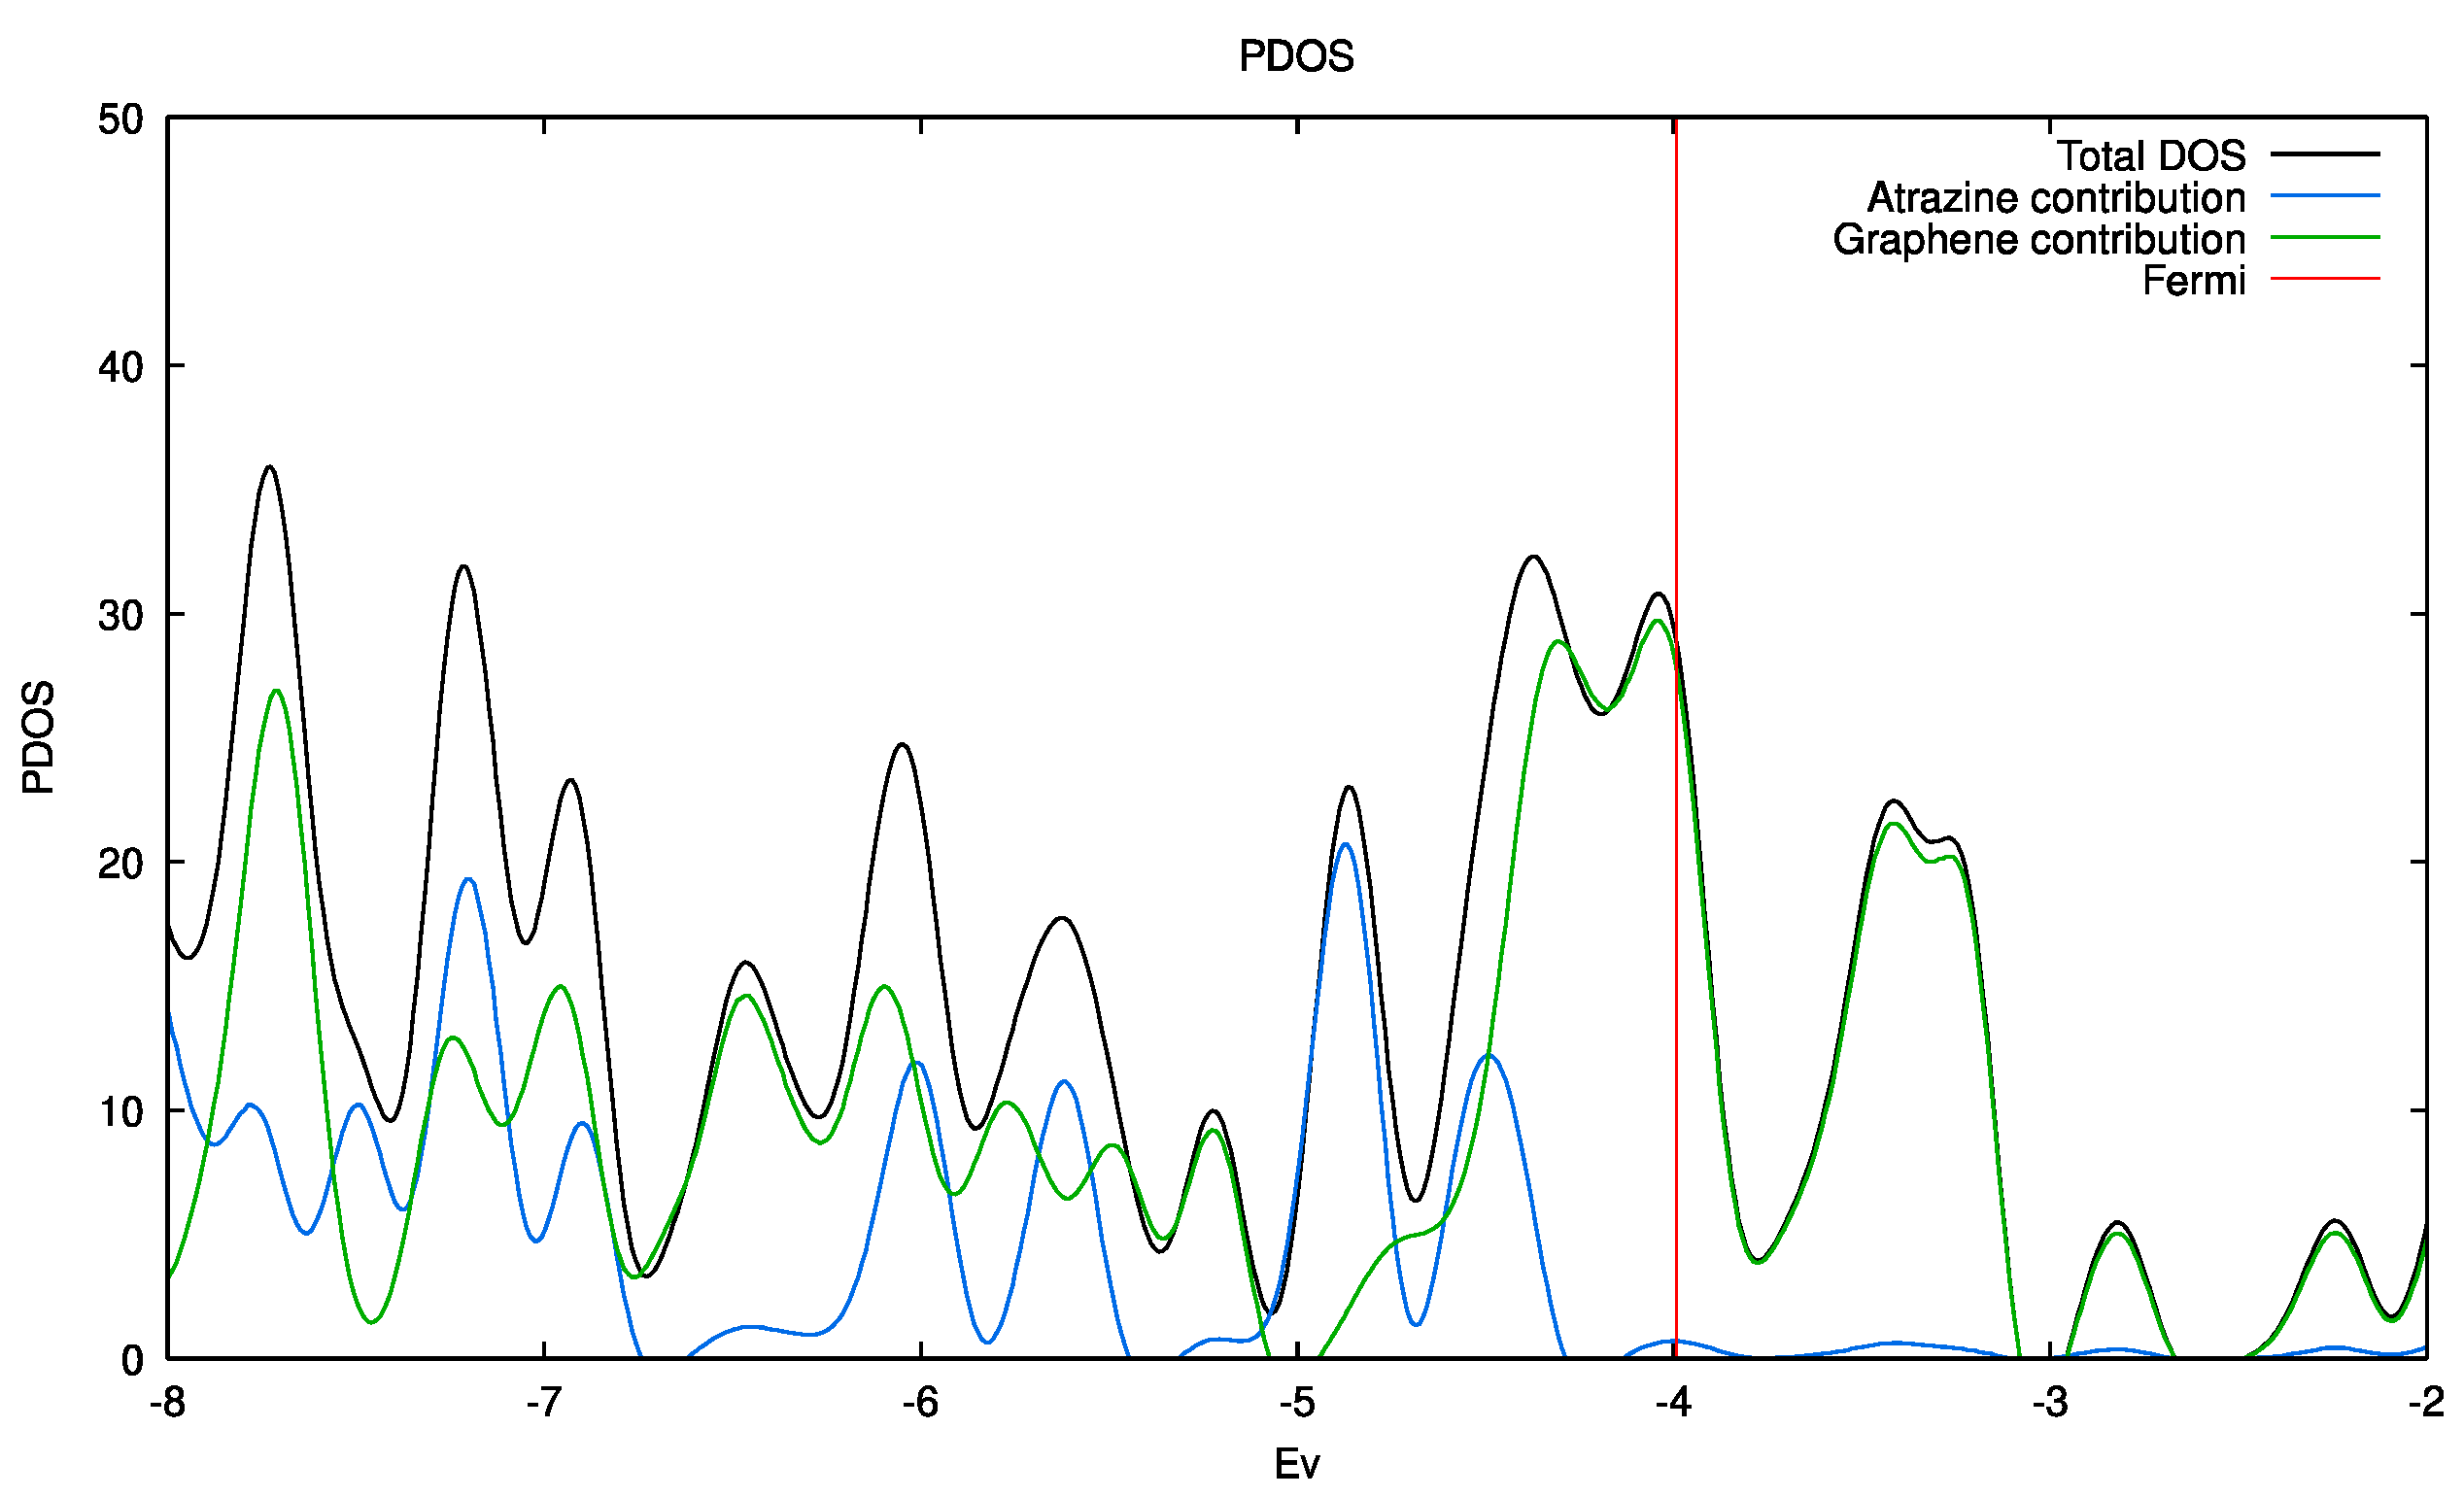
The density of states (DOS) and the projected density of states (PDOS) resulting from periodic calculations in the atrazine-adsorbed systems are presented in Figure 7. These calculations point to a conductor-like behavior for all systems, i.e., there was no bandgap. It is well known the lack of bandgap between the conduction and valence bands is associated with graphene, which has a continuous electronic density around the Fermi level. As can be seen in Figure S5 (Supplementary Materials), after adsorption, the materials remained almost unchanged in terms of their conductivity pattern independently of the type of oxygen-containing functional groups.
Our equilibrium studies can be summarized as follows: The pore framework of the adsorbent played the most important role at low atrazine concentrations, with mesopores being the driving force behind the decrease in intraparticle pore diffusion limitations. Conversely, surface chemistry seemed to be the driving force for the adsorption of the herbicide at high concentrations of ATZ. It is concluded that the Langmuir and Freundlich models could be used to explain both the uptake and thermodynamic trends of atrazine adsorption on the current study’s commercially activated nanoporous carbons.
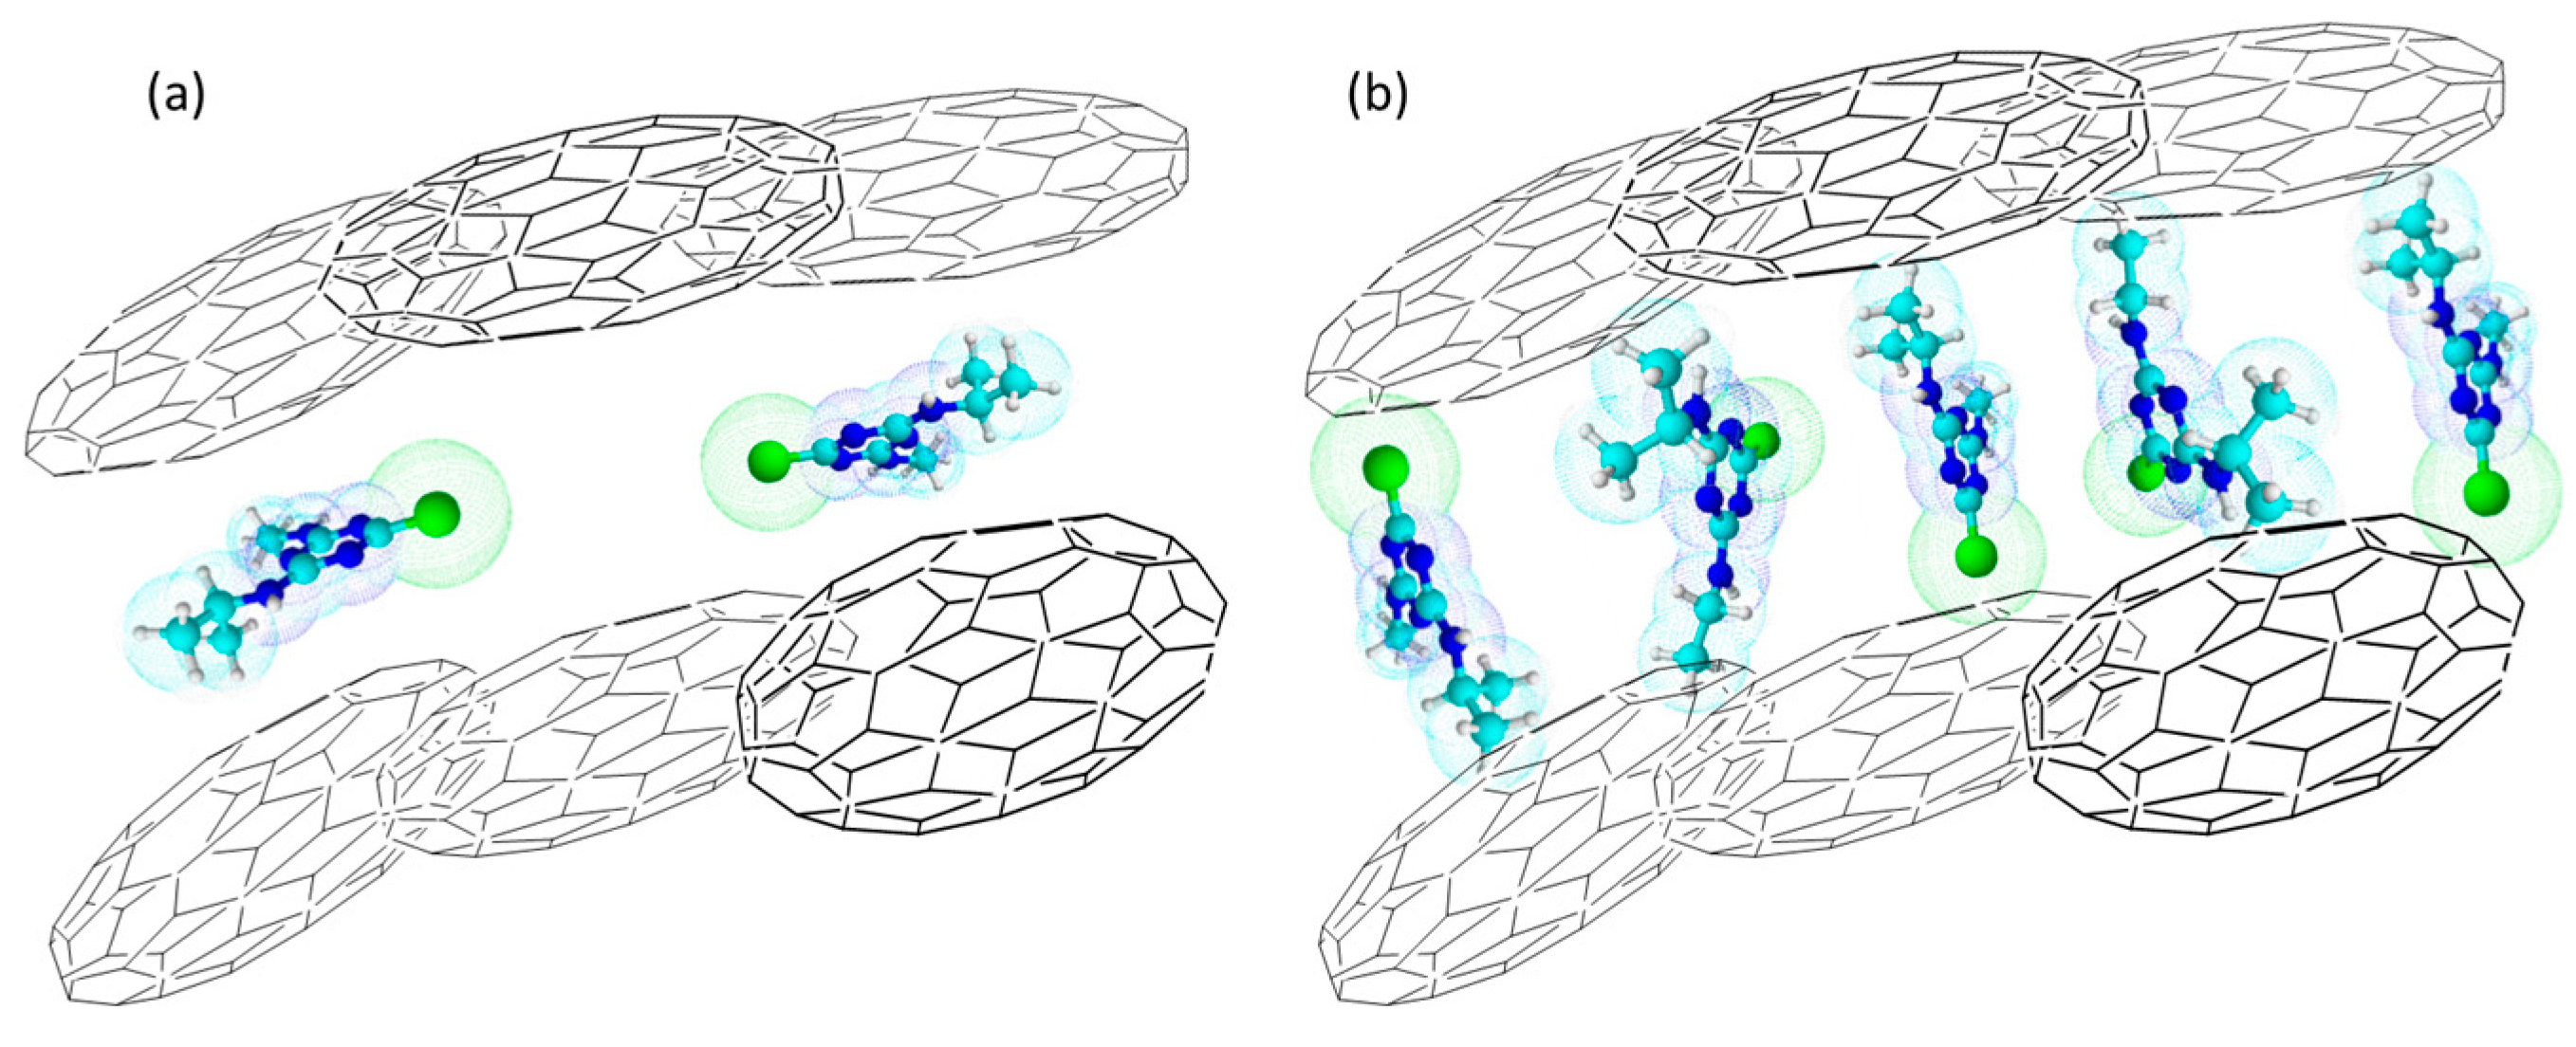
Accordingly, Figure 8 shows a schematic model for the atrazine’s adsorption within slit-like pores of carbons considering low and high ATZ concentrations. Figure 8a shows the first case when atrazine was physically adsorbed in a parallel mode, forming a pseudo-layer within the carbon layers. In this case, the surface density was very low, with values of ca. 0.050 and 0.015 molecules·nm−2, but high cross-sectional areas of ca. 20.0 nm2·molecule−1 and 66.7 nm2·molecule−1 were observed in MPB-CO2 and MPB-P50, respectively. However, the present experimental values are remarkably higher than the theoretically calculated value of ca. 0.544 nm2 molecule−1 indicated by Borisover and Graber [65]. By contrast, at high ATZ concentrations (Figure 8b), the molecules were cumulated within the slit pores, and consequently, some of them were forced to rotate and adopt a vertical geometry mode, leading to high surface density values and low cross-sectional areas. In addition, this configuration led to high values of C constants (Table 3) according to the IPD model. This was specifically the case with ACM and ACPC, with surface density values of ca. 0.194 and ca. 0.226 molecules·nm−2, respectively. Accordingly, the cross-sectional areas (σATZ = 1/ρsurf) of the adsorbed atrazine obtained for the maximum coverage of adsorption were ca. 5.2 and ca. 4.4 nm2·molecule−1 for ACM and ACPC, respectively. These values are almost one order of magnitude lower than those obtained in MPB-CO2 and MPB-P50 but still higher than the theoretical values reported [65], leading to the conclusion that more than one adsorption site was required for atrazine adsorption in the nanoporous carbons in this study.

3. Experimental Procedures

3.1. Synthesis of Nanoporous Biochars

Mangosteen peel (Garcinia mangosteen), denoted as MP, was used as agricultural waste. A char sample was first prepared in a tubular furnace (Carbolite MFT, 12/38/400TM) via pyrolysis at 800 °C for 3 h under N2 flow (1 atm, 100 mL min−1) and denoted as MPB. Previous to pyrolysis, the peels were washed, dried, crushed, and sieved until achieving a particle size lower than 700 μm, with a mean particle size of ca. 350 μm. In the second step, two different nanoporous carbons were prepared from MPB using chemical and physical activation. Chemical activation was used by mixing 1 g of the char with 50 wt.% aqueous solution of H3PO4 with a 1:2 weight ratio for char:H3PO4. After observing a wetness impregnation condition (continuous stirring for ca. 1 h at 70 °C), the sample was activated at 800 °C for 1 h under N2 flow (ultra-high purity, 1 atm, 100 mL min−1). This sample was denoted as MPB-P50. A second nanoporous carbon was prepared at 800 °C via the physical activation of MPB under CO2 flow (ultra-high-purity, 1 atm, 1 h, 100 mL min−1) and denoted as MPB-CO2. For the sake of comparison, two different commercially activated carbons from Merck (ca. 90% microporous) and PureCarbon (ca. 60% microporous) were used and denoted as ACM and ACPC, respectively. The average size of mangosteen-peel-derived carbons was ca. 5 times higher than the size of commercially activated carbons (ca. 75 μm).

3.2. Characterization

N2 adsorption–desorption isotherms were obtained at −196 °C in an Autosorb IQ2 equipment (Quantachrome). Samples were previously degassed at 250 °C for 6 h at high vacuum. The surface areas were estimated using the Brunauer–Emmett–Teller model (BET) using the multipoint N2 adsorption method [46,47], and the Dubinin–Astakhov (DA) method [48] was used to evaluate the micropore volume and pore size distribution (PSD).
The morphology of the samples was verified via scanning electron microscopy (SEM) using a JEOL microscope (6490-LV) operated at 20 kV. The functional surface groups of the carbons were quantified using the Boehm acid–base titration method [45,69]. In addition, the surface pH of carbons (pHPZC) was estimated using the drift pH method [37,70].

3.3. Kinetics and Equilibrium Studies of the Atrazine Adsorption

High-purity (99.9%, Riedel de Haen) atrazine (AT) was used. Table S3 (Supplementary Materials) summarizes some of the selected properties of AT, while Figure S6 shows its structural representation. The kinetics of adsorption were analyzed at a constant temperature of ca. 25 °C. In a typical test, 6.3 mg of carbon was suspended under constant stirring in 125 mL of ATZ solution with an initial concentration between 0.5 and 5.0 ppm (2.32–23.2 μmol·L−1; 0.29–2.9 μmol). The loading of adsorbent used in the present work was 0.05 g·L−1, ca. 20 times lower than reported in a previous study (1.0 g·L−1) [45]. This low loading decreases the costs associated with atrazine removal and prevents a high ATZ uptake, which can introduce inaccuracies in the estimations of the kinetic parameters of adsorption [53]. The time required to achieve the equilibrium of adsorption was determined from the kinetics of adsorption. Different kinetic parameters of adsorption were obtained from the pseudo-first-order [56], pseudo-second-order [57], and intraparticle diffusion models [54,55]. Table S1 (Supplementary Materials) provides a summary of the kinetic expressions used in the present study. Data of MB adsorbed at equilibrium conditions were normalized as a function of the sample’s weight. The amount of atrazine adsorbed qads-t (μmol) at time t was calculated using Equation (6), where Co is the ATZ initial concentration (μmol·L−1), Ct is the concentration (μmol·L−1) at the time of adsorption t, and V is the volume of solution (0.125 L).
qads-t = (Co − Ct) × V
The kinetics and equilibrium adsorption studies were performed without adding any buffer or electrolyte to control the pH. Several aliquots were taken off from the solution at different times and the concentration of ATZ in the solution was measured using UV–Visible spectroscopy in a Merck spectrophotometer set at 223 nm [30,42]. The results of atrazine adsorption isotherms were interpreted using the Langmuir [62] and Freundlich [63] equilibrium models. The equations used for the estimation of adsorption parameters are summarized in Table S2 (Supplementary Materials). The kinetics and equilibrium tests were conducted in duplicate, with a reproducibility better than 5%.

3.4. Theoretical Estimations

The adsorption energy of atrazine was evaluated based on a pristine graphene (GPristine) structure. In order to verify the influence of the chemical surface of nanoporous carbons, computational estimations of the atrazine adsorption energy were also performed on graphene layers functionalized with oxygen-containing groups, including pyrone, ketone, phenol, and carboxylic acid groups, denoted as (GPyrone), (GKetone), (GPhOH), and (GCOOH), respectively. In all cases, periodic DFT calculations were carried out using generalized gradient approximation (GGA), with the Perdew–Burke–Ernzerhof (PBE) exchange–correlation functional [66], as implemented in the Quantum Espresso package [71]. Ultrasoft pseudo-potentials available in the Quantum Espresso distribution repository were used in all calculations [72,73].
Graphene layers were optimized with a plane 5 × 5 hexagonal unit cell. The supercell parameters were a = 12.28 Å, b = 15.28 Å, c = 30 Å, α = ß = 90°, and γ = 120°. An additional 3.0 Å in b minimized the interlayer interactions and preserved the identity of the different substituents. Similarly, due to the 20 Å parameter in the c direction, the interaction between parallel layers could be ignored. In the geometry optimization calculations, valence electrons were described using plane waves with cutoff values of 150 Ry and 1500 Ry for energy and charge density, respectively. In such optimization calculations, a Γ-centered k-point Monkhorst–Pack sampling over the Brillouin zone, and the Gaussian broadening of 0.01 Ry as a smearing technique, were also used. These cutoffs were updated to 80 Ry and 800 Ry, respectively, with a 3 × 3 × 1 Γ-centered sampling over the Brillouin zone for the graphene layer and 3 × 3 × 3 Γ-centered for the adsorbed slabs. In the calculations of the projected density of states (PDOS), a denser k-point grid of 6 × 6 × 1 Γ-centered and 4 × 4 × 4 Γ-centered for graphene and adsorbed systems were used, respectively. The convergence thresholds for energy and forces were set up at 10−4 Ry and 10−3 Ry/Bohr for all calculations.

4. Conclusions

It is well known that activated carbons comprise extremely distorted defective graphene structures and not ideal graphene layers. The present work is scientifically important since the kinetic and equilibrium results presented here follow the same trend as those obtained through theoretical calculations. The characterization of the surface groups obtained from Boehm titration agrees with the preliminary results obtained from XPS, HRTEM, and EDS [45].
The present work contributes to the understanding of the interactions between triazine-based pollutants and the surface functional groups in nanoporous carbons in the liquid–solid interface. For instance, the kinetic models (pseudo-first-order, pseudo-second-order, and intraparticle diffusion models) and equilibrium parameters from the Langmuir and Freundlich models were correlated with the textural properties and surface chemistry of the nanoporous carbons.
The kinetic and equilibrium studies showed that at a low concentration, the pore framework played the most important role, where mesopores were the driving force inhibiting intraparticle pore diffusion limitations. This trend was the opposite at a high concentration of atrazine, where the surface chemistry seemed to be the driving force for the adsorption of the herbicide. The Langmuir and Freundlich models could be used to explain both the uptake and thermodynamic trends of atrazine adsorption in the commercially activated nanoporous carbons used in this study.
The results were compared against commercially activated carbons, and theoretical estimations were performed to verify the influence of different functional groups (acid and basic) on the thermodynamic trend to adsorb the pesticide. Accordingly, although the model used for the DFT estimations was based on a simplified notion (i.e., one that considers a nanoporous carbon to be constituted of graphene layers decorated with oxygen groups), the correlations found between the theoretical estimations of atrazine’s adsorption energy and the surface chemistry of the activated carbons are of major importance. The removal of atrazine expressed in terms of qT was highly dependent on the surface area and the total pore volume, mainly, micropores. However, in terms of KL, the thermodynamic trend to adsorb atrazine increased with the increase in the surface pH of the adsorbent. This experimental fact was demonstrated with theoretical estimations of adsorption energy as a function of the polarization of the graphene layer in the presence of different functional groups.
In summary, the mechanism of ATZ adsorption seems to be a combination of physisorption and chemisorption, and both the surface chemistry and porous framework of carbons are the driving forces controlling the mechanism. A general conclusion drawn is that mangosteen peels can be potentially used as a biomass residue for the sustainable preparation of efficient adsorbent for the removal of pesticides such as atrazine, an important and dangerous problem in Latin American countries.

Supplementary Materials

The following supporting information can be downloaded at: https://www.mdpi.com/article/10.3390/molecules28135268/s1, Table S1. Kinetics model used for the analysis of ATZ adsorption. Table S2. Models for the adsorption’s isotherms and mathematical expression involved in the different equilibrium adsorption isotherms. Table S3. Atrazine’s selected properties. Figure S1. Kinetics treatments for ATZ adsorption on ACM (a–c,g–i) and MPB-CO2 (d–f,j–l). 0.5 ppm: (a–f); 5.0 ppm: (g–l). Pseudo first-order: (a,d,g,j); Pseudo second-order: (b,e,h,k); Intraparticle diffusion model: (c,f,i,l). Figure S2. Kinetics treatments for ATZ adsorption on ACPC (a–c,g–i) and MPB-P50 (d–f,j–l). 0.5 ppm: (a–f); 5.0 ppm: (g–l). Pseudo first-order: (a,d,g,j); Pseudo second-order: (b,e,h,k); Intraparticle diffusion model: (c,f,i,l). Figure S3. Linear regressions of Langmuir (a,c) and Freundlich (b,d) adsorption isotherms of atrazine. (a,b): ACM; (c,d): ACPC. Figure S4. Linear regressions of Langmuir (a,c) and Freundlich (b,d) adsorption isotherms of atrazine. (a,b): MPB-CO2; (c,d): MPB-P50. Figure S5. DOS (black line) and projected DOS on the oxygen-containing graphene (green line) and atrazine (blue line) with PBE exchange–correlation functional. Figure S6. Molecular structure of atrazine (C8H14ClN5).

Author Contributions

Conceptualization, J.M. and J.C.M.-P.; data curation, J.M., P.S.P. and J.C.M.-P.; formal analysis, J.M. and C.P.A.-M.; investigation, J.M., C.P.A.-M., J.D.L. and J.Z.-R.; methodology, C.P.A.-M. and J.D.L.; software, J.D.L. and J.Z.-R.; validation, J.M., J.Z.-R., L.G. and P.S.P.; visualization, P.S.P.; writing—original draft preparation, J.M.; writing—review and editing, J.M. and J.C.M.-P. All authors have read and agreed to the published version of the manuscript.

Funding

C.P.A.-M. acknowledges the funds from COLCIENCIAS National Doctorate Call 567 fellow. J.M. and P.S.P. acknowledge the Chilean funds from ANID-FONDECYT Project 1220228 and ANID-ANILLO Project ATE220014. J.C.M.-P. acknowledges the funds from the Faculty of Sciences, University of the Andes, 11-28-2017-2019. J.Z.-R. would like to thank the Facultad de Ciencias and the Dirección de Servicios de Información y Tecnología, of Universidad de los Andes, for financial support with Project NV-2020-99-2009 and the access to high-performance computing facilities.

Institutional Review Board Statement

Not applicable.

Informed Consent Statement

Not applicable.

Data Availability Statement

Data are available upon request.

Conflicts of Interest

The authors declare no conflict of interest. The funders had no role in the design of the study; in the collection, analyses, or interpretation of data; in the writing of the manuscript; or in the decision to publish the results.

Sample Availability

Samples of the compounds are available upon request.

Ethical Approval

Authors read and approved publishing the paper in the Molecules journal. The authors declare the paper has not been published previously, nor is it being considered by any other peer-reviewed journal.

References

  1. Ratnayaka, D.D.; Brandt, M.J.; Johnson, K.M. Specialized and advanced water treatment processes. In Water Supply, 6th ed.; Ratnayaka, D., Brandt, M.J., Johnson, K.M., Eds.; Elsevier: Amsterdam, The Netherlands, 2009; pp. 365–423. [Google Scholar]
  2. Crittenden, J.C.; Trussell, R.R.; Hand, D.W.; Howe, K.J.; Tchobanoglous, G. Granular filtration. In MWH’s Water Treatment: Principles and Design; John and Wiley and Sons: Hoboken, NJ, USA, 2012; pp. 727–818. [Google Scholar]
  3. Sauvé, S.; Desrosiers, M. A review of what is an emerging contaminant. Chem. Cent. J. 2014, 8, 15. [Google Scholar] [CrossRef] [Green Version]
  4. Ternes, T.A.; Meisenheimer, M.; McDowell, D.; Sacher, F.; Brauch, H.-J.; Haistgulde, B.; Zulei-Seibert, N. Removal of pharmaceuticals during drinking water treatment. Environ. Sci. Technol. 2002, 36, 3855–3863. [Google Scholar] [CrossRef] [PubMed]
  5. Loraine, G.A.; Pettigrove, M.E. Seasonal variations in concentrations of pharmaceuticals and personal care products in drinking water and reclaimed wastewater in southern California. Environ. Sci. Technol. 2006, 40, 687–695. [Google Scholar] [CrossRef] [PubMed]
  6. Gibs, J.; Stackelberg, P.E.; Furlong, E.T.; Meyer, M.; Zaugg, S.D.; Lippincott, R.L. Persistence of pharmaceuticals and other organic compounds in chlorinated drinking water as a function of time. Sci. Total Environ. 2007, 373, 240–249. [Google Scholar] [CrossRef] [PubMed]
  7. Stackelberg, P.E.; Gibs, J.; Furlong, E.T.; Meyer, M.; Zaugg, S.D.; Lippincott, R. Efficiency of conventional drinking-water-treatment processes in removal of pharmaceuticals and other organic compounds. Sci. Total Environ. 2007, 377, 255–272. [Google Scholar] [CrossRef]
  8. Syafrudin, M.; Kristanti, R.A.; Yuniarto, A.; Hadibarata, T.; Rhee, J.; Al-Onazi, W.A.; Algarni, T.S.; Almarri, A.H.; Al-Mohaimeed, A.M. Pesticides in drinking water—A review. Int. J. Environ. Res. Public Health 2021, 18, 468. [Google Scholar] [CrossRef] [PubMed]
  9. Buchanan, I.; Liang, H.C.; Khan, W.; Liu, Z.; Singh, R.; Ikehata, K.; Chelme-Ayala, P. Pesticides and Herbicides. Water Environ. Res. 2009, 81, 1731–1815. [Google Scholar] [CrossRef]
  10. Agency for Toxic Substances and Disease Registry (ATSDR). ATRAZINE, CAS # 1912-24-9; ATSDR: Atlanta, GA, USA, September 2003. [Google Scholar]
  11. Errata/Addendum Sheet for Changes to the Atrazine Interim Reregistration Eligibility Decision; United States Environmental Protection Agency (USEPA): Washington, DC, USA, 2003. Available online: https://www3.epa.gov/pesticides/chem_search/reg_actions/reregistration/ired_PC-080803_1-Jan-03.pdf (accessed on 1 May 2023).
  12. James, T.K.; Ghanizadeh, H.; Harrington, K.C.; Bolan, N.S. Degradation of atrazine and bromacil in two forestry waste products. Sci. Rep. 2021, 11, 3284. [Google Scholar] [CrossRef]
  13. Graymore, M.; Stagnitti, F.; Allinson, G. Impacts of atrazine in aquatic ecosystems. Environ. Int. 2001, 26, 483–495. [Google Scholar] [CrossRef]
  14. Mudhoo, A.; Garg, V.K. Sorption, Transport and transformation of atrazine in soils, minerals and composts: A review. Pedosphere 2011, 21, 11–25. [Google Scholar] [CrossRef]
  15. Nödler, K.; Licha, T.; Voutsa, D. Twenty years later—Atrazine concentrations in selected coastal waters of the Mediterranean and the Baltic Sea. Mar. Pollut. Bull. 2013, 70, 112–118. [Google Scholar] [CrossRef] [PubMed]
  16. Singh, S.; Kumar, V.; Chauhan, A.; Datta, S.; Wani, A.B.; Singh, N.; Singh, J. Toxicity, degradation and analysis of the herbicide atrazine. Environ. Chem. Lett. 2018, 16, 211–237. [Google Scholar] [CrossRef]
  17. Spanò, L.; Tyler, C.C.R.; van Aerle, R.; Devos, P.; Mandiki, S.N.; Silvestre, F.; Thomé, J.P.; Kestemont, P. Effects of atrazine on sex steroid dynamics, plasma vitellogenin concentration and gonad development in adult goldfish (Carassius auratus). Aquat. Toxicol. 2004, 66, 369–379. [Google Scholar] [CrossRef]
  18. Hayes, T.B.; Collins, A.; Lee, M.; Mendoza, M.; Noriega, N.; Stuart, A.; Vonk, A. Hermaphroditic, demasculinized frogs after exposure to the herbicide atrazine at low ecologically relevant doses. Proc. Natl. Acad. Sci. USA 2002, 99, 5476–5480. [Google Scholar] [CrossRef] [PubMed]
  19. Albuquerque, F.P.; de Oliveira, J.L.; Moschini-Carlos, V.; Fraceto, L.F. An overview of the potential impacts of atrazine in aquatic environments: Perspectives for tailored solutions based on nanotechnology. Sci. Total Environ. 2019, 700, 134868. [Google Scholar] [CrossRef]
  20. Fan, W.; Yanase, T.; Morinaga, H.; Gondo, S.; Okabe, T.; Nomura, M.; Komatsu, T.; Morohashi, K.; Hayes, T.B.; Takayanagi, R.; et al. Atrazine-induced aromatase expression is SF-1 dependent: Implications for endocrine disruption in wildlife and reproductive cancers in humans. Env. Health Perspect. 2017, 115, 720. [Google Scholar] [CrossRef] [Green Version]
  21. Rinsky, J.L.; Hopenhayn, C.; Golla, V.; Browning, S.; Bush, H. Atrazine exposure in public drinking water and preterm birth. Public Health Rep. 2012, 127, 72–80. [Google Scholar] [CrossRef] [PubMed] [Green Version]
  22. Almberg, K.S.; Turyk, M.E.; Jones, R.M.; Rankin, K.; Freels, S.; Stayner, L.T. Atrazine contamination of drinking water and adverse birth outcomes in community water systems with elevated atrazine in Ohio, 2006–2008. Int. J. Environ. Res. Public Health 2018, 15, 1889. [Google Scholar] [CrossRef] [Green Version]
  23. Galbiati, V.; Buoso, E.B.; d’Emmanuele di Villa Bianca, R.D.; Paola, F.; Morroni, G.; Nocentini, M.; Racchi, B.; Viviani, E. Corsini, Immune and nervous systems interaction in endocrine disruptors toxicity: The case of atrazine. Front. Toxicol. 2021, 3, 649024. [Google Scholar] [CrossRef]
  24. Commission Decision Concerning the Non-Inclusion of Atrazine in Annex I to Council Directive 91/414/EEC and the Withdrawal of Authorizations for Plant Protection Products Containing This Active Substance. Off. J. Eur. Union 2004, 3, 157. Available online: https://eur-lex.europa.eu/legal-content/EN/TXT/PDF/?uri=CELEX:52020SC0087&rid=1 (accessed on 1 May 2023).
  25. Directive 2000/60/EC of the European Parliament and of the Council of 23 October 2000 Establishing a Framework for Community Action in the Field of Water Policy. Off. J. Eur. Communities 2000, L327, 72. Available online: https://www.eea.europa.eu/policy-documents/directive-2000-60-ec-of (accessed on 1 May 2023).
  26. PAN International. The Consolidated List of Banned Pesticides, 6th ed.; Pesticide Action Network International: Penang, Malaysia, 2022; Available online: https://pan-international.org/pan-international-consolidated-list-of-banned-pesticides/ (accessed on 1 May 2023).
  27. World Health Organization (WHO). Guidelines for Drinking Water Quality. 2011. Available online: http://whqlibdoc.who.int/publications/2011/9789241548151_eng.pdf (accessed on 1 May 2023).
  28. Villanueva, C.M.; Durand, G.; Coutté, M.B.; Chevrier, C.; Cordier, S. Atrazine in municipal drinking water and risk of low birth weight, preterm delivery, and small-for-gestational-age status. Occup. Environ. Med. 2005, 62, 400–405. [Google Scholar] [CrossRef] [PubMed] [Green Version]
  29. Hildebrandt, A.; Guillamon, M.; Lacorte, S.; Tauler, R.; Barcelo, D. Impact of pesticides used in agriculture and vineyards to surface and groundwater quality (NorthSpain). Water Res. 2008, 42, 3315–3326. [Google Scholar] [CrossRef] [PubMed]
  30. Bohn, T.; Cocco, E.; Gourdol, L.; Guignard, C.; Hoffmann, L. Determination of atrazine and degradation products in Luxembourgish drinking water: Origin and fate of potential endocrine disrupting pesticides. Food Addit. Contam. 2011, 28, 1041–1054. [Google Scholar] [CrossRef]
  31. Gómez-Gutiérrez, A.I.; Jover, E.; Bodineau, L.; Albaigés, J.; Bayona, J.M. Organic contaminant loads into the Western Mediterranean Sea: Estimate of Ebro river inputs. Chemosphere 2006, 65, 224–236. [Google Scholar] [CrossRef]
  32. Carafa, R.; Wollgast, J.; Canuti, E.; Ligthart, J.; Dueri, S.; Hanke, G.; Eisenreich, S.J.; Viaroli, P.; Zaldívar, J.M. Seasonal variations of selected herbicides and related metabolites in water, sediment, seaweed and clams in the Sacca di Goro coastal lagoon (Northern Adriatic). Chemosphere 2007, 69, 1625–1637. [Google Scholar] [CrossRef]
  33. De Ambiente, M.; Vivienda y Desarrollo Territorial. Resolución. 2017. Available online: https://www.minsalud.gov.co/sites/rid/Lists/BibliotecaDigital/RIDE/DE/DIJ/Resoluci%C3%B3n_2115_de_2007.pdf (accessed on 1 May 2023).
  34. United Nations Environment Program (UNEP). Central America, and the Caribbean Regional Report. Regionally Based Assessment of Persistent Toxic Substances. 2002. Available online: http://www.oas.org/dsd/Quimicos/Central%20America%20Caribbean%20Report%20UNEP.pdf (accessed on 1 May 2023).
  35. Hernandez-Antonio, A. Modelo Conceptual de Contaminación de Aguas Superficiales Por Uso de Atrazina en Zonas Agrícolas. Ph.D. Thesis, Universidad Nacional Autónoma de México, Morelos, Mexico, 2013. Available online: https://repositorio.unam.mx/contenidos/modelo-conceptual-de-contaminacion-de-aguas-superficiales-por-uso-de-atrazina-en-zonas-agricolas-74101?c=r1gbgE&d=false&q=*:*&i=2&v=1&t=search_0&as=0 (accessed on 1 May 2023).
  36. Ormad, M.P.; Miguel, N.; Claver, A.; Matesanz, J.M.; Ovelleiro, J.L. Pesticides removal in the process of drinking water production. Chemosphere 2008, 71, 97–106. [Google Scholar] [CrossRef]
  37. Ignatowicz, K. Selection of sorbent for removing pesticides during water treatment. J. Hazard. Mater. 2009, 169, 953–957. [Google Scholar] [CrossRef]
  38. Chen, Y.; Huang, B.; Huang, M.; Cai, B. On the preparation and characterization of activated carbon from mangosteen shell. J. Taiwan Inst. Chem. Eng. 2011, 42, 837–842. [Google Scholar] [CrossRef]
  39. Yusufu, M.I.; Ariahu, C.C.; Igbabul, B.D. Production and characterization of activated carbon from selected local raw materials. Afr. J. Pure Appl. Chem. 2012, 6, 123–131. [Google Scholar] [CrossRef]
  40. Gupta, V.K.; Ali, I. Water treatment for organic pollutants by adsorption technology. In Environmental Water: Advances in Treatment, Remediation and Recycling; Gupta, V.K., Ali, I., Eds.; Elsevier: Amsterdam, The Netherlands, 2013; pp. 29–91. [Google Scholar]
  41. Yahya, M.A.; Al-Qodah, Z.; Ngah, C.W.Z. Agricultural bio-waste materials as potential sustainable precursors used for activated carbon production: A review. Renew. Sustain. Energy Rev. 2015, 46, 218–235. [Google Scholar] [CrossRef]
  42. Lupul, I.; Yperman, J.; Carleer, R.; Gryglewicz, G. Adsorption of atrazine on hemp stem-based activated carbons with different surface chemistry. Adsorption 2015, 21, 489–498. [Google Scholar] [CrossRef] [Green Version]
  43. Li, Y.; Wang, X.; Cao, M. Three-dimensional porous carbon frameworks derived from mangosteen peel waste as promising materials for CO2 capture and supercapacitors. J. CO2 Util. 2018, 27, 204–216. [Google Scholar] [CrossRef]
  44. Dasgupta, A.; Matos, J.; Muramatsu, H.; Ono, Y.; González, V.; Liu, H.; Rotella, C.; Fujizawa, K.; Cruz-Silva, R.; Hashimoto, Y.; et al. Nanostructured carbon materials for enhanced nitrobenzene adsorption: Physical vs. Chemical surface properties. Carbon 2018, 139, 833–844. [Google Scholar] [CrossRef]
  45. Amézquita-Marroquín, C.P.; Torres-Lozada, P.; Giraldo, L.; Húmpola, P.D.; Rivero, E.; Poon, P.S.; Matos, J.; Moreno-Piraján, J.C. Sustainable production of nanoporous carbons: Kinetics and equilibrium studies in the removal of atrazine. J. Coll. Inter. Science. 2020, 562, 252–267. [Google Scholar] [CrossRef]
  46. Rouquerol, J.; Llewellyn, P.; Rouquerol, F. Characterization of porous solids VII. Stud. Surf. Sci. Catal. 2007, 160, 49–56. [Google Scholar]
  47. Thommes, M.; Cychosz, K.A. Physical adsorption characterization of nanoporous materials: Progress and challenges. Adsorption 2014, 20, 233–250. [Google Scholar] [CrossRef]
  48. Dubinin, M.M. Description of adsorption equilibria of vapors on zeolites over wide ranges of temperature and pressure. Adv. Chem. Ser. 1971, 102, 69–85. [Google Scholar]
  49. Matos, J.; Laine, J. Ethylene Conversion on Activated Carbon Supported NiMo Catalysts: Effect of the Support. Appl. Catal. A Gen. 2003, 241, 25–38. [Google Scholar] [CrossRef]
  50. Matos, J.; Labady, M.; Albornoz, A.; Laine, J.; Brito, J.L. Topological organization and textural changes of carbon macro-networks submitted to activation with N2 and CO2. J. Mater. Sci. 2004, 39, 3705–3716. [Google Scholar] [CrossRef]
  51. Matos, J.; Labady, M.; Albornoz, A.; Laine, J.; Brito, J.L. Catalytic Effect of KOH on textural changes of carbon macronetworks by physical activation. J. Molec. Catal. A Chem. 2005, 228, 189–194. [Google Scholar] [CrossRef]
  52. Alves, L.A.; de Castro, A.H.; de Mendonça, F.G.; de Mesquita, J.P. Characterization of acid functional groups of carbon dots by nonlinear regression data fitting of potentiometric titration curves. Appl. Surf. Sci. 2016, 370, 486–495. [Google Scholar] [CrossRef]
  53. Matos, J.; Arcibar-Orozco, J.; Poon, P.S.; Pecchi, G.; Rangel-Mendez, J.R. Influence of phosphorous upon the formation of DMPO-•OH and POBN-O2•¯ spin-trapping adducts in carbon-supported P-promoted Fe-based photocatalysts. J. Photochem. Photobiol. A Chem. 2020, 391, 112362. [Google Scholar] [CrossRef]
  54. Wu, F.-C.; Tseng, R.-L.; Juang, R.-S. Initial behavior of intraparticle diffusion model used in the description of adsorption kinetics. Chem. Eng. J. 2009, 153, 1–8. [Google Scholar] [CrossRef]
  55. McKay, G.; Otterburn, M.S.; Sweeney, A.G. The removal of color from effluent using various adsorbents—III. Silica: Rate processes. Water Res. 1980, 14, 15–20. [Google Scholar] [CrossRef]
  56. Ho, Y.S.; McKay, G. A Comparison of Chemisorption Kinetic Models Applied to Pollutant Removal on Various Sorbents. Process Saf. Environ. Prot. 1998, 76, 332–340. [Google Scholar] [CrossRef] [Green Version]
  57. Wu, F.-C.; Tseng, R.-L.; Juang, R.-S. Kinetic modeling of liquid-phase adsorption of reactive dyes and metal ions on chitosan. Water Res. 2001, 35, 613–618. [Google Scholar] [CrossRef]
  58. Lagergren, S. Zur Theorie Der Sogenannten Adsorption Geloster Stoffe. K. Sven. Vetenskapsakademiens Handl. 1898, 24, 1–39. [Google Scholar]
  59. Ho, Y.; McKay, G. Pseudo-second order model for sorption processes. Process Biochem. 1999, 34, 451–465. [Google Scholar] [CrossRef]
  60. Tan, G.; Sun, W.; Xu, Y.; Wang, H.; Xu, N. Sorption of mercury (II) and atrazine by biochar, modified biochars and biochar based activated carbon in aqueous solution. Bioresour. Technol. 2016, 211, 727–735. [Google Scholar] [CrossRef]
  61. Leyva-Ramos, R.; Ocampo-Perez, R.; Mendoza-Barrón, J. External mass transfer and hindered diffusion of organic compounds in the adsorption on activated carbon cloth. Chem. Eng. J. 2012, 183, 141–151. [Google Scholar] [CrossRef]
  62. Langmuir, I. The constitution and fundamental properties of solids and liquids. Part I Solids. J. Am. Chem. Soc. 1916, 38, 2221–2295. [Google Scholar] [CrossRef] [Green Version]
  63. Freundlich, H. Über die adsorption in Lösungen. Z. Phys. Chem. Stöchiometrie Verwandschaftslehre 1907, 57, 385–470. [Google Scholar] [CrossRef]
  64. Matos, J.; Fierro, V.; Montaña, R.; Rivero, E.; de Yuso, A.M.; Zhao, W.; Celzard, A. High surface area microporous carbons as photoreactors for the catalytic photodegradation of methylene blue under UV-vis irradiation. Appl. Catal. A Gen. 2016, 517, 1–11. [Google Scholar] [CrossRef]
  65. Matos, J.; Ocares-Riquelme, J.; Poon, P.S.; Montaña, R.; García, X.; Campos, K.; Hernández-Garrido, J.C.; Titirici, M.M. C-doped anatase TiO2: Adsorption kinetics and photocatalytic degradation of methylene blue and phenol, and correlations with DFT estimations. J. Colloid Inter. Sci. 2019, 547, 14–29. [Google Scholar] [CrossRef] [PubMed]
  66. Borisover, M.D.; Graber, E.R. Comment on competitive sorption between atrazine and other organic compounds in soils and model sorbents. Environ. Sci. Technol. 1997, 31, 1577. [Google Scholar] [CrossRef]
  67. Perdew, J.P.; Burke, K.; Ernzerhof, M. Generalized gradient approximation made simple. Phys. Rev. Lett. 1997, 78, 1396. [Google Scholar] [CrossRef] [Green Version]
  68. Wang, W.; Zhang, Y.; Shen, C.; Chai, Y. Adsorption of CO molecules on doped graphene: A first-principles study. AIP Adv. 2016, 6, 025317. [Google Scholar] [CrossRef]
  69. Bagri, A.; Grantab, R.; Medhekar, N.V.; Shenoy, V.B. Stability and Formation Mechanisms of Carbonyl- and Hydroxyl-Decorated Holes in Graphene Oxide. J. Phys. Chem. C 2010, 114, 12053–12061. [Google Scholar] [CrossRef]
  70. Boehm, H.P. Surface oxides on carbon and their analysis: A critical assessment. Carbon 2002, 40, 145–149. [Google Scholar] [CrossRef]
  71. De Cordoba, M.C.F.; Matos, J.; Montaña, R.; Poon, P.S.; Lanfredi, S.; Praxedes, F.R.; Hernández-Garrido, J.C.; Calvino, J.J.; Rodríguez-Aguado, E.; Rodríguez-Castellón, E.; et al. Sunlight photoactivity of rice husks-derived biogenic silica. Catal. Today 2019, 328, 125–135. [Google Scholar] [CrossRef]
  72. Giannozzi, P.; Baroni, S.; Bonini, N.; Calandra, M.; Car, R.; Cavazzoni, C.; Ceresoli, D.; Chiarotti, G.L.; Cococcioni, M.; Dabo, I.; et al. Quantum Espresso: A modular and open-source software project for quantum simulations of materials. J. Phys. Condens. Matter 2009, 21, 395502. [Google Scholar] [CrossRef] [PubMed]
  73. Available online: http://pseudopotentials.quantum-espresso.org/legacy_tables/ps-library/o (accessed on 1 May 2023).
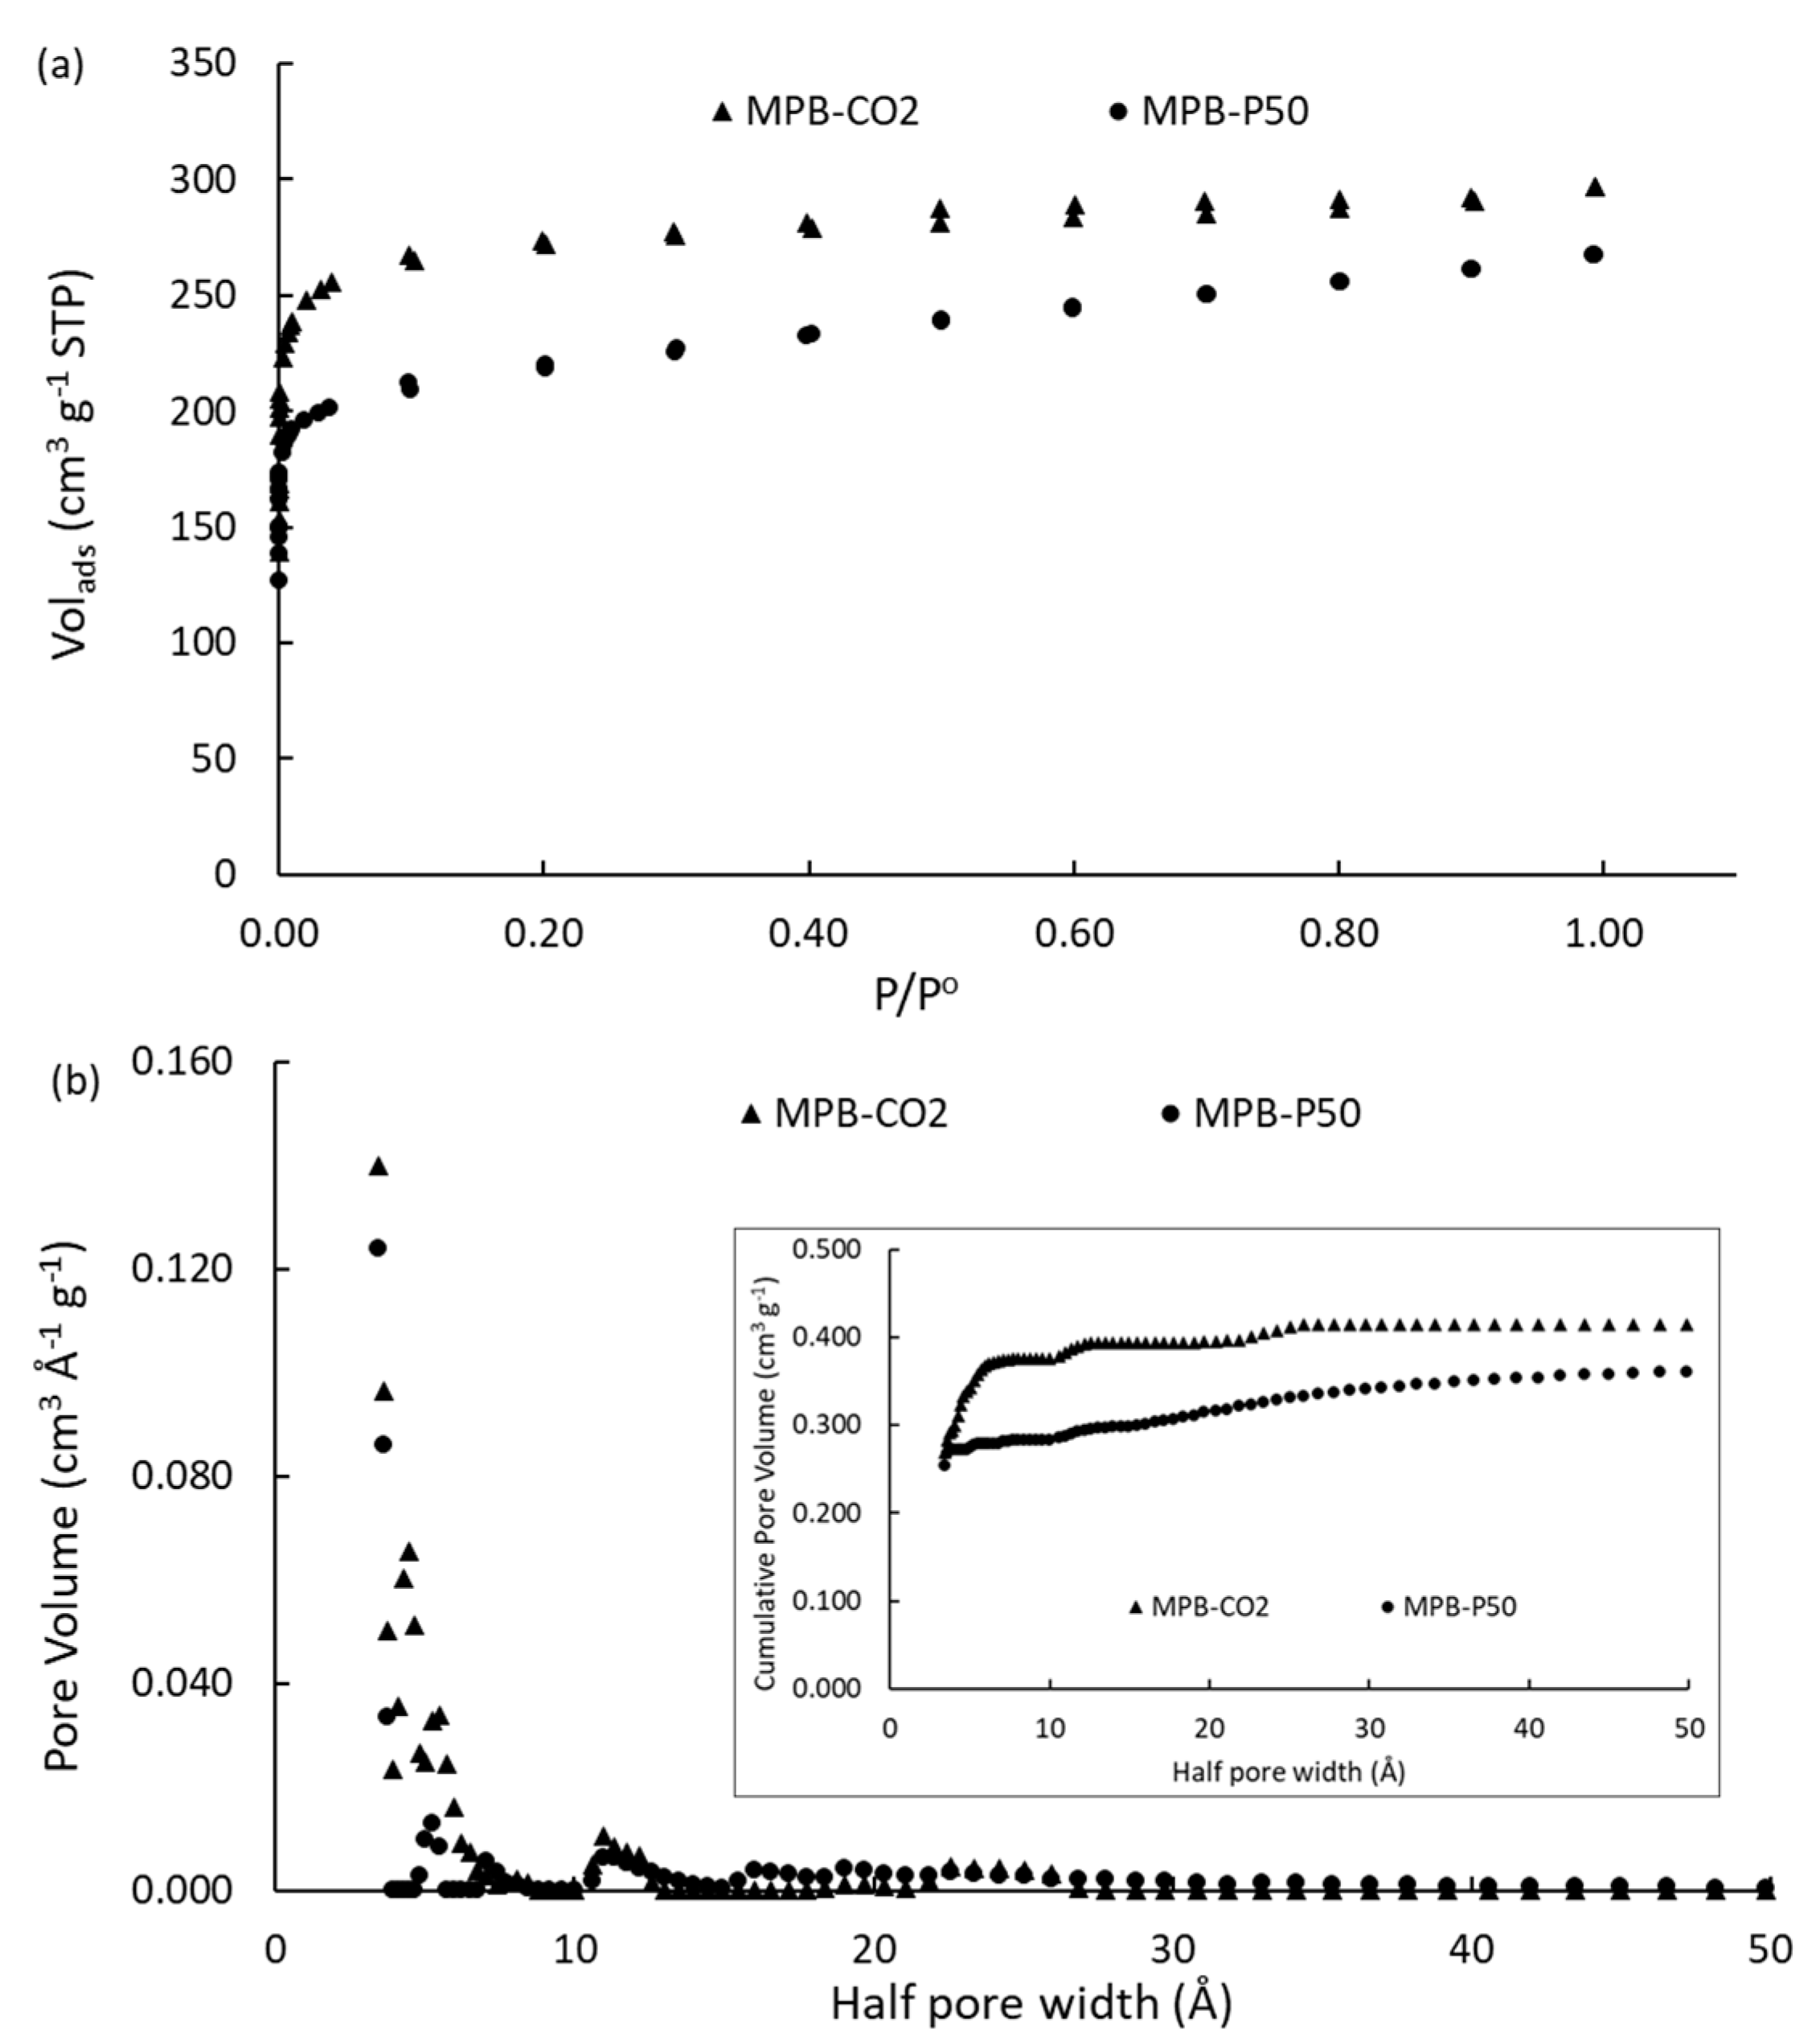
Figure 1. (a) N2 adsorption–desorption isotherms at −196 °C; (b) pore size distributions. The figure inset shows the cumulative pore volume on the activated carbons.
Molecules 28 05268 g001
Figure 2. SEM images of the homemade carbons: (a) MPB-CO2; (b) MPB-P50.
Molecules 28 05268 g002
Figure 3. Evolution of pH of activated carbons as a function of contact time.
Molecules 28 05268 g003
Figure 4. Kinetics of atrazine adsorption (qt) as a function of the initial concentration: (a) ACM; (b) ACPC; (c) MPB-CO2; (d) MPB-P50.
Molecules 28 05268 g004
Figure 5. Adsorption isotherms of atrazine: (a) ACM; (b) ACPC; (c) MPB-CO2; (d) MPB-P50.
Molecules 28 05268 g005
Figure 6. Optimized geometries of adsorbed systems in 1/1 monolayer using one atrazine molecule on a 5 × 5 graphene surface unit cell. O, N, Cl, and H atoms correspond to red, blue, green, and grey spheres, respectively.
Molecules 28 05268 g006
Figure 7. DOS (black line) and projected DOS on the pristine GPristine graphene (green line) and atrazine (blue line) with the PBE functional.
Molecules 28 05268 g007
Figure 8. Schematic model for the atrazine adsorption on porous carbons: (a) low ATZ concentration. (b) high ATZ concentration.
Molecules 28 05268 g008
Table 1. Summary of burn-off and textural properties of the mangosteen-derived (MPB-CO2 and MPB-P50) and commercially activated (ACM and ACPC) carbons.
SamplesYield a
(%)
SBET b
(m2·g−1)
Vmic c
(cm3·g−1)
W d (nm) Vtot e
(cm3·g−1)
Vmic/Vtot f
(%)
MPB35200.001--0.0300.03
MPB-CO22410800.4200.720.4590.92
MPB-P503284703221.380.4140.78
ACM g--7750.4020.960.4950.81
ACPC g--12400.3901.980.6500.60
a Yields estimated from the initial and final weight (after activation). The pyrolysis yield is reported for MPB, while for the other samples, the final yield is the product of the two processes. b SBET is the BET-specific surface area [46,47]. c Vmic is the volume of micropores according to the Dubinin–Astakhov model [48]. d W is the mean pore width according to the Dubinin–Astakhov model [48]. e VTot is the total volume of pores estimated at P/Po ≈ 0.99. f Vmic/Vtot is the micropore contribution to the pore framework. g Values are taken from reference [49].
Table 2. Summary of surface pH (pHPZC) and chemical functional groups of mangosteen-derived activated carbons evaluated using Boehm’s titrations.
SampleCarboxylicLactonesPhenolTotal AcidTotal BasicTotalpHPZC
(mmol·g−1)(mmol·g−1)(mmol·g−1)(mmol·g−1)(mmol·g−1)(mmol·g−1)
MPB-CO20.0530.5320.3600.4130.5320.9459.7
MPB-P500.6190.1370.5441.1630.1371.3005.4
Table 3. Summary of kinetic parameters for the atrazine removal on porous carbons.
CarbonATZ (ppm)qeq a (μmol)k1 b
(min−1)
R2k1 ck2 d
(μmol−1·min−1)
R2k2 ekp f
(μmol−1·min−0.5)
C g
(μmol)
R2kp h
ACM0.50.2820.0320.9970.7430.9280.0140.1460.954
10.5560.0240.9960.6380.9660.0090.4580.981
2.51.3850.0330.9850.2850.9630.0420.9810.863
52.6320.0210.9060.1300.9790.0731.9210.889
ACPC0.50.2410.0530.9721.9560.9660.0060.1810.852
10.5030.0280.9960.3940.9500.0200.2990.955
2.51.0640.0280.9650.2270.9490.0390.6750.879
51.7420.0410.9850.3490.8460.0601.1810.844
MPB-CO20.50.2410.0330.9770.3780.9440.0220.0230.931
10.3910.0190.9870.1330.9830.0300.0630.984
2.50.4590.0240.9960.1850.9710.0350.0990.977
50.6580.0260.9800.1240.9800.0460.1890.963
MPB-P500.50.0270.0520.91918.7960.9110.0020.0140.698
10.0550.0420.8728.3950.9720.0030.0290.643
2.50.0690.0230.9002.6840.9930.0030.0410.875
50.1010.0350.9190.8180.9920.0060.0350.958
a ATZ adsorbed after 120 min. b k1 is the pseudo-first-order rate constant. c R2k1 is the quadratic linear factor for k1. d k2 is the pseudo-second-order rate constant. e R2k2 is the quadratic linear factor for k2. f kp is the intraparticle diffusion model (IPD) rate constant. g C is the boundary layer thickness constant for the IPD model. h R2kp is the quadratic linear factor for the kp.
Table 4. Summary of the equilibrium parameters obtained for atrazine adsorption.
Carbonqm a
(μmol)
qm a
(mmol·g−1)
KL b
(L·μmol−1)
R2L cKF d
(mg·g−1)
KF d
(mmol·g−1)
nF eR2F f
ACM1.5730.2505.3740.929134.90.6251.790.976
ACPC2.9370.4660.2460.93443.20.2001.720.942
MPB-CO20.5650.0901.5740.95215.30.0714.120.923
MPB-P500.1390.0220.1200.9641.590.0071.990.921
a qm is the maximum capacity for ATZ adsorption in the monolayer; b KL is the adsorption constant according to the Langmuir model; c linear regression factor according to the Langmuir model; d KF is the adsorption constant according to the Freundlich model; e nF is the Freundlich heterogeneity factor; f linear regression factor according to the Freundlich model.
Table 5. Summary of adsorption energies of atrazine (Eads-ATZ) and dipolar moment (µ) obtained in pristine and oxygen-containing groups in graphene layers.
SystemGPhOHGCOOHGKetoneGPyroneGPristine
Eads-ATZ (eV)−0.024−0.048−0.063−0.099−0.169
µ (D)1.1033.2901.9171.7910.001
Disclaimer/Publisher’s Note: The statements, opinions and data contained in all publications are solely those of the individual author(s) and contributor(s) and not of MDPI and/or the editor(s). MDPI and/or the editor(s) disclaim responsibility for any injury to people or property resulting from any ideas, methods, instructions or products referred to in the content.