Abstract
To investigate the molecular structure and micropore structure of organic matters in coal-measure shale, the black shale samples of the Shanxi formation were collected from Xishan Coalfield, Taiyuan, and a hybrid experimental–simulation method was used for realistic macromolecular models of organic matter (OM). Four experimental techniques were used to determine the structural information of OM, including elemental analysis, state 13C nuclear magnetic resonance (13CNMR), X-ray photoelectron spectroscopy (XPS), and Fourier transform infrared spectroscopy (FTIR). With structural parameters, two-dimensional (2D) average molecular models of OM were established as C177H160O8N2S with a molar weight of 2474, which agreed well with the experimental 13C-NMR spectra. A realistic three-dimensional (3D) OM macromolecular model was also reconstructed, containing 20 2D molecules with a density of 1.41 g/cm3. To determine the connectivity and spatial disposition of the OM pores, focused ion beam microscope (FIB-SEM) and transmission electron micrographs (TEM) were utilized. The 3D OM pores models were developed. The results show that whether the OM pores varied from 20 to 350 nm as obtained from FIB-SEM images or less than 10 nm as observed in the TEM images, both were of poor connectivity. However, the ultra-micro pores from the 3D OM macromolecular model varied from 3Å to 10 Å and showed certain connectivity, which may be the main channel of diffusion. Furthermore, with the pressure increased, the methane adsorption capacity of the 3D OM model increased with a maximum value of 103 cm3/g at 7 MPa, indicating that OM pores less than 1 nm have a huge methane adsorption capacity. Therefore, our work provides an analysis method that is a powerful and superior tool in further research on gas migration.
1. Introduction
In the year of 2021, shale gas production in China increased to 26 trillion cubic meters, which accounts for more than 10% of the total natural gas production [1]. In the next five years, shale gas production will continue to increase rapidly and could contribute more than 20% of the total natural gas production [2,3]. China is rich in coal resources, and coal-measure strata are widely distributed, including in Shanxi, Shaanxi, Xinjiang, and Inner Mongolia [4]. As the main component of coal-measure strata, shale (mudstone and siltstone) develops with coal, sandstone and limestone, and its total thickness can reach hundreds of meters. In some layers, the dark shale develops very well, with a total organic carbon content (TOC) up to 30%, showing good hydrocarbon generation capacity [5]. It is estimated that the exploitable resources of coal-measure shale gas measure 8.97 × 10¹² m3, which promises great potential for resource exploration [4,5,6]. For coal-measure shale, its single layer is generally less than 20 m in thickness, and it is thus more suitable for co-exploitation with coal-bed methane or tight sandstone than for single mining.
In the coal-measure strata, carbonaceous mudstone is often developed near the coal seam, especially in the roof and floor of the coal seams. The TOC of carbonaceous mudstone is generally more than 10%, which plays a key role in the development of OM pores [7]. As the thermal maturity increases, numerous nano-pores are generated in the OM, which could provide larger surface areas and higher sorption energy for gas adsorption. It has been found that the methane adsorption capacity of shale is positively correlated with TOC. Methane molecules are adsorbed on the surface of OM molecules in the pores of shale, and OM pores are essential for shale gas storage [7,8,9,10]. Thus far, OM pores have been characterized with multiple measurements, such as field emission-scanning electron microscopy (FE-SEM), transmission electron microscopy (TEM), X-ray computed tomography (X-CT), low-pressure N2 and CO2 gas adsorption, etc. The OM pores were determined to be silt-like, ellipse-shaped, round, and irregular, etc., all of which can be classified into three categories: micropores (<2 nm), mesopores (2–50 nm), and macropores (>50 nm) [11,12,13]. Previous studies based on N2 and CO2 adsorption analysis have shown that most OM pores are less than 10 nm and are dominated by 2–4 nm [10]. However, limited by the device resolution, only the pores more than 10 nm could be identified, while the distribution and morphological characteristics of other pores (less than 10 nm) could not be directly observed [14,15,16]. The OM pores (less than 10 nm) can only be studied by computer modeling. Moreover, with the computational macromolecular model, many aspects related to coal or OM can be studied, such as the distribution features of micropores; characteristics for gas adsorption, desorption, and diffusion; mechanisms of thermal structural evolution and reaction, etc. [17,18,19,20].
The microstructure of OM pores is essential and is composed of macromolecules and their fragments. Therefore, it is necessary to first construct a macromolecular model of OM to study the nanopore structure of OM. A number of advanced analytical techniques have been used to determine the chemical structure and molecular composition of OM, such as X-ray diffraction (XRD), XPS, FT-IR, 13CNMR, and high-resolution transmission electron micrographs (HRTEM) [21,22,23]. With these methods, the distribution and occurrence information of the carbon skeleton, functional groups, and heteroatoms of coal or OM can be determined. There are two main ways to construct coal or OM 3D macromolecular models currently. One approach is to construct the average 2D OM molecular structure using the information of macromolecular composition as determined by element analysis, XPS, FTIR, and 13CNMR. Then, the 3D models are generated by molecular modeling and are optimized by cooperation with the experimental data of physical density and microporosity [24]. The other way is to construct 3D macromolecular models directly using the parameters of aromatic structures, aliphatic side chains, and heteroatoms obtained from HRTEM, 13CNMR, and XPS. The models are validated and modified using the data of physical structural properties such as bulk density, pore size distribution, etc. [21,25,26].
In this work, microscopic detection techniques and computer simulation methods were combined to investigate the structural characteristics of OM in coal-measure shale. The chemical-structural properties of OM extracted from Shanxi formation shale were determined with 13CNMR, FTIR, and XPS techniques. The micropore structure of OM was characterized with low-pressure CO2 adsorption, FIB-SEM and TEM. A realistic 3D OM model was established based on the average 2D model and was optimized and validated by the experimental data of bulk density and CO2 adsorption. Furthermore, the 3D OM pore model was reconstructed with FIB-SEM images, and the diffusion mechanism of methane in OM was discussed by analyzing the distribution and connectivity of pores as well. The methane adsorption of the 3D OM macromolecular structure was studied, and its capacity was evaluated.
2. Result and Discussion
2.1. Elemental Analysis, 13CNMR, and FTIR Data
The results of the elemental analysis for the OM sample (Table 1) show that the content of C is 87.61 wt%, while the H is relatively low at only 3.71 wt%, suggesting the feature of type III kerogen. The O occupies 5.51 wt% of the OM sample, which is a not high content, indicating that the OM is at a highly mature stage. The helium density of the OM sample is 1.40–1.42 g/cm3.

Table 1.
Elemental analysis of OM in sample XS-05.
The 13CNMR and FTIR data can be used to determine the chemical structure of the macromolecule for OM reconstruction. The 13CNMR spectrum of the OM sample is shown in Figure 1. There are three peak regions in the 13CNMR spectrum: the main peak is in 100–150 ppm and the other two median peaks in 0–50 ppm and 180–220 ppm, respectively. The largest peak in 100–150 ppm is assigned to the chemical shifts of aromatic carbons region. Peaks distributed in the regions of 15–22 ppm and 22–50 ppm correspond to aliphatic –CH3 and –CH2, respectively. The peaks in the chemical shift range of 180–210 ppm are of median intensity [21,24], which arises from aliphatic carbons connecting with carbonyl oxygen. Some small peaks located in 50–90 ppm are aliphatic carbons connecting carbonyl carbon to the hydroxyl carbon.
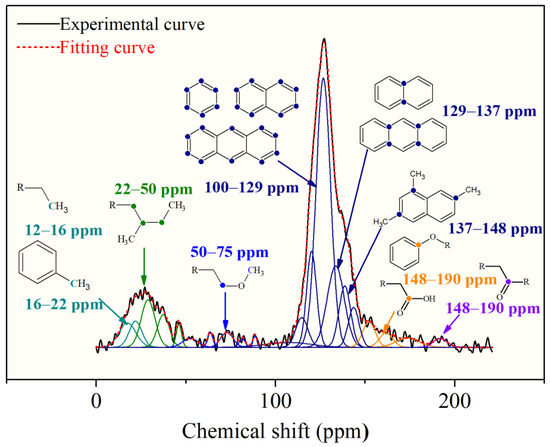
Figure 1.
Peak-fitting curves of the 13CNMR spectrum with wavenumber assignment.
To quantify the structural parameters, the 13CNMR spectra were further treated by peak fitting with Origin 9.0. The splitting peak position of each functional group and its relative percentage are shown in the Table 2. The skeleton structure parameters of OM were obtained. Moreover, the average ratios of aromatic bridge carbon to aromatic peripheral carbon (XBP) were calculated by the following equation:
XBP = faB/(faS + faH + faP)

Table 2.
Structure parameters from 13CNMR spectra of OM by peak fitting.
XBP is calculated to be 0.195 for OM samples, which is lower than coal in the same layer.
Figure 2 shows the FTIR spectra of the OM sample, which were corrected by the baseline. According to the previous studies, the identified absorbance bands were classified into four regions: the aromatic structure region (900–700 cm−1), oxygen functions’ region (1800~1000 cm−1), the aliphatic structure (3000–2800 cm−1), and hydroxyl structure region (3600–3000 cm−1) [27,28].
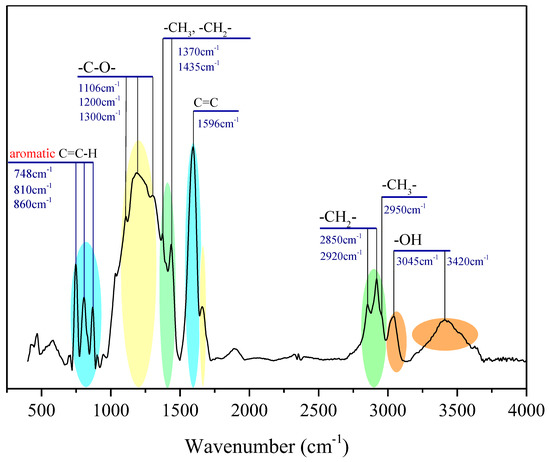
Figure 2.
The FTIR profile of the OM sample with wavenumber assignment.
The peaks at 900–700 cm−1 are due to out-of-plane bending of the aromatic C–H, and the peak at 748 cm−1 is of the highest intensity in this region, indicating the di-substitution of the benzene ring is dominant. The peaks of 1110–1330 cm−1 represent the C–O of the oxygen-containing functional groups, such as ethers, hydroxyls, etc. The prominent peaks on the spectra are located at the range of 1370–1450 cm−1 and 2850–2950 cm−1, which are both assigned to aliphatic chains [27,29], suggesting a certain amount of oxygen-containing functional groups and aliphatic chains exist in the OM samples. The peak near 1600 cm−1 is obvious and sharp, which further confirms the existence in large quantities of aromatic carbons in the OM chemical structure.
The chemical-functional groups on the surface of OM were measured by XPS experiment. The type and distribution of O, N, and S heteroatoms in OM were determined by peak fitting of XPS spectra [30]. The results are shown in Figure 3, and the distribution of the corresponding heteroatom functional groups is listed in Table 3.
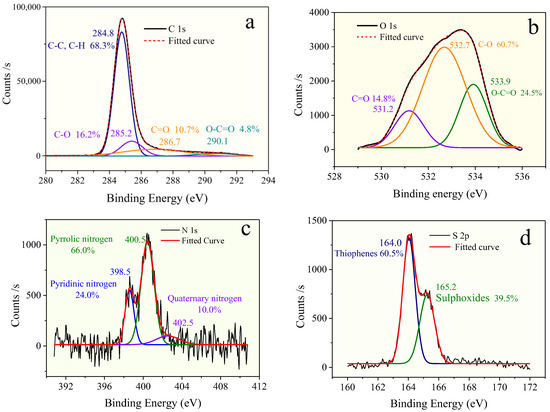
Figure 3.
XPS: (a) C 1s scan, (b) O 1s scan, (c) N 1s scan, and (d) S 2p scan spectra of OM in the Shanxi formation shale.

Table 3.
The XPS data of the OM sample.
The deconvolution of the C 1s signal generated two peaks at binding energies of 284.8 eV, 285.2 eV, 286.7 eV, and 290.1 eV, which correspond to the groups of C–C or C–H (68.3%), C–O (alcohol, phenol, or ether; 16.2%), C=O (carbonyl; 10.7%), and COOH (carboxyl; 4.8%), respectively [31]. As Figure 3 and Table 3 show, the form of oxygen existing in the OM sample is mostly C–O (60.7%), followed by C=O (24.5%), and the least is COOH (14.8%).
The signal-to-noise ratios of XPS of N 1s and S 2p spectra did not require smoothing processing before peak fitting. The result of deconvolution of the N 1s signal (Table 3) suggests that the existence of nitrogen consists of three types, including pyridine (25.1%), pyrrolic (68.0%), and quaternary nitrogen (6.9%), and nitrogen atoms in the OM samples are mainly in the formation of pyrrolic nitrogen.
2.2. Construction of 2D Molecular Model
The condensed aromatic nuclei in OM are similar to those of coal, which consist of aromatic benzene rings, aliphatic rings, hydroaromatic rings, and aromatic heterocyclic structures (nitrogen, sulfur, etc.) [18,32]. The ratio of aromatic bridge carbon/aromatic weekly carbon (XBP) of OM samples is 0.196. Combined with the value of the carbon content, the average aromatic ring number of the OM sample is two, and the aromatic structural units of OM are mainly composed of naphthalene, benzene, anthracene, pyrene, etc. Generally, the OM molecules with high maturity have the relative molecular weight of about 3000, and the number of carbon atoms is nearly 200 [33]. According to the experimental 13CNMR data, the types and numbers of aromatic structures in OM macromolecular were determined and are given in Table 4. The number of aromatic carbon atoms is 134. The XBP of the OM single-molecular model is 0.195, which is close to the experimental result.

Table 4.
Types of aromatic structure units in the OM single-molecular model.
The aliphatic structure in OM includes side chains, bridge bonds, saturated rings, hydroaromatic rings, etc. As shown in Table 1, the aromaticity fa’ value of OM is 0.76. The atomic numbers of total carbon and aliphatic carbon are 177 and 43, respectively. The aliphatic structure in OM includes side chains, bridge bonds, saturated rings, hydroaromatic rings, etc. The ratio of fal*:falH:faO is about 6:10:4, which indicates the main existence of the aliphatic structure is hypomethyl carbon or quaternary carbon, with a certain amount of methyl carbons and oxygen lignant carbon.
The result of elemental analysis shows that the atomic ratios of O/C, N/C, and S/C of the OM samples are 0.047, 0.012, and 0.009 (Table 1), respectively. Combined with the XPS result, eight oxygen atoms are presented in the model. The number of ether (C–O) groups, carbonyl groups (C=O), and carboxyl groups (O–C=O) is 12, 3, and 5, respectively. Furthermore, the nitrogen and sulfur content values in the OM model are relatively low. There are two nitrogen atoms in the forms of pyrrole, and only one sulfur atom is present in thiophene in the OM single-molecular structure (Table 3).
Based on the experimental data of FTIR, 13CNMR, and XPS, the 2D chemical structure of the Shanxi formation shale’s OM was established, as shown in Figure 4. The molecular formula of the constructed OM single model is C177H160N2O8S, and its total molecular weight is 2474. The atomic ratios of O/C, N/C, and S/C of the OM single-molecular model are 0.045, 0.011, and 0.006, respectively, which is close to the experimental data. The 13CNMR data of the estimated OM model were compared with the experimental data in Figure 5. The simulated 13CNMR spectrum fits well with the experimental spectra. It is noteworthy that the molecular model is a statistical average structure of OM since it is obtained based on the statistical average results.
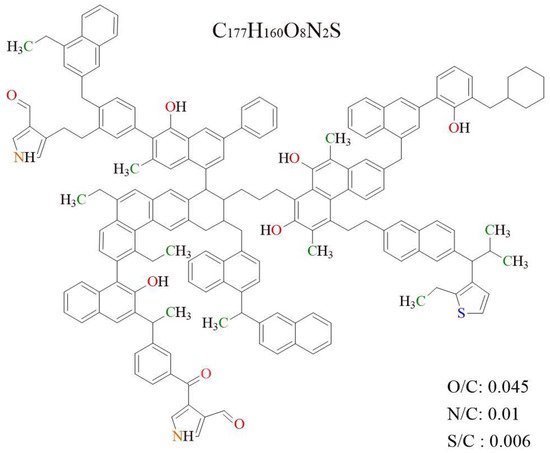
Figure 4.
The 2D OM molecular model in Shanxi formation shale.
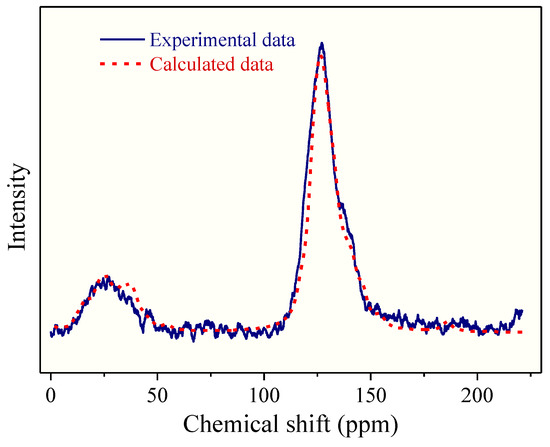
Figure 5.
Comparison between the experimental 13CNMR spectrum and the calculated 13CNMR spectrum based on the reconstructed 2D OM molecule model in Figure 4.
2.3. Construction of 3D Macromolecular Model of OM
Based on geometric optimization of the single 2D OM molecular model, the three-dimensional macromolecule model was reconstructed, combined with helium density experimental data. The validation of the constructed 3D OM model was further checked by the CO2 adsorption data. The number of 2D OM molecules in the 3D model and the dimension of the unit cell can be estimated as follows:
where D is the lattice density, g/cm3, N is the number of 2D OM molecules, M is the single 2D OM molecular weight; L is the side length of the lattice, nm; and NA is the Avogadro constant, 6.02 × 10²³.
D = N × M/(L3 × NA)
Moreover, the density of the 3D OM macromolecular model can be calculated as the following:
DHe = N × M/(L3 − VHe) × NA)
DHe is helium density, g/cm3; and VHe is the free volume using helium as the probe (radius = 0.13 nm), nm3.
The 3D OM macromolecular model is shown Figure 6. The unit cell is the cubic type with a lattice size of 4.35 nm, which consists of 20 OM molecules and contains 6960 atoms (C3540 H3200 N40O160 S20), with a total molecular weight of 49,480.
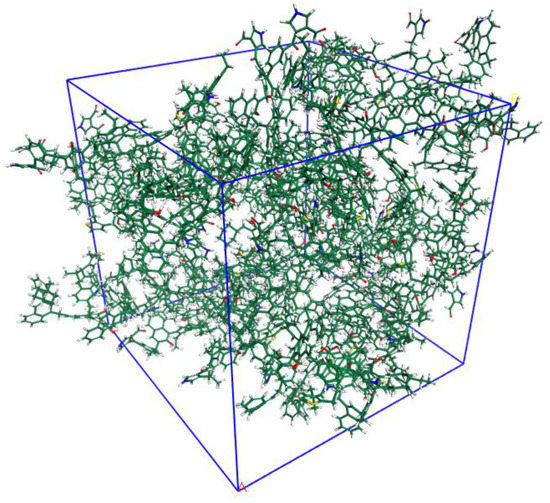
Figure 6.
Three-dimensional OM macromolecular model (C3540 H3200 O160 N40 S20) composed of 6960 atoms in a periodic cubic box (43.5 Å × 43.5Å× 43.5 Å).
The calculated DHe of unit cell is 1.41 g/cm3, which agrees with the experimental result of 1.40–1.42 g/cm3. The micropore volume of the 3D OM model (Figure 7), calculated using Poreblazer with CO2 as the probe, was 0.0308 cm3/g. The micropore volume (pore size less than 1.1 nm) measured by the CO2 adsorption test is 0.0269 cm3/g (Figure 7c,d). The estimated model value is larger than the experimental data in terms of micropores’ volume.
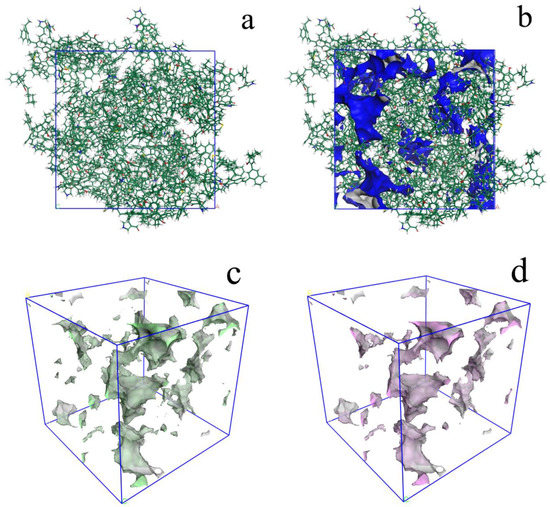
Figure 7.
Micropores in the 3D OM macromolecular model (Probe: CO2): (a) 3D macromolecular model; (b) micropores (<1 nm) in 3D macromolecular model; (c) micropores in 3D macromolecular model; (d) accessible micropores in 3D macromolecular model.
Based on 3D OM macromolecular model, the ultramicropores (less than 1 nm) were reconstructed using CO2 as the probe. These pores are composed of accessible pores and inaccessible pores (Figure 7c,d). The former are open pores, and these can be entered from outside. The latter are closed by the OM molecules. The Figure 7 indicates that the accessible pores are connected in some local space. Thus, these fine, connected pores should be the channels for gas migration during the maturation and hydrocarbon generation of OM.
Figure 8 shows the pore size distribution (PSD) obtained by the CO2 adsorption experiment and calculated from the 3D OM macromolecular model using CO2 as the probe. The shapes of the two curves are very similar with each other and in the range of 4–9 Å. Compared with the calculated results, the experimental result has a narrower size range and weaker PSD peaks. The calculated pore size is within the range of 3.3–10 Å and mainly located between 3 and 7 Å. However, the experimental PSDS was in the range of 4–9 Å and without the data from 3 to 4 Å. This is possible because the pores between 3–4 Å are close to CO2 molecules (3.3 Å), and it is difficult to identify this by the CO2 adsorption experiments. Moreover, the calculated result contains a certain number of inaccessible pores. Based on the above reasons, the experimental pore volume (0.0269 cm3/g) is smaller than the calculated value of the 3D OM macromolecular model (0.0308 cm3/g).
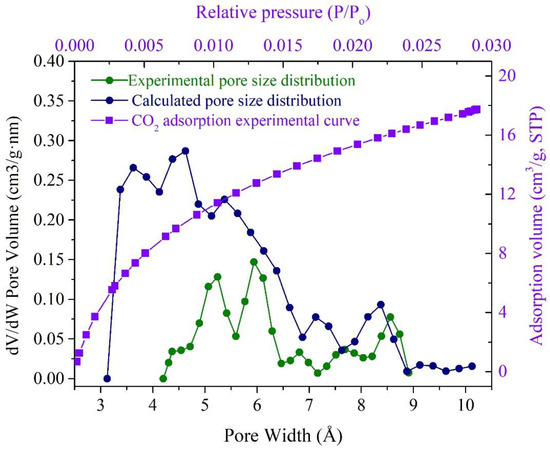
Figure 8.
Comparison of PSDs estimated from the CO2 adsorption and calculated from the 3D OM macromolecular model.
2.4. Pore Structure
OM Pores in the FIB-SEM/HREM Images
The observation results of the FIB-SEM and TEM (Figure 9) show that a large number of OM nanopores are well developed, with a size from several nanometers to tens of nanometers. The OM pores are mostly isolated pores with poor connectivity, which exhibit various shapes from ellipsoid to elongated bubble and irregularly polygon, and ellipsoid is the most common shape (Figure 9a,b).
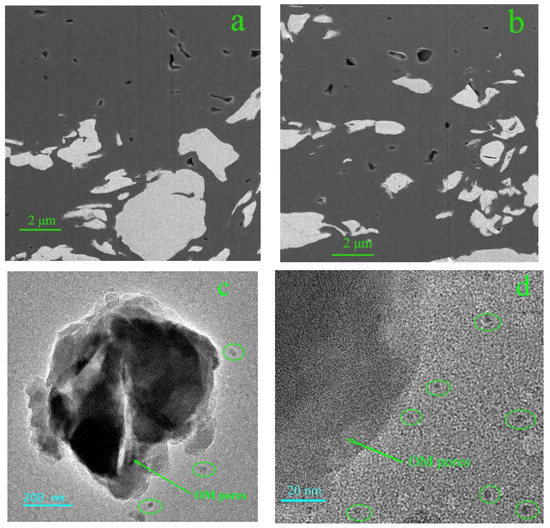
Figure 9.
(a,b) OM pores in the FIB-SEM images; (c,d) OM pores in the TEM images.
The distribution and connectivity of OM pores are the key factors influencing the gas storage and flow capacity of shale. The TEM images (Figure 9c,d) suggest that OM pores less than 10 nm are isolated and unconnected pores as well, which provides space for the gas storage. However, the problem is in determining how the gas is transported in the OM pores and adsorbed on the surface of the OM.
To investigate the connectivity and spatial disposition of OM pores, a 3D OM pore structure model of the selected area was reconstructed based on the treatment of noise reduction and segmentation on 500 sequential FIB-SEM digital images. The size of the 3D OM pore structure model is 9.0 × 9.0 × 9.0 μm, with a revolution of 20 nm (Figure 10). Statistical analysis indicates that OM pore size varies from 22 nm to 350 nm. As the Figure 10c shows, the OM pores (more than 20 nm) are all isolated pores and are randomly distributed in the shale with poor connectivity.
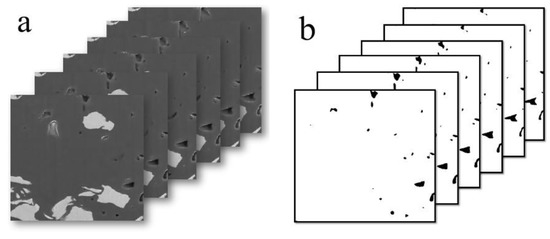
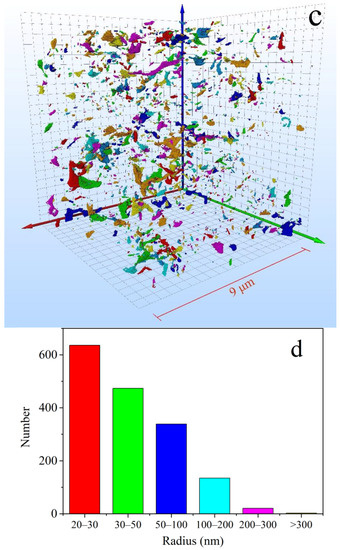
Figure 10.
Three-dimensional OM micropores model reconstructed based on sequent FIB-SEM images. (a) 2D FIB-SEM images; (b) binary FIB-SEM pore image; (c) 3D OM micropores model reconstructed based on sequent FIB-SEM images (9μm×9μm×9μm); (d) pore size distribution of OM pores in the 3D OM micropores mode.
In the process of shale diagenesis, OM macromolecules condense gradually by the combined effect of temperature and pressure. Aliphatic chains and functional groups are shortened and broken to repel hydrocarbons and inorganic gases, resulting in the presence of a large number of nanopores in the macromolecular structure. Although these numerous pores are very fine in size (less than 1 nm), they can act by connecting larger isolated pores and thus become migration channels for gas molecules.
2.5. The Adsorption Capacity of the 3D OM Model
To investigate the methane adsorption capacity of OM micropores, the adsorption quantity of the 3D OM macromolecular model was calculated from 10 kPa up to the final pressure of 8 MPa at 25 °C (Figure 11). In the pressure range of 0–4 MPa, the absolute adsorption of methane increases rapidly from 1.56 cm3/g to 89.8 cm3/g. When the pressure is greater than 4 MPa, the sorption isotherm increases slowly downward and tends to balance, with the largest value of 103 cm3/g at 7 MPa. Considering that the pores in the 3D model are less than 1 nm, methane adsorption in micropores is composed of two forms: gas adsorbed on the surface of pores and gas filling in free volume. The adsorbed phase volume is equal to the pore volume, and the absolute adsorption capacity could be regarded as the adsorption capacity for the pores in the 3D model.
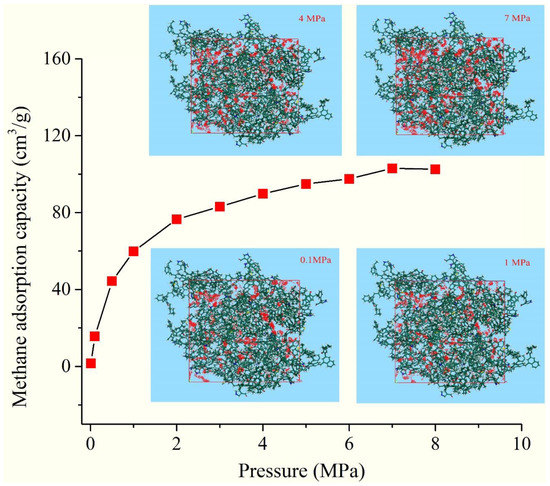
Figure 11.
The methane adsorption isotherm of the 3D macromolecular model.
It was calculated that the values of VL and PL are 165 cm3/g and 1.56 MPa, respectively, indicating the OM pores (≤1 nm) have a huge methane adsorption capacity and lower desorption pressure.
3. Sample and Methods
3.1. OM Isolation
Six black shale samples were collected from the Shanxi formation at the roof of NO. 2 coal under the mine in Guandi Coal Mine of Xishan coalfield (Taiyuan, Shanxi, China). Considering the convenience of extracting OM, a representative OM-rich sample (XS-05) with a TOC value of 20.3% was selected as the study object. The other five samples with TOC contents from 3.2% to 4.8% were abandoned (Table 5). The sample XS-05 was firstly crushed into powder with a size less than 74 μm and then was dried at 60 °C for 8 h. Then, demineralization was performed on the sample using a HCl/HF/HCl acid treatment to remove mineral matters, and the OM sample (XS-05D) was obtained by the steps of washing with distilled water and drying until arriving at constant weight [34].

Table 5.
TOC of shale samples.
3.2. OM Chemical Structure Analysis
The macromolecular structures of the OM sample (XS-05D) were characterized by elemental analysis, 13CNMR, XPS, and FTIR.
3.2.1. Elemental Analysis
The elemental analysis was carried out following the international standards ISO 11722: 2013 and ISO 7404–5: 1984. The contents of C, H, N, and S were detected directly on a Germany Vario EL III elemental analyzer, and the O content was obtained by difference calculation.
3.2.2. 13CNMR Experiment on the OM
Solid-state 13CNMR tests were performed on a Bruker Avance III 600 MHz spectrometer in Institute of Coal Chemistry; Chinese Academy of Sciences, Taiyuan, China, operating at 151.0 MHz with 4 mm MAS probe. CP (cross-polarization) and TOSS (total sideband suppression) techniques were adopted to suppress the sidebands, with a contact time of 5 ms, a magic angle rotation speed of 15 kHz, and a recycle delay time of 3 s.
3.2.3. XPS Experiment on the OM
XPS spectra were generated using an ultra-high vacuum (UHV) system with the surface analysis system (ESCALAB250 Xi, USA) in Taiyuan University of Technology, Taiyuan. The main C1 s peak (284.8 eV) was employed to calibrate the binding energy position. The survey scan was taken at the pass energy of 100 eV with the step size of 1.00 eV, and the narrow high resolution spectra were recorded at the pass energy of 20 eV with the step of 0.05 eV.
3.2.4. FTIR Experiment on the OM
The FTIR measurement of the OM sample was performed using a Bruker Vertex 80v spectrometer in Taiyuan University of Technology, Taiyuan, China. The sample was first mixed with KBr and fully ground in a ratio of 1:200 and then pressed into a slice under 10 MPa for 1 min. The FTIR spectrum was obtained in the frequency range of 4000–400 cm−1, with a resolution of 4 cm−1.
3.3. Characterizing Pore Structure of Samples
The micropore structure of OM was measured with CO2 adsorption. The OM pores were characterized according to size, shape, and number by using the FIB-SEM/TEM.
3.3.1. Gas Adsorption and Helium Density Test Experiments
The CO2 adsorption isotherm of the OM samples was measured on a Micromeritics ASAP 2460 Surface Area and Pore Size Analyzer within a pressure range 0.0001–0.03 at 273 K. The DFT (density functional theory) models were employed to determine the pore structure parameters with CO2 adsorption data.
The density of OM was tested on a Micromeritics AccuPyc II 1340d helium pycnometer following the Chinese national standard GB/T217-2008.
3.3.2. FIB-SEM Observation on Shale Sample
In this study, the sample XS-05 was subjected to OM pore morphology observation using a FEI Helios NanoLab 600i in Tsinghua University, Beijing, China. The raw sample was cut into a cylinder with a diameter of 6 mm and a thickness of 15 mm using the wire-cutting equipment. Then, a smooth section was polished on the cylinder by Ar+ ion beam, which is used to observe the surface topography, and a region of interest was selected to conduct FE-SEM observation. The sample was cemented on the SEM sturm and coated with gold to make the surface electrically conductive before observation. The distribution of OM in shale is heterogeneous. In order to characterize the OM pore structure in shale, an area rich in OM was selected as the target to be milled. Considering the factors of cost and resolution, the cutting area is 20 μm × 17μm.
During the process of milling and scanning, the Ga+ ion beam was maintained perpendicular to the cut surface, while the electron beam was at an angle of 48° from the sample surface. The acceleration voltage for Ga+ was 30 kV, and the beam current was 2.5 nA. The sample surface was milled by the ion beam as thin as 20 nm to expose subsurface features, and the electron beam scanned and imaged the subsurface of the sample. By the continuous and repeated milling and imaging, a series of SEM images was obtained with a resolution of 19.5 nm.
3.3.3. TEM Observation on OM Sample
The TEM experiment was employed to identify the OM pores within the shale sample that were less than 10 nm. The TEM images were obtained on a JEM-200F TEM in Taiyuan University of Technology, Taiyuan, China at 200 kV. Before the observation, the fine-powder OM sample was dispersed in ethanol by ultrasonic wave and sprayed over a copper micro-grid.
4. Conclusions
In this research, a comprehensive study combined the experimental and computational method to perform an investigation of the molecular structure and micropore structure of OM in Shanxi formation shale, and the methane adsorption capacity of OM was discussed as well.
The results of the elemental analysis show that the OM in the black Shanxi formation shale is rich in carbon and poor in hydrogen, with a small amount of oxygen, indicating the OM belongs to the type III kerogen. The atomic ratios of H/C, O/C, N/C, and S/C are about 0.51, 0.047, 0.012, and 0.009, respectively.
The peak fitting of 13CNMR and XPS spectra suggests the aromaticity of OM is 75.57%, and the ratio of aromatic bridge carbon to aromatic peripheral carbon is 0.196, from which it can be inferred that the aromatic structural unit of OM is mainly composed of the naphthalenes. The most oxygen-containing groups are the ether group (C–O), accounting for 60.70%, followed by the carbonyl group (COO-) and carboxyl group (C=O), with proportions of 24.5% and 14.50, respectively. The nitrogen is present mainly in forms of pyridine and pyrrole, and their ratio is about 2.8:1. The sulfur-containing functional groups mainly consist of thiophenes and sulphoxides, with a ratio of 3:2.
With the chemical structural parameter obtained from experiments, the average 2D OM molecular structure was established and defined as C177H160O8N2S with a molar weight of 2474. Based on the 2D model, the 3D OM macromolecular model was reconstructed and optimized with the data of the helium density test and low-pressure CO2 adsorption experiment. The 3D OM macromolecular model contains 20 2D models with a helium density of 1.41 g/cm3. The pores in the 3D model varied from 3 Å to 10 Å, with pores in 3–7 Å being the dominant pores.
The 3D OM micropores model was built with FIB-SEM images and suggests that the OM pore size varied from 20 nm to 350 nm, and the OM pores in TEM were less than 10 nm. Both of them are isolated pores with poor connectivity. Gas diffusion in OM is mainly conducted in pores less than 1 nm.
The methane adsorption simulation results indicate that the methane adsorption capacity of the 3D OM macromolecular model increases with the increase of pressure in the range of 1–4 MPa. When the pressure is more than 4 MPa, the increment of methane adsorption capacity gradually slows down and tends toward saturation. The maximum methane adsorption capacity of the 3D macromolecular model can reach 165.8 cm3/g, indicating that OM pores less than 1 nm have a stronger methane adsorption capacity than pores of other sizes.
Author Contributions
K.L.: Conceptualization, Methodology, Writing—Original Draf; H.T. and W.G.: Visualization, simulation, Data Curation; Y.L.: Expriments, Writing—Review & Editing; Y.Z.: Data Curation, Formal analysis; Y.M.: Validation and Investigation; S.K.: Project administration, Supervision. All authors have read and agreed to the published version of the manuscript.
Funding
Shanxi Province Science Foundation for General Projects (Grant No. 20210302123426); the Special Subsidy for Postdoctoral of Shanxi Province; Opening Fund of Key Laboratory of Coal Science and Technology (Taiyuan University of Technology), Ministry of Education (Grant No. MKX202104).
Institutional Review Board Statement
Not applicable.
Informed Consent Statement
Not applicable.
Data Availability Statement
Not applicable.
Acknowledgments
This study is financially supported by the Shanxi Province Science Foundation for General Projects (Grant No. 20210302123426); the Special Subsidy for Postdoctoral of Shanxi Province; Opening Fund of Key Laboratory of Coal Science and Technology (Taiyuan University of Technology), Ministry of Education (Grant No. MKX202104). Shanxi Provincial Department of Education’s 2022 Scientific and Technological Innovation Plan for Colleges and Universities in Shanxi Province-ProjectNo.: 2022L055; Shanxi Science and Technology Department’s 2022 Basic Research Plan (Free Exploration)-ProjectNo.: 20220302122099. All the editors and anonymous reviewers are gratefully acknowledged.
Conflicts of Interest
The authors declared no potential conflicts of interest with respect to the research, authorship and publication of this article.
References
- National Energy Administration. China Natural Gas Development Report (2022) [EB/OL]. Available online: http://www.nea.gov.cn/2022-08/19/c_1310654101.htm (accessed on 19 August 2022).
- National Development and Reform Commission, National Energy Administration. Notice on Printing and Distributing the “14th Five-Year Plan” of Modern Energy System [EB/OL]. Available online: http://zfxxgk.nea.gov.cn/2022-01/29/c_1310524241.htm (accessed on 29 January 2022).
- Zou, C.; Dong, D.; Wang, Y.; Li, X.; Huang, J.; Wang, S.; Guan, Q.; Zhang, C.; Wang, H.; Liu, H.; et al. Shale gas in China: Characteristics, challenges and prospects (I). Petroleum Explor. Dev. 2015, 42, 753–767. [Google Scholar] [CrossRef]
- Zou, C.N.; Yang, Z.; Huang, S.P.; Ma, F.; Sun, Q.P.; Li, F.H.; Pan, S.Q.; Tian, W.G. Resource types, formation, distribution and prospects of coal-measure gas. Pet. Explor. Dev. 2019, 46, 451–462. [Google Scholar] [CrossRef]
- Liang, J.; Huang, W.; Wang, H.; Blum, M.J.; Chen, J.; Wei, X.; Yang, G. Organic geochemical and petrophysical characteristics of transitional coal-measure shale gas reservoirs and their relationships with sedimentary environments: A case study from the Carbon-iferous-Permian Qinshui Basin, China. J. Pet. Sci. Eng. 2020, 184, 106510. [Google Scholar] [CrossRef]
- Zou, C.; Dong, D.; Wang, S.; Li, J.; Li, X.; Wang, Y.; Li, D.; Cheng, K. Geological characteristics and resource potential of shale gas in China. Pet. Explor. Dev. 2010, 37, 641–653. [Google Scholar] [CrossRef]
- Craddock, P.R.; Prange, M.D.; Pomerantz, A.E. Kerogen thermal maturity and content of organic-rich mudrocks determined using stochastic linear regression models applied to diffuse reflectance IR Fourier transform spectroscopy (DRIFTS). Org. Geochem. 2017, 110, 122–133. [Google Scholar] [CrossRef]
- Furmann, A.; Mastalerz, M.; Schimmelmann, A.; Pedersen, P.K.; Bish, D. Relationships between porosity, organic matter, and mineral matter in mature organic-rich marine mudstones of the Belle Fourche and Second White Specks formations in Alberta, Canada. Mar. Pet. Geol. 2014, 54, 65–81. [Google Scholar] [CrossRef]
- Groen, J.C.; Peffer, L.A.A.; Pérez-Ramírez, J. Pore size determination in modified micro- and mesoporous materials. Pitfalls and limitations in gas adsorption data analysis. Microporous Mesoporous Mater. 2003, 60, 1–17. [Google Scholar] [CrossRef]
- Li, K.; Kong, S.; Xia, P.; Wang, X. Microstructural characterisation of organic matter pores in coal-measure shale. Adv. Geo-Energy Res. 2020, 4, 372–391. [Google Scholar] [CrossRef]
- Gao, Z.; Fan, Y.; Xuan, Q.; Zheng, G. A review of shale pore structure evolution characteristics with increasing thermal maturities. Adv. Geo-Energy Res. 2020, 4, 247–259. [Google Scholar] [CrossRef]
- Li, Z.; Oyediran, I.A.; Huang, R.; Hu, F.; Du, T.; Hu, R.; Li, X. Study on pore structure characteristics of marine and continental shale in China. J. Nat. Gas Sci. Eng. 2016, 33, 143–152. [Google Scholar] [CrossRef]
- Zhang, Y.; Shao, D.; Yan, J.; Jia, X.; Li, Y.; Yu, P.; Zhang, T. The pore size distribution and its relationship with shale gas capacity in organic-rich mudstone of Wufeng-Longmaxi Formations, Sichuan Basin, China. J. Nat. Gas Geosci. 2016, 1, 213–220. [Google Scholar] [CrossRef]
- Sun, M.; Yu, B.; Hu, Q.; Chen, S.; Xia, W.; Ye, R. Nanoscale pore characteristics of the Lower Cambrian Niutitang Formation Shale: A case study from Well Yuke #1 in the Southeast of Chongqing, China. Int. J. Coal Geol. 2016, 154–155, 16–29. [Google Scholar] [CrossRef]
- Shao, X.H.; Pang, X.Q.; Li, Q.W.; Wang, P.W.; Chen, D.; Shen, W.B.; Zhao, Z.F. Pore structure and fractal characteristics of organic-rich shales: A case study of the lower Silurian Longmaxi shales in the Sichuan Basin, SW China. Mar. Pet. Geol. 2017, 80, 192–202. [Google Scholar] [CrossRef]
- Yin, L.; Guo, S. Full-Sized Pore Structure and Fractal Characteristics of Marine-Continental Transitional Shale: A Case Study in Qinshui Basin, North China. Acta Geol. Sin. Engl. Ed. 2019, 93, 675–691. [Google Scholar] [CrossRef]
- Zhao, Y.; Wang, S.; Liu, Y.; Song, X.; Chen, H.; Zhang, X.; Lin, Y.; Wang, X. Molecular Modeling and Reactivity of Thermally Altered Coals by Molecular Simulation Techniques. Energy Fuels 2021, 35, 15663–15674. [Google Scholar] [CrossRef]
- Xu, F.; Pan, S.; Liu, C.; Zhao, D.; Liu, H.; Wang, Q.; Liu, Y. Construction and evaluation of chemical structure model of Huolinhe lignite using molecular modeling. RSC Adv. 2017, 7, 41512–41519. [Google Scholar] [CrossRef]
- Ungerer, P.; Collell, J.; Yiannourakou, M. Molecular Modeling of the Volumetric and Thermodynamic Properties of Kerogen: Influence of Organic Type and Maturity. Energy Fuels 2014, 29, 91–105. [Google Scholar] [CrossRef]
- Lin, H.; Lian, J.; Liu, Y.; Xue, Y.; Yan, S.; Han, S.; Wei, W. Comprehensive study of structure model, pyrolysis and liquefaction behaviour of Heidaigou lignite and its liquefied oil. Fuel 2019, 240, 84–91. [Google Scholar] [CrossRef]
- Wang, J.; He, Y.; Li, H.; Yu, J.; Xie, W.; Wei, H. The molecular structure of Inner Mongolia lignite utilizing XRD, solid state 13C NMR, HRTEM and XPS techniques. Fuel 2017, 203, 764–773. [Google Scholar] [CrossRef]
- Wang, C.; Zeng, F. Molecular Structure Characterization of CS2–NMP Extract and Residue for Malan Bituminous Coal via Solid-State 13C NMR, FTIR, XPS, XRD, and CAMD Techniques. Energy Fuels 2020, 34, 12142–12157. [Google Scholar] [CrossRef]
- Wang, J.; Tian, L.; Li, G.; Zhao, X.; Liang, Y.; Yu, J. Construction of vitrinite molecular structures based on 13C NMR and FT-IR analysis: Fundamental insight into coal thermoplastic properties. Fuel 2021, 300, 120981. [Google Scholar] [CrossRef]
- Ping, A.; Xia, W.; Peng, Y.; Xie, G. Construction of bituminous coal vitrinite and inertinite molecular assisted by 13C NMR, FTIR and XPS. J. Mol. Struct. 2020, 1222, 128959. [Google Scholar] [CrossRef]
- Zhang, Y.; Hu, S.; Zhong, Q.; Zhuo, J.; Mathews, J.P. A large-scale molecular model of Fenghuangshan anthracite coal. Fuel 2021, 295, 120616. [Google Scholar] [CrossRef]
- Zhang, Z.; Kang, Q.; Wei, S.; Yun, T.; Yan, G.; Yan, K. Large Scale Molecular Model Construction of Xishan Bituminous Coal. Energy Fuels 2017, 31, 1310–1317. [Google Scholar] [CrossRef]
- Lu, Y.; Feng, L.; Jiang, X.; Zhao, Y.; Zhao, G.; Yuan, C. Construction of a molecular structure model of mild-oxidized Chinese lignite using Gaussian09 based on data from FTIR, solid state (13)C-NMR. J. Mol. Model. 2018, 24, 135. [Google Scholar] [CrossRef]
- Machnikowska, H.; Krztoń, A.; Machnikowski, J. The characterization of coal macerals by diffuse reflectance infrared spectroscopy. Fuel 2002, 81, 245–252. [Google Scholar] [CrossRef]
- Alstadt, K.N.; Katti, D.R.; Katti, K.S. An in situ FTIR step-scan photoacoustic investigation of kerogen and minerals in oil shale. Spectrochim. Acta Part A Mol. Biomol. Spectrosc. 2012, 89, 105–113. [Google Scholar] [CrossRef]
- Kelemen, S.R.; Afeworki, M.; Gorbaty, M.L.; Sansone, M.; Kwiatek, P.J.; Walters, C.C.; Freund, H.; Siskin, M.; Bence, A.E.; Curry, D.J.; et al. Direct Characterization of Kerogen by X-ray and Sol-id-State 13C Nuclear Magnetic Resonance Methods. Medium X Size 2008, 21, 1548–1561. [Google Scholar]
- Kozłowski, M. XPS study of reductively and non-reductively modified coals. Fuel 2004, 83, 259–265. [Google Scholar] [CrossRef]
- Bian, J.; Li, X.; Zeng, F.; Wang, X. Construction and Evaluation of a Medium-Rank Coal Molecular Model Using a Hybrid Experi-mental–Simulation–Theoretical Method. Energy Fuels 2019, 33, 12905–12915. [Google Scholar] [CrossRef]
- Mathews, J.P.; Chaffee, A.L. The molecular representations of coal—A review. Fuel 2012, 96, 1–14. [Google Scholar] [CrossRef]
- Liu, Y.; Liu, S.; Zhang, R.; Zhang, Y. The molecular model of Marcellus shale kerogen: Experimental characterization and structure reconstruction. Int. J. Coal Geol. 2021, 246, 103833. [Google Scholar] [CrossRef]
Disclaimer/Publisher’s Note: The statements, opinions and data contained in all publications are solely those of the individual author(s) and contributor(s) and not of MDPI and/or the editor(s). MDPI and/or the editor(s) disclaim responsibility for any injury to people or property resulting from any ideas, methods, instructions or products referred to in the content. |
© 2023 by the authors. Licensee MDPI, Basel, Switzerland. This article is an open access article distributed under the terms and conditions of the Creative Commons Attribution (CC BY) license (https://creativecommons.org/licenses/by/4.0/).
