Abstract
Lysimachia foenum-graecum Hance (Primulaceae) is a medicinal plant used for cold, pain, ascariasis, etc., in China. Triterpenoid saponins have been found to be the main components of this genus. In this work, a pair of oleanane-type triterpenoid saponins with an unprecedented 4/5/6 fused tricyclic skeleton, foegraecumoside O (1) and foegraecumoside P (2) were isolated from the butanol fraction of the aerial parts of L. foenum-graecum. Their structures were determined using chemical methods and extensive spectroscopic analyses, along with quantum chemical calculations. Compound 2 displayed moderate cytotoxicity against HepG2, MGC-803, T24, NCI-H460, A549, and A549/CDDP (drug-resistant lung-cancer cell line) with IC50 at 12.4–19.2 μM in an MTT assay, comparing with the positive control doxorubicin, which had IC50 at 0.53–4.92 μM, but was inactive for A549/CDDP. Furthermore, a possible biosynthetic pathway for forming compounds 1 and 2 was proposed.
1. Introduction
There is a long history of human beings fighting with cancer [1]. After the development and application of multiple generations of anticancer drugs, drug resistance was gradually produced, due to which the effects of anticancer drugs declined progressively. Therefore, there is always need to develop new potential therapeutic molecules, especially those molecules that are active against drug-resistant cancers [2,3].
The Lysimachia genus (Primulaceae) comprises approximately 180 species that are widespread in temperate and subtropical regions, 138 of which can be found in China [4]. Lysimachia foenum-graecum Hance is a species that is distributed mainly in the Guangxi Zhuang Autonomous Region and the Guangdong, Hunan, and Yunnan Provinces of China [4]. It is famous due to its pleasant smell after drying; therefore, it is commonly used as perfumery material. The aerial parts of this plant have been used for the treatment of colds, headaches, sore throats, toothaches, abdominal pain, ascariasis, and other diseases in traditional Chinese medicine [5]. Previous studies indicated that triterpenoid saponins are the main chemical constituents of this genus, and many of them were found to be cytotoxic [6,7,8,9,10,11,12]. Among them, our group has contributed to the discoveries of new components from L. clethroides, L. fortune, and L. foenum-graecum [8,10,11,12]. In previous phytochemistry investigation, many triterpenoid saponins and a few flavonoids have been isolated from L. foenum-graecum [10,12,13,14,15,16,17]. Some reported saponins were found to possess a cytotoxic property against cancer cell lines, including NCI-H460, MGC-803, HepG2, T24, A549, and A549/CDDP. [10,12,13].
In terms of exploring the more active natural molecules from this genus, a pair of novel compounds, foegraecumoside O (1) and foegraecumoside P (2), featuring unique 4/5/6 fused tricyclic skeletons linked between C-18 and C-30, were purified and identified from L. foenum-graecu (Figure 1). Based on the presence of the chiral center at C-30, which makes the two compounds different, quantum chemical calculations were performed to simulate the theoretical NMR data of the optical isomers. Thereafter, the absolute configurations of the isomers were able to be determined. Herein, the isolation, structural characterization, inhibitory effect on the growth of tumor cells, and proposed biosynthesis of these two molecules were discussed.
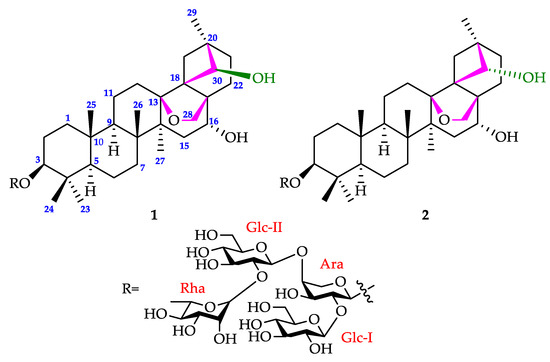
Figure 1.
Chemical structures of compounds 1 and 2.
2. Results
2.1. Structure Elucidation
The aerial parts of L. foenum-graecum were extracted by 95% EtOH. Then, the obtained crude was suspended in water and extracted with EtOAc and n-BuOH, successively. Two compounds, 1 and 2 (Figure 1), were isolated through multiple chromatography columns from the BuOH fraction and then purified using reverse-phase HPLC.
As a white, amorphous powder, compound 1 owned a negative optical rotation in MeOH, [α − 11.3 (c 0.1, MeOH). Its molecular formula was determined to be C53H86O22 via HR-ESI-MS (m/z 1097.5496 [M + Na]+, calculated for 1097.5503) (Figure S2). Absorbances (cm−1) at 3436 (OH), 1075 (C-O-C), and 2940 (CH3, CH2, and CH) were noted in the IR spectrum. In the 1H NMR spectrum (pyridine-d5, 500 MHz) (Table 1, Figures S3–S6), six tertiary methyls at δH 0.80, 0.98, 1.13, 1.23, 1.38, and 1.50, and a pair of geminal protons at δH 3.83 and 3.69 (each 1H, d, J = 8.0 Hz) were observed, which correlated with six methyl carbon resonances at δC 16.3, 16.4, 28.0, 21.3, 18.3, and 19.1, respectively, and an oxygenated methylene at δC 76.4 in HSQC (Figures S14–S16). In addition, a quaternary carbon resonance occurred at δC 88.9 in 13C NMR (Figures S7–S10). All these data were similar to 13,28-epoxyoleanane skeleton, except for the absence of a tertiary methyl [8]. An oxymethine, with a carbon at δC 81.0 and correlated with a proton at δH 4.55 in HSQC, was assigned to C-30 by the HMBC correlation of δH 4.55 with C-17 (δC 49.6), and correlations of δC 81.0 with H3-29 (δH 1.23), Ha-19 (3.38), and Ha-21 (2.37), indicative of the presence of a 4/5/6 fused tricyclic skeleton formed through the linkage of C-18 and C-30 (Figure 2). Moreover, two other oxymethine protons were observed at δH 3.10 (dd, J = 11.5, 4.0 Hz) and 4.15 (overlapped). The peak at δH 3.10 was confirmed to be located at H-3 through the heteronuclear correlations of its carbon at δC 89.1 with H3-23 (δH 1.13) and H3-24 (δH 0.98). Another proton at δH 4.15 was assigned to H-16 because of the COSY correlations with H-15 (δH 2.33 and 1.55) and the HMBC correlations with C-14 (δC 46.1) and C-17 (δC 49.6) (Figures S11–S19). In the NOESY spectrum, the cross peaks of H-3 (δH 3.10)/H-5 (δH 0.60) indicated the α-orientation of H-3, whereas the cross peaks of H-16 (δH 4.15) and H-28b (δH 3.69) confirmed the β-orientation of H-16. Moreover, the NOESY correlation between H-30 (δH 4.55) and H-28a (δH 3.83) indicated the configuration of H-30 as α-orientated (Figure 2 and Figures S20 and S21). Accordingly, the aglycone of compound 1 was defined as 3β,16α,30β-trihydroxy-13β, 28-epoxy-18,30-cyclo-oleanane.

Table 1.
1H and 13C NMR spectroscopic data of compounds 1 and 2.
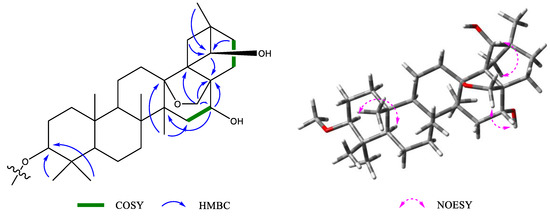
Figure 2.
The key COSY, HMBC, and NOESY correlations of compound 1.
The 1H NMR of 1 exhibited signals of four sugar anomeric protons at δH 4.94 (1H, br s), 5.34 (1H, d, J = 8.0 Hz), 5.21 (1H, d, J = 7.5 Hz), and 6.39 (1H, br s), which correlated to four anomeric carbons at δC 104.3, 105.4, 103.1, and 101.5, respectively, in the HSQC spectrum. After acid hydrolysis, derivatization of standard sugars and products, and HPLC analysis with an optical detector, the sugar moieties were proved to be L-arabinose, D-glucose, and L-rhamnose with a ratio of 1:2:1 [10,18]. The HMBC spectrum exhibited the correlation between H-3 (δH 3.10) with Ara-C-1 (δC 104.3). Ara-H-2 (δH 4.54) correlated with Glc-C-1 (δC 105.4). Although long-range heteronuclear coupling between Ara and Glc-II is too weak to observe in HMBC, the cross peak of Glc-II-H-I (δH 5.21) and Ara-H-4 (δH 4.56) was observed in NOESY, which can also prove the location of Glc-II. Furthermore, Glc-II-H-2 (δH 4.26) showed a correlation with Rha-C-1 (δC 101.5) in HMBC. Thereby, the sequence of the sugar chain composed of the four sugar units was determined as shown in Figure 1, which is the same as what appeared in the previous reports [8,10,11]. The relative configurations of anomeric protons of two glucoses at δH 5.34 (Glc I) and 5.21 (Glc II) were determined as β based on their coupling constants (8.0 Hz and 7.5 Hz, respectively). The arabinose unit was identified to be the α-anomer according to the correlations of Ara-H-1 (δH 4.94) with Ara-H-3 (δH 4.49) and Ara-H-5b (δH 3.78) respectively in the NOESY spectrum. Furthermore, Rha-H-1 (δH 6.39) correlated with Rha-H-2 (δH 4.71) and confirmed the α-anomeric orientation of the rhamnopyranose unit. Hence, compound 1 was elucidated as shown in Figure 1.
Compound 2, with a negative optical rotation in MeOH, [α − 11.3 (c 0.1, MeOH), was purified as a white amorphous powder. It was deduced to have an identical molecular formula to that of compound 1 according to its HR-ESI-MS data (Figure S19). The IR spectrum displayed absorptions at 3426 (OH), 2940 (CH3, CH2, and CH), at 1075 (C-O-C) cm−1. The 1H and 13C NMR data of compound 2 closely resembled those of compound 1 (Table 1, Figures S24–S30), indicating that these two compounds are structurally similar. Comprehensive comparisons of their 2D NMR spectra (Figures S31–S41) suggested that the structure of compound 2 is practically same to that of compound 1, except for the configuration of H-30, which was confirmed as β-orientated through the correlation of H-30 (δH 3.96) with H2-12 (δH 1.73, 1.85) and H-29 (δH 1.18) observed in the NOESY spectrum of compound 2 (Figure 3). Thus, compound 2 was proved as shown in Figure 1. NMR data of compounds 1 and 2 are assigned in Table 1.
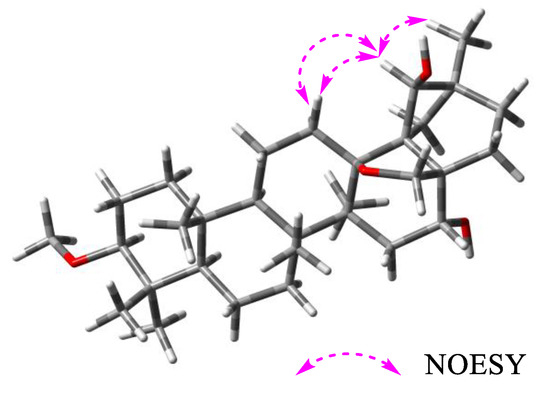
Figure 3.
Key NOESY correlations of compound 2.
2.2. NMR Calculation
To further verify the configuration of the hydroxy at C-30, a quantum chemical calculation of the 1H NMR and 13C NMR chemical shifts for the aglycones of compounds 1 and 2 was conducted using the gauge-including atomic orbitals (GIAO) method at the mPW1PW91/6-311+G (2d, p) in pyridine with the IEFPCM model [19,20]. As shown in Figure 4, as well as Tables S1 and S3, the experimental 13C NMR values of the aglycone of compound 1 has an R2 (coefficient of determination) of 0.9917 with theoretical values of the aglycone of compound 1 (Figure 4A) but had one of 0.9845 with the aglycone of compound 2 (Figure 4B). Similarly, the experimental 13C NMR values of the aglycone of compound 2 had an R2 of 0.9914 with theoretical values of the aglycone of compound 2 (Figure 4D) but had one of 0.9818 with the aglycone of 1 (Figure 4C). The linear regression fitting of 1H NMR (Figure 5, Tables S2 and S3) displayed that the experimental 1H NMR data of the aglycone of compound 1 owns an R2 of 0.9451 (Figure 5A) but had one of 0.8604 with the aglycone of compound 2 (Figure 5B). Likewise, the experimental 1H NMR values of the aglycone of compound 2 had an R2 of 0.9588, with theoretical values of the aglycone of compound 2 (Figure 5D) but had one of 0.8719 with the aglycone of compound 1 (Figure 5C). It is therefore concluded that the calculated 1H NMR and 13C NMR chemical shifts for the aglycones of compounds 1 and 2 showed a better agreement with the experimental values with a higher correlation coefficient. Consequently, structures of compounds 1 and 2 were further confirmed.
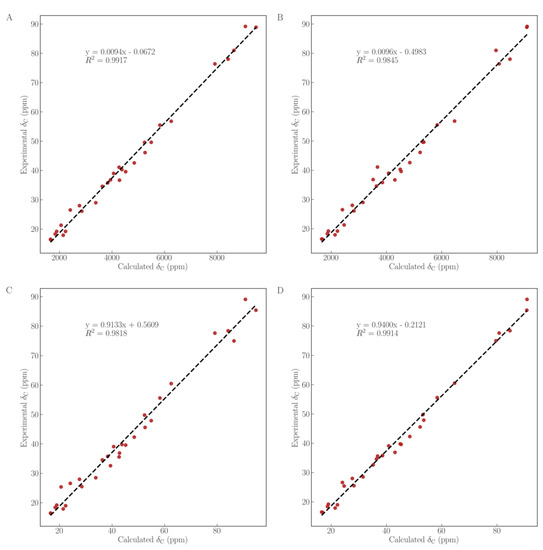
Figure 4.
Linear regression fitting of computed 13C NMR chemical shifts of compounds 1 (A,C) and 2 (B,D), with experimental values of compounds 1 (A,B) and 2 (C,D).
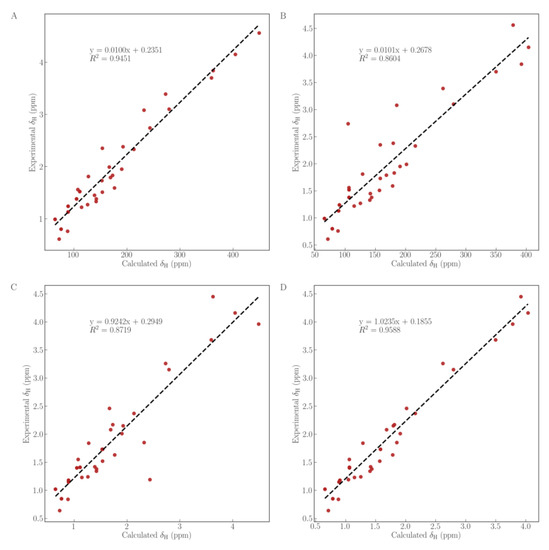
Figure 5.
Linear regression fitting of computed 1H NMR chemical shifts of compounds 1 (A,C) and 2 (B,D), with experimental values of compounds 1 (A,B) and 2 (C,D).
2.3. Cytotoxicity Assay
Compounds 1 and 2 were evaluated for their cytotoxic activities against five human cancer cell lines in vitro using the MTT method with doxorubicin as the positive control (Table 2). Compound 2 showed moderate cytotoxicities against NCI-H460, MGC-803, HepG2, and T24, with IC50 values of 18.4, 12.4, 19.2, and 15.0 μM, respectively. Furthermore, compound 2 was tested on drug-sensitive and drug-resistant lung-cancer cell lines (A549 and A549/CDDP, respectively), and it displayed moderate cytotoxicity against A549/CDDP, with an IC50 value of 16.0 μM and a resistance factor (RF) of 0.94 (Table 3).

Table 2.
Cytotoxic activities of compounds 1 and 2 on five cell lines.

Table 3.
Cytotoxicity of compound 2 on A549 and A549/CDDP cells.
2.4. Biosynthetic Pathway
The biosynthetic pathway of compounds 1 and 2 was postulated as shown in Scheme 1. Firstly, the five-carbon building blocks, 3-isopentenyl pyrophosphate (IPP) and dimethylallyl pyrophosphate (DMAPP), were synthesized using the 2-C-methyl-D-erythritol 4-phosphate (MEP) or mevalonic acid (MVA) pathways [21]. Then, six building blocks were condensed to form C30 squalene, which is the precursor of all triterpenoids in eukaryotes. Subsequently, the linear squalene was epoxidized to 2,3-oxidosqualene. The 2,3-oxidosqualene was cyclized to the pentacyclic oleanane-type triterpenoid backbone β-amyrin by the β-amyrin synthase (β-AS). Furtherly oxidization of the β-amyrin by CYP450s introduced an oxygen atom into the specific site of their substrates to primarily form hydroxyl, carboxyl, or epoxy groups [22]. Finally, these molecules were glycosylated to triterpenoid saponins via UDP-dependent glycosyltransferase (UGTs) [23].
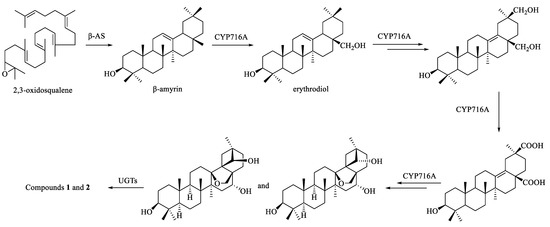
Scheme 1.
Hypothetical biogenetic pathway for compounds 1 and 2.
3. Discussion
Triterpenoids and their saponins play an important role in natural product chemistry. Among them, the oleanane-type skeleton is a classical pentacyclic skeleton and commonly exists in many families, such as Araliaceae [24], Fabaceae [25], Campanulaceae [26], Polygalaceae [27], etc. In the previous phytochemical investigation of the Primulaceae family, it was found that oleanane-type skeletons, especially 13,28-epoxyoleanane skeletons, were the general feature of the main components of this family [28]. As a genus from the Primulaceae family, many oleanane-type triterpenoid saponins, more than half of which having beard 13,28-epoxyoleanane skeletons, have been isolated from the Lysimachia genus [6,7,8,9,10,11,12,13,14,15]. In this work, two epimers featuring a unique 4/5/6 fused tricyclic skeleton linked between C-18 and C-30 were isolated from L. foenum-graecu. This is the first example of this novel skeleton within the large family of oleanane-type triterpenoids. Therefore, it is an important discovery for the chemical diversity of triterpenoids.
As a pair of epimers with different configurations of 30-OH, compounds 1 and 2 displayed high stereoselectivity against cancer cell lines. Compound 2, with 30α-OH, was active against several cancer cell lines, including the drug-resistant lung-cancer cell line A549/CDDP. Whereas compound 1 with 30α-OH was proven to be inactive against all those tested cell lines. Meanwhile, with an RF of 0.94, compound 2 displayed a similar inhibitory effect against normal lung-cancer cells and drug-resistant lung-cancer cells, showing its potential to be a new approach for drug resistance. The results provide a potential lead compound for further investigation in treating diseases related to cancer and drug resistance to cancer.
4. Materials and Methods
4.1. General Experimental Procedures
A PerkinElmer model 341 polarimeter was used to record optical rotations. A Thermo-Scientific Exactive mass spectrometer was used to carry out HR-ESI-MS spectrum. A PerkinElmer Spectrum Two FT-IR spectrometer was used to obtain IR spectra. The 1D and 2D NMR spectra were performed on Bruker AV-500 or AV-600 MHz spectrometers in deuterated pyridine. Chemical shifts (δ) were reported in ppm relative to the solvent signals, and coupling constants (J) were calculated and reported in Hz. A Shimadzu LC-6AD HPLC with an RID-10A detector and an YMC-Pack ODS-A column (250 mm × 20 mm, 5 μm) was used to perform purification of two compounds. A Jasco LC-4000 Analytical HPLC was used to analyze extracts, fractions, and semipure samples. Different materials, including silica gel (200–300 mesh, Qingdao Marine Chemical Factory, Qingdao, China), MCI gel (CHP20, 75–150 μm, Mitsubishi Chemical Corporation, Tokyo, Japan), and ODS (50 μm, YMC, Kyoto, Japan), were used for column chromatography (CC) for isolation of pure compounds. Precoated silica gel GF254 plates (Qingdao Marine Chemical Factory) were used for TLC analysis. Spots were detected on TLC by observing them under UV light and then heating after spraying with 10% H2SO4 in EtOH. Solvents used for extraction and chromatography column were all analytical grade and manufactured by Xilong Scientific, Shantou, China. HPLC-grade methanol and acetonitrile were manufactured by Tedia, Plzen, Czech Republic.
4.2. Plant Material
The aerial parts of L. foenum-graecum were collected in Jinxiu, Guangxi Zhuang Autonomous Region, People’s Republic of China. Shaoqing Tang from Guangxi Normal University authenticated the species. A voucher specimen (NO. LF-2014022) was deposited in the archive of the State Key Laboratory for Chemistry and Molecular Engineering of Medicinal Resources, School of Chemistry and Pharmaceutical Sciences, Guangxi Normal University, Guilin, China.
4.3. Extraction and Isolation
The dry aerial parts of L. foenum-graecum (14.7 kg) were extracted with 95% aqueous EtOH at reflux (3 × 3 h × 75 L). After evaporation under a vacuum (45 °C in water bath), the obtained crude extract (1.6 kg) was suspended in water and extracted with EtOAc and n-BuOH, successively. The n-BuOH fraction was subjected to microporous resin CC eluting with aqueous ethanol (20%, 50%, 70%, and 95%, v/v). Subsequently, the fraction from 70% EtOH (228 g) was fractionated with silica gel CC eluting with a gradient of CH2Cl2-MeOH (10:1→0:1, v/v) to afford six fractions (A–F). Fraction E (92.8 g) was further separated by MCI gel CC with a MeOH-H2O gradient elution system (50:50→100:0, v/v) to obtain 10 subfractions (E1–E10). E6 (3.5 g) was chromatographed over RP-C18 CC eluting with MeOH:H2O (50:50→65:35, v/v, then MeOH) to yield E6-1 to E6-11. E6-7 (142.7 mg) was applied on a preparative HPLC (CH3CN-H2O, 29:71, v/v, at 8 mL/min) to obtain compounds 1 (16.8 mg, 38.1 min) and 2 (4.0 mg, 31.0 min).
Foegraecumoside O (1): Amorphous powder, − 11.3 (c 0.1, MeOH); IR (KBr) νmax 3436, 2940, 1637, 1449, 1393, 1075, 606 cm−1; 1H NMR and 13C NMR data, see Table 1; HR-ESI-MS m/z 1097.5496 [M + Na]+ (calculated for C53H86O22Na, 1097.5508).
Foegraecumoside P (2): Amorphous powder, − 11.3 (c 0.1, MeOH); IR (KBr) νmax 3426, 2940, 1637, 1393, 1075, 615 cm−1; 1H NMR and 13C NMR data, see Table 1; HR-ESI-MS m/z 1097.5493 [M + Na]+ (calculated for C53H86O22Na, 1097.5508).
4.4. Acid Hydrolysis
Each compound (2 mg) was dissolved in 1 M HCl (1,4-dioxane-H2O, 1:1, 5 mL; Xilong Scientific, Shantou, China) and then stirred at 80 °C for 8 h. The reaction mixture was extracted with CH2Cl2 (Xilong Scientific, Shantou, China) after cooling. Afterward, each aqueous layer was evaporated under a vacuum (50 °C in water bath), and then diluted with H2O for multiple times to provide a neutral residue. Each residue was subjected to analytical HPLC (Jasco LC-4000, Tokyo, Japan) under the following conditions: Shodex Asahipak NH2P-50 4E column (250 mm × 4.6 mm, 5 mm); Jasco OR-4090 optical rotation detector; mobile phase, CH3CN:H2O (78:22, v/v); flow rate 1 mL/min. The absolute configurations of sugar units in compounds 1 and 2, composed of glucose, arabinose, and rhamnose, were confirmed by comparing their retention times and optical rotations with those of authentic samples (National Institute for Food and Drug Control, Beijing, China) [18]. Authentic sugars had retention times of tR: 6.5 min (l-rhamnose, negative optical rotation), 7.7 min (l-arabinose, positive optical rotation), and 11.3 min (d-glucose, positive optical rotation).
4.5. Quantum Chemical Calculations
NMR calculations were carried out via Gaussian 09, following the protocol adapted from Michael et al. [29]. At first, structures were optimized at B3LYP/6-31+G(d,p) theory level in gas phase. Then, the NMR calculations were conducted using the gauge-including atomic orbitals (GIAO) method at mPW1PW91/6-311+G (2d, p) in pyridine using the IEFPCM model. Finally, the TMS-corrected NMR chemical-shift values were fitted to the experimental values using the ordinary least-squares linear-regression (OLSLR) method. The calculated 13C NMR and 1H NMR chemical-shift values of TMS in pyridine were 187.32 ppm and 31.73 ppm, respectively.
4.6. Cytotoxicity Assay
Cytotoxicities of compounds 1 and 2 were tested using the 3-(4,5-dimethylthiazol-2-yl)-2,5-diphenyltetrazolium bromide (MTT) method, as described using human non-small-cell lung carcinoma (NCI-H460), human gastric carcinoma (MGC-803), human hepatocarcinoma (HepG2), and urinary bladder carcinoma (T24) cell lines [10]. Compound 2 was further tested on human lung adenocarcinoma (A549) and drug-resistant lung-cancer cell lines (A549/CDDP). Doxorubicin was used as a positive control. The cell lines were purchased from the Shanghai Cell Bank of the Chinese Academy of Sciences. In short, 1.0 × 10⁵ cells per well (in DMEM with 10% fetal bovine serum) were individually cultured in 96-well microtiter plates. Plates were incubated in a humidified atmosphere with 5% CO2 at 37 °C overnight. Cells were treated in triplicate with five concentrations (2.5, 5, 10, 20, and 50 μM) of the tested compounds and doxorubicin at 37 °C for 48 h. Cells were stained with 10 μL (10 mg/mL) of MTT in the incubator (Thermo Fisher, Waltham, USA) at 37 °C for about 4 h. After removal of the supernatant, 100 μL of DMSO (SYCC, Shenyang, China) was added to dissolve the formazan crystals. The absorbance was read using a microplate reader (TECAN, Zürich, Switzerland) at 570/630 nm.
4.7. Statistical Analysis
The data were processed with Student’s t-test using SPSS software (17.0; IBM®, USA), with a significance level of p < 0.05. IC50 values were determined through a Probit test in SPSS. All the tests were repeated in three independent experiments.
5. Conclusions
In conclusion, two oleanane-type triterpenoid saponins, foegraecumoside O (1) and foegraecumoside P (2), with unique 4/5/6 fused tricyclic skeletons, were isolated from L. foenum-graecum. They represent the very first example of oleanane-type triterpenoid saponins bearing a ring linked between C18 and C30. This discovery expands the structural diversity of the oleanane-type triterpenoid saponins. Furthermore, these two compounds are epimers that have opposite configurations of 30-OH. Interestingly, only two with 30α-OH were found to be active to cancer cell lines NCI-H460, MGC-803, HepG2, T24, A549, and A549/CDDP. It provides a potential lead molecule in drug development for treating diseases related to cancer and drug resistance to cancer.
Supplementary Materials
The following supporting information can be downloaded at: https://www.mdpi.com/article/10.3390/molecules28135061/s1, Figure S1. IR spectrum of compound 1. Figure S2. HR-ESI-MS spectrum of compound 1. Figure S3. 1H NMR spectrum of compound 1 (pyridine-d5, 500 MHz). Figure S4. 1H NMR assignment-1 of compound 1. Figure S5. 1H NMR assignment-2 of compound 1. Figure S6. 1H NMR assignment-3 of compound 1. Figure S7. 13C NMR spectrum of compound 1 (pyridine-d5, 125 MHz). Figure S8. 13C NMR assignment-1 of compound 1. Figure S9. 13C NMR assignment-2 of compound 1. Figure S10. DEPT spectrum of compound 1. Figure S11. 1H–1H COSY spectrum-1 of compound 1. Figure S12. 1H–1H COSY spectrum-2 of compound 1. Figure S13. 1H–1H COSY spectrum-3 of compound 1. Figure S14. HSQC spectrum-1 of compound 1. Figure S15. HSQC spectrum-2 of compound 1. Figure S16. HSQC spectrum-3 of compound 1. Figure S17. HMBC spectrum-1 of compound 1. Figure S18. HMBC spectrum-2 of compound 1. Figure S19. HMBC spectrum-3 of compound 1. Figure S20. NOESY spectrum-1 of compound 1. Figure S21. NOESY spectrum-2 of compound 1. Figure S22. NOESY spectrum-2 of compound 1. Figure S23. IR spectrum of compound 2. Figure S24. HR-ESI-MS spectrum of compound 2. Figure S25. 1H NMR spectrum of compound 2 (pyridine-d5, 600 MHz). Figure S26. 1H NMR assignment-1 of compound 2. Figure S27. 1H NMR assignment-2 of compound 2. Figure S28. 1H NMR assignment-3 of compound 2. Figure S29. 13C NMR spectrum of compound 2 (pyridine-d5, 150 MHz). Figure S30. 13C NMR assignment-1 of compound 2. Figure S31. 13C NMR assignment-2 of compound 2. Figure S32. 13C NMR assignment-3 of compound 2. Figure S33. 1H–1H COSY spectrum-1 of compound 2. Figure S34. 1H–1H COSY spectrum-2 of compound 2. Figure S35. 1H–1H COSY spectrum-3 of compound 2. Figure S36. HSQC spectrum-1 of compound 2. Figure S37. HSQC spectrum-2 of compound 2. Figure S38. HSQC spectrum-3 of compound 2. Figure S39. HMBC spectrum-1 of compound 2. Figure S40. HMBC spectrum-2 of compound 2. Figure S41. HMBC spectrum-3 of compound 2. Figure S42. NOESY spectrum-1 of compound 2. Figure S43. NOESY spectrum-2 of compound 2. Figure S44. Isolation and purification of compounds 1 and 2. Table S1. Experimental and computed 13C NMR chemical shifts of 1 and 2. Table S2. Experimental and computed 1H NMR chemical shifts of 1 and 2. Table S3. Statistics of ordinary least squares (OLS) linear regression of experimental and computed 13C- and 1H NMR chemical shifts of 1 and 2.
Author Contributions
Conceptualization, D.L.; methodology, L.D. and H.W.; validation, S.H. and B.Z.; formal analysis, L.D. and Y.W.; investigation, L.D. and S.H.; resources, D.L. and H.W.; writing—original draft preparation, L.D. and S.H.; writing—review and editing, Y.W.; visualization, L.D. and Y.W.; supervision, D.L.; project administration, D.L.; funding acquisition, D.L. All authors have read and agreed to the published version of the manuscript.
Funding
We sincerely appreciate the support from the National Natural Science Foundation of China (No. 21462006), the Natural Science Foundation of Henan Province (No. 232300421381), the National Administration of Traditional Chinese Medicine (No. GZYYGJ2020023), and the Higher Education Commission of Pakistan (NRPU 2021 #17603).
Institutional Review Board Statement
Not applicable.
Informed Consent Statement
Not applicable.
Data Availability Statement
Not applicable.
Conflicts of Interest
The authors declare no conflict of interest.
Sample Availability
Samples of the compounds are available from the authors.
References
- Siegel, R.L.; Miller, K.D.; Wagle, N.S.; Jemal, A. Cancer Statistics, 2023. CA Cancer J. Clin. 2023, 73, 17–48. [Google Scholar] [CrossRef] [PubMed]
- Vasan, N.; Baselga, J.; Hyman, D.M. A View on Drug Resistance in Cancer. Nature 2019, 575, 299–309. [Google Scholar] [CrossRef]
- Housman, G.; Byler, S.; Heerboth, S.; Lapinska, K.; Longacre, M.; Snyder, N.; Sarkar, S. Drug Resistance in Cancer: An Overview. Cancers 2014, 6, 1769–1792. [Google Scholar] [CrossRef] [PubMed]
- Hu, C.; Kelso, S. Primulaceae. Flora China 1996, 5, 39–189. [Google Scholar]
- Committee of Chinese Materia Medica; National Administration of Traditional Chinese Medicine. Lysimachia foenum-graecum Hance. In Chinese Materia Medica; Shanghai Science and Technology Press: Shanghai, China, 1999; pp. 5364–5366. [Google Scholar]
- Tian, J.K.; Xu, L.Z.; Zou, Z.M.; Yang, S.L. Three Novel Triterpenoid Saponins from Lysimachia capillipes and Their Cytotoxic Activities. Chem. Pharm. Bull. 2006, 54, 567–569. [Google Scholar] [CrossRef] [PubMed]
- Huang, X.A.; Liang, Y.J.; Cai, X.L.; Feng, X.Q.; Zhang, C.H.; Fu, L.W. Four New Cytotoxic Oligosaccharidic Derivatives of 12-Oleanene from Lysimachia heterogenea Klatt. Bioorganic Med. Chem. Lett. 2009, 19, 6515–6518. [Google Scholar] [CrossRef] [PubMed]
- Liang, D.; Hao, Z.-Y.; Zhang, G.-J.; Zhang, Q.-J.; Chen, R.-Y.; Yu, D.-Q. Cytotoxic Triterpenoid Saponins from Lysimachia clethroides. J. Nat. Prod. 2011, 74, 2128–2136. [Google Scholar] [CrossRef]
- He, Z.; Liang, F.; Lu, J.; Pan, Y. Cytotoxic Triterpenoids from Lysimachia parvifolia. Eur. J. Med. Chem. 2013, 67, 390–397. [Google Scholar] [CrossRef]
- Dai, L.M.; Huang, R.Z.; Zhang, B.; Hua, J.; Wang, H.S.; Liang, D. Cytotoxic Triterpenoid Saponins from Lysimachia foenum-graecum. Phytochemistry 2017, 136, 165–174. [Google Scholar] [CrossRef]
- Zhang, S.L.; Yang, Z.N.; He, C.; Liao, H.B.; Wang, H.S.; Chen, Z.F.; Liang, D. Oleanane-Type Triterpenoid Saponins from Lysimachia fortunei Maxim. Phytochemistry 2018, 147, 140–146. [Google Scholar] [CrossRef]
- Dai, L.M.; Huang, R.Z.; Zhang, B.; Hua, J.; Liao, H.B.; Wang, H.S.; Liang, D. Three New Triterpenoid Saponins from the Aerial Parts of Lysimachia foenum-graecum. Phytochem. Lett. 2017, 22, 133–137. [Google Scholar] [CrossRef]
- Shen, Y.H.; Weng, Z.Y.; Zhao, Q.S.; Zeng, Y.Q.; Ríos, J.L.; Xiao, W.L.; Xu, G.; Sun, H.D. Five New Triterpene Glycosides from Lysimachia foenum-graecum and Evaluation of Their Effect on the Arachidonic Acid Metabolizing Enzyme. Planta Med. 2005, 71, 770–775. [Google Scholar] [CrossRef] [PubMed]
- Li, X.R.; Li, Z.M.; Du, S.S.; Wang, G.L.; Lin, R.C. Two Triterpenes from Lysimachia foenum-graecum. J. Asian Nat. Prod. Res. 2009, 11, 128–131. [Google Scholar] [CrossRef]
- Li, X.R.; Xin, B.; Wang, G.L.; Dai, Z.; Lin, R.C. Two New Triterpenes from Lysimachia foenum-graecum. J. Asian Nat. Prod. Res. 2010, 12, 204–208. [Google Scholar] [CrossRef]
- Li, X.R.; Li, Z.M.; Lin, R.C. Two New Triterpenes from Lysimachia foenum-graecum. J. Asian Nat. Prod. Res. 2009, 11, 529–533. [Google Scholar] [CrossRef] [PubMed]
- Li, X.; Li, Z.; Du, S.; Lin, R. A New Flavonoid from Lysimachia foenum-graecum. Acta Pharm. Sin. 2007, 42, 747–749. [Google Scholar]
- Yoshikawa, M.; Morikawa, T.; Kashima, Y.; Ninomiya, K.; Matsuda, H. Structures of New Dammarane-Type Triterpene Saponins from the Flower Buds of Panax notoginseng and Hepatoprotective Effects of Principal Ginseng Saponins. J. Nat. Prod. 2003, 66, 922–927. [Google Scholar] [CrossRef] [PubMed]
- Grimblat, N.; Zanardi, M.M.; Sarotti, A.M. Beyond DP4: An Improved Probability for the Stereochemical Assignment of Isomeric Compounds Using Quantum Chemical Calculations of NMR Shifts. J. Org. Chem. 2015, 80, 12526–12534. [Google Scholar] [CrossRef]
- Lodewyk, M.W.; Siebert, M.R.; Tantillo, D.J. Computational Prediction of 1H and 13C Chemical Shifts: A Useful Tool for Natural Product, Mechanistic, and Synthetic Organic Chemistry. Chem. Rev. 2012, 112, 1839–1862. [Google Scholar] [CrossRef]
- Pulido, P.; Perello, C.; Rodriguez-Concepcion, M. New Insights into Plant Isoprenoid Metabolism. Mol. Plant 2012, 5, 964–967. [Google Scholar] [CrossRef] [PubMed]
- Haralampidis, K.; Trojanowska, M.; Osbourn, A.E. Biosynthesis of Triterpenoid Saponins in Plants. Adv. Biochem. Eng. Biotechnol. 2002, 75, 31–49. [Google Scholar] [CrossRef] [PubMed]
- Seki, H.; Tamura, K.; Muranaka, T. P450s and UGTs: Key Players in the Structural Diversity of Triterpenoid Saponins. Plant Cell Physiol. 2015, 56, 1463–1471. [Google Scholar] [CrossRef] [PubMed]
- Wang, Y.; Khan, F.-A.; Siddiqui, M.; Aamer, M.; Lu, C.; Atta-ur-Rahman; Atia-tul-Wahab; Choudhary, M.I. The Genus Schefflera: A Review of Traditional Uses, Phytochemistry and Pharmacology. J. Ethnopharmacol. 2021, 279, 113675. [Google Scholar] [CrossRef] [PubMed]
- Lacaille-Dubois, M.A.; Pegnyemb, D.E.; Noté, O.P.; Mitaine-Offer, A.C. A Review of Acacic Acid-Type Saponins from Leguminosae-Mimosoideae as Potent Cytotoxic and Apoptosis Inducing Agents. Phytochem. Rev. 2011, 10, 565–584. [Google Scholar] [CrossRef]
- Xu, G.B.; Xiao, Y.H.; Zhang, Q.Y.; Zhou, M.; Liao, S.G. Hepatoprotective Natural Triterpenoids. Eur. J. Med. Chem. 2018, 145, 691–716. [Google Scholar] [CrossRef]
- Lacaille-Dubois, M.A.; Mitaine-Offer, A.C. Triterpene Saponins from Polygalaceae. Phytochem. Rev. 2005, 4, 139–149. [Google Scholar] [CrossRef]
- Bildziukevich, U.; Wimmerová, M.; Wimmer, Z. Saponins of Selected Triterpenoids as Potential Therapeutic Agents: A Review. Pharmaceuticals 2023, 16, 386. [Google Scholar] [CrossRef]
- Frisch, M.J.; Trucks, G.W.; Schlegel, H.B.; Scuseria, G.E.; Robb, M.A.; Cheeseman, J.R.; Scalmani, G.; Barone, V.; Mennucci, B.G.; Petersson, A.; et al. Gaussian 09 Revision D.01; Gaussian Inc.: Wallingford, CT, USA, 2009. [Google Scholar]
Disclaimer/Publisher’s Note: The statements, opinions and data contained in all publications are solely those of the individual author(s) and contributor(s) and not of MDPI and/or the editor(s). MDPI and/or the editor(s) disclaim responsibility for any injury to people or property resulting from any ideas, methods, instructions or products referred to in the content. |
© 2023 by the authors. Licensee MDPI, Basel, Switzerland. This article is an open access article distributed under the terms and conditions of the Creative Commons Attribution (CC BY) license (https://creativecommons.org/licenses/by/4.0/).