Article

Vibronic and Cationic Features of 2-Fluorobenzonitrile and 3-Fluorobenzonitrile Studied by REMPI and MATI Spectroscopy and Franck–Condon Simulations

1
State Key Laboratory of Quantum Optics and Quantum Optic Devices, Institute of Laser Spectroscopy, Shanxi University, Taiyuan 030006, China
2
Department of Physics and Electronics Engineering, Jinzhong University, Jinzhong 030619, China
3
Collaborative Innovation Center of Extreme Optics, Shanxi University, Taiyuan 030006, China
*
Authors to whom correspondence should be addressed.
Molecules 2023, 28(12), 4702; https://doi.org/10.3390/molecules28124702
Submission received: 25 May 2023 / Revised: 8 June 2023 / Accepted: 9 June 2023 / Published: 12 June 2023
(This article belongs to the Section Physical Chemistry)

Abstract

:
Fluorinated organic compounds have superior physicochemical properties than general organic compounds due to the strong C-F single bond; they are widely used in medicine, biology, pesticides, and materials science. In order to gain a deeper understanding of the physicochemical properties of fluorinated organic compounds, fluorinated aromatic compounds have been investigated by various spectroscopic techniques. 2-fluorobenzonitrile and 3-fluorobenzonitrile are important fine chemical intermediates and their excited state S1 and cationic ground state D0 vibrational features remain unknown. In this paper, we used two-color resonance two photon ionization (2-color REMPI) and mass analyzed threshold ionization (MATI) spectroscopy to study S1 and D0 state vibrational features of 2-fluorobenzonitrile and 3-fluorobenzonitrile. The precise excitation energy (band origin) and adiabatic ionization energy were determined to be 36,028 ± 2 cm−1 and 78,650 ± 5 cm−1 for 2-fluorobenzonitrile and 35,989 ± 2 cm−1 and 78,873 ± 5 cm−1 for 3-fluorobenzonitrile, respectively. The density functional theory (DFT) at the levels of RB3LYP/aug-cc-pvtz, TD-B3LYP/aug-cc-pvtz, and UB3LYP/aug-cc-pvtz were used to calculate the stable structures and vibrational frequencies for the ground state S0, excited state S1, and cationic ground state D0, respectively. Franck–Condon spectral simulations for transitions of S1 ← S0 and D0 ← S1 were performed based on the above DFT calculations. The theoretical and experimental results were in good agreement. The observed vibrational features in S1 and D0 states were assigned according to the simulated spectra and the comparison with structurally similar molecules. Several experimental findings and molecular features were discussed in detail.

Graphical Abstract

1. Introduction

Due to the presence of the strong C-F single bond within the molecule, fluorinated organic compounds have superior physicochemical properties and are widely used in medicine, biology, pesticides, and materials science [1,2,3,4,5]. In recent years, a large number of fluorinated aromatic compounds have been investigated by various spectroscopic techniques. Ling et al. used femtosecond time-resolved photoelectron imaging to study the conformation of bi-fluorophenol and bi-fluoroaniline in the excited state S1 after photoexcitation [6,7]. Wijngaarden’s group used high-resolution microwave spectroscopy to measure the rotation spectra of fluorine substituted benzaldehyde, benzonitrile, phenol, and pyridine derivatives to study the molecular structure changes caused by fluorination and intramolecular hydrogen bonding interactions [8,9,10]. Many experimental groups have also studied the vibrational spectra of excited state S1 and cationic ground state D0 of fluorine-substituted phenol, anisole, and aniline derivatives using laser-induced fluorescence (LIF), resonance-enhanced multiphoton ionization (REMPI), and mass-analyzed threshold ionization (MATI) spectroscopy [11,12,13,14]. Mono-fluorobenzonitrile is a very important class of intermediate for organic synthesis; its vibrational and rotational properties have been reported in many studies [15,16,17,18]. Kamaee et al. investigated the structural trends in mono-, di-, and pentafluorobenzonitriles using Fourier transform microwave spectroscopy [10]. Palmer et al. measured photoelectron spectroscopy of 2-fluorobenzonitrile (2FBN) and 3-fluorobenzonitrile (3FBN) and reported the ionization energies (IEs) of 9.78 eV and 9.79 eV, respectively [19]. Jiang and Levy used laser-induced fluorescence and dispersive fluorescence spectroscopy to study the vibrational relaxation of the excited state of 4-fluorobenzonitrile (4FBN) molecule [20]. In 2018, Zhao et al. [21] studied the vibrational features of the excited and cationic ground states of 4FBN by REMPI and MATI techniques. Silva et al. [16] measured the UV-Vis spectra of monofluorobenzonitriles in dichloromethane; from the curves they measured, the approximate origins of 2FBN and 3FBN could be estimated at 283 nm. To the best of our knowledge, the vibrational properties of the excited states and cationic ground states of 2FBN and 3FBN have not been reported in the literature.
MATI and zero kinetic energy (ZEKE) spectroscopy are currently the most popular high-resolution techniques for measuring vibrational features of cationic ground states. Kwon’s group built a vacuum ultraviolet single photon MATI system to study many cationic vibrational features [22,23,24,25,26,27,28,29]. Tzeng’s group and Ketkov’s group used two-color MATI to study the cationic spectra of many benzene derivatives and sandwich molecules [30,31,32,33,34,35,36]. Wright’s group used ZEKE technology to research cationic vibrational features of many halogenated benzene and their derivatives [37,38,39,40,41,42]. In this paper, we used two-color REMPI and MATI techniques to study the vibrational features of the excited states and cationic ground states of 2FBN and 3FBN. The precise excitation energies and adiabatic ionization energies were determined. The measured vibrational features were assigned and several experimental findings were analyzed and discussed in detail.

2. Results

The stable structures of 2- and 3-fluorobenzonitrile with atomic labels are shown in Figure 1. 2FBN and 3FBN molecules consist of 13 atoms with a total of 33 normal vibrational modes, 30 modes of which are at aromatic ring and 3 modes at CN group. The labeling convention of the vibrational modes followed the Varsanyi system [43]. Vibronic transitions were expressed in the Wilson notation based on the benzene modes, where the v′ ← v″ transition in the normal mode n was represented by n v v [44]; subscript V″ was omitted in the present research as it was a constant 0 (the low energy level of the transition is the vibrationless or zero point energy level of the low electronic state).

2.1. Vibronic Features of 2-Fluorobenzonitrile in the S1 State

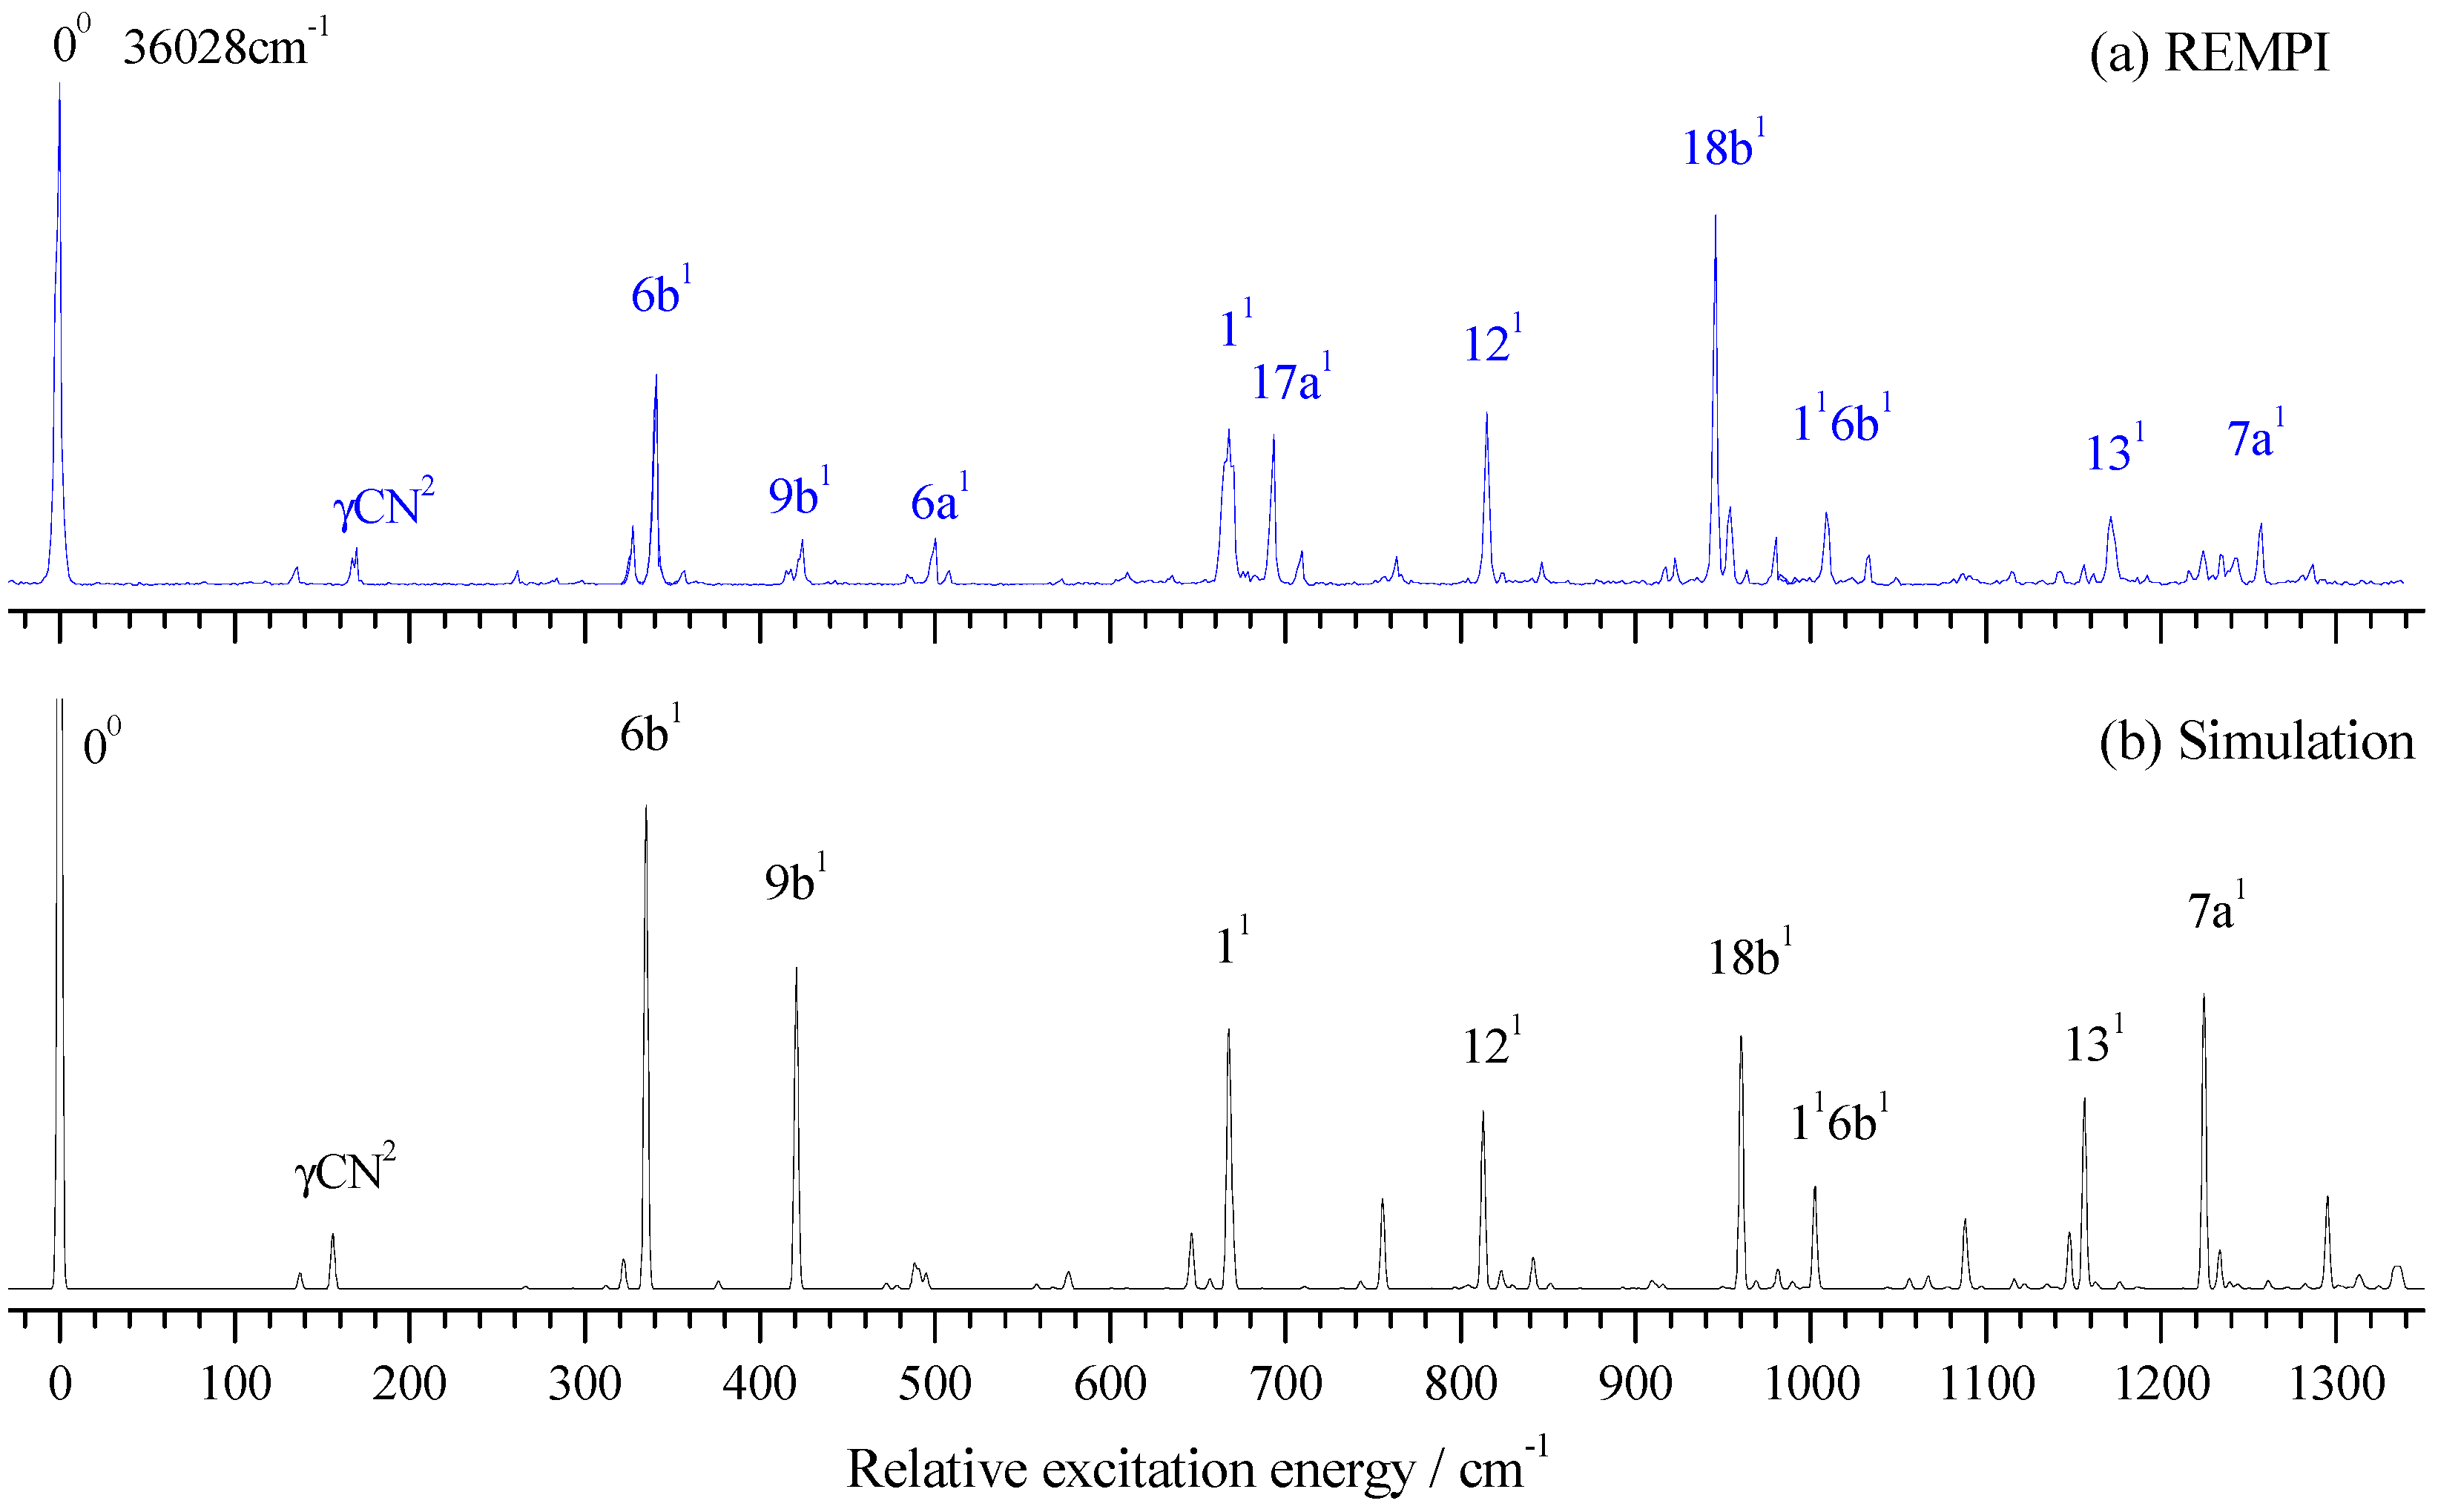
The vibronic spectrum of the S1 ← S0 transition of 2FBN was measured by a two-color REMPI experiment with the vibration frequency range of 0–1350 cm−1. The experimental result is shown in Figure 2a and its Franck–Condon simulation calculated at TD-B3LYP/aug-cc-pvtz level is shown in Figure 2b. It can be seen that the experimental result was in good agreement with the calculated one. The obvious feature of both REMPI and its simulation in Figure 2 was that the rate of signal-to-noise in the low frequency region was greater than in the high frequency region. The simulation spectrum showed that the bands in the high frequency region were dense and consisted of many fundamentals, overtones, and combinations of various modes, many of which were very weak. Thus, dense and weak bands raised the spectral baseline and resulted in a bad rate of signal-to-noise in high frequency regions. The band at certain frequencies in the spectrum maybe came from several component (or vibration mode) contributions. For simplicity’s sake, we only list the largest contributor in Table 1.
Based on DFT calculation and spectral simulation, we analyzed and assigned the vibronic spectra of 2FBN. It is very clear in Figure 2a that the band at 36,028 cm−1 was assigned to the band origin of the S1 ← S0 transition. Many in-plane vibrational modes of the ring were active and most of them were very strong in the REMPI spectrum. The bands at 136, 341, 424, 500, 668, 815, 946, 1171, and 1257 cm−1 were assigned to fundamental modes 15, 6b, 9b, 6a, 1, 12, 18b, 13, and 7a, respectively. One out-of-plane fundamental mode at the ring was observed, which appeared at 693 cm−1 and was assigned to mode 17a. Several overtone vibrations were observed, which appeared at 170, 635, and 846 cm−1 and assigned to γCN2, 16b2, and 9b2, respectively. Other bands observed in the REMPI spectrum were assigned to the combined vibrations of several modes. All the measured vibrational frequencies, calculated frequencies, and possible assignments are listed in Table 1.
From the measured REMPI spectra in Figure 2a, we found that the vibronic band 11 was much wider than other bands. From the simulation calculation, we knew that the band 11 consisted of three components: 16a110a1 (665.2 cm−1), 11 (667.5 cm−1), and 6b2 (669.7 cm−1). The calculated dipole strengths at the level of TD-B3LYP/aug-cc-pvtz for these three components were 3.365 × 10⁻⁵, 1.254 × 10⁻², and 3.2 × 10⁻³, respectively. Due to the very close vibrational energy, the resonance interactions may have played a role in the broadening of the experimental spectral line.

2.2. Photoionization Efficiency (PIE) Spectra of 2FBN

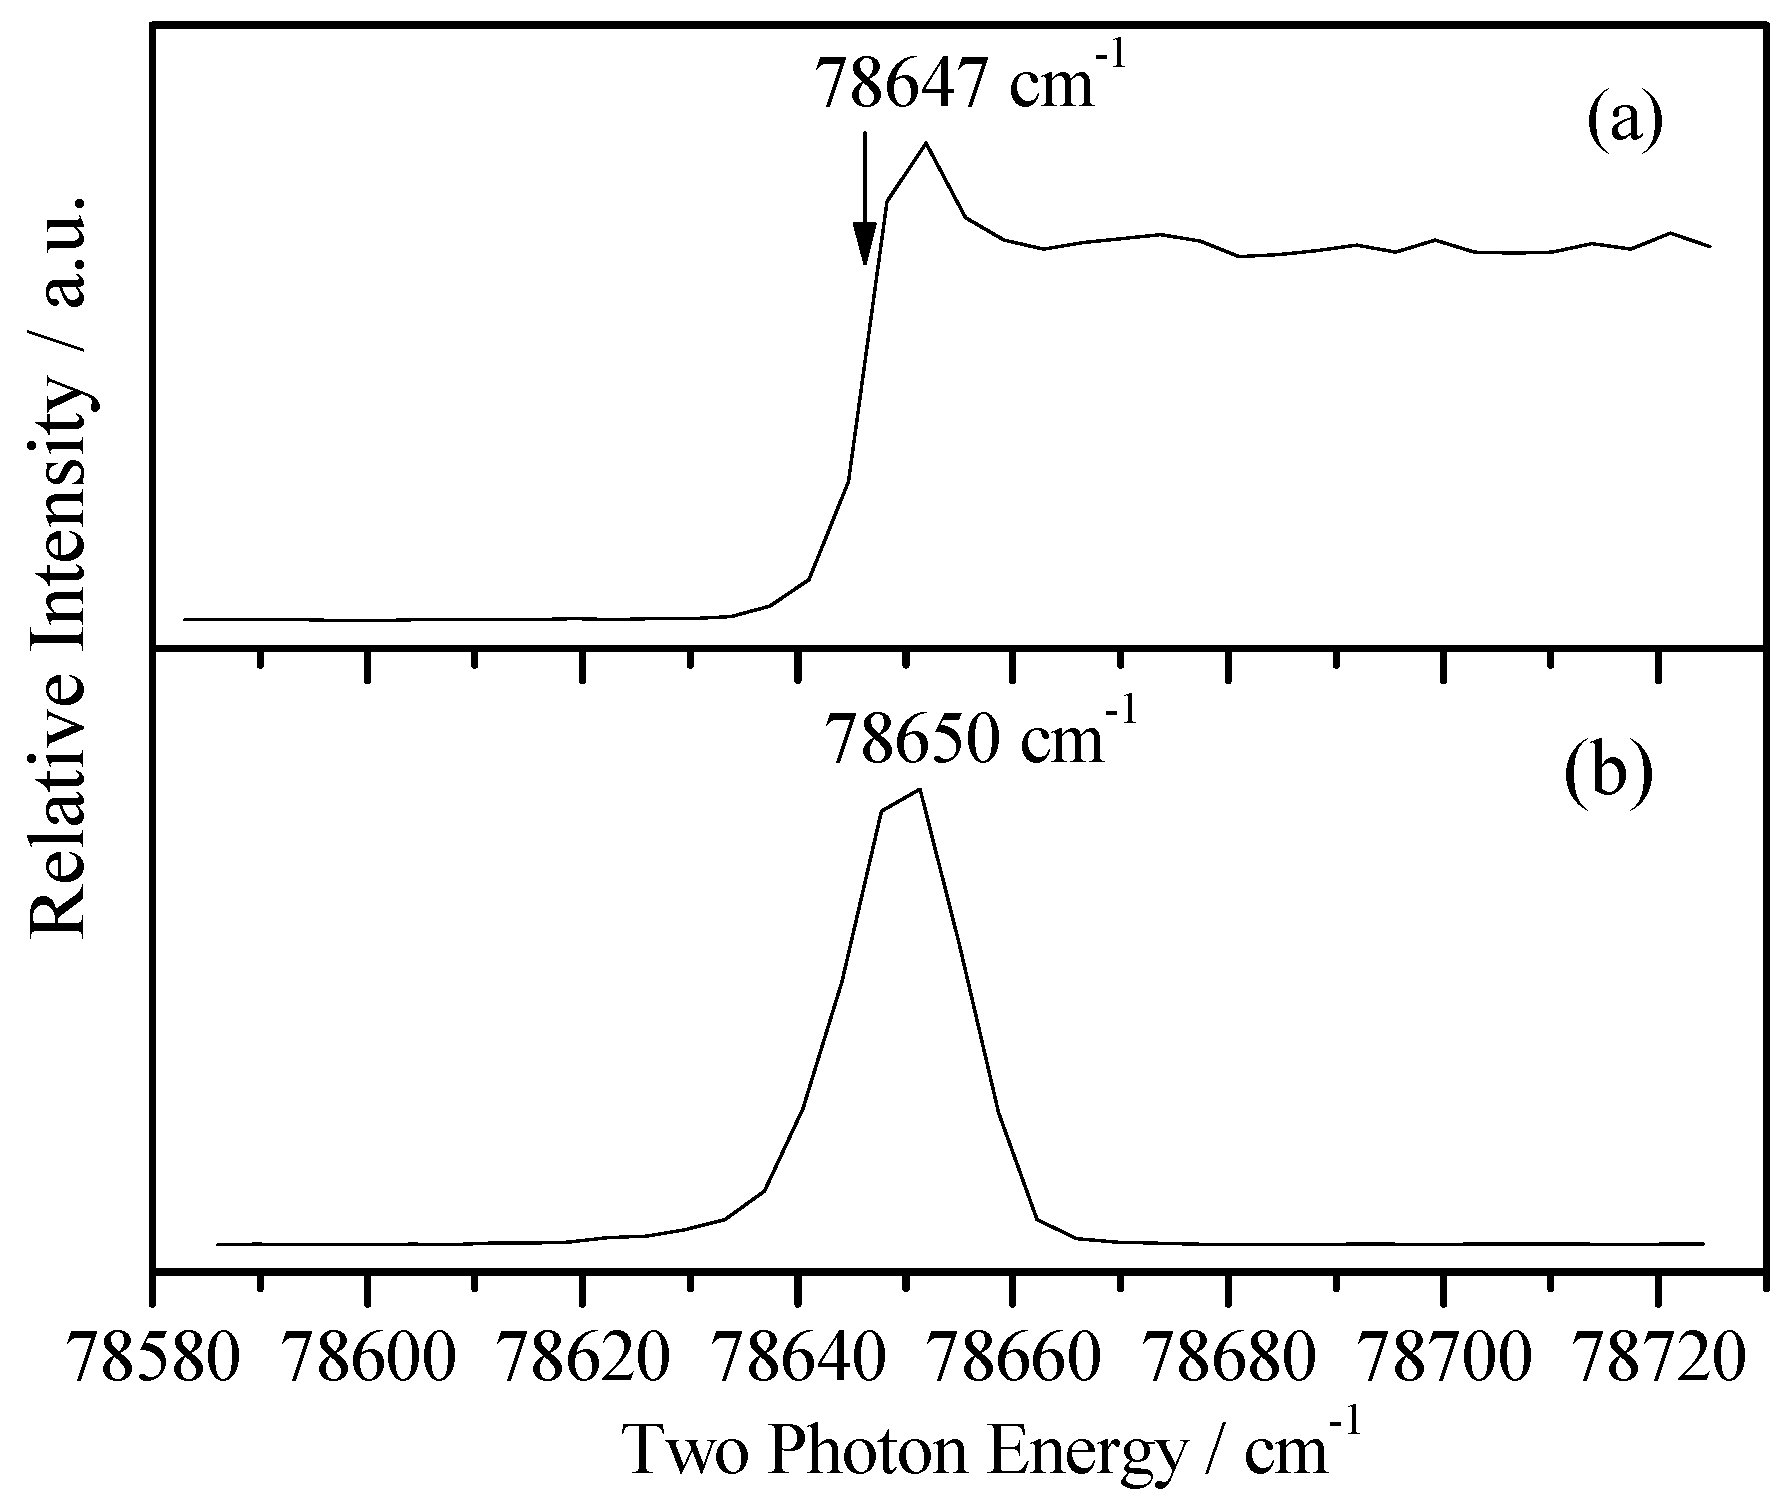
In order to measure the cationic spectra, we first required to know the ionization energy (IE). With the present experimental setup, the IE could be measured by photoionization efficiency (PIE) or MATI experiments. The PIE approach detected the prompt ions involving the field-ionization of high Rydberg neutrals and yielded a strong signal that led to an abruptly rising step near the ionization limit. In contrast, the MATI spectrum detected the threshold ions and yielded a sharp peak at the ionization threshold and vibrational features of the cation. We recorded both the PIE and MATI spectra by scanning the frequency of the ionization laser over a large range to determine the IE of 2FBN. Figure 3a,b show the PIE and MATI spectra via the intermediate state S100 (36,028 cm−1). The adiabatic IE of 2FBN was determined to be 78,647 ± 10 cm−1 by PIE and 78,650 ± 5 cm−1 (9.7514 ± 0.0006 eV) by MATI, including the correction of the Stark effect, respectively. These results were in good agreement with the previous measured value of 9.78 eV (78,881 cm−1) [19] by photoelectron spectroscopy with an He I UV-light source.

2.3. Cationic Spectra of 2FBN

To investigate the molecular geometry and vibrational features of the 2FBN cation, the MATI spectra were recorded by ionizing via the S100, S16b1 (00 + 341 cm−1), S111 (00 + 668 cm−1), S1121 (00 + 815 cm−1), and S118b1 (00 + 946 cm−1) intermediate states.
We first performed the theoretical calculation and spectral simulation. The Franck–Condon simulation is shown in Figure 4a; the corresponding MATI spectrum via S100 is shown in Figure 4b. From Figure 4a,b we know that the theoretical and experimental spectra were in good agreement. The most intense peak corresponded to the origin of the D0 ← S1 transition of 2FBN. Spectral features were assigned, mainly based on DFT calculations, the Franck–Condon simulation, and comparisons with the available data on substituted benzonitriles. Spectral assignment is a very tedious and error prone matter. Accurate assignments can be obtained by high dimensional or even full dimensional vibrational calculations [45,46]. For the present work, we used the Franck–Condon simulation, which greatly facilitated the spectral identification work. The bands at 131, 333, 530, 571, 683, 826, 972, 1268, and 1555 cm−1 were relatively intense and assigned to ring or CN group in-plane motion modes 15, 6b, 6a, βCN, 1, 12, 18b, 7a, and 8b, respectively. Several out-of-plane bending vibrations were also observed, such as γCN and 10b, appearing at 106 and 197 cm−1, respectively. Other bands were weak and assigned to overtone or combination vibrations. The measured and calculated cationic vibrational frequencies and their possible assignments are listed in Table 2.
In order to find more vibrational modes of 2FBN cation, the different intermediate states were used to record the MATI spectra. Figure 4c shows the MATI spectra via S16b1 (00 + 341 cm−1). In comparison with Figure 4b, we found that, when S16b1 was used as the intermediate state, most of the spectral features could be assigned to combinations of 6b and the modes found in MATI via S100. This could be verified by shifting Figure 4c to the left to align its band 6b with the 0+ band in Figure 4b. No more fundamental modes than the MATI via S100 were found.
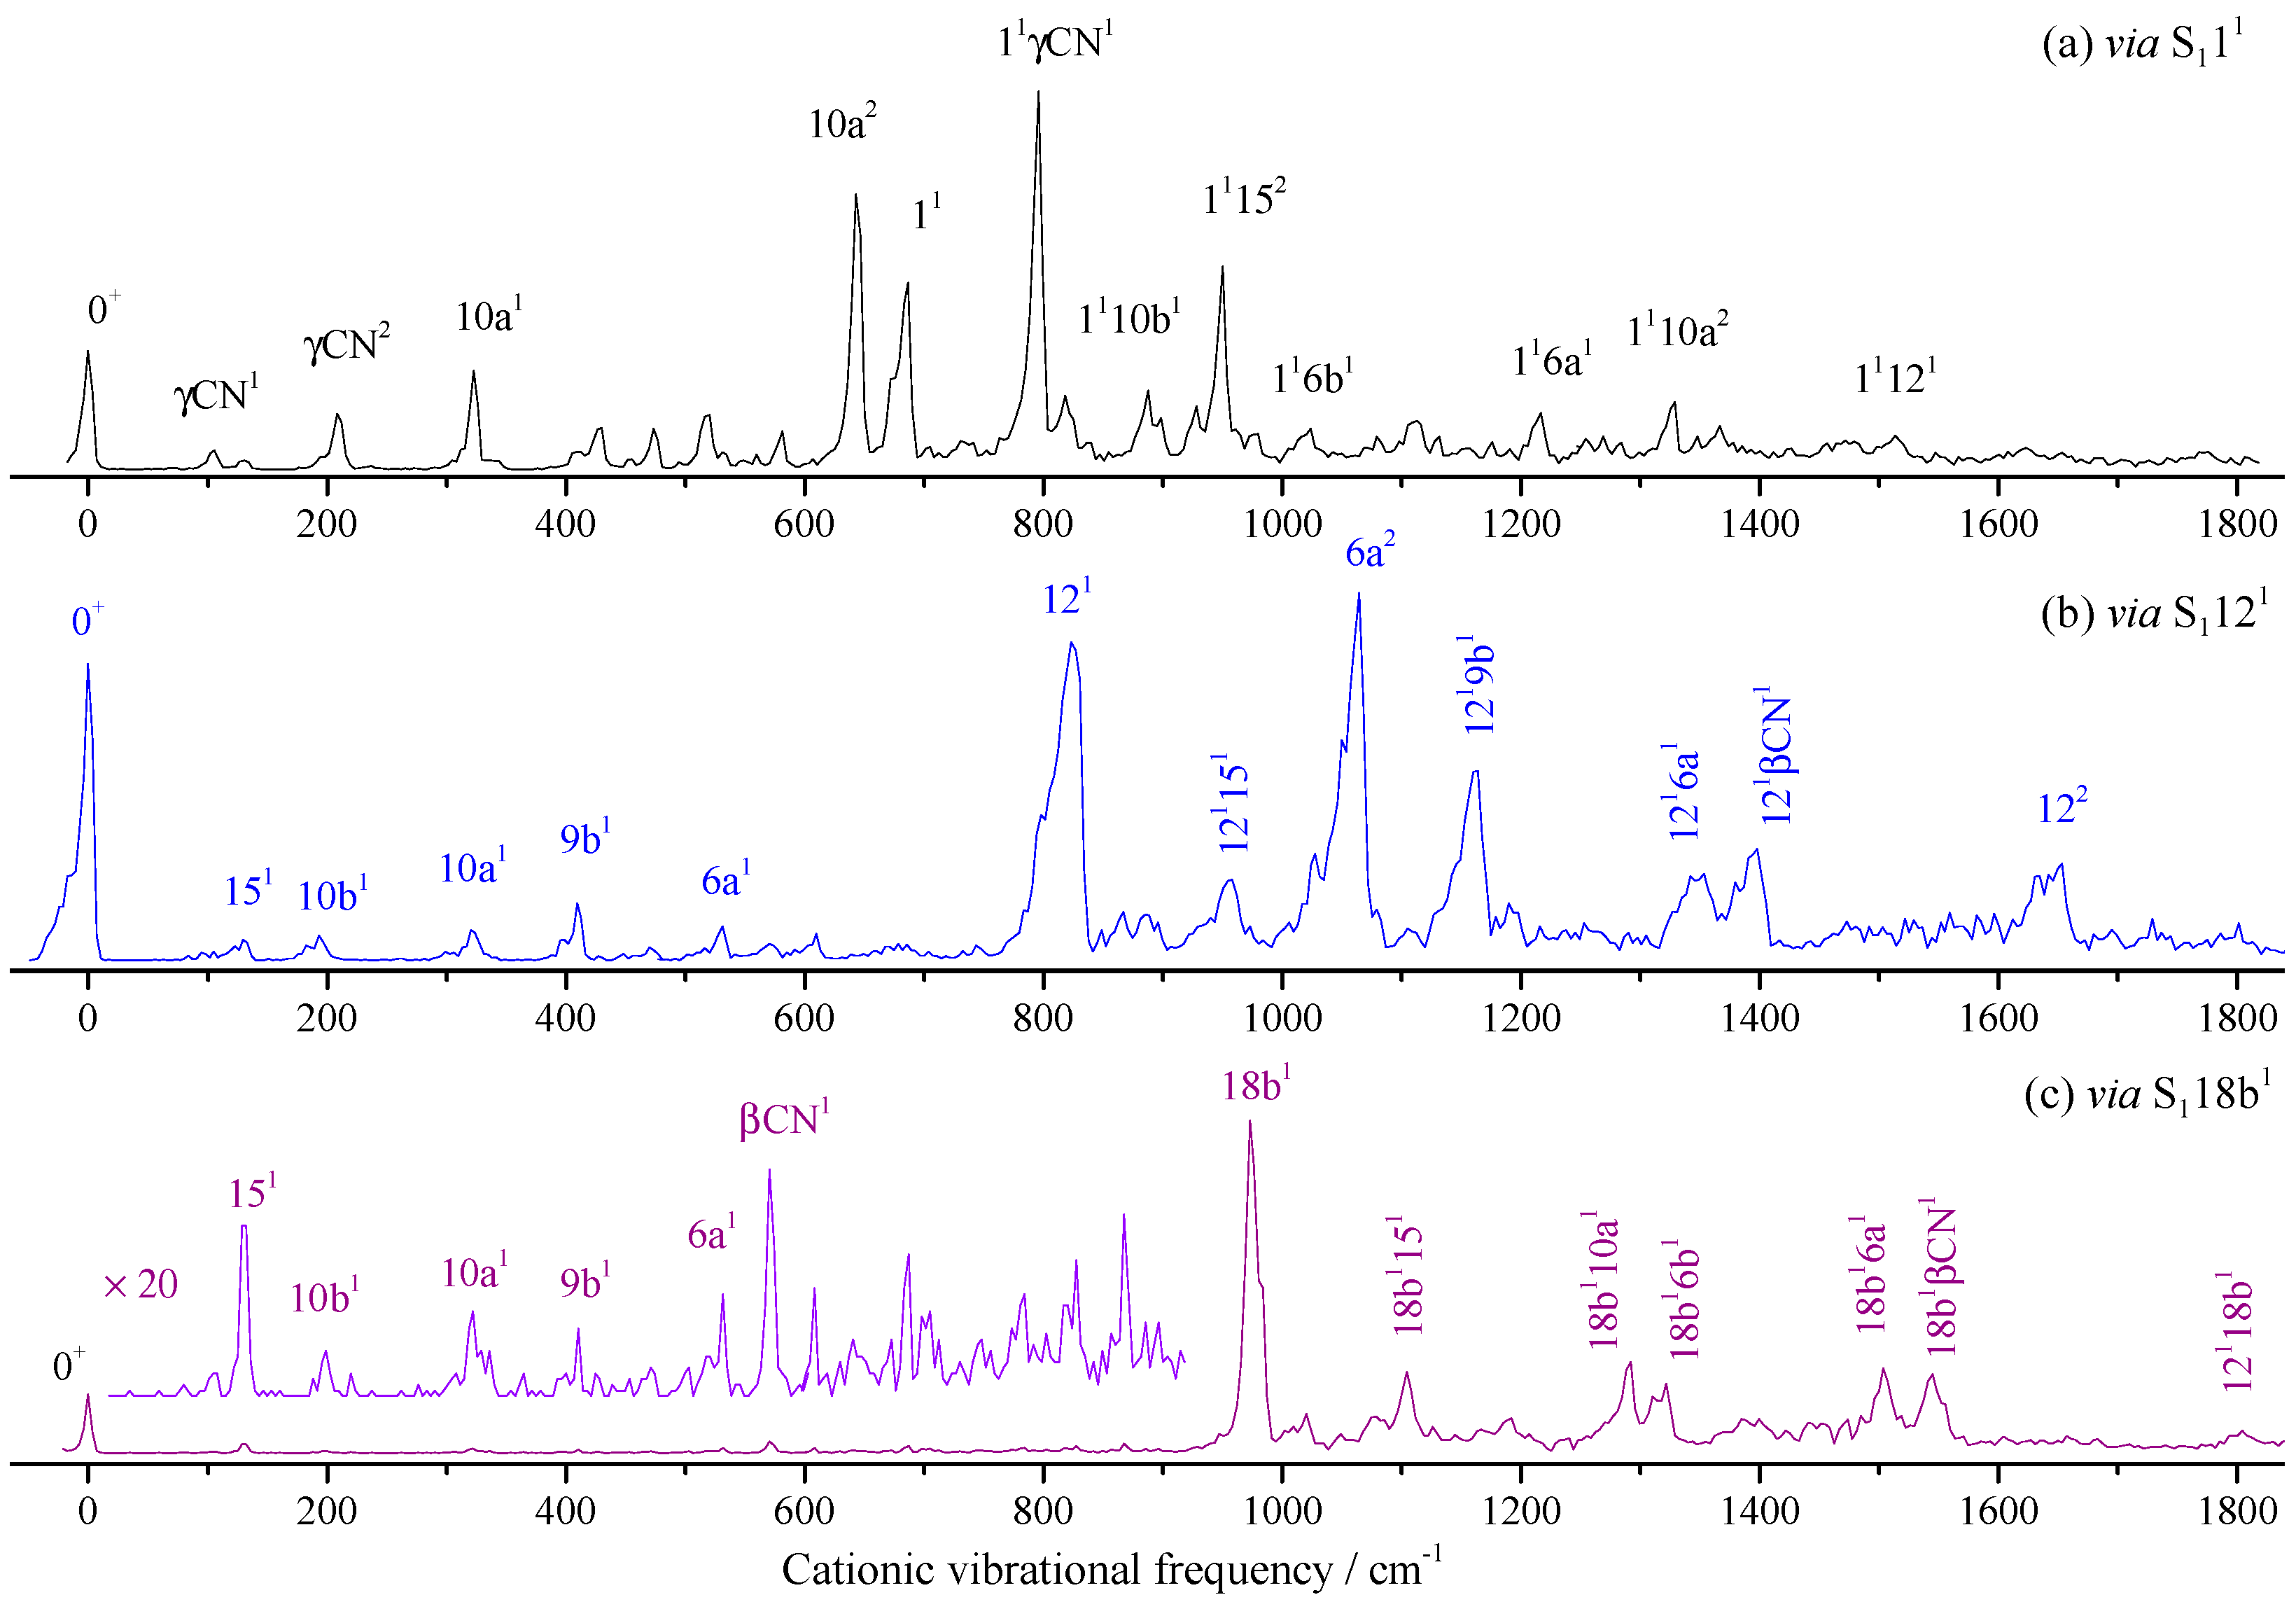
Figure 5 shows the MATI spectra via the intermediate states of S111 (00 + 668 cm−1), S1121 (00 + 815 cm−1), and S118b1 (00 + 946 cm−1). Similarly, when S111 (00 + 668 cm−1) was used as the intermediate state, a lot of bands were assigned to the combination vibrations of the mode 1 and those found in MATI via S100. In the lower frequency region, substituent CN out-of-plane bending γCN and its overtone γCN2 were found. Aromatic ring out-of-plane bending 10a and its overtone 10a2 were also observed. Other bands were weak and were assigned to combination vibrations of several modes.
Similarly, when S1121 was used as the intermediate, as shown in Figure 5b, except for the bands at 1064 and 1646 cm−1 being assigned to 6a2 and 122, other bands greater than 823 cm−1 (D0121) were assigned to combinations of 121 and other modes. In lower frequency regions, some fundamental modes were active, which were found in the MATI spectrum via S100 or S111. For the MATI via S118b1 in Figure 5c, the spectral feature was similar to the MATI via S1121; all the assignments, as well as the calculated and measured values, are listed in Table 2.

2.4. Vibronic Features of 3-Fluorobenznitrile in the S1 State

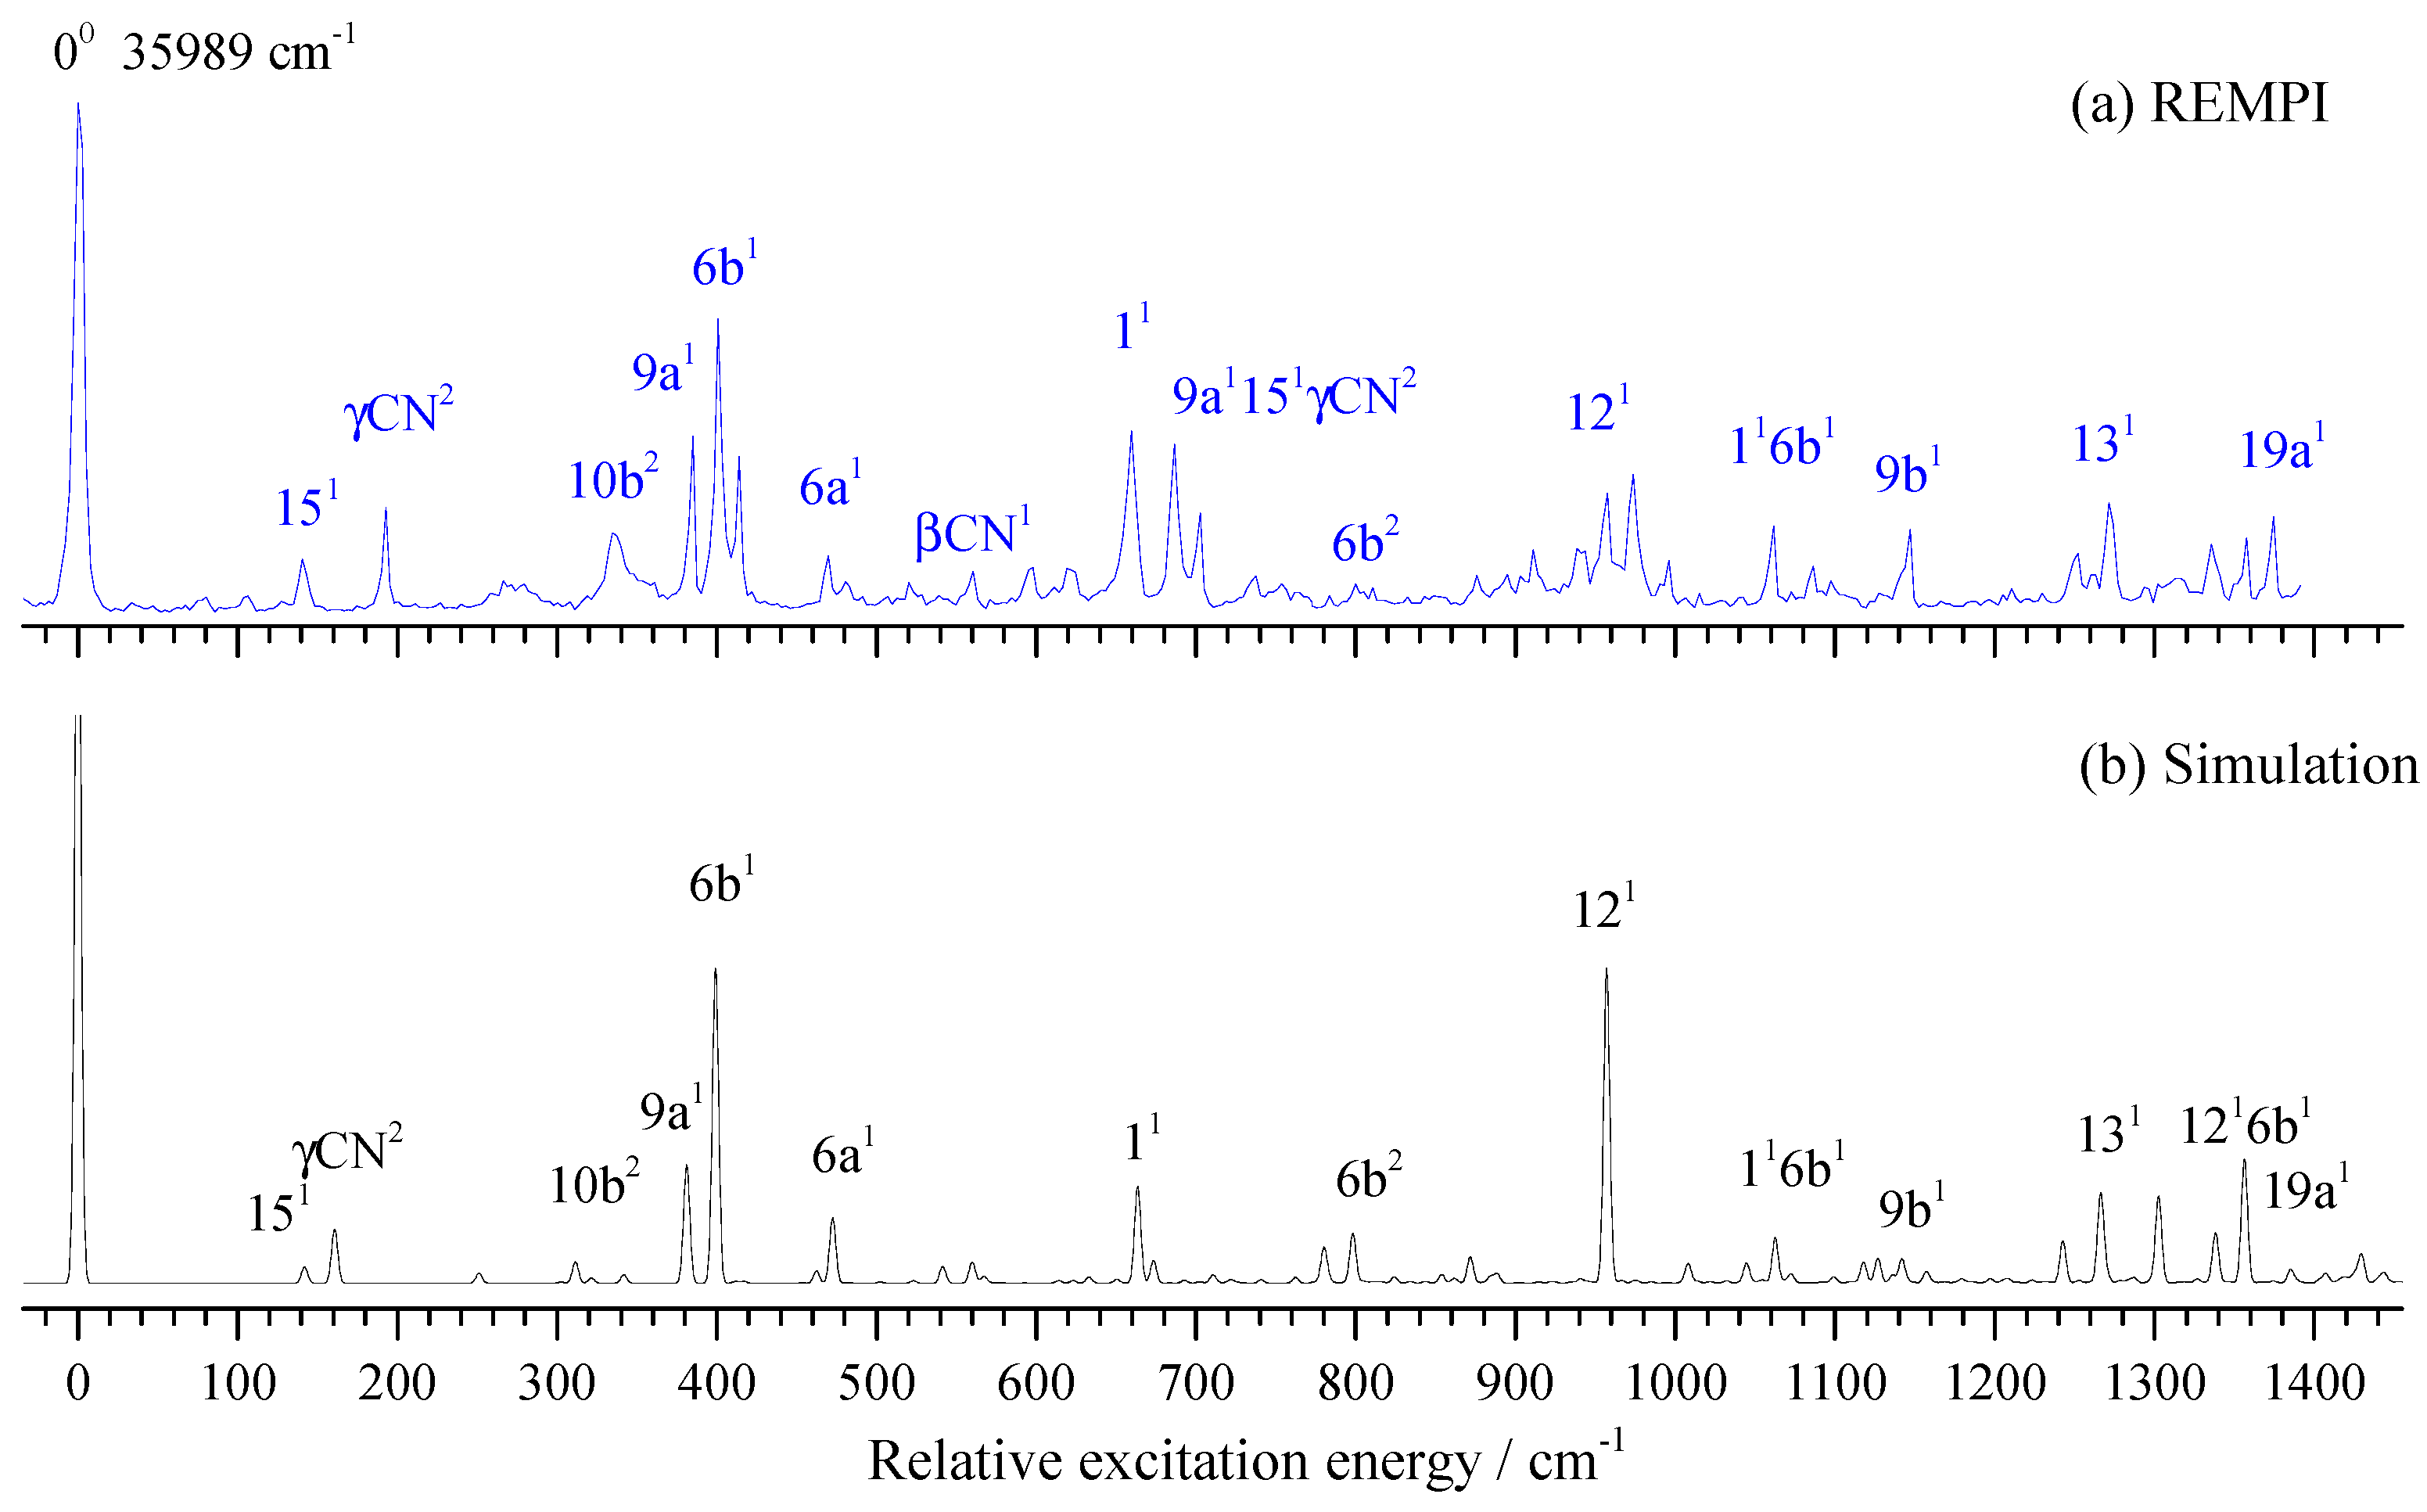
The vibronic spectrum in the S1 state of 3FBN is shown in Figure 6a, together with its Franck–Condon simulation shown in Figure 6b for comparison. The entire simulated spectra appeared comparable to the 2-color REMPI spectra in Figure 6a. The distinct band corresponding to the transition energy of 35,989 cm−1 was identified as the origin of the S1←S0 electronic transition. Table 3 lists the observed vibronic transition energies, along with the energy shifts with respect to the band origin, band relative intensities, and possible assignments. The spectral assignment of 3FBN was accomplished by comparing with those of 4-fluorobenzonitrile, 3-fluorophenol, TD-B3LYP/aug-cc-pvtz calculation, and the Franck–Condon simulation. The spectral features in Figure 6a mainly resulted from vibronic transitions related to the in-plane ring deformation and substituent sensitive bending vibrations. The bands appearing at 140, 385, 401, 470, 560, 660, 958, 1147, 1271, and 1374 cm−1 were assigned to in-plane stretching or bending vibrations 15, 9a, 6b, 6a, βCN, 1, 12, 9b, 13, and 19a, respectively. The out-of-plane overtone vibrations γ(CN)2 and 10b2 were also observed in lower frequency regions. Other bands were assigned to combination vibrations of several modes.

2.5. PIE Spectra of 3FBN

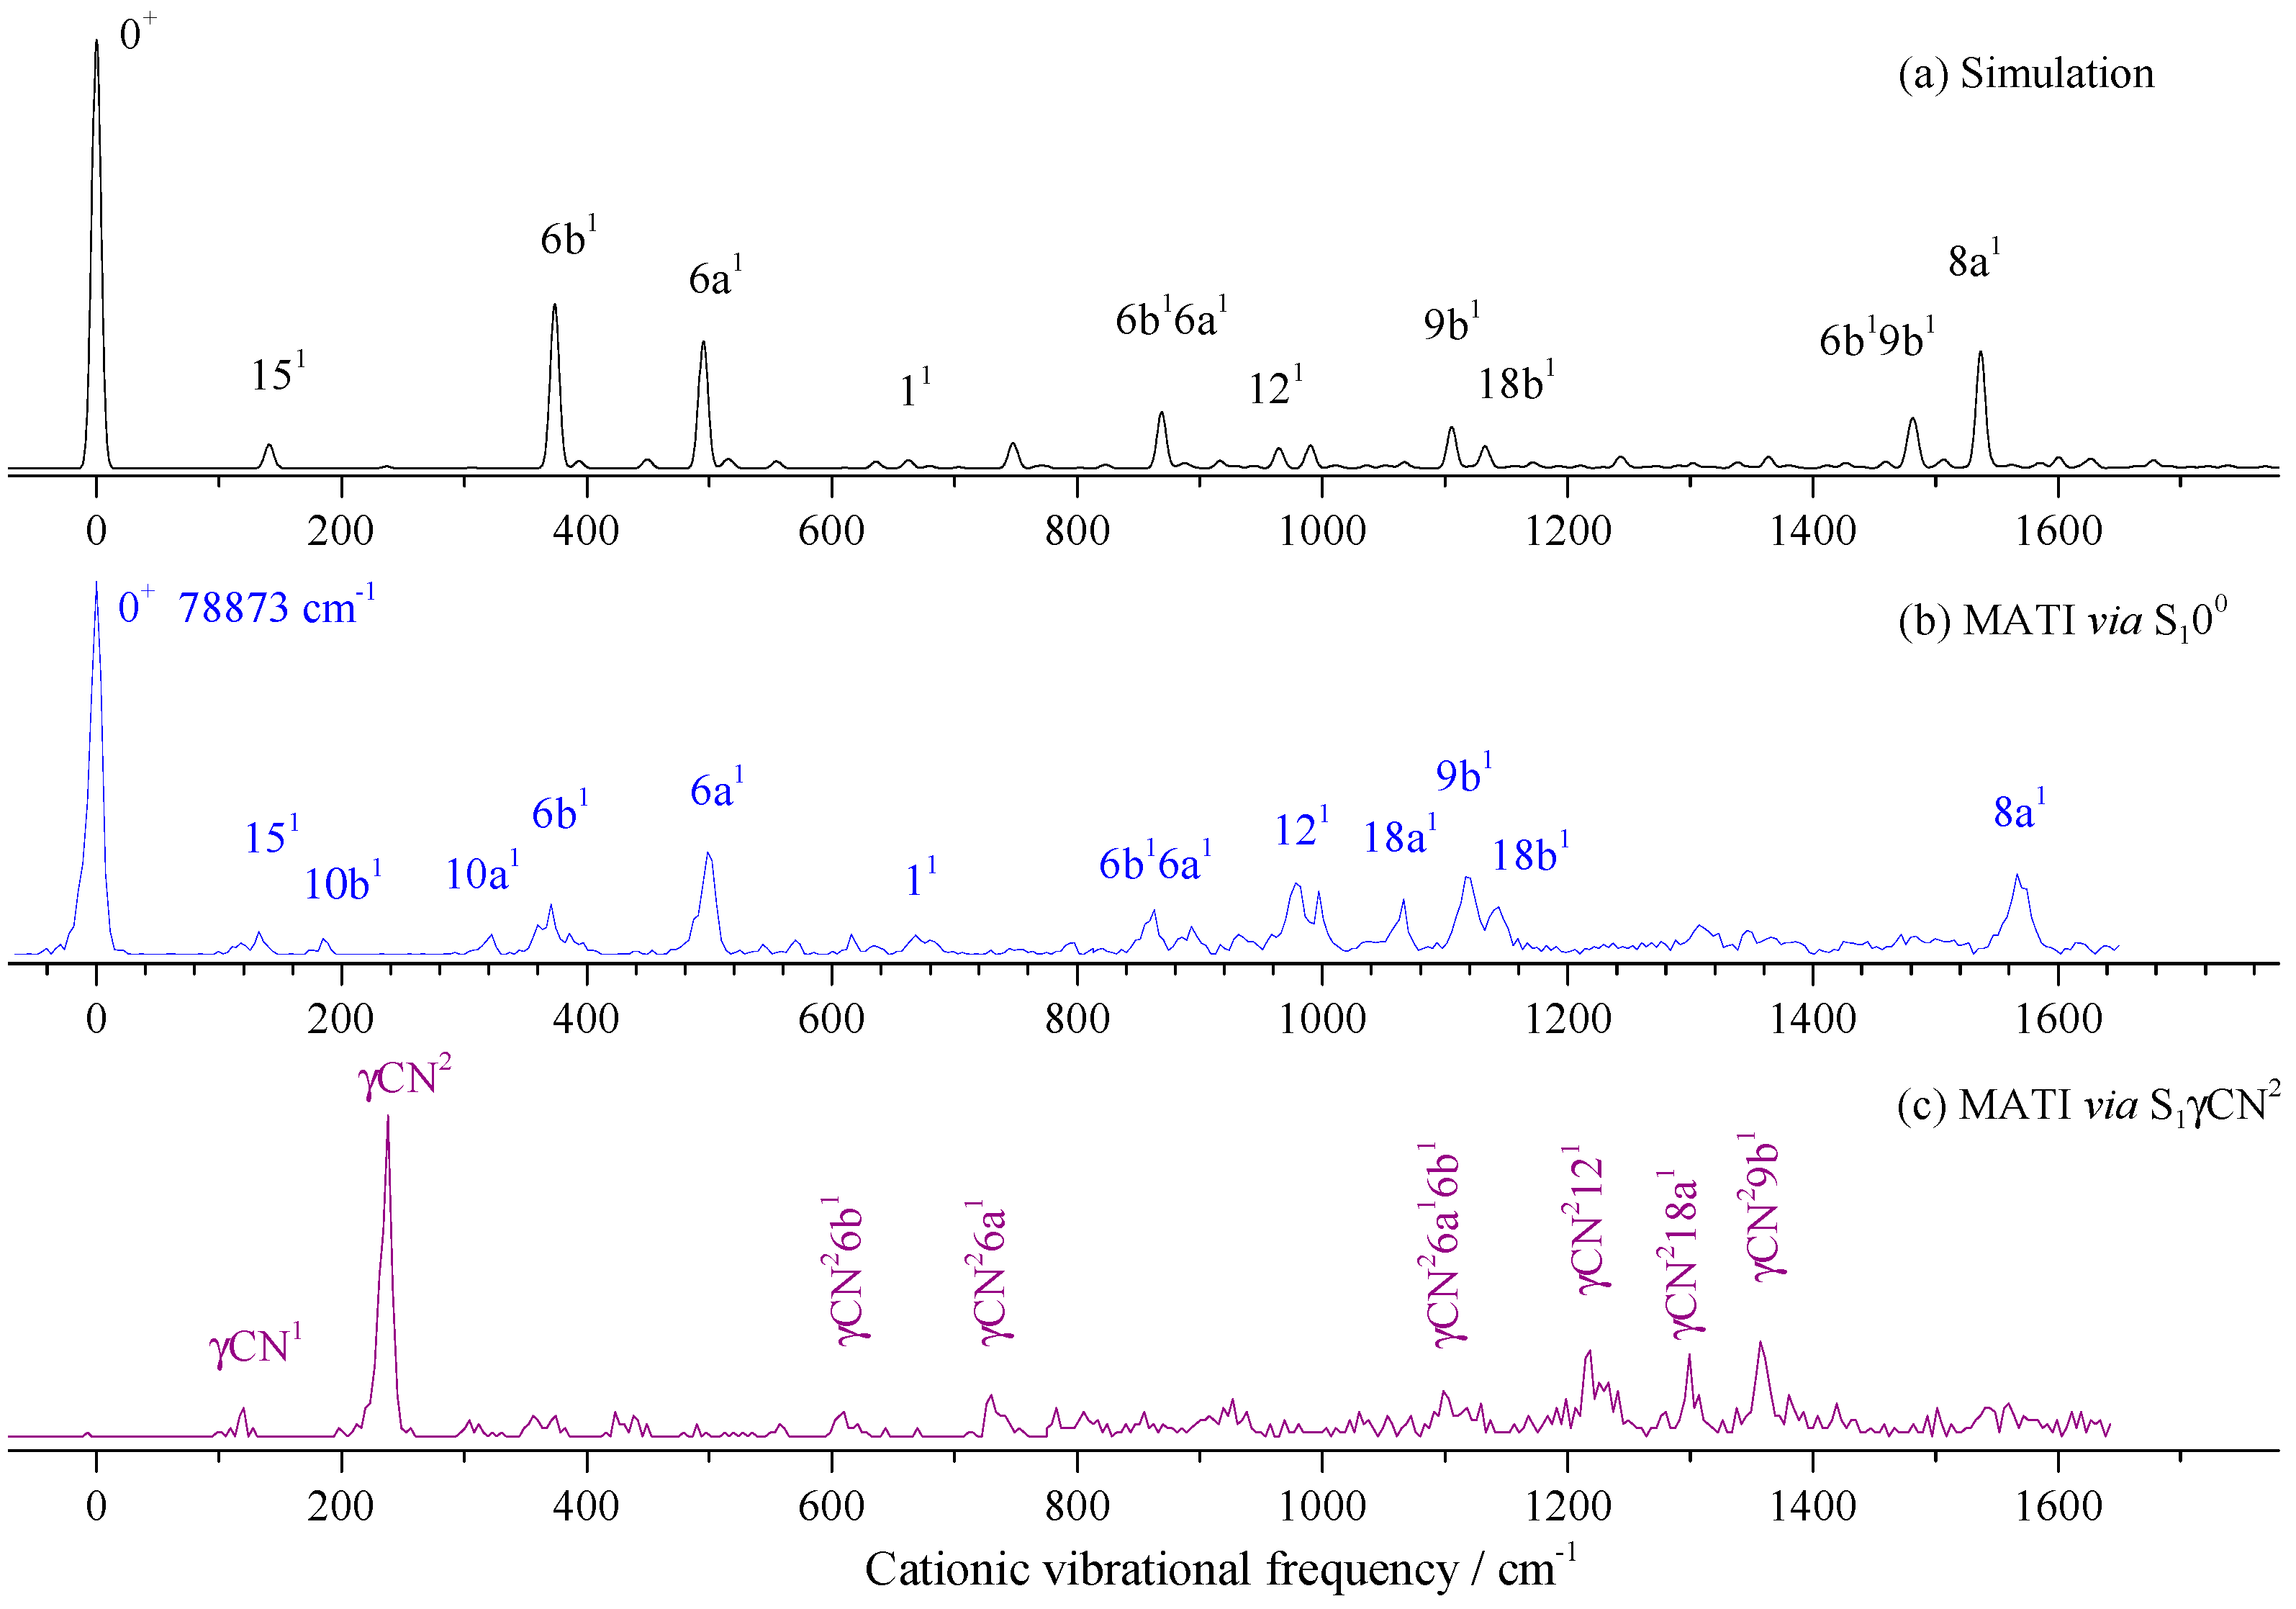
Similar to the 2FBN, ionization energy was very important for the cationic spectral measurements. We first performed the PIE experiment to determine the IE of 3FBN to be 78,873 ± 10 cm−1. Then, we measured the MATI spectra to give the precise IE of 3FBN to be 78,873 ± 5 cm−1. The PIE and MATI spectra via S100 are shown in Figure 7a,b for comparison. It was obvious that they were very consistent.

2.6. MATI Spectra of 3FBN

Figure 8a,b show the calculated Franck–Condon spectrum and measured MATI spectrum via S100 state at 35,989 cm−1, respectively. We can see that they were in good agreement. Many in-plane vibrations were active, such as modes 15, 6b, 6a, 1, 12, 18a, 9b, 18b, 13, and 8a appearing at 133, 371, 498, 668, 978, 1066, 1117, 1144, 1307, and 1566 cm−1, respectively. Out-of-plane bending modes 10b and 10a were also observed, but they were weak. Other bands were assigned to combinations of several modes. All the experimental and calculated cationic vibrational frequencies of 3FBN and corresponding assignments are listed in Table 4.
When measuring the MATI via S1γCN2 (Figure 8c), the distinct feature at 238 cm−1 was assigned to D0γCN2, which followed the propensity rule Δν = 0. The fundamental vibration γCN1 was also observed at 120 cm−1, with a weak intensity, which did not appear in the REMPI spectrum. Other bands were assigned to combination vibrations of γCN2 and fundamental vibrations.
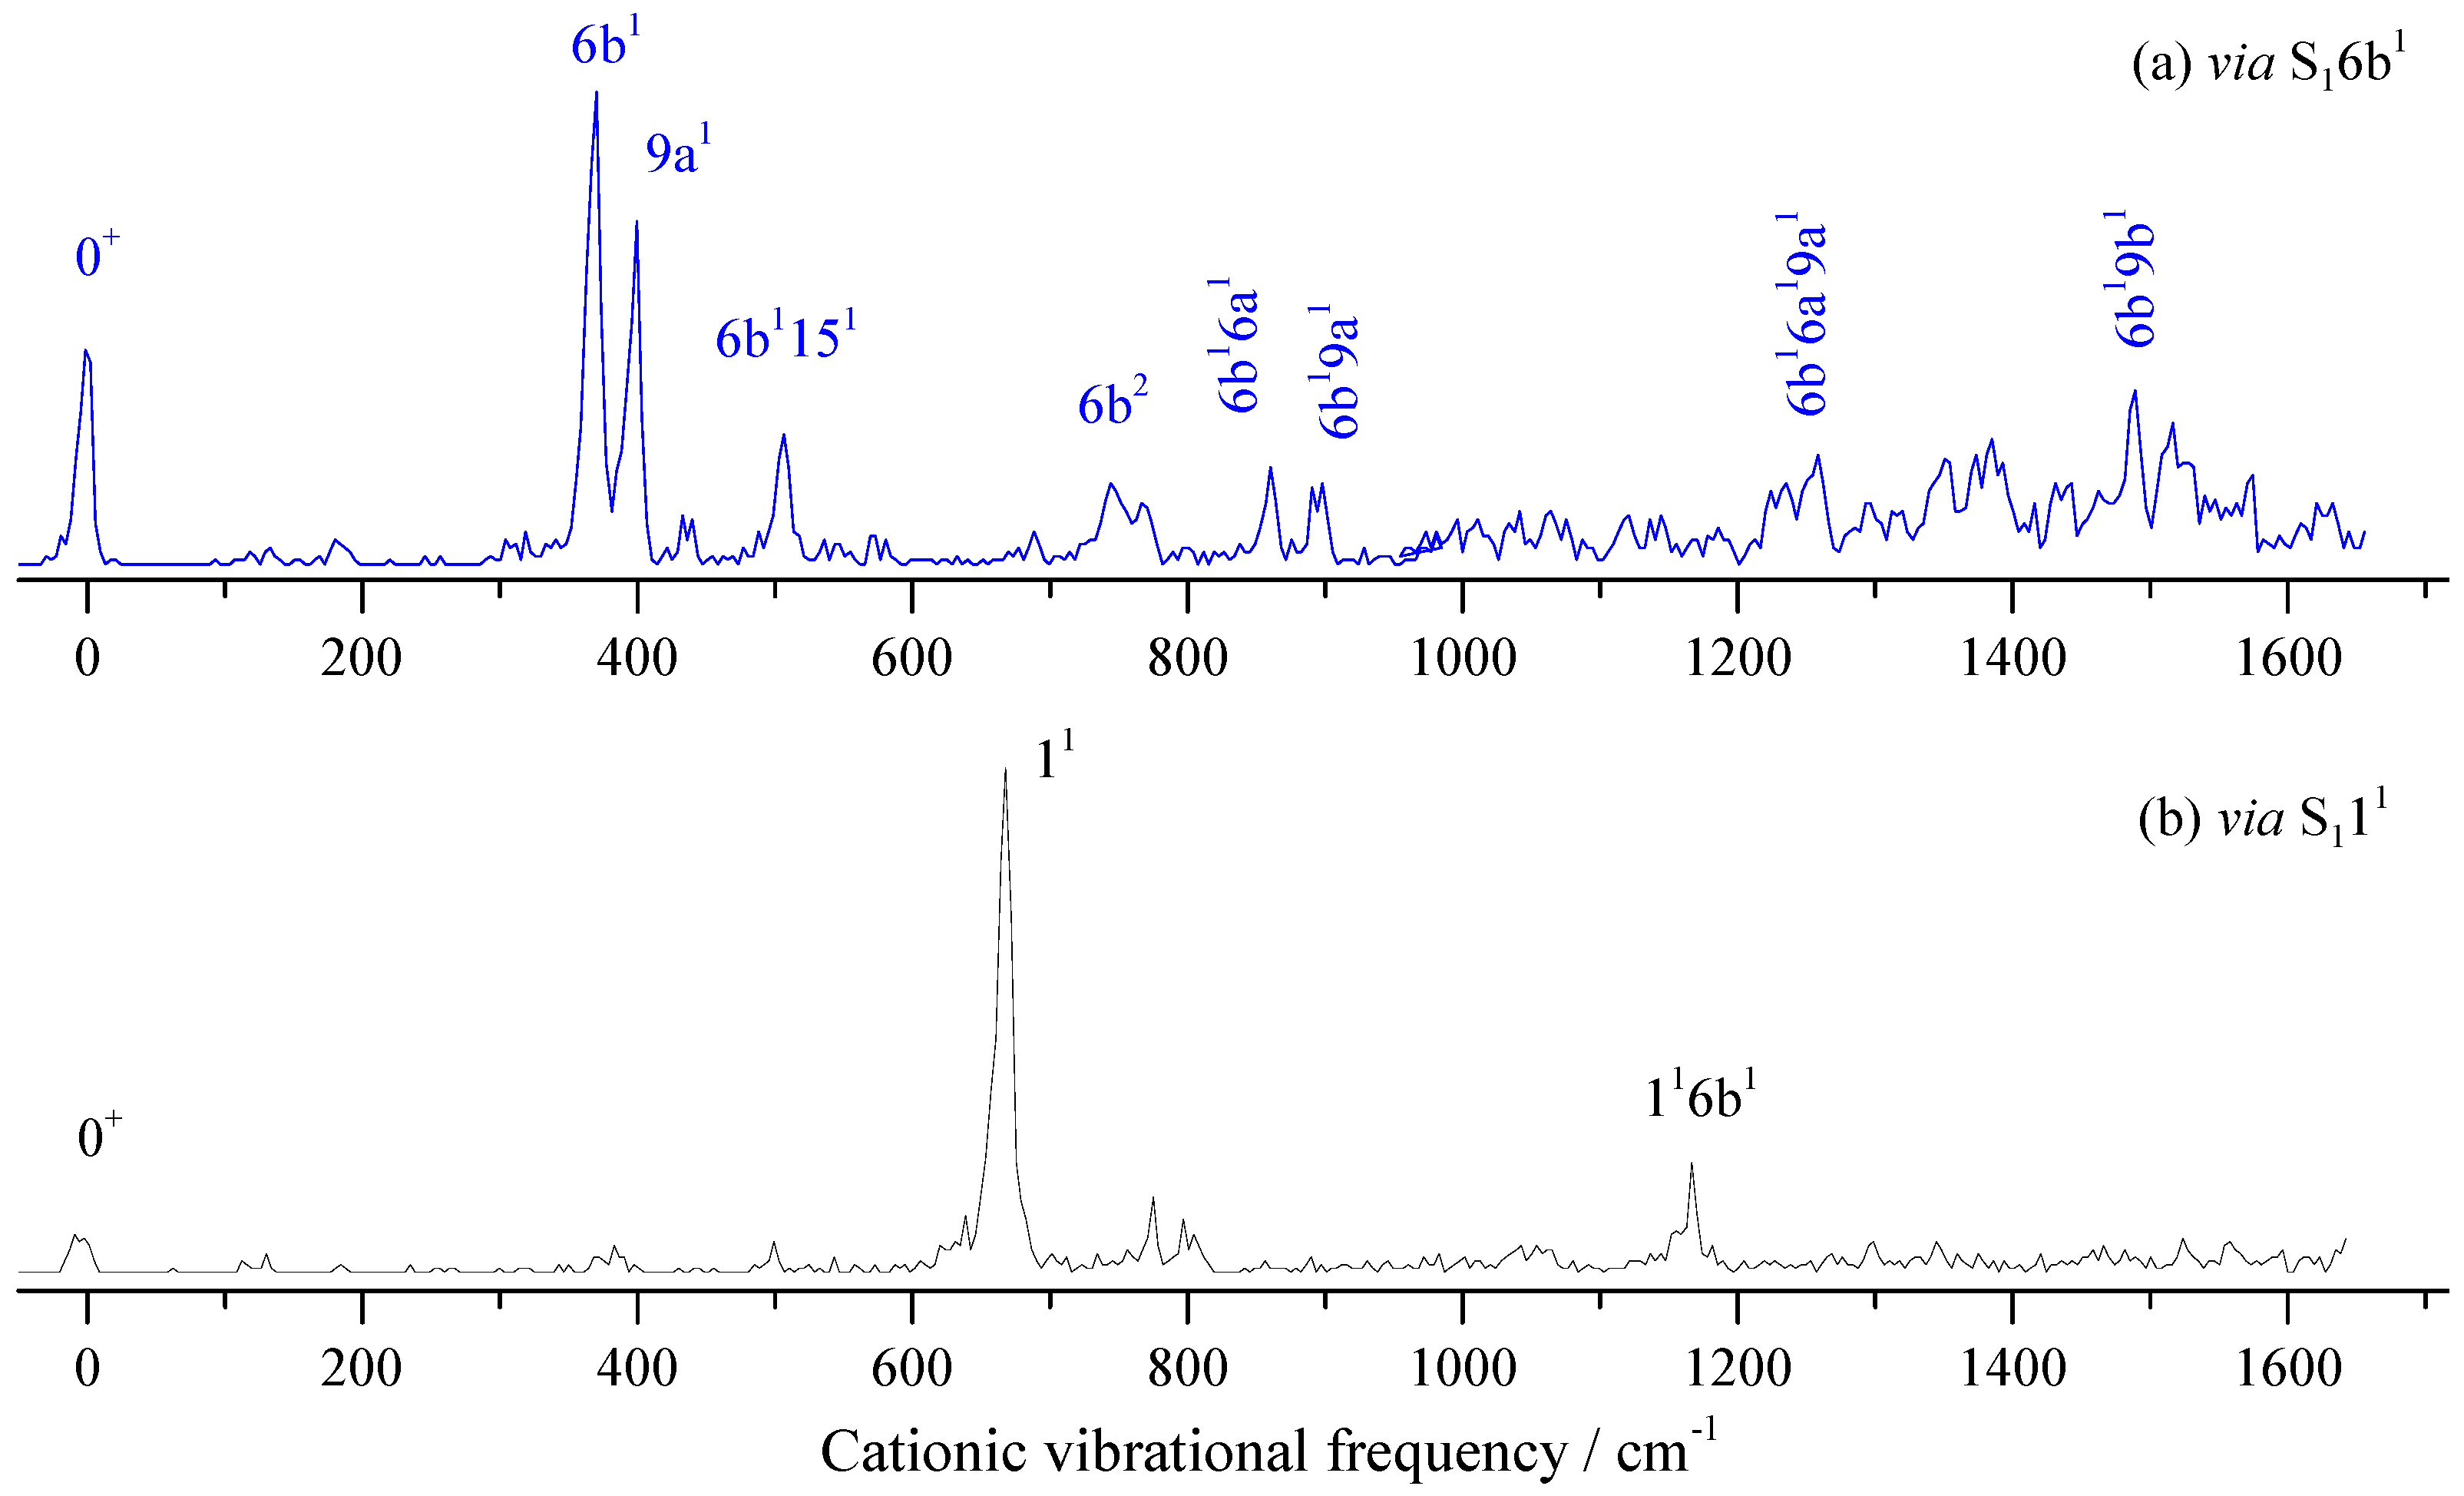
When measuring the MATI via S16b1, as shown in Figure 9a, the distinct feature at 370 cm−1 was assigned to D06b1, which followed the propensity rule Δν = 0. The intense band at 399 cm−1 was assigned to 9a1. Other bands were assigned to combination vibrations of 6b1 and fundamental vibrations. Figure 9b shows the MATI spectrum via S111, where the cationic vibration 11 (668 cm−1) was most intense. The bands at 775, 803, and 1166 cm−1 were assigned to combination vibrations 4110b1, 11151, and 116b1, respectively.

3. Discussion

3.1. Breathing Vibrational Band of 2FBN

Whether the vibrational spectra of excited state S1 or cationic ground state D0, the frequencies of different vibrations in the high-frequency region may have been very close or even the same, which may have come from the fundamental, overtone, or combination vibrations. For example, the breathing vibration 11 of 2FBN in the REMPI spectrum (see Figure 2a) appeared at 668 cm−1. The theoretical calculation showed that there were also two weaker vibrations 16a110a1 and 6b2, whose vibrational frequencies were close to that of mode 11. The calculated vibration frequencies of 16a110a1, 11, and 6b2 were 665.2 cm−1, 667.5 cm−1 and 669.7 cm−1, respectively. They were so close that the spaces between them were less than the experimental resolution, which led to a wide spectral band in the REMPI spectrum. When using this band as the intermediate state to perform the MATI experiment, according to the propensity rule of Δν = 0, these three vibrational modes of cation may be observed with great intensity. Generally, the vibration frequency of cation is slightly different from that of the excited state for the same vibrational mode and the frequency change can be not consistent for various vibration modes. So, these three vibration modes of cation of 2FBN may be separated in the MATI spectrum. As shown in Figure 5a, the cationic mode 11 appeared at 687 cm−1, 6b2 appeared at 672 cm−1, and 10a1 and 10a2 were also observed at 322.7 and 643.2 cm−1, respectively. The strength of the MATI signal was not only related to the Franck–Condon factor but also to the population of the intermediate state S1 and further related to the resonance degree of each vibration mode with the excitation (S1 ← S0) photon frequency. The experimental results demonstrated that the superposition band of several vibrations could be used as an intermediate state to perform the MATI experiments and more vibrational modes of cation could be observed.

3.2. Molecular Structure in S0, S1, and D0 States and Vibrational Frequencies

Theoretical calculations showed that the stable configurations of the ground state S0, excited state S1, and cationic ground state D0 of 2FBN and 3FBN molecules all had Cs symmetry and all the atoms were in the ring plane. This was consistent with their large Franck–Condon factors, intense REMPI and MATI signals, and MATI spectra, following the propensity rule of Δν = 0. However, in the transitions of S1 ← S0 and D0 ← S1, the bond length and bond angle of molecules changed slightly. Table 5 and Table 6 show the bond lengths and bond angles of the S0, S1, and D0 states of 2FBN and 3FBN calculated at levels of RB3LYP/ang-cc-pvtz, TD-B3LYP/ang-cc -pvtz, and UB3LYP/ang-cc-pvtz, respectively. It can be seen that the bond lengths between adjacent carbon atoms of the ring of 2FBN were very close to the corresponding bond lengths of 3FBN. After the transition of S1 ← S0, each C−C bond length increased, resulting in the perimeters of ring of 2FBN and 3FBN increasing by 0.160 Å and 0.158 Å, respectively. The transition of D0 ← S1 led to the shortening of four C−C bonds and the lengthening of two C−C bonds. The overall effect of D0 ← S1 transition was that the perimeters of ring of 2FBN and 3FBN decreased by 0.073 Å and 0.072 Å, respectively. Further, the ring C−C bond lengths of D0 state was averagely larger than that of S0 state. The perimeters of the aromatic ring of 2FBN and 3FBN at the cationic ground states were 0.087 Å and 0.086 Å larger than those of the neutral ground state S0, respectively. That is, the perimeters or average bond lengths of the ring in the ground state S0, excited state S1, and cationic ground state D0 met the relationship: S0 < D0 < S1. The length of a chemical bond reflects, to some extent, the strength of that bond. The greater the bond length, the weaker the bond strength. The frequency of an ideal oscillator is proportional to the square root of the bond strength, so the larger the bond length, the lower the vibration frequency. On this basis, we could predict that, on average, the vibration frequencies of the ground state S0, the excited state S1, and the cationic ground state D0 met the relationship: S0 > D0 > S1. The 33 normal vibration frequencies calculated at the B3LYP/ang-cc-pvtz level of 3FBN were statistically analyzed. On average, the vibration mode frequency of the ground state S0 was about 21 cm−1 greater than that of the cationic ground state D0 and the vibration frequency of D0 was about 43 cm−1 greater than that of S1. For example, the frequencies of breathing vibration mode 1 for S0, D0, and S1 of 2FBN measured in the experiment were 724 [18], 685, and 668 cm−1, respectively; for mode 12, they were 835 [18], 823, and 815 cm−1, respectively; for mode 18b, they were 1100 [18], 973, and 946 cm−1, respectively. The reported experimental and theoretical data of mFBT and mDFB [47] also indicated that most of the vibrational modes of these two molecules followed this rule. Furthermore, from the above vibration data, we know that the frequency variation was larger for the out-of-plane mode (such as 18b of 2FBN) than for the in-plane mode (such as modes 1 and 12 of 2FBN). Our DFT theoretical results showed that this law held for most vibration modes of benzene derivative.
For 2FBN and 3FBN, the bond lengths of C−N in S0 state were equal (1.152 Å), also equal in S1 state (1.165 Å), and almost equal in D0 state (1.158 and 1.155 Å). This means that the C−N bond was very strong and did not change with the substitution position (ortho- or meta-). The C−F bond length yielded a slight change, with different substitution positions.
The aromatic ring included six bond angles of C−C−C. In the electronic transition, the bond angle of the ring also underwent a certain degree of change. Four angles had a variation of approximately 2–3° and the other two had relatively small changes. In the transitions of S1 ← S0 and D0 ← S1, variations of the bond angle and bond length of rings led to the ring expansion and contraction, further activating a large number of in-plane vibration modes. Most of the observed vibronic features in the experiments were assigned to in-plane vibrations, only a few of out-of-plane modes were observed. Many benzene derivative molecules have exhibited such characteristics [48,49,50,51,52,53].

3.3. Substitution Effect on Ionization Energy

Molecular IE is an important parameter of molecular characteristics. In order to study the effect of fluorine and CN substitutions on ionization energy, we listed the IEs of benzene [54], fluorobenzene [55], benzonitrile [56], 2-fluorobenzonitrile, 3-fluorobenzonitrile, p-fluorobenzonitrile [21], phenol [57], o-fluorophenol [58], m-fluorophenol [59,60], and p-fluorophenol [11] in Table 7 and divided them into four groups for comparison. First, we found that three molecular IEs reduced with respect to their parent molecules, i.e., for the fluorine substitution, the ionization energy of fluorobenzene, 4-fluorophenol, and 4-fluorobenzonitrile was reduced by 330, 490, and 48 cm−1 compared with their parent molecules, respectively, where fluorine played a role of electron donor. However, fluorine-substituted ortho and meta benzonitrile slightly increased the IEs by 160 and 383 cm−1, respectively; fluorine-substituted ortho and meta (cis and trans) phenols increased the IEs by 1381, 1563, and 1824 cm−1, respectively. For these substitutions, fluorine exhibited electron withdrawing properties. It could be seen that the role of fluorine changed with the characteristics of the parent molecule and different substitution positions. Unlike fluorine substitution, CN-substituted benzene and fluorobenzene at ortho, meta, and para positions increased the ionization energy by 3933, 4423, 4646, and 3773 cm−1, respectively, playing a role of strong electron withdrawing.
In addition, we can see from Table 7 that the effects of ortho and meta substitution on ionization energy were very close, while the effect of para substitution was relatively weak. Moreover, the IEs of molecules formed by ortho, meta, and para substitutions met the relative relationship: para < ortho < meta. Most benzene derivative molecules followed this rule.

4. Materials and Methods

4.1. Experimental Methods

The 2-fluorobenzonitrile and 3-fluorobenzonitrile samples were purchased from J&K Chemical and Sigma-Aldrich company, respectively. They were used without further purification. They were a colorless or a light brown liquid with a purity of 99%. The sample was heated to about 130 °C for 2FBN and 60 °C for 3FBN to obtain sufficient vapor pressure. Then, 3 bar krypton for 2FBN and 2.5 bar argon for 3FBN were used as the carrier gases; they carried the sample molecules into the beam source chamber through a pulse valve of 0.5 mm diameter nozzle (0.8 mm for 3FBN). Then, the molecule beam entered the ionization chamber through a skimmer located 20 mm downstream from the nozzle orifice. The vacuum pressures of the beam source and ionization chambers were ~4 × 10⁻⁴ Pa and ~6 × 10⁻⁶ Pa, respectively.
The light source consisted of two sets of dye lasers pumped by YAG lasers. One dye laser (CBR-D-24, Sirah) pumped by a frequency-tripled Nd: YAG laser (Qsmart 850, Quantel) was used as the excitation laser. Another dye laser (Precision Scan-D, Sirah) pumped by another frequency-tripled Nd: YAG laser (Qsmart 850, Quantel) was used as the ionization laser for two-color REMPI or probe laser for MATI experiments. The dyes of coumarin 540A and coumarin 460 or coumarin 480 were used for the excitation and ionization lasers, respectively. The dye laser wavelengths were calibrated by a wavemeter (WS7-60 UV-I). The fundamental outputs of the dye lasers were further frequency-doubled by BBO crystals.
Due to the strong electron-withdrawing ability of the CN group, the transition energies of S1 ← S0 were lower than those of D0 ← S1 for 2FBN and 3FBN. Such an energy structure indicated that two sets of light sources were required for the measurement of excited state spectra. In the REMPI experiments, we fixed the ionization laser at 232 nm, then scanned the excitation laser from 265 to 279 nm to obtain vibronic spectra of the first electronically excited state S1 for 2FBN and 3FBN.
In the MATI experiments, the molecules in neutral ground state S0 were resonantly excited to specific vibronic levels in the S1 state, further excited to the high Rydberg state by the probe laser, which had a scanning range of 224–240 nm. A −0.5 V/cm pulsed electric field was applied to remove the prompt ions. After a time delay of about 29 μs, the Rydberg molecules were ionized by a 143 V/cm pulsed electric field. Newly formed threshold ions passed through a 48 cm field-free region to be detected by a microchannel plate (MCP) detector. The signal was collected by a multichannel scaler (SRS: SR430) and recorded by a computer. Each mass spectrum was accumulated for 300 laser shots. The time sequence of the whole system was controlled by a pulse delay generator (SRS: DG645). More details on the experimental system have been described in our previous publications [61,62,63].

4.2. Theoretical Methods

All calculations were performed using the Gaussian 16 program package [64]. The geometry optimization and vibrational frequencies of S0, S1, and D0 states were calculated at the levels of RB3LYP/aug-cc-pvtz, TD-B3LYP/aug-cc-pvtz, and UB3LYP/aug-cc-pvtz, respectively. Prior to the experiments, we also used the G4 and CBS-QB3 methods to predict IEs in order to select the appropriate dyes. The theoretical predicted adiabatic ionization energies (AIEs) by CBS-QB3 and G4 for 2FBN were 79,111 and 78,972 cm−1, respectively, with relative errors of +0.59% and +0.41%. The predicted AIEs by CBS-QB3 and G4 for 3FBN were 79,480 and 79,043 cm−1, respectively, with relative errors of +0.77% and +0.22%. The spectral simulations were performed based on the above B3LYP/aug-cc-pvtz calculations, which provided reliable accuracy. The broadening of the REMPI spectral lines was mainly caused by the Doppler effect, while the width of the MATI spectral lines was mainly caused by the ionization field applied to the Rydberg state. The Gaussian line shape, adiabatic Hessian, and time-independent model were used in constructing the spectra [65]. Combined with the theoretical calculations and simulated spectra, the vibrational features of 2FBN and 3FBN measured by the REMPI and MATI experiments were assigned.

5. Conclusions

The high-resolution vibrational spectra of the first electronically excited state S1 and cationic ground state D0 of 2-fluorobenzonitrile and 3-fluorobenzonitrile were measured by two-color resonance-enhanced multiphoton ionization and mass-analyzed threshold ionization spectroscopy. The precise band origins of S1 ← S0 transition and adiabatic ionization energies were determined to be 36,028 ± 2 cm−1 and 78,650 ± 5 cm−1 for 2-fluorobenzonitrile and 35,989 ± 2 cm−1 and 78,873 ± 5 cm−1 for 3-fluorobenzonitrile, respectively. DFT theory at the level of B3LYP/aug-cc-pvtz was used to calculate the molecular structure, vibrational frequency, and to further perform the Franck–Condon simulations. The theoretical results were in good agreement with the experimental measurements. The vibrational features of S1 and D0 states were analyzed in detail and assigned.
The MATI spectra followed well the propensity rule Δν = 0, indicating that the molecular structures of the cationic ground states were similar to that of the excited states. The molecular structures and vibration frequencies in S0, S1, and D0 states were discussed in detail. The ring C-C bond lengths in S0, S1, and D0 states averagely obeyed the rule of S1 > D0 > S0. The bond length reflected the bond strength; further, the bond length was related to the vibration frequency. On average, or for most vibrational modes, the vibration frequencies of the ground state S0, excited state S1, and cationic ground state D0 met the relative relationship: S1 < D0 < S0. At the transition of S1 ← S0 and D0 ← S1, a lot of vibrational modes associated with ring in-plane distortion were active and only a few out-of-plane fundamental vibrations were observed. The substitution effects of F and CN were discussed. Whether the electron donating group or the electron withdrawing group, the ionization energies of molecules formed by ortho, meta, and para substitutions meet the relative relationship: para < ortho < meta.

Author Contributions

Conceptualization, C.L. and S.J.; investigation, S.L. and Y.Z.; writing—original draft preparation, C.L. and S.L.; writing—review and editing, C.L. and Y.Z.; funding acquisition, Y.J., J.Z. and S.J. All authors have read and agreed to the published version of the manuscript.

Funding

This research was funded by the National Natural Science Foundation of China (Grants Nos. 61835007, 12241408, 61575115), PCSIRT (Grant No. IRT_17R70), 111 project (Grant No. D18001), and the Fund for Shanxi “1331 Project” Key Subjects Construction.

Institutional Review Board Statement

Not applicable.

Informed Consent Statement

Not applicable.

Data Availability Statement

The data that support the findings of this study are available from the corresponding author upon reasonable request.

Conflicts of Interest

The authors declare no conflict of interest.

Sample Availability

Samples of 2-fluorobenzonitrile and 3-fluorobenzonitrile are available from commercial sources.

References

  1. Berger, R.; Resnati, G.; Metrangolo, P.; Weber, E.; Hulliger, J. ChemInform Abstract: Organic Fluorine Compounds: A Great Opportunity for Enhanced Materials Properties. ChemInform 2011, 42, 3496–3508. [Google Scholar] [CrossRef]
  2. Ametamey, S.M.; Honer, M.; Schubiger, P.A. Molecular imaging with PET. Chem. Rev. 2008, 108, 1501–1516. [Google Scholar] [CrossRef]
  3. Müller, K.; Faeh, C.; Diederich, F. Fluorine in pharmaceuticals: Looking beyond intuition. Science 2007, 317, 1881–1886. [Google Scholar] [CrossRef] [Green Version]
  4. Jeschke, P. The unique role of fluorine in the design of active ingredients for modern crop protection. Chembiochem 2004, 5, 571–589. [Google Scholar] [CrossRef]
  5. Krüger, S.; Witte, F.; Helfrich, J.; Grotemeyer, J. Mass-analyzed-threshold-ionization (MATI) spectroscopy of 1,2,3-substituted halogenated benzenes via different intermediate vibrational states in the S1 state. RSC Adv. 2015, 5, 937–948. [Google Scholar] [CrossRef] [Green Version]
  6. Ling, F.; Li, S.; Song, X.; Tang, Y.; Wang, Y.; Zhang, B. Visualization of coherent nuclear motion between different geometries in photoexcited 2,4-difluorophenol. Phys. Rev. A 2017, 95, 043421. [Google Scholar] [CrossRef]
  7. Ling, F.; Wang, Y.; Li, S.; Wei, J.; Tang, Y.; Zhang, B. Imaging Reversible and Irreversible Structural Evolution in Photoexcited 2,4-Difluoroaniline. J. Phys. Chem. Lett. 2018, 9, 5468–5473. [Google Scholar] [CrossRef]
  8. Sun, W.; Lozada, I.B.; van Wijngaarden, J. Fourier Transform Microwave Spectroscopic and ab Initio Study of the Rotamers of 2-Fluorobenzaldehyde and 3-Fluorobenzaldehyde. J. Phys. Chem. A 2018, 122, 2060–2068. [Google Scholar] [CrossRef]
  9. Sun, W.; van Wijngaarden, J. Structural elucidation of 2-fluorothiophenol from Fourier transform microwave spectra and ab initio calculations. J. Mol. Struct. 2017, 1144, 496–501. [Google Scholar] [CrossRef]
  10. Kamaee, M.; Sun, M.; Luong, H.; van Wijngaarden, J. Investigation of Structural Trends in Mono-, Di-, and Pentafluorobenzonitriles Using Fourier Transform Microwave Spectroscopy. J. Phys. Chem. A 2015, 119, 10279–10292. [Google Scholar] [CrossRef]
  11. Zhang, B.; Li, C.; Su, H.; Lin, J.L.; Tzeng, W.B. Mass analyzed threshold ionization spectroscopy of p-fluorophenol cation and the p-fluoro substitution effect. Chem. Phys. Lett. 2004, 390, 65–70. [Google Scholar] [CrossRef]
  12. Huang, J.; Huang, K.; Liu, S.; Luo, Q.; Tzeng, W. Vibrational spectra and theoretical calculations of p-chlorophenol in the electronically excited S1 and ionic ground D0 states. J. Photochem. Photobiol. A Chem. 2008, 193, 245–253. [Google Scholar] [CrossRef]
  13. Ratzer, C.; Nispel, M.; Schmitt, M. Structure of 4-fluorophenol and barrier to internal –OH rotation in the S1-state. Phys. Chem. Chem. Phys. 2003, 5, 812–819. [Google Scholar] [CrossRef]
  14. Zhang, L.; Liu, S.; Cheng, M.; Du, Y.; Zhu, Q. Vibrational Spectra and Theoretical Calculations of cis- and trans-3-Fluoro-N-methylaniline in the Neutral (S0) and Cationic (D0) Ground States. J. Phys. Chem. A 2016, 120, 81–94. [Google Scholar] [CrossRef]
  15. Arivazhagan, M.; Meenakshi, R.; Prabhakaran, S. Vibrational spectroscopic investigations, first hyperpolarizability, HOMO-LUMO and NMR analyzes of p-fluorobenzonitrile. Spectrochim. Acta A Mol. Biomol. Spectrosc. 2013, 102, 59–65. [Google Scholar] [CrossRef]
  16. Da Ribeiro Silva, M.A.V.; Monte, M.J.S.; Rocha, I.M.; Cimas, A. Energetic study applied to the knowledge of the structural and electronic properties of monofluorobenzonitriles. J. Org. Chem. 2012, 77, 4312–4322. [Google Scholar] [CrossRef]
  17. Varadwaj, P.R.; Jaman, A.I. Centrifugal distortion analysis of the millimeter-wave spectrum of 2-fluorobenzonitrile and ab initio DFT calculations. J. Mol. Spectrosc. 2006, 236, 70–74. [Google Scholar] [CrossRef]
  18. Kumar, A.P.; Rao, G.R. Vibrational analysis of substituted benzonitriles. I. Vibrational spectra, normal coordinate analysis and transferability of force constants of monohalogenated benzonitriles. Spectrochim. Acta A Mol. Biomol. Spectrosc. 1997, 53A, 2023–2032. [Google Scholar] [CrossRef]
  19. Palmer, M.H.; Moyes, W.; Spiers, M. The electronic structure of substituted benzenes: Ab initio calculations and photoelectron spectra for benzonitrile, the tolunitriles, fluorobenzonitriles, dicyanobenzenes and ethynylbenzene. J. Mol. Struct. 1980, 62, 165–187. [Google Scholar] [CrossRef]
  20. Jiang, S.; Levy, D.H. Supersonic Jet Studies on the Photophysics of Substituted Benzenes and Naphthalenes. J. Phys. Chem. A 2002, 106, 8590–8598. [Google Scholar] [CrossRef]
  21. Zhao, Y.; Jin, Y.; Hao, J.; Yang, Y.; Li, C.; Jia, S. Resonance enhanced multiphoton ionization and mass analyzed threshold ionization spectroscopy of 4-fluorobenzonitrile. Chem. Phys. Lett. 2018, 711, 127–131. [Google Scholar] [CrossRef]
  22. Eom, S.Y.; Lee, Y.R.; Kwon, C.H. Accurate conformational stability and cationic structure of piperidine determined by conformer-specific VUV-MATI spectroscopy. Phys. Chem. Chem. Phys. 2020, 22, 22823–22832. [Google Scholar] [CrossRef] [PubMed]
  23. Park, S.M.; Lee, Y.R.; Kwon, C.H. Conformational Structures of Neutral and Cationic Pivaldehyde Revealed by IR-Resonant VUV-MATI Mass Spectroscopy. Int. J. Mol. Sci. 2022, 23, 14777. [Google Scholar] [CrossRef] [PubMed]
  24. Lee, Y.R.; Kwon, C.H. Valence molecular orbitals and cationic structures of 2-fluoropyridine by high-resolution ion spectroscopy and Franck-Condon fitting. J. Chem. Phys. 2022, 157, 154306. [Google Scholar] [CrossRef]
  25. Lee, Y.R.; Kwon, C.H. Innovative mass spectrometer for high-resolution ion spectroscopy. J. Chem. Phys. 2021, 155, 164203. [Google Scholar] [CrossRef]
  26. Eom, S.Y.; Lee, Y.R.; Park, S.M.; Kwon, C.H. Determination of the highest occupied molecular orbital and conformational structures of morpholine based on its conformer-specific photoionization dynamics. Phys. Chem. Chem. Phys. 2022, 24, 28477–28485. [Google Scholar] [CrossRef]
  27. Eom, S.Y.; Kang, D.W.; Kwon, C.H. Conformational structure of cationic tetrahydropyran by one-photon vacuum ultraviolet mass-analyzed threshold ionization spectroscopy. Phys. Chem. Chem. Phys. 2021, 23, 1414–1423. [Google Scholar] [CrossRef]
  28. Lee, Y.R.; Kim, H.L.; Kwon, C.H. Determination of the cationic conformational structure of tetrahydrothiophene by one-photon MATI spectroscopy and Franck-Condon fitting. Phys. Chem. Chem. Phys. 2020, 22, 6184–6191. [Google Scholar] [CrossRef]
  29. Kang, D.W.; Yoon, D.K.; Kwon, C.H. Conformational potential energy surfaces and cationic structure of 3,4-dihydro-2H-pyran by VUV-MATI spectroscopy and Franck-Condon fitting. Phys. Chem. Chem. Phys. 2020, 22, 27673–27680. [Google Scholar] [CrossRef]
  30. Ketkov, S.Y.; Tzeng, S.-Y.; Rychagova, E.A.; Markin, G.V.; Makarov, S.G.; Tzeng, W.-B. Laser spectroscopic and computational insights into unexpected structural behaviours of sandwich complexes upon ionization. Dalton Trans. 2021, 50, 10729–10736. [Google Scholar] [CrossRef]
  31. Ketkov, S.; Tzeng, S.-Y.; Rychagova, E.; Tzeng, W.-B. Ionization of Decamethylmanganocene: Insights from the DFT-Assisted Laser Spectroscopy. Molecules 2022, 27, 6226. [Google Scholar] [CrossRef] [PubMed]
  32. Ketkov, S.Y.; Tzeng, S.Y.; Rychagova, E.A.; Kalakutskaya, L.V.; Fuss, M.; Braunschweig, H.; Tzeng, W.-B. Rydberg state mediated multiphoton ionization of (η7-C7H7)(η5-C5H5)Cr: DFT-supported experimental insights into the molecular and electronic structures of excited sandwich complexes. Phys. Chem. Chem. Phys. 2019, 21, 9665–9671. [Google Scholar] [CrossRef] [PubMed]
  33. Ketkov, S.Y.; Rychagova, E.A.; Tzeng, S.-Y.; Tzeng, W.-B. TD DFT insights into unusual properties of excited sandwich complexes: Structural transformations and vibronic interactions in Rydberg-state bis(η6-benzene)chromium. Phys. Chem. Chem. Phys. 2018, 20, 23988–23997. [Google Scholar] [CrossRef] [PubMed]
  34. Ketkov, S.Y.; Tzeng, S.-Y.; Wu, P.-Y.; Markin, G.V.; Tzeng, W.-B. DFT-Supported Threshold Ionization Study of Chromium Biphenyl Complexes: Unveiling the Mechanisms of Substituent Influence on Redox Properties of Sandwich Compounds. Chemistry 2017, 23, 13669–13675. [Google Scholar] [CrossRef] [PubMed]
  35. Ketkov, S.Y.; Markin, G.V.; Tzeng, S.Y.; Tzeng, W.B. Fine Substituent Effects in Sandwich Complexes: A Threshold Ionization Study of Monosubstituted Chromium Bisarene Compounds. Chemistry 2016, 22, 4690–4694. [Google Scholar] [CrossRef]
  36. Tzeng, S.Y.; Takahashi, K.; Tzeng, W.B. Two-Color Resonant Two-Photon Mass-Analyzed Threshold Ionization of 2,4-Difluoroanisole and the Additivity Relation of Ionization Energy. J. Phys. Chem. A 2020, 124, 10517–10526. [Google Scholar] [CrossRef]
  37. Kemp, D.J.; Whalley, L.E.; Tuttle, W.D.; Gardner, A.M.; Speake, B.T.; Wright, T.G. Vibrations of the p-chlorofluorobenzene cation. Phys. Chem. Chem. Phys. 2018, 20, 12503–12516. [Google Scholar] [CrossRef]
  38. Davies, A.R.; Kemp, D.J.; Wright, T.G. Electronic, vibrational, and torsional couplings in N-methylpyrrole: Ground, first excited, and cation states. J. Chem. Phys. 2021, 154, 224305. [Google Scholar] [CrossRef]
  39. Kemp, D.J.; Gardner, A.M.; Tuttle, W.D.; Midgley, J.; Reid, K.L.; Wright, T.G. Identifying complex Fermi resonances in p-difluorobenzene using zero-electron-kinetic-energy (ZEKE) spectroscopy. J. Chem. Phys. 2018, 149, 094301. [Google Scholar] [CrossRef]
  40. Davies, A.R.; Kemp, D.J.; Wright, T.G. Comment on “Electronic, vibrational and torsional couplings in N-methylpyrrole: Ground, first excited and cation states” [J. Chem. Phys. 154, 224305 (2021)]. J. Chem. Phys. 2021, 155, 117101. [Google Scholar] [CrossRef]
  41. Kemp, D.J.; Fryer, E.F.; Davies, A.R.; Wright, T.G. Vibration-modified torsional potentials and vibration-torsion (“vibtor”) levels in the m-fluorotoluene cation. J. Chem. Phys. 2019, 151, 084311. [Google Scholar] [CrossRef] [PubMed] [Green Version]
  42. Davies, A.R.; Kemp, D.J.; Warner, L.G.; Fryer, E.F.; Rees, A.; Wright, T.G. Variations in Duschinsky rotations in m-fluorotoluene and m-chlorotoluene during excitation and ionization. J. Chem. Phys. 2020, 152, 214303. [Google Scholar] [CrossRef] [PubMed]
  43. Varsányi, G. Assignments for Vibrational Spectra of Seven Hundred Benzene Derivatives; Adam Hilger: London, UK, 1974; ISBN 0852742835. [Google Scholar]
  44. Wilson, E.B. The Normal Modes and Frequencies of Vibration of the Regular Plane Hexagon Model of the Benzene Molecule. Phys. Rev. 1934, 45, 706–714. [Google Scholar] [CrossRef]
  45. Asmis, K.R.; Yang, Y.; Santambrogio, G.; Brümmer, M.; Roscioli, J.R.; McCunn, L.R.; Johnson, M.A.; Kühn, O. Gas-phase infrared spectroscopy and multidimensional quantum calculations of the protonated ammonia dimer N2H7+. Angew. Chem. Int. Ed. Engl. 2007, 46, 8691–8694. [Google Scholar] [CrossRef]
  46. Yang, Y.; Kuhn, O. A concise method for kinetic energy quantisation. Mol. Phys. 2008, 106, 2445–2457. [Google Scholar] [CrossRef] [Green Version]
  47. Davies, A.R.; Kemp, D.J.; Wright, T.G. Unpicking vibration-vibration and vibration-torsion interactions in m-fluorotoluene. J. Mol. Spectrosc. 2021, 381, 111522. [Google Scholar] [CrossRef]
  48. Zhang, L.; Yu, D.; Dong, C.; Cheng, M.; Hu, L.; Zhou, Z.; Du, Y.; Zhu, Q.; Zhang, C. Rotamers and isotopomers of 3-chloro-5-fluoroanisole studied by resonant two-photon ionization spectroscopy and theoretical calculations. Spectrochim. Acta A Mol. Biomol. Spectrosc. 2013, 104, 235–242. [Google Scholar] [CrossRef]
  49. Xu, Y.; Tzeng, S.Y.; Shivatare, V.; Takahashi, K.; Zhang, B.; Tzeng, W.B. Identification of four rotamers of m-methoxystyrene by resonant two-photon ionization and mass analyzed threshold ionization spectroscopy. J. Chem. Phys. 2015, 142, 124314. [Google Scholar] [CrossRef]
  50. Xu, Y.; Tzeng, S.Y.; Zhang, B.; Tzeng, W.B. Rotamers of 3,4-difluoroanisole studied by two-color resonant two-photon mass-analyzed threshold ionization spectroscopy. Spectrochim. Acta A Mol. Biomol. Spectrosc. 2013, 102, 365–370. [Google Scholar] [CrossRef]
  51. Huang, W.C.; Huang, P.S.; Hu, C.H.; Tzeng, W.B. Vibronic and cation spectroscopy of 2,4-difluoroaniline. Spectrochim. Acta A Mol. Biomol. Spectrosc. 2012, 93, 176–179. [Google Scholar] [CrossRef]
  52. Shivatare, V.S.; Kundu, A.; Patwari, G.N.; Tzeng, W.B. Studies of structural isomers o-, m-, and p-fluorophenylacetylene by two-color resonant two-photon mass-analyzed threshold ionization spectroscopy. J. Phys. Chem. A 2014, 118, 8277–8286. [Google Scholar] [CrossRef] [PubMed]
  53. Li, C.; Lin, J.L.; Tzeng, W.B. Mass-analyzed threshold ionization spectroscopy of the rotamers of p-n-propylphenol cations and configuration effect. J. Chem. Phys. 2005, 122, 44311. [Google Scholar] [CrossRef] [PubMed] [Green Version]
  54. Neuhauser, R.G.; Siglow, K.; Neusser, H.J. High n Rydberg spectroscopy of benzene: Dynamics, ionization energy and rotational constants of the cation. J. Chem. Phys. 1997, 106, 896–907. [Google Scholar] [CrossRef]
  55. Lembach, G.; Brutschy, B. Fragmentation energetics and dynamics of fluorobenzene⋅Arn (n = 1–3) clusters studied by mass analyzed threshold ionization spectroscopy. J. Chem. Phys. 1997, 107, 6156–6165. [Google Scholar] [CrossRef]
  56. Araki, M.; Sato, S.; Kimura, K. Two-Color Zero Kinetic Energy Photoelectron Spectra of Benzonitrile and Its van der Waals Complexes with Argon. Adiabatic Ionization Potentials and Cation Vibrational Frequencies. J. Phys. Chem. 1996, 100, 10542–10546. [Google Scholar] [CrossRef]
  57. Dopfer, O.; Müller-Dethlefs, K. S1 excitation and zero kinetic energy spectra of partly deuterated 1:1 phenol–water complexes. J. Chem. Phys. 1994, 101, 8508–8516. [Google Scholar] [CrossRef]
  58. Yuan, L.; Li, C.; Lin, J.L.; Yang, S.C.; Tzeng, W.B. Mass analyzed threshold ionization spectroscopy of o-fluorophenol and o-methoxyphenol cations and influence of the nature and relative location of substituents. Chem. Phys. 2006, 323, 429–438. [Google Scholar] [CrossRef]
  59. Oikawa, A.; Abe, H.; Mikami, N.; Ito, M. Electronic spectra and ionization potentials of rotational isomers of several disubstituted benzenes. Chem. Phys. Lett. 1985, 116, 50–54. [Google Scholar] [CrossRef]
  60. Yosida, K.; Suzuki, K.; Ishiuchi, S.; Sakai, M.; Fujii, M.; Dessent, C.E.H.; Müller-Dethlefs, K. The PFI-ZEKE photoelectron spectrum of m-fluorophenol and its aqueous complexes: Comparing intermolecular vibrations in rotational isomers. Phys. Chem. Chem. Phys. 2002, 4, 2534–2538. [Google Scholar] [CrossRef]
  61. Zhao, Y.; Jin, Y.; Hao, J.; Yang, Y.; Wang, L.; Li, C.; Jia, S. Rotamers of p-isopropylphenol studied by hole-burning resonantly enhanced multiphoton ionization and mass analyzed threshold ionization spectroscopy. Spectrochim. Acta A Mol. Biomol. Spectrosc. 2019, 207, 328–336. [Google Scholar] [CrossRef]
  62. Li, N.; Li, S.; Wang, L.; Wang, H.; Zhao, J.; Li, C. Vibrational spectra of 2-cyanophenol cation studied by the mass analyzed threshold ionization technique. Chem. Phys. Lett. 2022, 792, 139402. [Google Scholar] [CrossRef]
  63. Hao, J.; Duan, C.; Yang, Y.; Li, C.; Jia, S. Resonance enhanced two-photon ionization and mass analyzed threshold ionization spectroscopy of 4-ethylanisole. J. Mol. Spectrosc. 2020, 369, 111258. [Google Scholar] [CrossRef]
  64. Frisch, M.J.; Trucks, G.W.; Schlegel, H.B.; Scuseria, G.E.; Robb, M.A.; Cheeseman, J.R.; Scalmani, G.; Barone, V.; Mennucci, B.; Petersson, G.A.; et al. Gaussian 16 Revision C.01; Gaussian Inc.: Wallingford, CT, USA, 2016. [Google Scholar]
  65. Baiardi, A.; Bloino, J.; Barone, V. General Time Dependent Approach to Vibronic Spectroscopy Including Franck-Condon, Herzberg-Teller, and Duschinsky Effects. J. Chem. Theory Comput. 2013, 9, 4097–4115. [Google Scholar] [CrossRef] [PubMed]
Figure 1. The stable structures of 2- and 3-fluorobenzonitrile with atomic labels.
Molecules 28 04702 g001
Figure 2. REMPI spectrum of 2-fluorobenzonitrile (a) and its Franck–Condon simulation (b).
Molecules 28 04702 g002
Figure 3. PIE spectrum of 2-fluorobenzonitrile recorded by ionizing via S100 intermediate state at 36,028 cm−1 (a) and MATI spectrum near the cationic origin 0+ for comparison (b).
Molecules 28 04702 g003
Figure 4. Franck–Condon simulation of the D0 ← S100 transition (a) and the MATI spectra of 2-fluorobenzonitrile via S100 (b) and S16b1 (c) intermediate states.
Molecules 28 04702 g004
Figure 5. MATI spectra of 2-fluorobenzonitrile via S111 (a), S1121 (b), and S118b1 (c) intermediate states.
Molecules 28 04702 g005
Figure 6. REMPI spectrum of 3-fluorobenzonitrile (a) and its Franck–Condon simulation (b).
Molecules 28 04702 g006
Figure 7. PIE spectrum of 3-fluorobenzonitrile recorded by ionizing via its S100 state at 35,989 cm−1 (a) and MATI spectrum near the cationic origin 0+ for comparison (b).
Molecules 28 04702 g007
Figure 8. Franck–Condon simulation of the transition D0 ← S100 (a) and the MATI spectra of 3-fluorobenzonitrile via S100 (b) and S1γCN2 (c) intermediate states.
Molecules 28 04702 g008
Figure 9. The MATI spectra of 3-fluorobenzonitrile via S16b1 (a) and S111 (b) intermediate states.
Molecules 28 04702 g009
Table 1. Observed bands in the vibronic spectrum of 2FBN and their possible assignments a.
Transition Energy (cm−1)Relative IntensityShift (cm−1)Calc. (cm−1)Assignment b
36,0281000000
36,1644136137151
36,1987170156γCN2
36,2903262 10b1γCN1
36,35612328 10a1γCN1
36,369423413356b1
36,45294244219b1
36,52895004956a1
36,6383610 16a110b1
36,6633163564616b2
36,6963066866811
36,7213069369817a1
36,73877107116b110b2
36,79267647559b16b1
36,84334815813121
36,87428468419b2
36,9454917910βCN16b1
36,95059229166a19b1
36,9747494696018b1
36,98215954969121γCN2
37,008109809816b116b2
37,0371410091003116b1
37,06261034102216b210b2
37,1991411711156131
37,28512125712247a1
37,31541287129518b16b1
a Experimental values are shifts from 36,028 cm−1 and the calculated ones (scaled by 0.9649) are obtained from the TD-B3LYP/aug-cc-pvtz calculations. b β, in-plane bending; γ, out-of-plane bending.
Table 2. Assignment of the observed bands (cm−1) in the MATI spectra of 2FBN a.
Intermediate Levels in the S1 StateCalc. Assignment b
006b11112118b1
106 106 104γCN1
131 130132139151
197 19319920510b1
209 γCN2
32332132233510a1
333335 3416b1
407408 4094104109b1
430 6b1γCN1
466 6b1151
474 473 152γCN2
520 10a110b1
530 5315325476a1
532 6b110b1
582 6b1151γCN1
643 10a2
571 570571584βCN1
672672 6b2
683 687 68769611
698 16a110b1
746 6b19b1
796 11γCN1
818 11151
826 823 826121
865 6b16a1
888 1110b1
906 6b1βCN1
950 11152
955 121151
972 97397618b1
1023 116b1
1036 6b3
1059 1064 6a2
1104 18b1151
1164 1160 6b1121
1217 116a1
1268 12717a1
1292 18b110a1
1316 1321 6b118b1
1329 1110a2
1349 1216a1
1394 121βCN1
1396 1410121βCN1
1466 146619b1
1503 18b16a1
1513 11121
1545 18b1βCN1
1555 15518b1
1607 6b17a1
1646 122
a The experimental values are shifts from 78,650 cm−1, whereas the calculated ones are obtained from the B3LYP/aug-cc-pVDZ calculations, scaled by 0.9849. b β, in-plane bending; γ, out-of-plane bending.
Table 3. Assignment of observed bands (cm−1) in the 2-color REMPI spectrum of 3FBN a.
Transition EnergyExp.Relative IntensityCalc. aAssignment b
35,9890100 00, band origin
36,12914011142151
36,18219321171γ(CN)2
36,255266725110b1γ(CN)1
36,3243351634210b2
36,374385353819a1, β(C-F)
36,390401583996b1, β(CCC)
36,4034143141710b1γ(CN)3
36,459470114736a1, β(CCC)
36,469480648410b2151
36,50952065239a1151
36,5495609567βCN
36,584595959310b3γ(CN)1
36,611622962310a2γ(CN)2
36,6496603666311, breather
36,675686336849a1151γ(CN)2
36,69270320709151β(CN)1
36,72773887416b110b2
36,78980067986b2
36,86487588726a16b1
36,900911139151110b1γ(CN)1
36,927938139406b2151
36,94795824957121
36,963974279751110a1γ(CN)1
36,985996119966a19a1151
37,0511062171063116b1
37,075108691087416a1γ(CN)1
37,13611471711429b1
37,24112521212536a16b19a1
37,2601271221266131
37,3041315713141116b116b1
37,32413351413381219a1
37,34713581513561216b1
37,363137419138519a1
a The experimental values are shifts from 35,989 cm−1, whereas the calculated ones are obtained from the TD-B3LYP/aug-cc-pVDZ calculations, scaled by 0.9722. b β, in-plane bending; γ, out-of-plane bending.
Table 4. Assignment of observed bands (in cm−1) in the MATI spectra of 3FBN a.
Intermediate Levels in the S1 StateCalc.Assignment b
00γ(CN)26b111
120 118γ(CN)1
133 141151
238 237γ(CN)2
185 18810b1
322 33110a1
371 370 3746b1, β(CCC)
399 3949a1
498 4956a1, β(CCC)
506 6b1151
609 γ(CN)26b1
615 60516a1
668 66867911, breathing
688 6b110b1151
730 γ(CN)26a1
744 6b2
775 4110b1
803 11151
863 860 6b16a1
893 894 6a19a1
978 965121, β(CCC)
997 9906a2
1066 106718a1, β(CH)
1098 γ(CN)26a16b1
1117 11059b1, β(CH)
1144 113318b1, β(CH)
1166 116b1
1218 γ(CN)2121
1235 6b26a1
1258 6b16a19a1
1299 γ(CN)218a1
1307 1302131, β(CH)
1350 6b1121
1357 γ(CN)29b1
1374 6b16a2
1385 138219a1
1489 6b19b1
1566 15378a1, ν(CC)
1516 6b118b1
1574 6b118a1151
a The experimental values are shifts from 78,873 cm−1, whereas the calculated ones are obtained from the B3LYP/aug-cc-pVDZ calculations, scaled by 0.9704. b β, in-plane bending; γ, out-of-plane bending.
Table 5. Bond length and bond angle of electronic ground state S0, first excited state S1, and cationic ground state D0 of 2-fluorobenzonitrile calculated at RB3LYP/aug-cc-pvtz, TD-B3LYP/aug-cc-pvtz, and UB3LYP/aug-cc-pvtz levels, respectively.
S0S1D0Δ(S1 − S0)Δ(D0 − S1)Δ(D0 − S0)
Bond length (Å)
C1−C21.3961.4361.4550.0400.0190.059
C2−C31.3811.4061.3930.025−0.0130.012
C3−C41.3891.4091.3720.020−0.037−0.017
C4−C51.3921.4081.4340.0160.0260.042
C5−C61.3851.4211.3860.036−0.0350.001
C6−C11.4011.4241.3910.023−0.033−0.010
C1−C111.4271.3951.407−0.0320.012−0.020
C11−N121.1521.1651.1580.013−0.0070.006
C2−F131.3411.3241.296−0.017−0.028−0.045
Bond angle (°)
C1−C2−C3122.0124.7122.52.7−2.20.5
C2−C3−C4118.8119.0117.50.2−1.5−1.3
C3−C4−C5120.5118.1121.1−2.43.00.6
C4−C5−C6120.0122.7121.42.7−1.31.4
C5−C6−C1120.4120.6119.00.2−1.6−1.4
C6−C1−C2118.3114.9118.4−3.43.50.1
Table 6. Bond length and bond angle of the electronic ground state S0, first excited state S1, and cationic ground state D0 of 3-fluorobenzonitrile calculated at RB3LYP/aug-cc-pvtz, TD-B3LYP/aug-cc-pvtz, and UB3LYP/aug-cc-pvtz levels, respectively.
S0S1D0Δ(S1 − S0)Δ(D0 − S1)Δ(D0 − S0)
Bond length (Å)
C1−C21.3981.4251.3800.026−0.045−0.018
C2−C31.3801.4131.3930.033−0.0190.013
C3−C41.3841.4061.4330.0220.0270.049
C4−C51.3901.4041.3740.014−0.029−0.016
C5−C61.3871.4111.3950.024−0.0160.008
C6−C11.3981.4381.4490.0390.0100.051
C1−C111.4301.3971.415−0.0330.017−0.015
C11−N121.1521.1651.1550.013−0.0090.003
C2−F131.3461.3301.300−0.016−0.030−0.046
Bond angle (°)
C1−C2−C3118.2118.4116.90.2−1.4−1.3
C2−C3−C4122.5125.2123.42.7−1.70.9
C3−C4−C5118.5115.9118.8−2.62.90.3
C4−C5−C6120.6121.1119.20.4−1.9−1.4
C5−C6−C1119.6122.2120.92.6−1.31.3
C6−C1−C2120.4116.9120.5−3.43.50.1
Table 7. Ionization energy of benzene and phenol and their F- and CN-substituted molecules (cm−1).
MoleculeIEΔIEMoleculeIEΔIE
Benzene a74,5570Benzonitrile c78,4900
Fluorobenzene b74,227−3302-Fluorobenzonitrile d78,650160
Benzonitrile c78,49039333-Fluorobenzonitrile d78,873383
4-Fluorobenzonitrile e78,000−490
Phenol f68,6250
2-Fluorophenol g70,0061381Fluorobenzene b74,2270
3-Fluorophenol, cis h,i70,18815632-Fluorobenzonitrile d78,6504423
3-Fluorophenol, trans h,i70,44918243-Fluorobenzonitrile d78,8734646
4-Fluorophenol j68,577−484-Fluorobenzonitrile e78,0003773
a Ref. [54]. b Ref. [55]. c Ref. [56]. d This work. e Ref. [21]. f Ref. [57]. g Ref. [58]. h Refs. [59,60]. i Ref. [60]. j Ref. [11].
Disclaimer/Publisher’s Note: The statements, opinions and data contained in all publications are solely those of the individual author(s) and contributor(s) and not of MDPI and/or the editor(s). MDPI and/or the editor(s) disclaim responsibility for any injury to people or property resulting from any ideas, methods, instructions or products referred to in the content.