
Synthesis and Application of a New Polymer with Imprinted Ions for the Preconcentration of Uranium in Natural Water Samples and Determination by Digital Imaging

 , , , ,
Abstract
1. Introduction
2. Results and Discussion
2.1. Choice of RGB Channel
2.2. Arsenazo III Concentration Study
2.3. Synthesis and Characterization of the Ion-Imprinted Polymer (IIP)
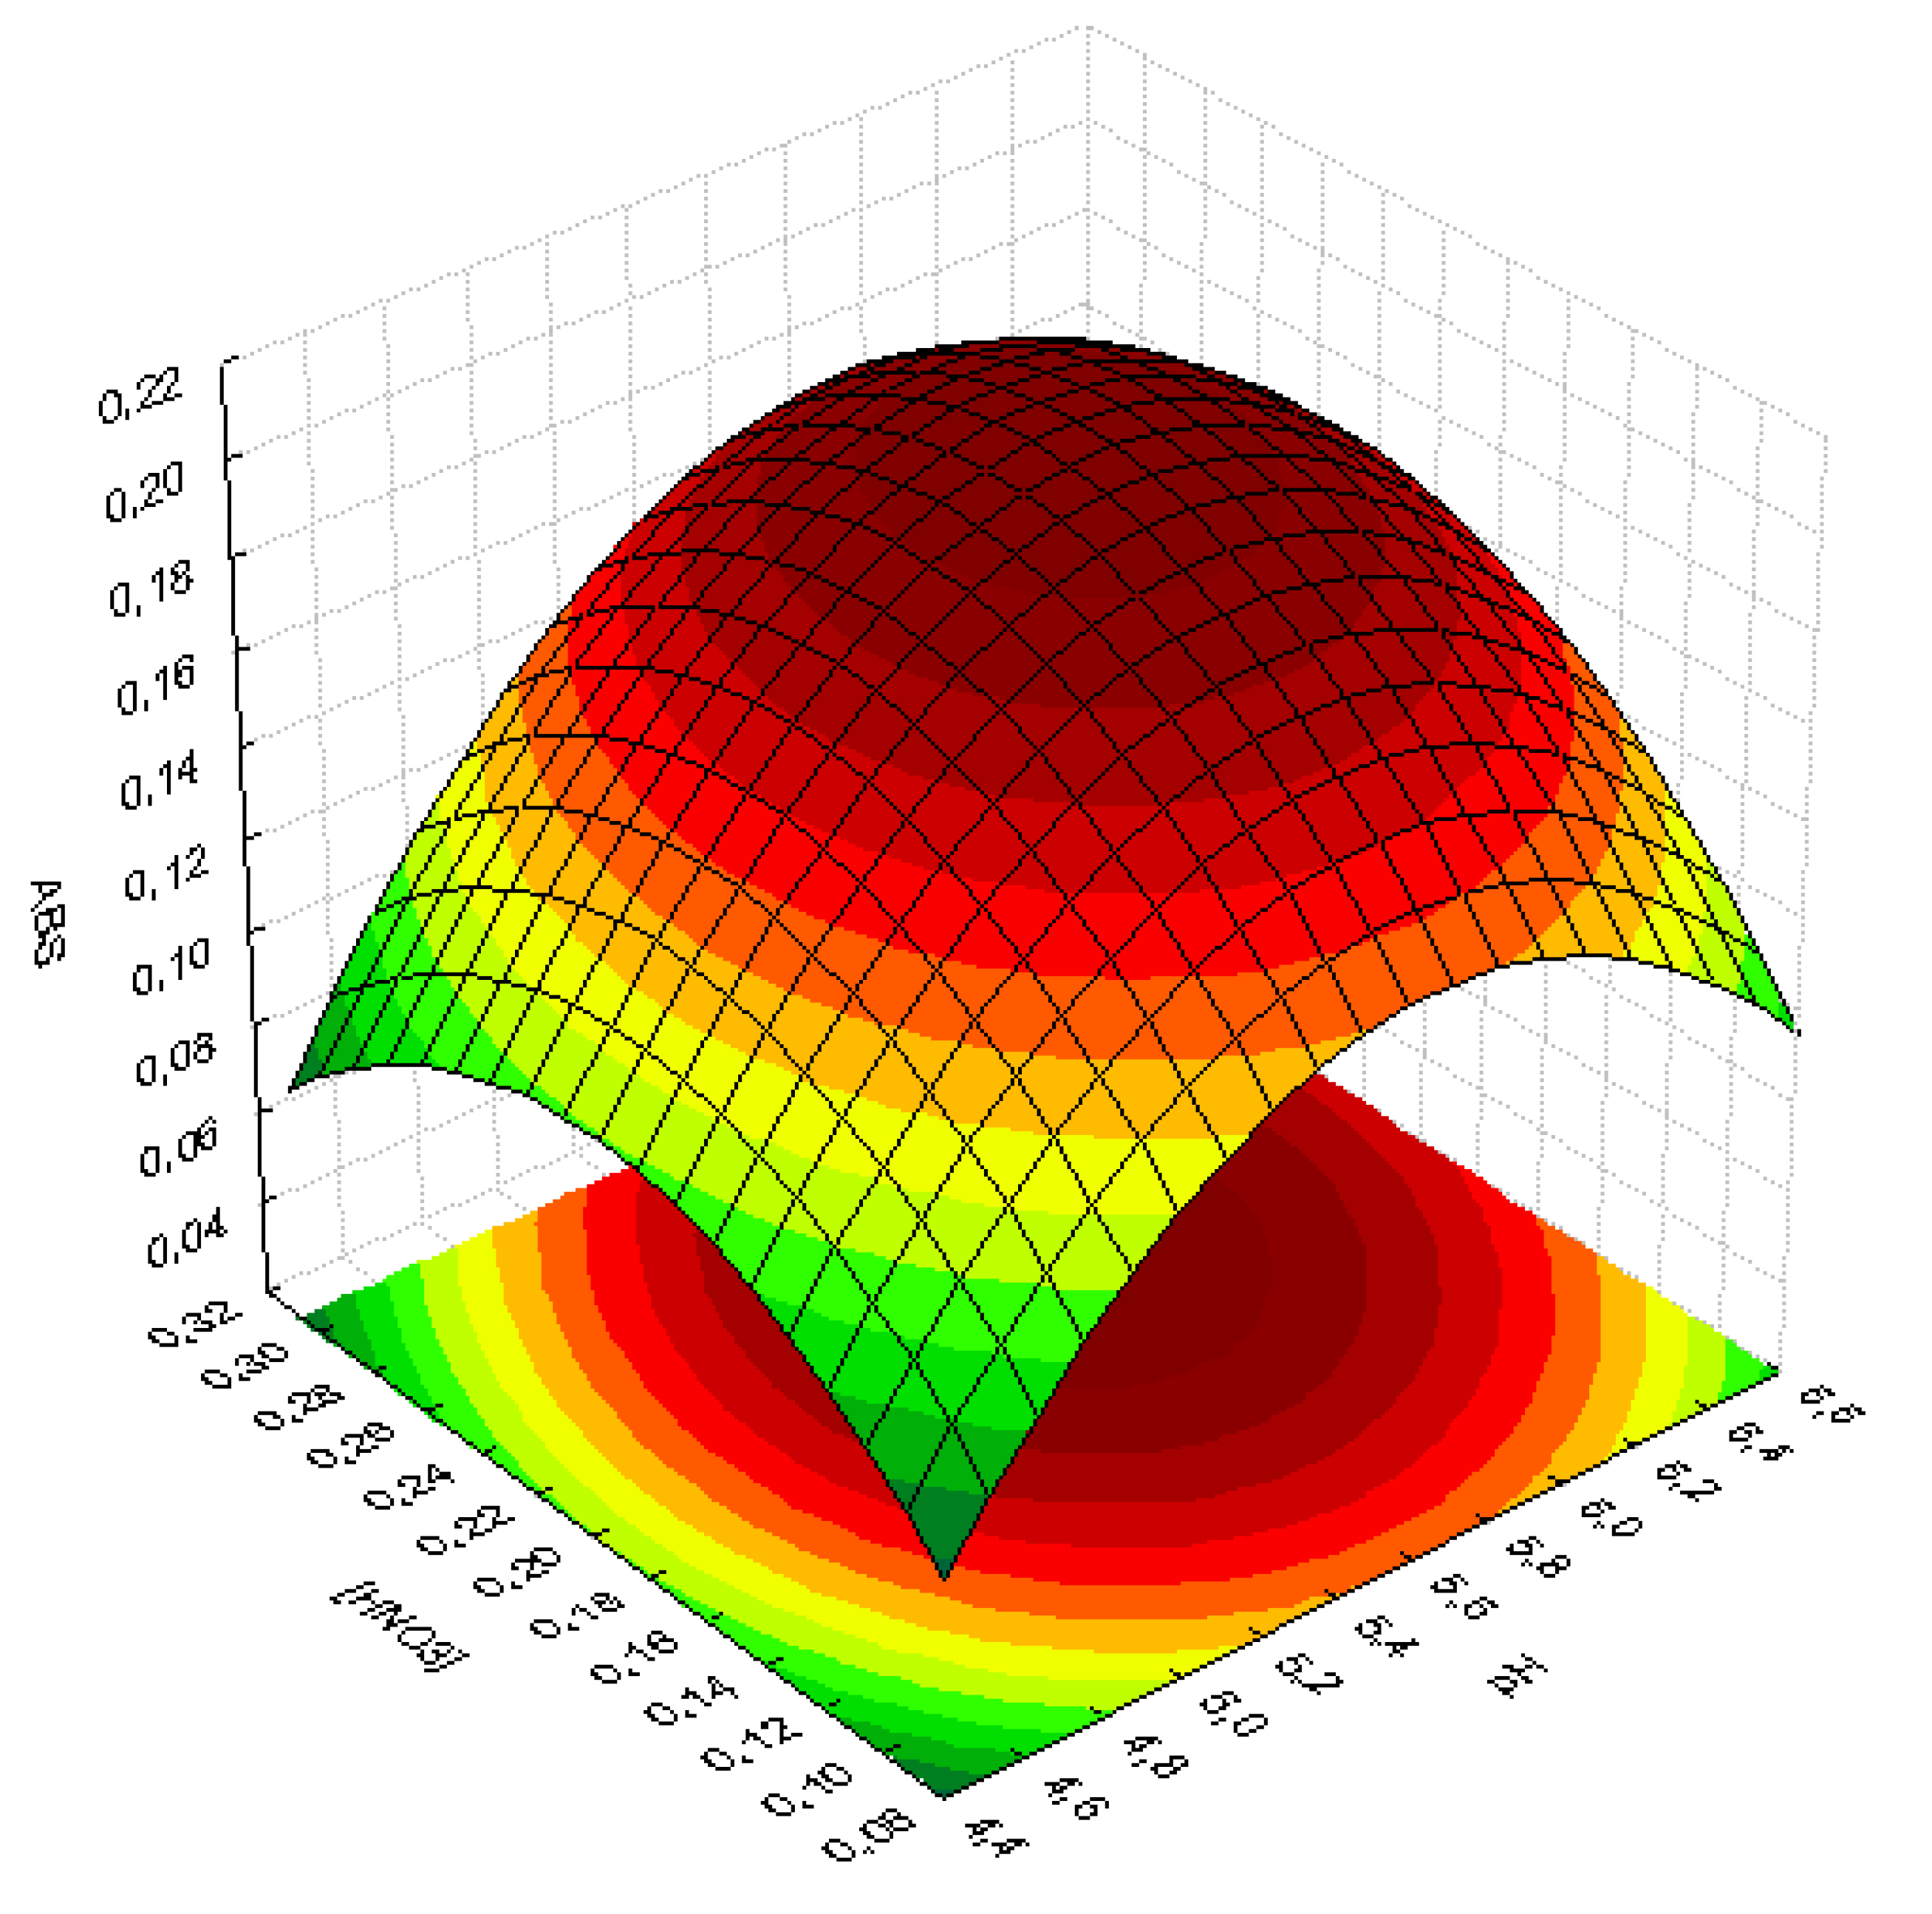
2.4. Optimization of Experimental Conditions for Uranium Extraction and Determination
2.5. Validation Studies
2.6. Application
3. Experimental
3.1. Reagents and Solutions
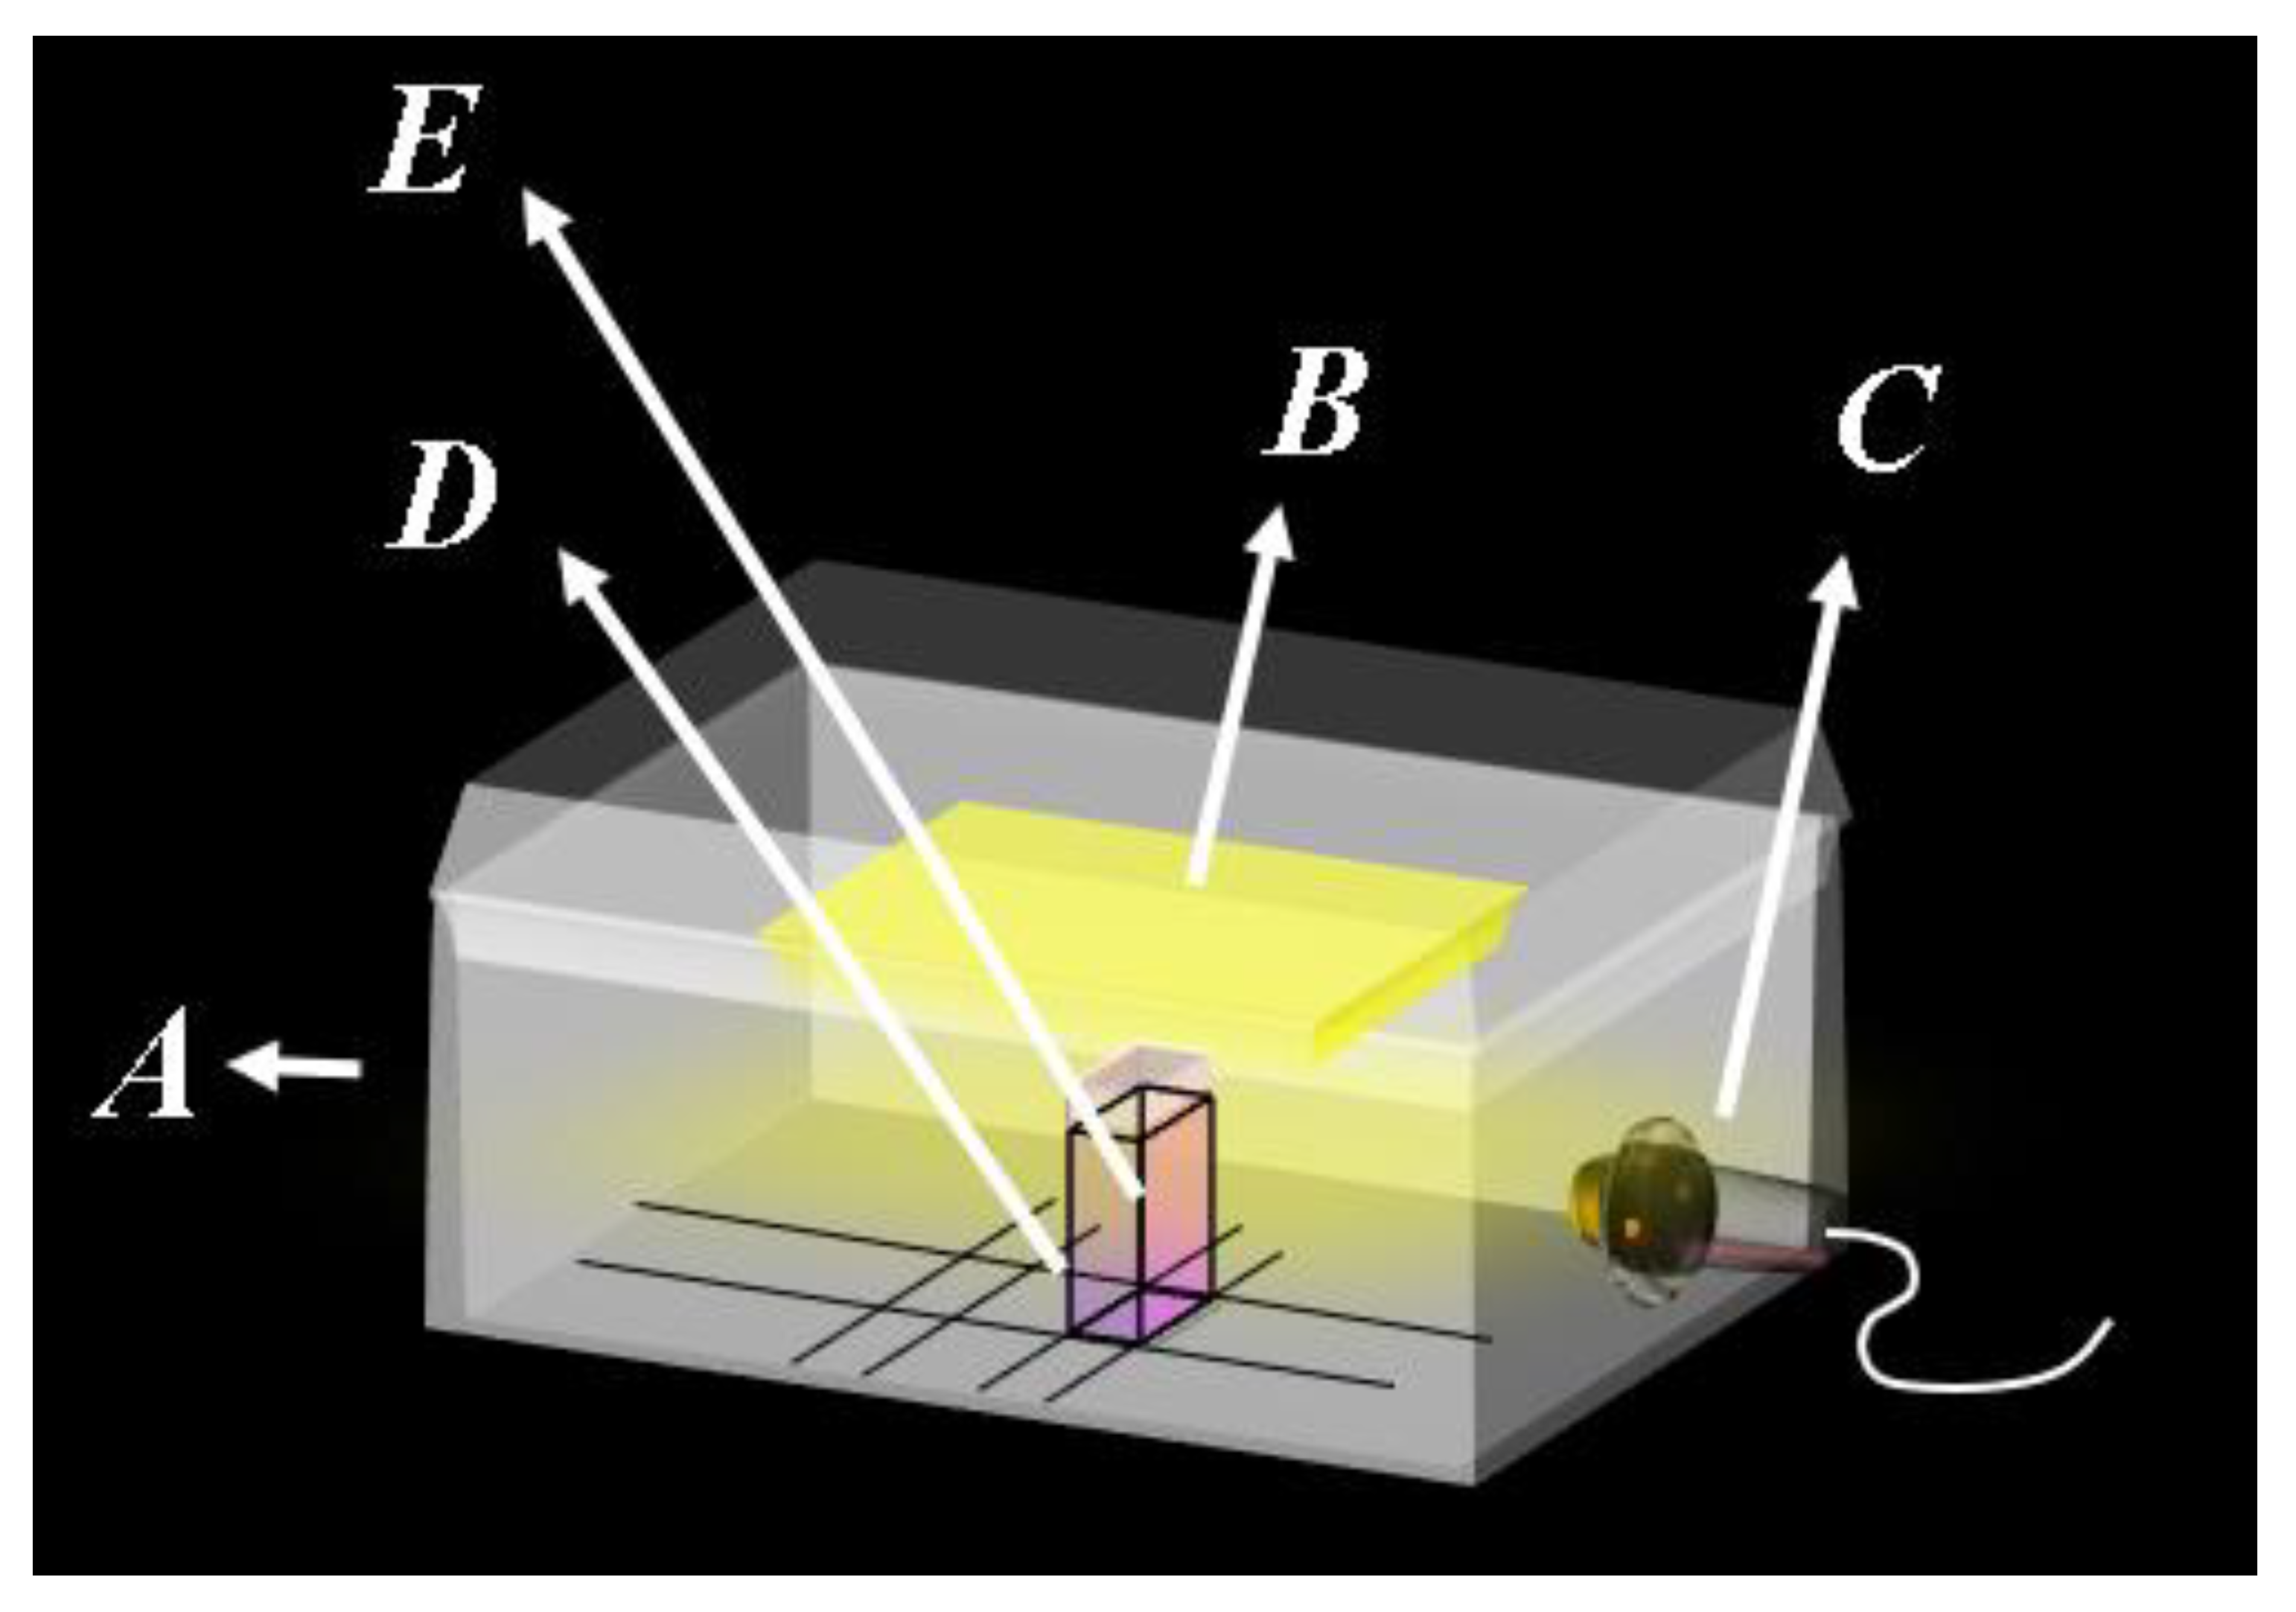
3.2. RGB Data Acquisition and Evaluation
3.3. Synthesis of Polymers with Printed Ions (IIP-U(VI))
3.4. Characterization of the Ion-Imprinted Polymer (IIP)
3.5. Preconcentration System and Determination of U(VI)
3.6. Multivariate Optimization Strategy
3.7. Sample Preparation
4. Conclusions
Author Contributions
Funding
Institutional Review Board Statement
Informed Consent Statement
Data Availability Statement
Acknowledgments
Conflicts of Interest
References
- Allen, M.R.; Frame, D.J.; Huntingford, C.; Jones, C.D.; Lowe, J.A.; Meinshausen, M.; Meinshausen, N. Warming caused by cumulative carbon emissions towards the trillionth tonne. Nature 2009, 458, 1163–1166. [Google Scholar] [CrossRef] [PubMed]
- Dresselhaus, M.S.; Thomas, I.L. Alternative energy technologies. Nature 2001, 414, 332–337. [Google Scholar] [CrossRef] [PubMed]
- Zinkle, S.J.; Was, G.S. Materials challenges in nuclear energy. Acta Mater. 2013, 61, 735–758. [Google Scholar] [CrossRef]
- Oguma, K.; Suzuki, T.; Saito, K. Determination of uranium in seawater by flow-injection preconcentration on dodecylamidoxime-impregnated resin and spectrophotometric detection. Talanta 2011, 84, 1209–1214. [Google Scholar] [CrossRef] [PubMed]
- Danchana, K.; de Souza, C.T.; Palacio, E.; Cerdà, V. Multisyringe flow injection analysis for the spectrophotometric determination of uranium (VI) with 2-(5-bromo-2-pyridylazo)-5-diethylaminophenol. Microchem. J. 2019, 150, 104148. [Google Scholar] [CrossRef]
- Tetgure, S.R.; Choudhary, B.C.; Garole, D.J.; Borse, A.U.; Sawant, A.D.; Prasad, S. Novel extractant impregnated resin for preconcentration and determination of uranium from environmental samples. Microchem. J. 2017, 130, 442–451. [Google Scholar] [CrossRef]
- Boonpanaid, C.; Oguma, K. Indirect determination of uranium by the on-line reduction and fluorimetric detection of cerium(III). Anal. Sci. 2005, 21, 155–159. [Google Scholar] [CrossRef]
- Pradhan, S.K.; Ambade, B. Separation and preconcentration of trace uranium(VI) by solid phase extraction with 2,3-dihydroxynaphthalene and cetyltrimethylammonium bromide on molten naphthalene and its LED fluorimetric determination in water samples. Anal. Sci. 2020, 36, 207–212. [Google Scholar] [CrossRef]
- Duggal, V.; Sharma, S.; Singh, A. Toxicological risk and age-dependent radiation dose assessment of uranium in drinking water in southwest-central districts of Haryana State, India. Groundw. Sustain. Dev. 2021, 13, 100577. [Google Scholar] [CrossRef]
- Kallithrakas-Kontos, N.G.; Xarchoulakos, D.C.; Boultadaki, P.; Potiriadis, C.; Kehagia, K. Selective Membrane Complexation and Uranium Isotopes Analysis in Tap Water and Seawater Samples. Anal. Chem. 2018, 90, 4611–4615. [Google Scholar] [CrossRef]
- Maltsev, A.S.A.; Ivanov, V.; Chubarov, V.M.; Pashkova, G.V.; Panteeva, S.V.; Reznitskii, L.Z. Development and validation of a method for multielement analysis of apatite by total-reflection X-ray fluorescence spectrometry. Talanta 2020, 214, 120870. [Google Scholar] [CrossRef]
- Metilda, P.; Prasad, K.; Kala, R.; Gladis, J.M.; Rao, T.P.; Naidu, G.R.K. Ion imprinted polymer based sensor for monitoring toxic uranium in environmental samples. Anal. Chim. Acta 2007, 582, 147–153. [Google Scholar] [CrossRef]
- Agafonova-Moroz, M.; Savosina, J.; Voroshilov, Y.; Lukin, S.; Lumpov, A.; Babain, V.; Oleneva, E.; Legin, A.; Kirsanov, D. Quantification of thorium and uranium in real process streams of Mayak radiochemical plant using potentiometric multisensor array. J. Radioanal. Nucl. Chem. 2020, 323, 605–612. [Google Scholar] [CrossRef]
- Bahramifar, N.; Yamini, Y. On-line preconcentration of some rare earth elements in water samples using C18-cartridge modified with l-(2-pyridylazo) 2-naphtol (PAN) prior to simultaneous determination by inductively coupled plasma optical emission spectrometry (ICP-OES). Anal. Chim. Acta 2005, 540, 325–332. [Google Scholar] [CrossRef]
- Martins, C.A.; Scheffler, G.L.; Pozebon, D. Straightforward determination of U, Th, and Hf at trace levels using ultrasonic nebulization and axial view ICP OES. Anal. Methods 2016, 8, 504–509. [Google Scholar] [CrossRef]
- Avivar, J.; Ferrer, L.; Casas, M.; Cerdà, V. Fully automated lab-on-valve-multisyringe flow injection analysis-ICP-MS system: An effective tool for fast, sensitive and selective determination of thorium and uranium at environmental levels exploiting solid phase extraction. J. Anal. At. Spectrom. 2012, 27, 327–334. [Google Scholar] [CrossRef]
- Baghaliannejad, R.; Aghahoseini, M.; Amini, M.K. Determination of rare earth elements in uranium materials by ICP-MS and ICP-OES after matrix separation by solvent extraction with TEHP. Talanta 2021, 222, 121509. [Google Scholar] [CrossRef]
- Qiao, J.; Xu, Y. Direct measurement of uranium in seawater by inductively coupled plasma mass spectrometry. Talanta 2018, 183, 18–23. [Google Scholar] [CrossRef]
- Avivar, J.; Ferrer, L.; Casas, M.; Cerdà, V. Automated determination of uranium(VI) at ultra trace levels exploiting flow techniques and spectrophotometric detection using a liquid waveguide capillary cell. Anal. Bioanal. Chem. 2010, 397, 871–878. [Google Scholar] [CrossRef]
- Avivar, J.; Ferrer, L.; Casas, M.; Cerdà, V. Lab on valve-Multisyringe flow injection system (LOV-MSFIA) for fully automated uranium determination in environmental samples. Talanta 2011, 84, 1221–1227. [Google Scholar] [CrossRef]
- Orabi, A.H.; Abdulmoteleb, S.S.; Ismaiel, D.A.; Falila, N.I. A novel method for extractive spectrophotometric determination of uranium by Azur II dye in some geological samples. Int. J. Environ. Anal. Chem. 2020, 103, 437–453. [Google Scholar] [CrossRef]
- Lemos, V.A.; Gama, E.M. An online preconcentration system for the determination of uranium in water and effluent samples. Environ. Monit. Assess. 2010, 171, 163–169. [Google Scholar] [CrossRef] [PubMed]
- Tarhan, F.T.; Antep, M.; Merdivan, M. Vortex assisted in situ ionic liquid dispersive liquid–liquid microextraction for preconcentration of uranyl ion in water samples before spectrophotometric detection. J. Radioanal. Nucl. Chem. 2019, 320, 1–7. [Google Scholar] [CrossRef]
- Capitán-Vallvey, L.F.; López-Ruiz, N.; Martínez-Olmos, A.; Erenas, M.M.; Palma, A.J. Recent developments in computer vision-based analytical chemistry: A tutorial review. Anal. Chim. Acta 2015, 899, 23–56. [Google Scholar] [CrossRef] [PubMed]
- Vidal, M.; Garcia-Arrona, R.; Bordagaray, A.; Ostra, M.; Albizu, G. Simultaneous determination of color additives tartrazine and allura red in food products by digital image analysis. Talanta 2018, 184, 58–64. [Google Scholar] [CrossRef]
- Albizu, G.; Bordagaray, A.; Dávila, S.; Garcia-Arrona, R.; Ostra, M.; Vidal, M. Analytical control of nickel coating baths by digital image analysis. Microchem. J. 2020, 154, 104600. [Google Scholar] [CrossRef]
- Costa, G.D.O.; Feiteira, F.N.; Schuenck, H.D.M.; Pacheco, W.F. Iodine determination in table salts by digital images analysis. Anal. Methods 2018, 10, 4463–4470. [Google Scholar] [CrossRef]
- Santos Neto, J.H.; Porto, I.S.A.; Schneider, M.P.; dos Santos, A.M.P.; Gomes, A.A.; Ferreira, S.L.C. Speciation analysis based on digital image colorimetry: Iron (II/III) in white wine. Talanta 2019, 194, 86–89. [Google Scholar] [CrossRef]
- Porto, I.S.A.; Santos Neto, J.H.; dos Santos, L.O.; Gomes, A.A.; Ferreira, S.L.C. Determination of ascorbic acid in natural fruit juices using digital image colorimetry. Microchem. J. 2019, 149, 104031. [Google Scholar] [CrossRef]
- Soares, S.; Lima, M.J.A.; Rocha, F.R.P. A spot test for iodine value determination in biodiesel based on digital images exploiting a smartphone. Microchem. J. 2017, 133, 195–199. [Google Scholar] [CrossRef]
- de Carvalho Oliveira, G.; Machado, C.C.S.; Inácio, D.K.; da Silveira Petruci, J.F.; Silva, S.G. RGB color sensor for colorimetric determinations: Evaluation and quantitative analysis of colored liquid samples. Talanta 2022, 241, 123244. [Google Scholar] [CrossRef]
- Santiago, J.B.; Sevilla, F.B. Smartphone-based digital colorimetric measurement of dimethyl sulfide in wastewater. Microchem. J. 2022, 172, 106952. [Google Scholar] [CrossRef]
- Dantas, H.V.; Barbosa, M.F.; Pereira, A.; Pontes, M.J.C.; Moreira, P.N.T.; Araújo, M.C.U. An inexpensive NIR LED Webcam photometer for detection of adulterations in hydrated ethyl alcohol fuel. Microchem. J. 2017, 135, 148–152. [Google Scholar] [CrossRef]
- Barros, J.A.V.A.; de Oliveira, F.M.; Santos, G.d.O.; Wisniewski, C.; Luccas, P.O. Digital Image Analysis for the Colorimetric Determination of Aluminum, Total Iron, Nitrite and Soluble Phosphorus in Waters. Anal. Lett. 2017, 50, 414–430. [Google Scholar] [CrossRef]
- Rao, T.P.; Metilda, P.; Gladis, J.M. Preconcentration techniques for uranium(VI) and thorium(IV) prior to analytical determination-an overview. Talanta 2006, 68, 1047–1064. [Google Scholar] [CrossRef]
- Catherine Branger, A.M.; Meouche, W. Recent advances on ion-imprinted polymers. React. Funct. Polym. 2013, 73, 859–875. [Google Scholar] [CrossRef]
- Behbahani, M.; Salimi, S.; Abandansari, H.S.; Omidi, F.; Salarian, M.; Esrafili, A. Application of a tailor-made polymer as a selective and sensitive colorimetric sensor for reliable detection of trace levels of uranyl ions in complex matrices. RSC Adv. 2015, 5, 59912–59920. [Google Scholar] [CrossRef]
- Singh, D.K.; Mishra, S. Synthesis and characterization of UO22+-ion imprinted polymer for selective extraction of UO22+. Anal. Chim. Acta 2009, 644, 42–47. [Google Scholar] [CrossRef]
- Ashkenani, H. Application of a new ion-imprinted polymer for solid-phase extraction of bismuth from various samples and its determination by ETAAS. Int. J. Environ. Anal. Chem. 2013, 93, 1132–1145. [Google Scholar] [CrossRef]
- Suquila, F.A.C.; Tarley, C.R.T. Performance of restricted access copper-imprinted poly(allylthiourea)in an on-line preconcentration and sample clean-up FIA-FAAS system for copper determination in milk samples. Talanta 2019, 202, 460–468. [Google Scholar] [CrossRef]
- Bayramoglu, G.; Arica, M.Y. Synthesis of Cr(VI)-imprinted poly(4-vinyl pyridine-co-hydroxyethyl methacrylate) particles: Its adsorption propensity to Cr(VI). J. Hazard. Mater. 2011, 187, 213–221. [Google Scholar] [CrossRef] [PubMed]
- Felix, C.S.A.; Silva, D.G.; Andrade, H.M.C.; Riatto, V.B.; Victor, M.M.; Ferreira, S.L.C. An on-line system using ion-imprinted polymer for preconcentration and determination of bismuth in seawater employing atomic fluorescence spectrometry. Talanta 2018, 184, 87–92. [Google Scholar] [CrossRef] [PubMed]
- Anjos, S.L.; Almeida, J.S.; Teixeira, L.S.G.; da Silva, A.C.M.; Santos, A.P.; Queiroz, A.F.S.; Ferreira, S.L.C.; Mattedi, S. Determination of Cu, Ni, Mn and Zn in diesel oil samples using energy dispersive X-ray fluorescence spectrometry after solid phase extraction using sisal fiber. Talanta 2021, 225, 121910. [Google Scholar] [CrossRef] [PubMed]
- Lima, E.A.; Cunha, F.A.S.; Junior, M.M.S.; Lyra, W.S.; Santos, J.C.C.; Ferreira, S.L.C.; Araujo, M.C.U.; Almeida, L.F. A fast and sensitive flow-batch method with hydride generating and atomic fluorescence spectrometric detection for automated inorganic antimony speciation in waters. Talanta 2020, 207, 119834. [Google Scholar] [CrossRef] [PubMed]
- Ferreira, S.L.C.; Silva Junior, M.M.; Felix, C.S.A.; da Silva, D.L.F.; Santos, A.S.; Santos Neto, J.H.; de Souza, C.T.; Cruz Junior, R.A.; Souza, A.S. Multivariate optimization techniques in food analysis—A review. Food Chem. 2019, 273, 3–8. [Google Scholar] [CrossRef]
- Cruz Junior, R.A.; Chagas, A.V.B.; Felix, C.S.A.; Souza, R.C.; Silva, L.A.; Lemos, V.A.; Ferreira, S.L.C. A closed inline system for sample digestion using 70% hydrogen peroxide and UV radiation. Determination of lead in wine employing ETAAS. Talanta 2019, 191, 479–484. [Google Scholar] [CrossRef]
- Lopo De Araújo, N.M.; Ferreira, S.L.C.; Dos Santos, H.C.; De Jesus, D.S.; Bezerra, M.A. Factorial and Doehlert designs in the optimization of a separation procedure using polyurethane foam as a solid phase extractant for platinum determination in ferrous matrices using inductively coupled plasma optical emission spectroscopy. Anal. Methods 2012, 4, 508–512. [Google Scholar] [CrossRef]
- Cerqueira, U.M.F.M.; Bezerra, M.A.; Ferreira, S.L.C.; Araújo, R.d.J.; da Silva, B.N.; Novaes, C.G. Doehlert design in the optimization of procedures aiming food analysis—A review. Food Chem. 2021, 364, 130429. [Google Scholar] [CrossRef]
- Ferreira, S.L.C.; Caires, A.O.; Borges, T.d.S.; Lima, A.M.D.S.; Silva, L.O.B.; dos Santos, W.N.L. Robustness evaluation in analytical methods optimized using experimental design. Microchem. J. 2017, 131, 163–169. [Google Scholar] [CrossRef]
- Belter, M.; Sajnóg, A.; Barałkiewicz, D. Over a century of detection and quantification capabilities in analytical chemistry—Historical overview and trends. Talanta 2014, 129, 606–616. [Google Scholar] [CrossRef]
- UTEVA Resin Specifications, Triskem. Available online: http://www.triskem-international.com (accessed on 25 April 2023).
- Wang, J.; Chen, I.; Chiu, J. Sequential isotopic determination of plutonium, thorium, americium, strontium and uranium in environmental and bioassay samples. Appl. Radiat. Isot. 2004, 61, 299–305. [Google Scholar] [CrossRef]
- Truscott, J.B.; Bromley, L.; Jones, P.; Evans, E.H.; Turner, J.; Fairman, B. Determination of natural uranium and thorium in environmental samples by ETV-ICP-MS after matrix removal by on-line solid phase extraction. J. Anal. At. Spectrom. 1999, 14, 627–631. [Google Scholar] [CrossRef]
- Sandell, E.B.; Onishi, H. Photometric Determination of Traces of Metals, 4th ed.; John Wiley & Sons: New York, NY, USA, 1979. [Google Scholar]
- Daneshvar, G.; Jabbari, A.; Yamini, Y.; Paki, D.J. Determination of uranium and thorium in natural waters by ICP-OES after on-line solid phase extraction and preconcentration in the presence of 2, 3-dihydro-9, 10-dihydroxy-1, 4-antracenedion. Anal. Chem. 2009, 64, 602–608. [Google Scholar] [CrossRef]
- Hosseini, M.S.; Hosseini-Bandegharaei, A. Selective extraction of Th (IV) over U (VI) and other co-existing ions using eosin B-impregnated Amberlite IRA-410 resin beads. J. Radioanal. Nucl. Chem. 2010, 283, 23–30. [Google Scholar] [CrossRef]


| Conc. (mg L−1) | R | G | B | Abs R | Abs G | Abs G |
|---|---|---|---|---|---|---|
| 0 | 157.85 | 0.58 | 55.80 | 0 | 0 | 0 |
| 0.1 | 149.86 | 0.45 | 40.90 | 0.02 | 0.11 | 0.13 |
| 0.25 | 142.61 | 6.16 | 63.76 | 0.04 | −1.03 | −0.06 |
| 0.40 | 121.74 | 0.52 | 55.70 | 0.11 | 0.05 | 0 |
| 0.55 | 113.40 | 1.61 | 60.69 | 0.14 | −0.44 | −0.04 |
| 0.70 | 102.73 | 3.21 | 63.63 | 0.19 | −0.74 | −0.06 |
| 0.85 | 101.81 | 5.46 | 66.58 | 0.19 | −0.97 | −0.08 |
| 1.0 | 90.47 | 6.13 | 64.71 | 0.24 | −1.02 | −0.06 |
| 2.0 | 62.18 | 24.41 | 66.55 | 0.40 | −1.62 | −0.08 |
| Experiment | pH | Sampling Flow | [HNO3] | Absorbance |
|---|---|---|---|---|
| 1 | − (2.5) | − (2.0) | − (0.1) | 0.024 |
| 2 | − (2.5) | − (2.0) | + (0.5) | 0.009 |
| 3 | − (2.5) | + (6.0) | − (0.1) | 0.014 |
| 4 | − (2.5) | + (6.0) | + (0.5) | 0.009 |
| 5 | + (5.5) | − (2.0) | − (0.1) | 0.428 |
| 6 | + (5.5) | − (2.0) | + (0.5) | 0.335 |
| 7 | + (5.5) | + (6.0) | − (0.1) | 0.418 |
| 8 | + (5.5) | + (6.0) | + (0.5) | 0.316 |
| 9 | 0 (4.0) | 0 (4.0) | 0 (0.3) | 0.275 |
| 10 | 0 (4.0) | 0 (4.0) | 0 (0.3) | 0.275 |
| 11 | 0 (4.0) | 0 (4.0) | 0 (0.3) | 0.287 |
| Factor and Interaction | Effects |
|---|---|
| pH | 0.360 ± 0.0048 |
| [HNO3] | −0.053 ± 0.0048 |
| pHx[HNO3] | −0.0437 ± 0.0048 |
| Experiment | pH | [HNO3] | Absorbance |
|---|---|---|---|
| 1 | 0 (5.5) | 0 (0.2) | 0.203 |
| 2 | 0 (5.5) | 0 (0.2) | 0.190 |
| 3 | 0 (5.5) | 0 (0.2) | 0.192 |
| 4 | 1 (6.5) | 0 (0.2) | 0.182 |
| 5 | 0.5 (6.0) | 0.866 (0.3) | 0.165 |
| 6 | −1 (4.5) | 0 (0.2) | 0.110 |
| 7 | −0.5 (5.0) | −0.866 (0.1) | 0.148 |
| 8 | 0.5 (6.0) | −0.866 (0.1) | 0.139 |
| 9 | −0.5 (5.0) | 0.866 (0.3) | 0.155 |
| Detection System | Method | LOD (μg L−1) | Ref. |
|---|---|---|---|
| Radiometric | Batch | 18.0 | 51 |
| Batch | 2.5 | 52 | |
| Batch | 0.4 | 53 | |
| ICP-MS | FIA | 0.7 | 54 |
| FIA | 0.02 | 55 | |
| Spectrophotometric | MSFIA-MPFS | 0.013 | 56 |
| LOV-MSFIA | 0.01 | 20 | |
| Digital imaging | Batch | 2.55 | Our method |
| Samples | Addition (µg L−1) | Concentration (µg L−1) | Recovery (%) |
|---|---|---|---|
| LG01 | 0 | 75 ± 5.10 | - |
| 100 | 180 ± 2.44 | 104 | |
| LG03 | 0 | >LQ | - |
| 50 | 45.6 ± 6.20 | 91 | |
| P04 | 0 | 20.3 ± 4.21 | - |
| 50 | 75 ± 4.0 | 109 | |
| R04 | 0 | 35 ± 4.2 | - |
| 60 | 35 ± 4.2 | 92 |
| Sample | Coordinates |
|---|---|
| LG01 | Lat. −13.837463°—Long. −42.311125° |
| LG03 | Lat. −14.300701°—Long. −42.578394° |
| P04 | Lat. −14.100147°—Long. −42.435525° |
| R04 | Lat. −14.165014°—Long. −42.441480° |
Disclaimer/Publisher’s Note: The statements, opinions and data contained in all publications are solely those of the individual author(s) and contributor(s) and not of MDPI and/or the editor(s). MDPI and/or the editor(s) disclaim responsibility for any injury to people or property resulting from any ideas, methods, instructions or products referred to in the content. |
© 2023 by the authors. Licensee MDPI, Basel, Switzerland. This article is an open access article distributed under the terms and conditions of the Creative Commons Attribution (CC BY) license (https://creativecommons.org/licenses/by/4.0/).
Share and Cite
Felix, C.S.A.; Chagas, A.V.B.; de Jesus, R.F.; Barbosa, W.T.; Barbosa, J.D.V.; Ferreira, S.L.C.; Cerdà, V. Synthesis and Application of a New Polymer with Imprinted Ions for the Preconcentration of Uranium in Natural Water Samples and Determination by Digital Imaging. Molecules 2023, 28, 4065. https://doi.org/10.3390/molecules28104065
Felix CSA, Chagas AVB, de Jesus RF, Barbosa WT, Barbosa JDV, Ferreira SLC, Cerdà V. Synthesis and Application of a New Polymer with Imprinted Ions for the Preconcentration of Uranium in Natural Water Samples and Determination by Digital Imaging. Molecules. 2023; 28(10):4065. https://doi.org/10.3390/molecules28104065
Chicago/Turabian StyleFelix, Caio S. A., Adriano V. B. Chagas, Rafael F. de Jesus, Willams T. Barbosa, Josiane D. V. Barbosa, Sergio L. C. Ferreira, and Víctor Cerdà. 2023. "Synthesis and Application of a New Polymer with Imprinted Ions for the Preconcentration of Uranium in Natural Water Samples and Determination by Digital Imaging" Molecules 28, no. 10: 4065. https://doi.org/10.3390/molecules28104065
APA StyleFelix, C. S. A., Chagas, A. V. B., de Jesus, R. F., Barbosa, W. T., Barbosa, J. D. V., Ferreira, S. L. C., & Cerdà, V. (2023). Synthesis and Application of a New Polymer with Imprinted Ions for the Preconcentration of Uranium in Natural Water Samples and Determination by Digital Imaging. Molecules, 28(10), 4065. https://doi.org/10.3390/molecules28104065