Article

Structural Features of Monoethanolamine Aqueous Solutions with Various Compositions: A Combined Experimental and Theoretical Study Using Vibrational Spectroscopy

A. V. Topchiev Institute of Petrochemical Synthesis Russian Academy of Sciences, 119991 Moscow, Russia
*
Author to whom correspondence should be addressed.
Molecules 2023, 28(1), 403; https://doi.org/10.3390/molecules28010403
Submission received: 5 December 2022 / Revised: 22 December 2022 / Accepted: 26 December 2022 / Published: 3 January 2023
(This article belongs to the Section Physical Chemistry)

Abstract

:
In this work, we studied aqueous solutions of monoethanolamine (MEA), which are widely used to remove CO2 from flue and oil gases. This study combined experimental and theoretical methods of vibrational spectroscopy, using high-temperature infrared spectroscopy, quantum-chemical calculations of theoretical vibrational spectra, and structural electronic and energy characteristics of model structures. MEA has a propensity to form associations between various compositions and structures with water molecules, as well as those composed solely of water molecules. The structural and energy characteristics of such associates were analyzed in terms of their ability to interact and retain carbon dioxide. The influence of elevated temperatures and concentration of aqueous MEA solution on change in the structure of associates has also been investigated. An analysis of theoretical and experimental vibrational spectra allowed us to examine the IR spectra of MEA solutions, and identify the bands responsible for the formation of associates that would sorb CO2 well, but would delay its desorption from the solution.

1. Introduction

The absorption method of acidic components (CO2, SO2, CS2, etc.) removal from processed gases using aqueous solutions of ethanolamines, which has been used for almost one hundred years [1] in oil and gas industry at low impurity concentrations, still lacks alternative solutions [2,3]. The technology involved in carbon dioxide absorption from flue, oil or associated gases via aqueous solutions of ethanolamines, primarily monoethanolamine (MEA), consists of two successive processes: absorption of CO2 from a gas mixture and subsequent desorption of CO2 at the regeneration stage of the absorbent. The first stage is carried out at moderate temperatures (30–50 °C), and the second at rather high temperatures (120–140 °C). This determines the main drawback of this technology, since at elevated temperatures, intense thermal and thermo-oxidative degradation of MEA occurs [4,5,6,7]. Decomposition of MEA leads to significant economic losses due to a decrease in its absorption capacity and accelerated corrosion of equipment.
The lack of a widely used gas removal technology has inspired many studies on the analysis of MEA decomposition products. Dozens of different chemical compounds, found in MEA decomposition products, using modern physicochemical research methods [8,9,10,11,12], do not clarify the mechanism of transformation of MEA in aqueous solutions, in the presence of carbon dioxide. The authors of [13] concluded that IR Fourier spectroscopy is the most informative method for evaluating the products of the transformation of alkanolamines in aqueous solutions saturated with carbon dioxide. In [14,15], based on the study of specific electrical conductivity of alkanolamine solutions, it was suggested that both initial solutions and those saturated with CO2 aqueous MEA have a complex structure, forming various associations. Association that occurs in MEA solutions, according to these authors, determines the reason for the decrease in absorption capacity of MEA, and the need to regenerate the absorbent during operation.
In this work, we studied aqueous solutions of MEA at various concentrations at elevated temperatures. The aim of this study was to develop a method based on a comparison of experimental IR spectra (including high-temperature spectra) and theoretical vibrational spectra of corresponding models obtained from quantum-chemical calculations. This approach enables the reliable study of the structure of associates, formed during the interaction, and allows us to identify the supramolecular structures of these solutions (associates, micelles, etc.), as well as to study the mechanism of carbon dioxide sorption and desorption processes.

2. Results and Discussion

Structure and Vibrational Spectra of Aqueous Solutions of MEA

Since aqueous solutions of MEA are used in technological processes to remove CO2 from processed gases, it is necessary to establish the effect of the solvent (water) and absorbate (CO2) on the structural characteristics of MEA. The most promising research method for solving this problem is a combination of experimental and theoretical methods of vibrational spectroscopy, which make it possible to interpret recorded IR spectra of initial aqueous MEA solutions and those saturated with CO2.
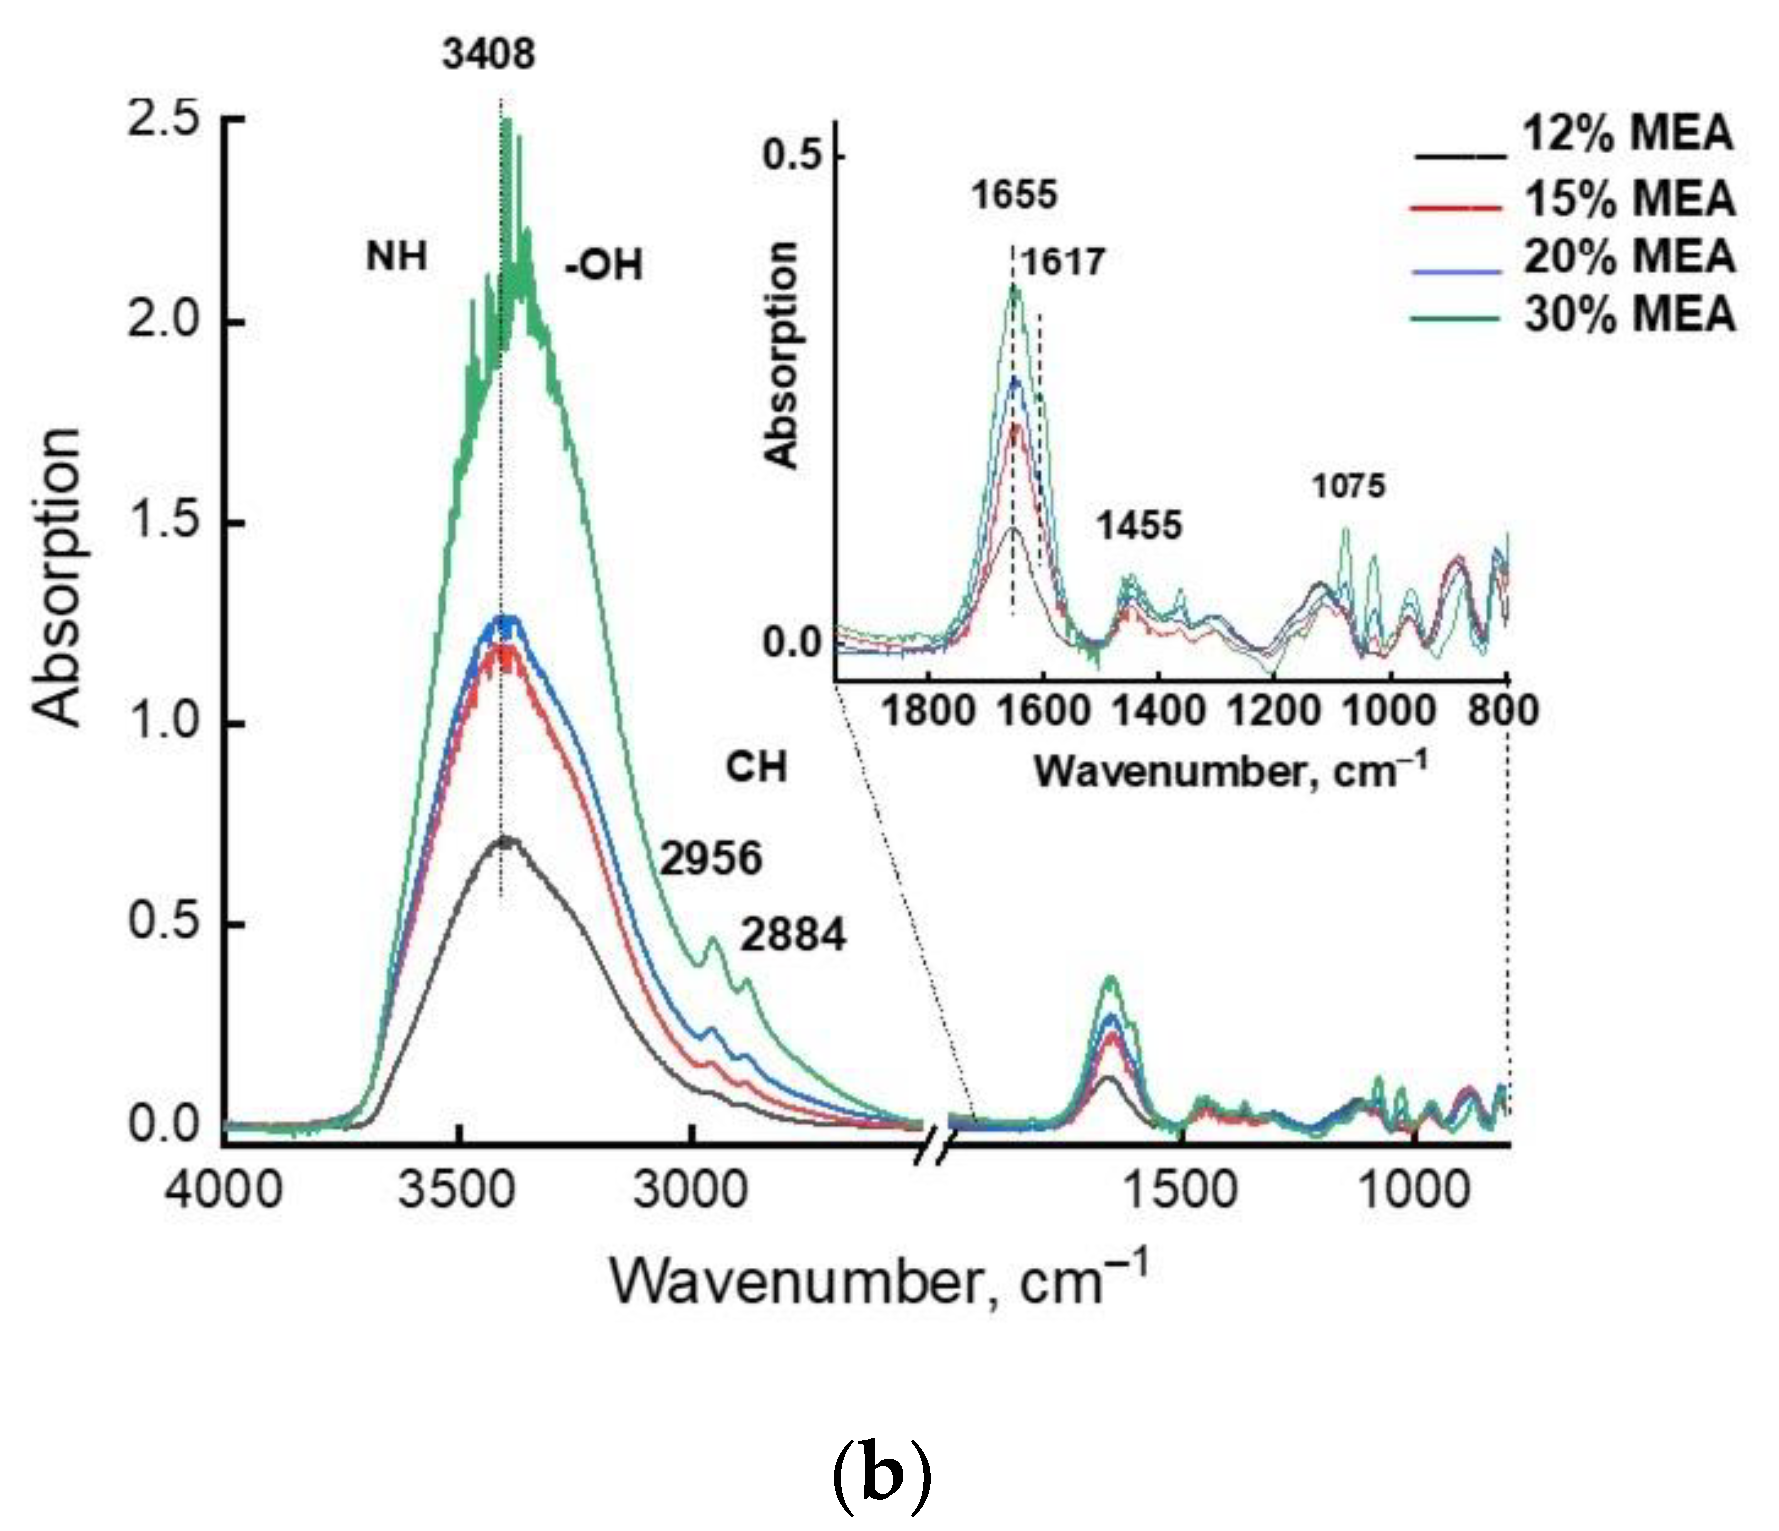
Figure 1a shows the IR spectrum of initial (undissolved) MEA, and Figure 1b shows a series of IR spectra of aqueous MEA solutions with different concentrations. There is practically no similarity between these spectra, even considering that in the spectra of Figure 1b, a very intense broad band with a maximum of 3408 cm−1 and a band of medium intensity at 1655 cm−1, are associated, respectively, with valence and deformation vibrations of water. At the same time, the spectra of aqueous solutions (Figure 1b) show significant changes in intensities and certain shifts of the bands in spectra of different concentrations.
Quantum-chemical calculations of an isolated MEA molecule in vacuum and water indicate the presence of two stable isomers (Figure 2a,b), one of which (a) has an almost flat transoidal structure (dihedral angle O-C-C-N is 178°), while the second (b), which is only 0.48 kcal/mol more favorable in terms of energy, has a non-planar gauche structure with a dihedral angle Q (O-C-C-N) = 64°.
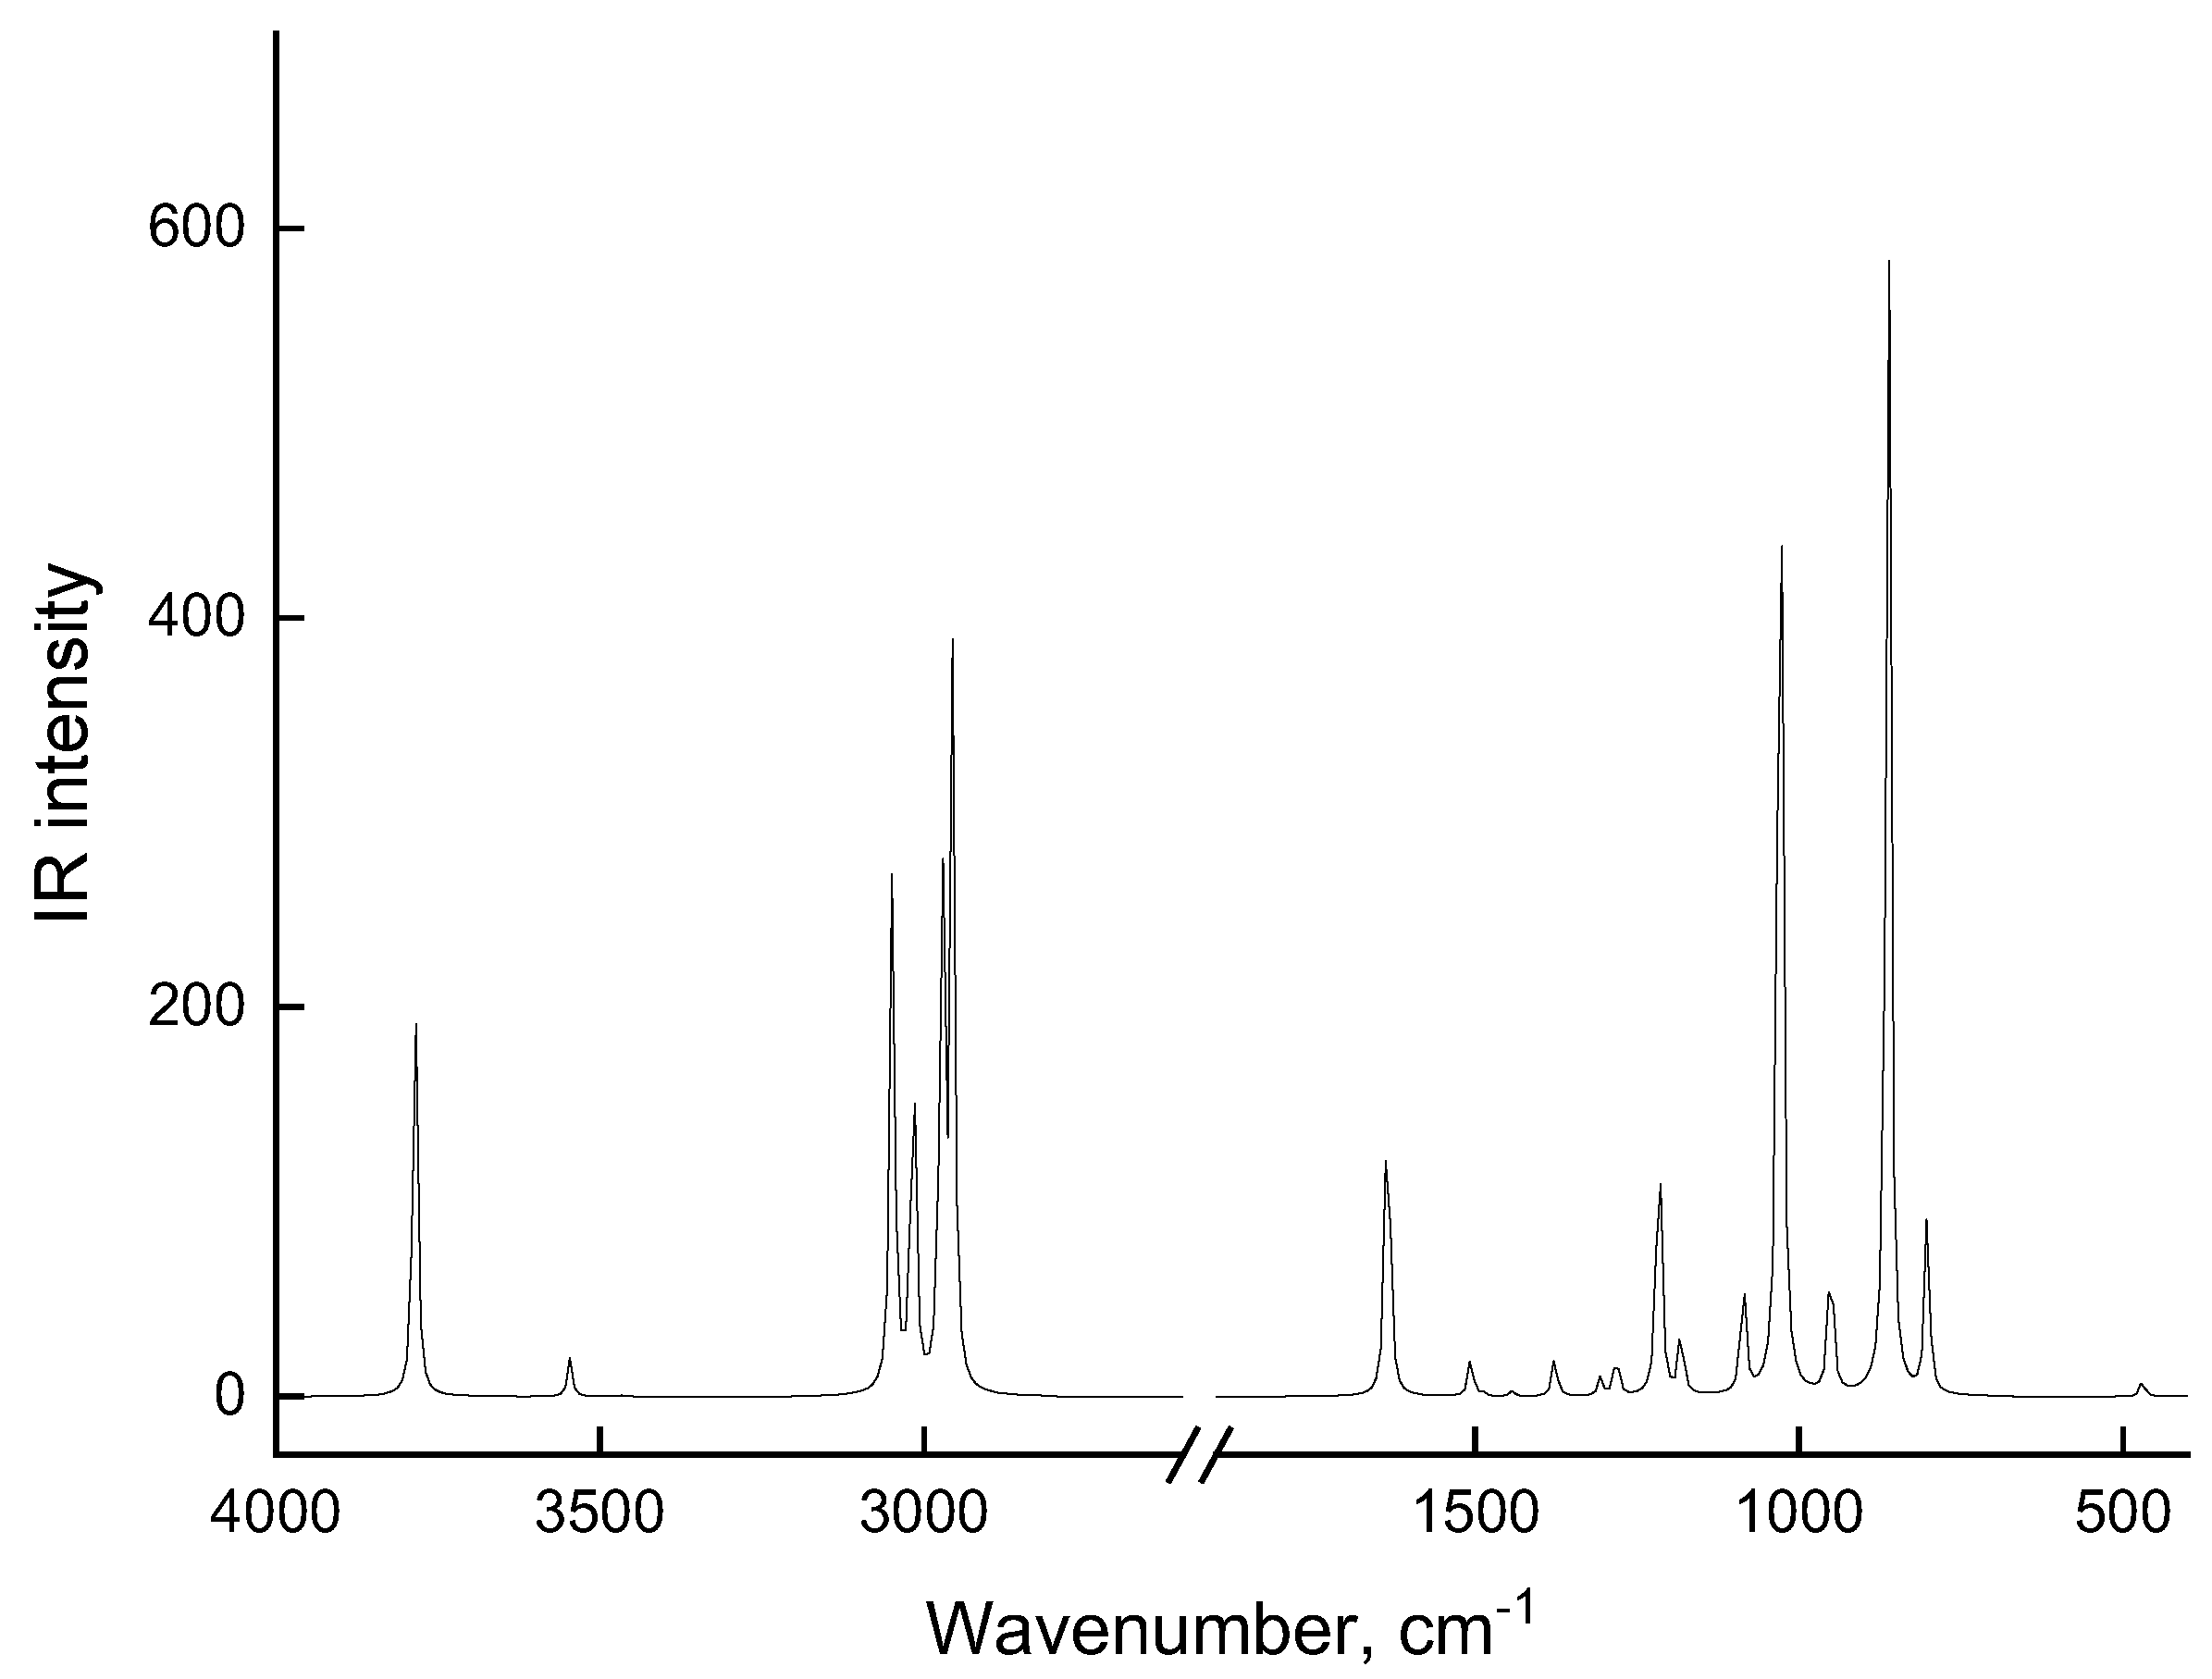
The theoretical spectrum of an individual molecule, shown in Figure 3, also bears little resemblance to the experimental spectrum in Figure 1. However, theoretical frequencies of 1060, 1395, and 1450 cm−1 coincide quite well in terms of the maximum with experimental MEA bands (Figure 1a). An analysis of vibrational modes in the theoretical MEA spectrum, which allows us to interpret IR spectrum bands, shows that frequency 1060 cm−1 is associated with stretching C-O bond (νC-O), and the other two frequencies (1395 and 1450 cm−1) refer to the bending of two CH2 groups (δCH2) in the MEA structure. All other theoretical frequencies—especially frequencies of the stretching and bending vibrations of the O-H and N-H bonds—differ significantly from the bands in experimental spectrum in Figure 1 both in terms of the positions of the maxima and in their intensity. Such differences in the theoretical and experimental IR spectra of MEA indicate that MEA molecules cannot exist as individual molecules. Instead, they exist in the form of associates in a liquid phase and in aqueous solutions.
Calculations show the possibility of MEA associate existence as dimers and linear trimers, with the formation of O-H …N hydrogen bonds between individual MEA molecules. The lengths of such hydrogen bonds are 2.1 Å in dimer and 2.3 Å in trimer forms. In this case, the association energy drops from 3.73 kcal/mol in the dimer to 3.28 kcal/mol in the trimer. According to the calculations, MEA tetramer already has a more complex structure: three molecules form a cyclic associate, and the fourth molecule is not associated with a cyclic trimer. Theoretical vibrational spectra of such associates are already in good agreement with the experimental IR spectrum of MEA shown in Figure 1a, especially if we compare the experimental IR spectrum with the superposition of theoretical spectra of two or three different models of associates.
MEA’s tendency to associate with water molecules is highly pronounced. Table 1 presents hydrogen bond lengths and association energies in these complexes, illustrating features of the presented structures of the complexes. Moreover, as calculations show, the association energy of MEA with water molecules is higher than the association energy of MEA⋯MEA (see Table 2). In theoretical spectra of such associates, there is a noticeable decrease in intensities of bands in the region 400–1600 cm−1, i.e., in the area stretching vibration of MEA and water, and a strong increase in the intensity of bands in the region of 3200–3600 cm−1 from stretching O-H and N-H bonds, which is in good agreement with the experimental spectra of aqueous MEA solutions (Figure 1b). Figure 4 shows the structures of MEA that associate with two water molecules (a) and associations between three MEA molecules with three water molecules. A structural feature of such associate complexes is the tendency to form hydrogen bonds between MEA molecules and water molecules, as well as the association between water molecules. In this case, association between MEA molecules in complex “b” does not occur, although this complex contains three MEA molecules. In aqueous MEA solutions, there is a tendency for individual MEA molecules to be surrounded by water molecules.
Table 2 presents structural (bond lengths, valence angles H-N-H, and dipole moments), electronic (charges on N, O, H atoms), and energy (energy of association in associate complexes) characteristics, as well as the lengths of hydrogen bonds in associates (for complex associates, the shortest hydrogen bonds are presented). In the first two lines of the table, the characteristics for the initial molecules (MEA and H2O) are presented for comparison.
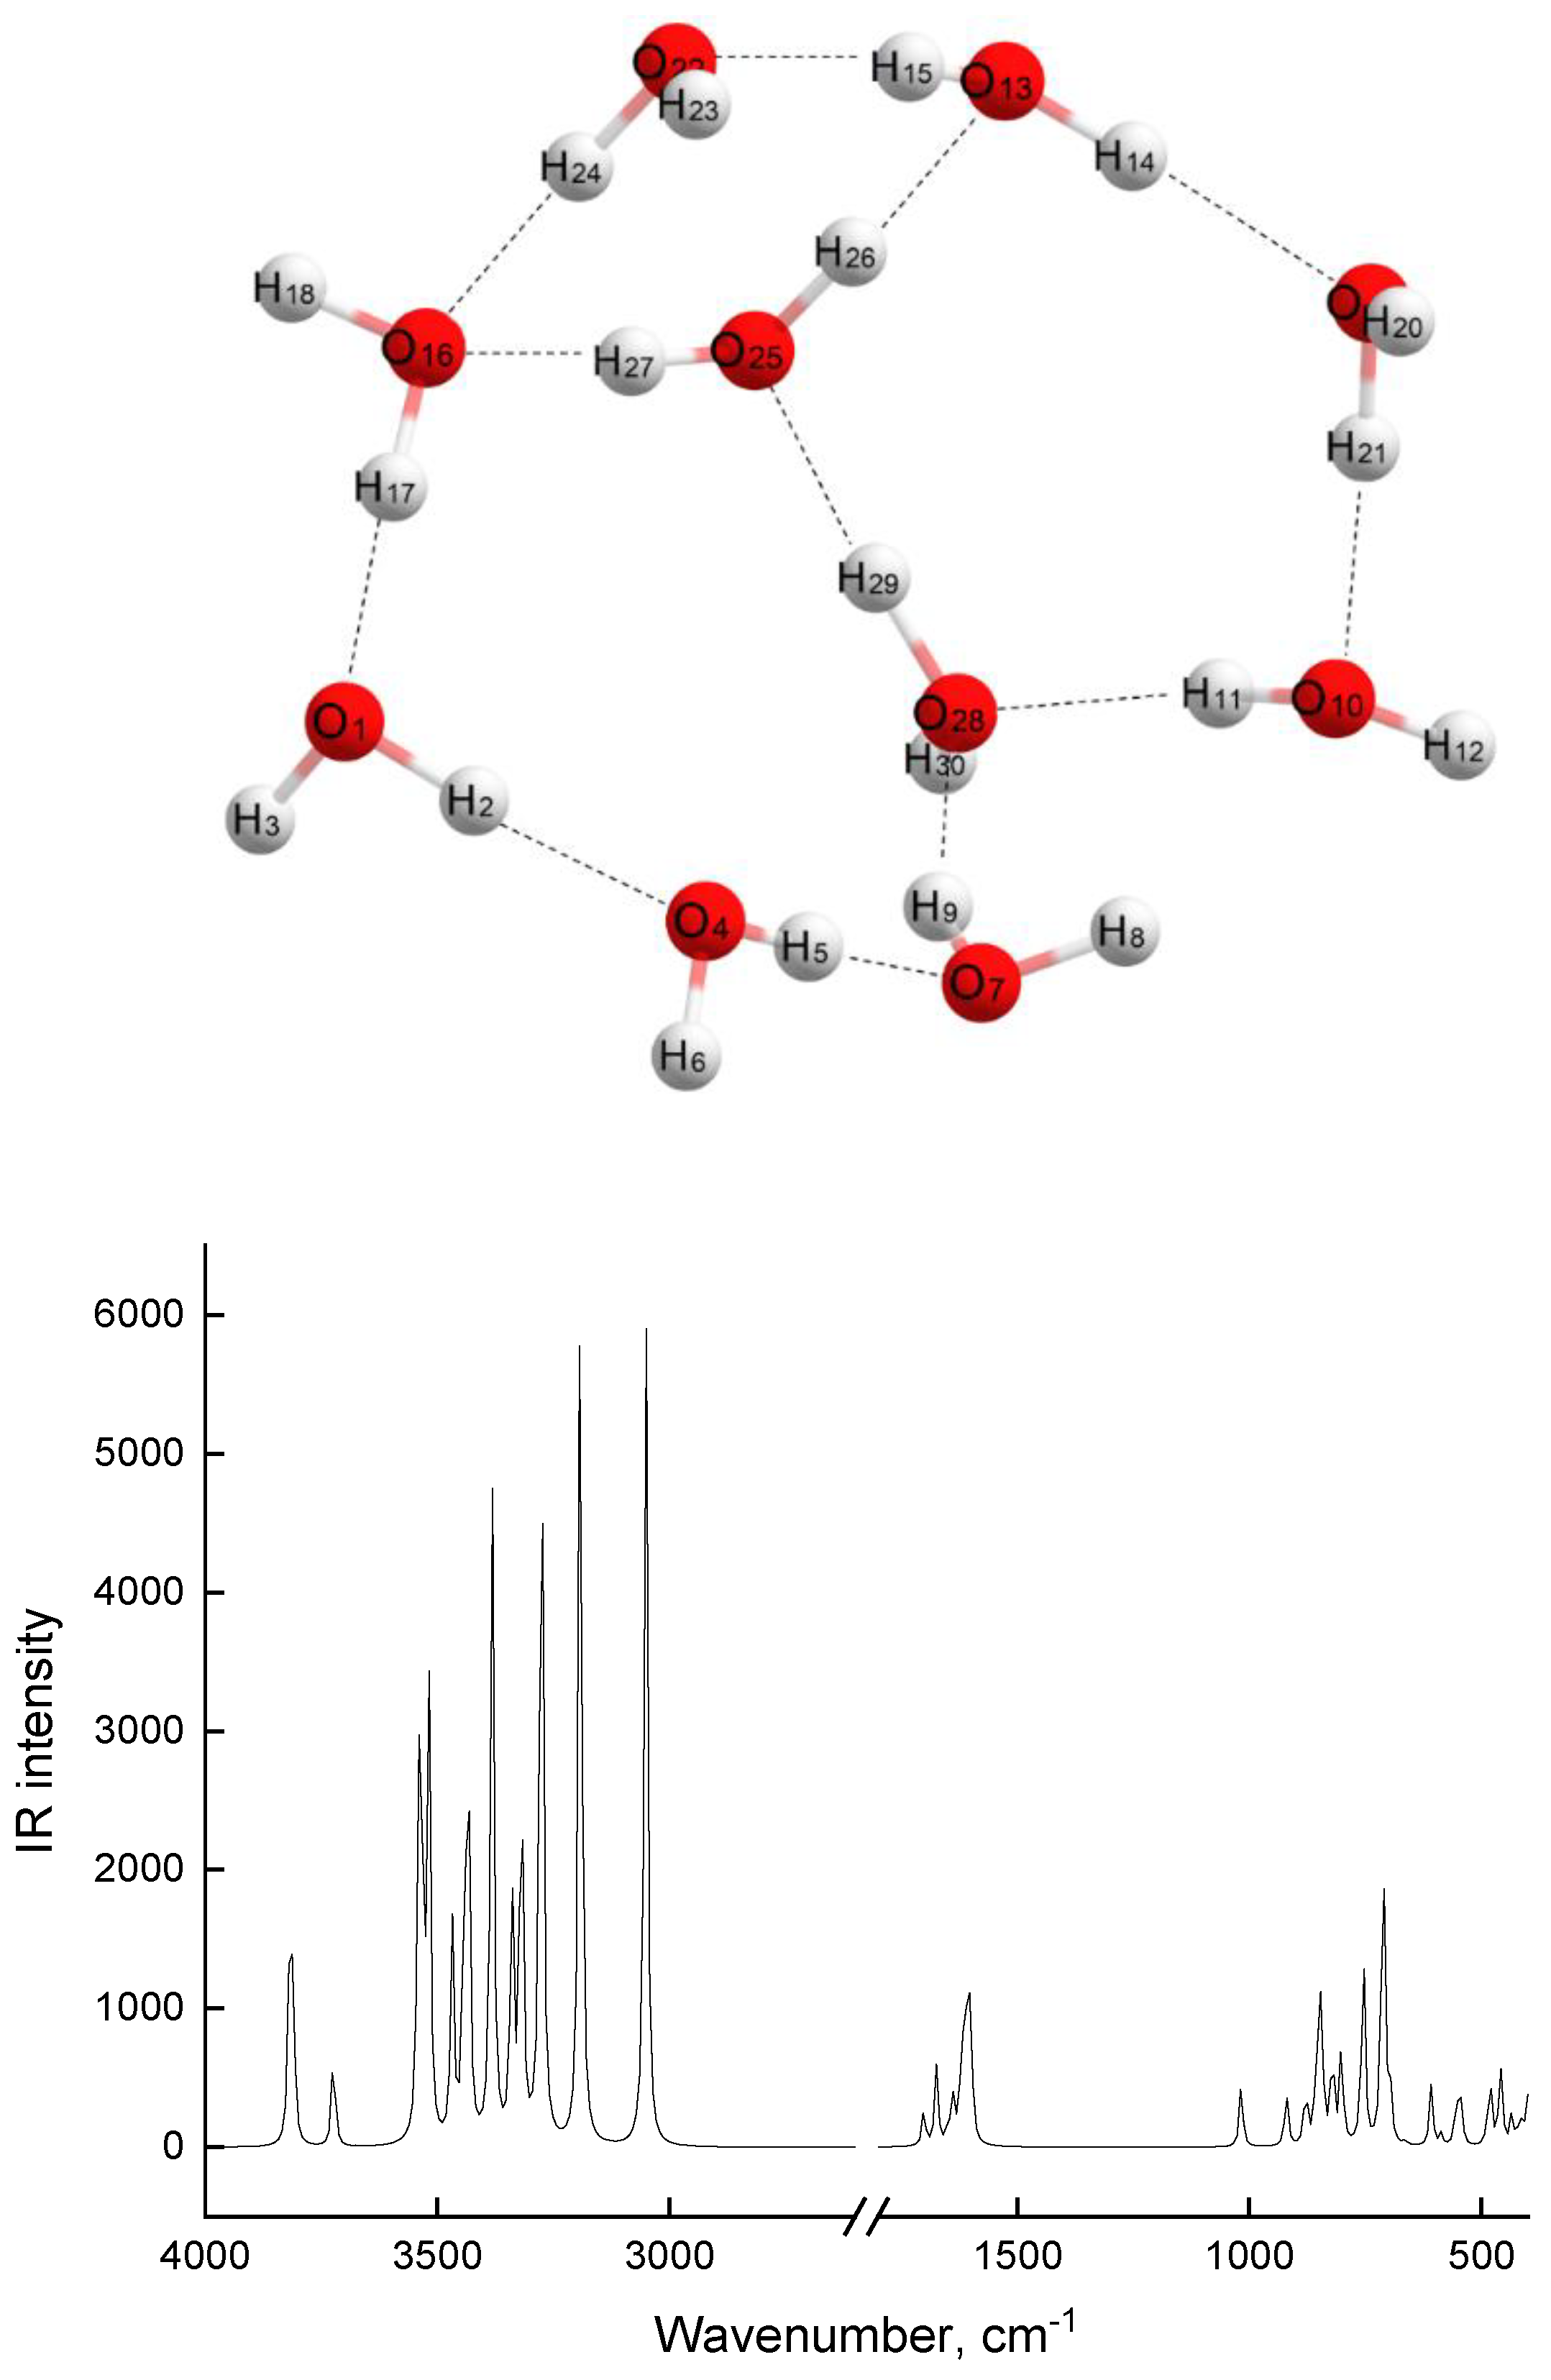
High stability of the MEA-10H2O associate complex (Figure 5) is due to a whole system of hydrogen bonds that arise between the oxygen and hydrogen atoms of water molecules, with lengths ranging from 1.9 to 1.7 Å.
The MEA molecule is also included in the hydrogen bonding system, with the shortest hydrogen bond, 1.693 Å, occurring between the O1 oxygen atom of MEA and the H41 hydrogen atom of the nearest water molecule. The MEA nitrogen atom is also linked to the H14 hydrogen atom from a water molecule via a 1.891 Å hydrogen bond. The entire associate complex is a three-way cycle, in which two cycles are composed exclusively of alternating valence and hydrogen O-H bonds of water molecules, and the distances between two oxygen atoms not bound by hydrogen bonds in these cycles are in a range 4.2–4.5 Å. The third cycle includes five associated water molecules and a MEA molecule. In this cycle, rather short distances (2.7 Å) between oxygen O1…O18 and O1…O39 atoms are realized. Notably, between H11 and O33 atoms, there is an internal hydrogen bond (2.5 Å). Despite the complexity of its structure, this associate has fairly high symmetry and its dipole moment has a small value of 2.825D. The nitrogen atom in the MEA molecule in the MEA-10H2O associate complex has a well-defined tetrahedral environment, since the H14-N4-C2 and H10-N4-H11 atoms lie in mutually perpendicular planes. Notably, in the initial MEA molecule, in all associates presented in Table 2 and other calculated models of associates (MEA-4H2O, MEA-8H2O), there is a trigonal pyramid structure around the nitrogen atom, at the top of which lies a nitrogen atom. At the base lies a carbon atom and two hydrogen atoms.
An associate of 10 water molecules (Figure 6) also has highly polarized O-H covalent bonds (Table 2) and 12 hydrogen bonds, with lengths ranging from 1.6 to 2.2 Å. As an associate complex of MEA-10H2O, this associate is also a three-way cycle. Two of the cycles include five and six water molecules, and the last one includes four water molecules. The diameter values of these cycles range from 4.8 to 5.5 Å. Considering that a linear carbon dioxide molecule has a length of 2.3 Å, one can imagine that CO2 molecules will easily enter the network formed by associates of 10 water molecules and can also easily leave it. CO2 molecules can easily enter the network formed by associates of MEA-10H2O; however, during desorption, especially from cycles in which MEA molecule is included, steric hindrances may arise, since in this cycle, there are diameters commensurate with the dimensions of the CO2 molecule.
Theoretical spectra calculated for MEA associates with 10 water molecules have a number of frequencies that are absent in theoretical spectra of simpler associates (with 2–8 water molecules). Such frequencies, presented in Table 3, have a high intensity and very complex oscillations. These frequencies arise from the vibrational motion of terminal -OH or -NH2 groups of MEAs, together with associated neighboring water molecules.
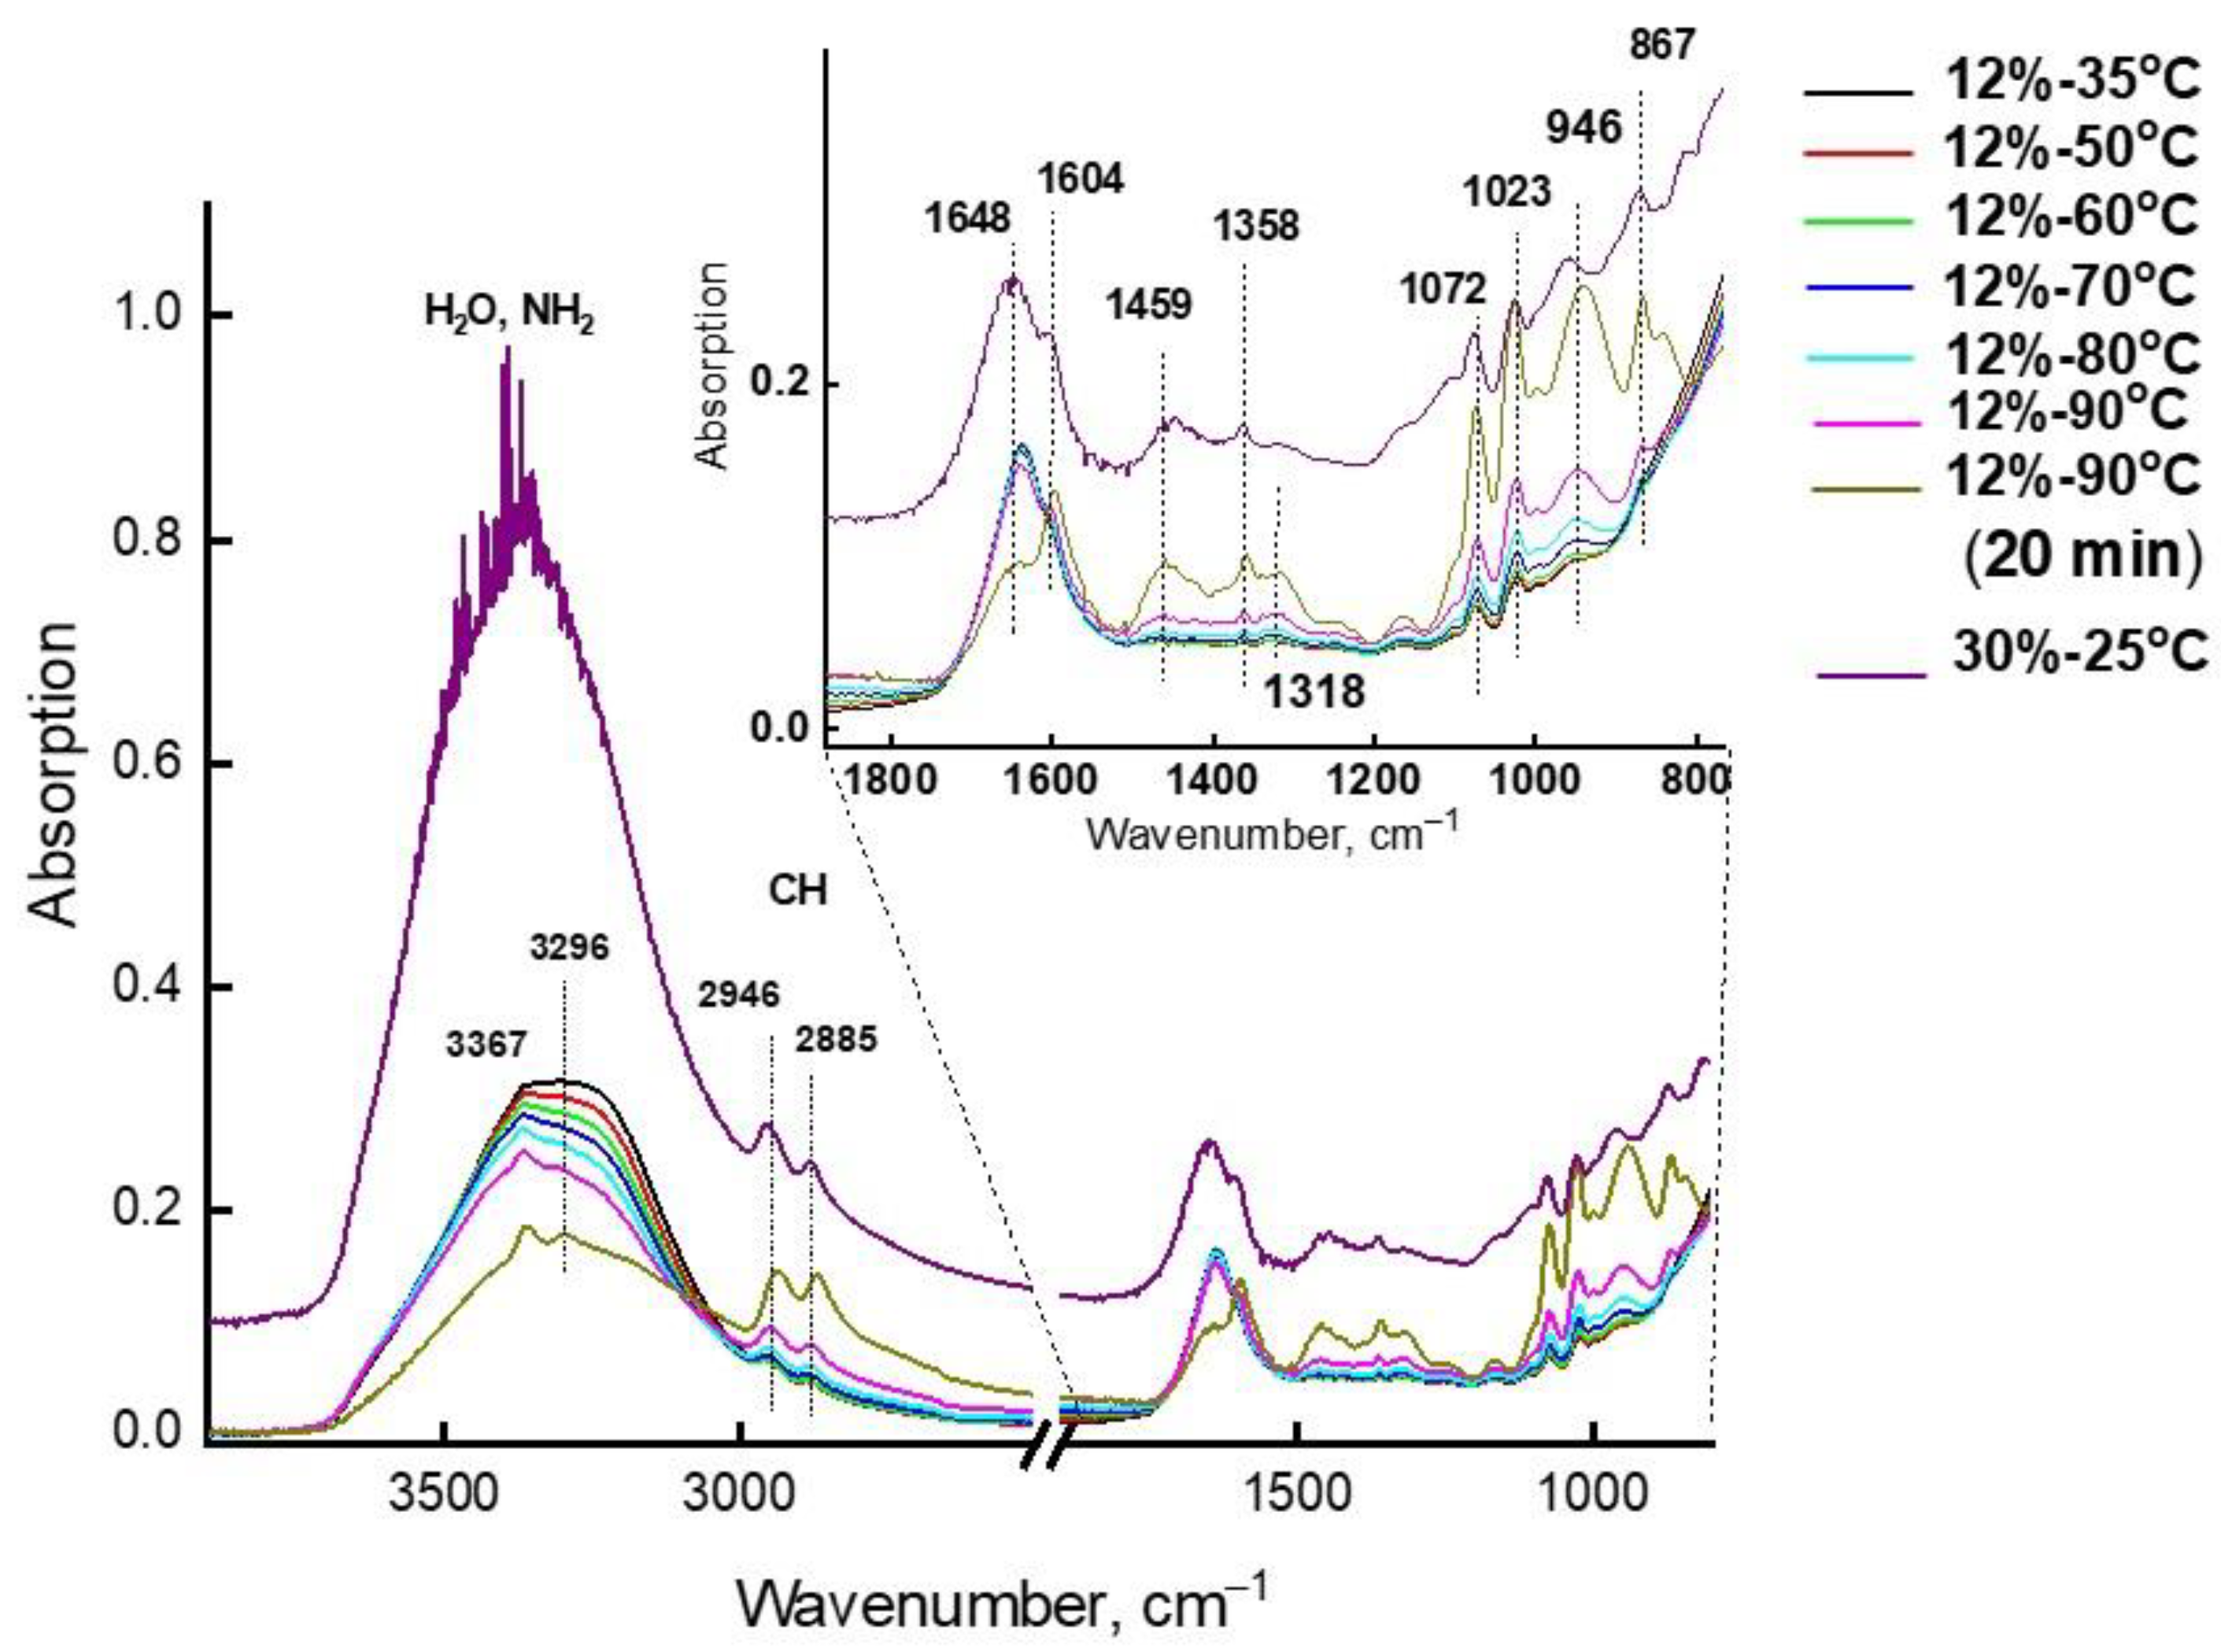
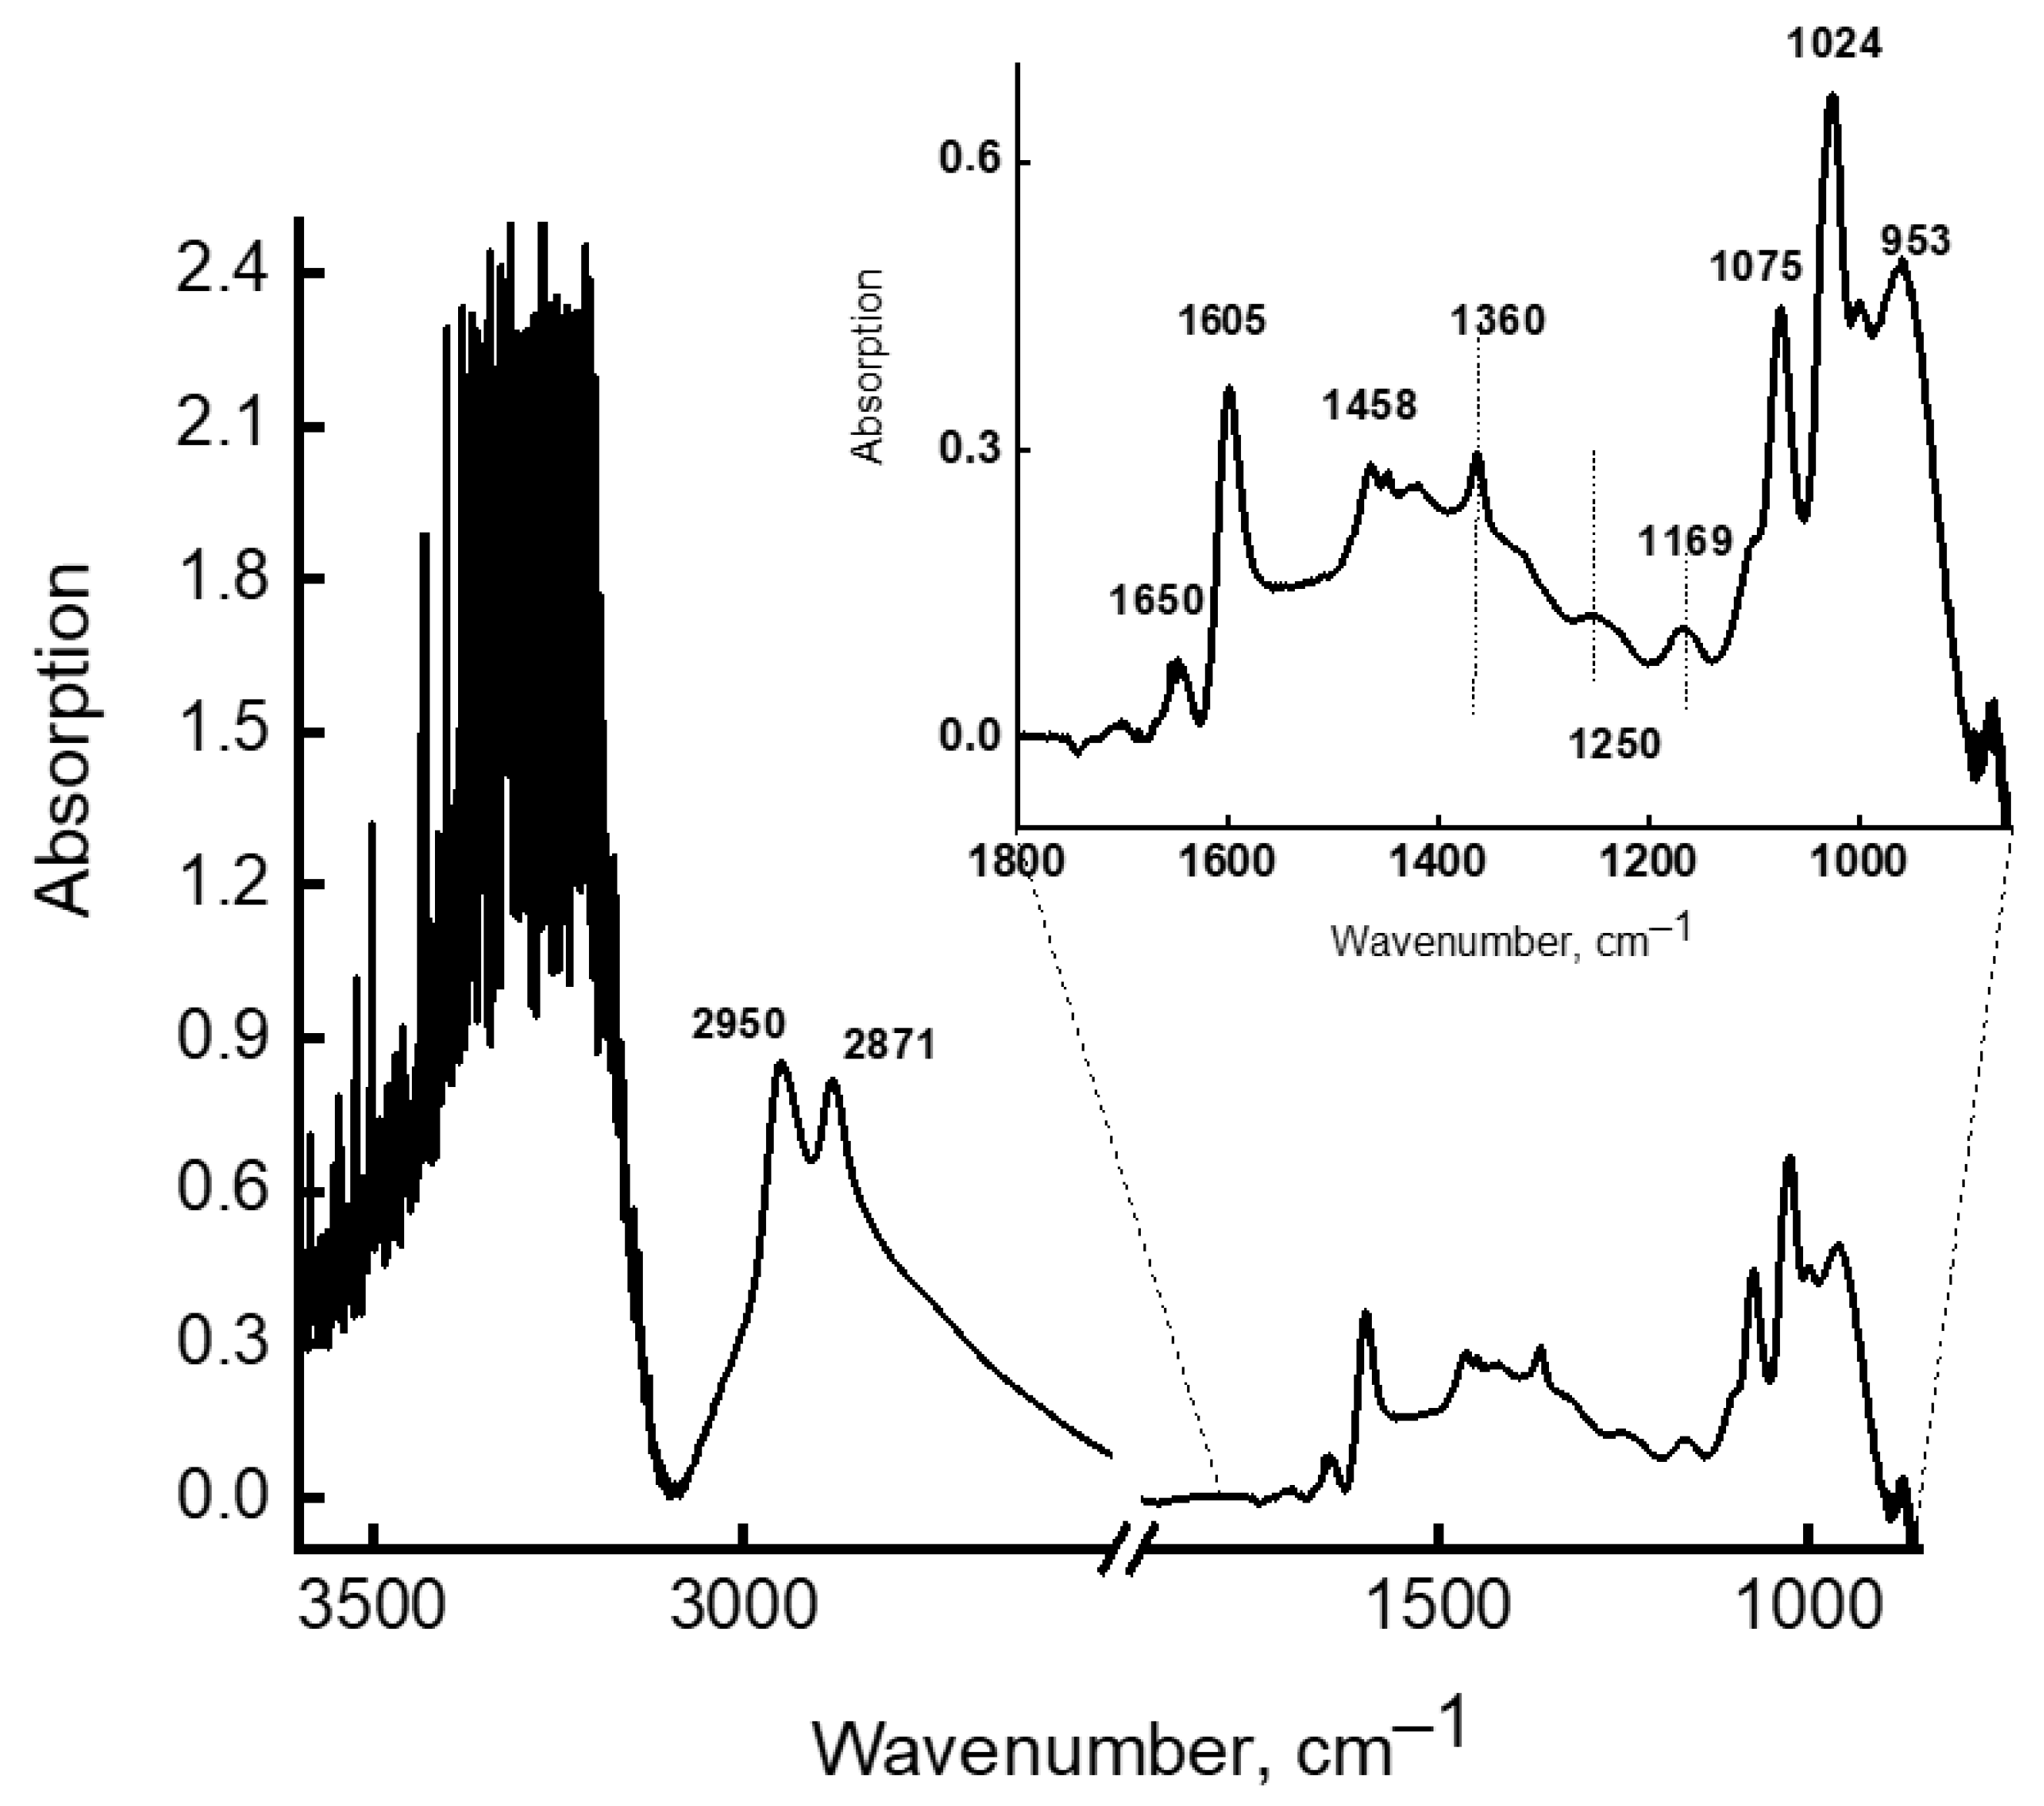
The theoretical frequencies presented in Table 3 are comparable with the experimental bands in the IR spectra of 12% MEA solution, registered at a temperature of 90 °C. They increase in intensity when this sample is maintained at 90 °C (Figure 7 and Figure 8). Figure 7 depicts IR spectra of 12% MEA solution, registered at elevated temperatures, demonstrating that as the temperature increases, the intensity of bands in the 3200–3600 cm−1 region decreases, and new weak bands appear in the long-wavelength region of the spectrum. These spectra were recorded in attenuated total reflectance (ATR) mode for a drop of solution placed on a heated console table, i.e., part of water evaporated from solution with an increase in temperature, which causes an increase in concentration of MEA, accompanied by an increase in the intensity of absorption bands of MEA and its strong associates, and a decrease in the intensity of bands from water. For comparison, the same figure shows the spectrum of a 30% aqueous solution of MEA, recorded at room temperature, which also shows new bands recorded in the spectrum of a 12% solution at 90 °C. The differential spectrum shown in Figure 8, obtained by subtracting the spectrum of water from the spectrum of a 30% aqueous solution of MEA, makes it possible to more clearly detect the bands associated only with MEA and its associated complexes. These bands, together with certain bands characterizing the structure of the MEA molecule, are presented in Table 3, and are comparable with theoretical spectra of MEA-10H2O associates. Analyzing data on the association energies of associates of various structures and the data in Table 4, on the number of water molecules per MEA molecule in aqueous solutions of various concentrations, for which IR spectra were recorded, we conclude that in low-concentration solutions (up to 20%), the probability of the formation of energy-intensive and highly stable associates of MEA-10H2O is much lower than in solutions with concentrations of 20% and above.
In slightly concentrated solutions at low temperatures (up to 80 °C), weak associates with a low association energy of 4–8 molecules (MEA-water) will be realized. The tendency to form stronger associates (lines 9, 10 in Table 2) due to the energy gain will be reduced to the formation of purely water associates (Line 9 in Table 2), which is due to a deficiency of MEA molecules in solution and a high-value (59.7 kcal/mol) association energy. In MEA solutions of this composition, any acid gas (CO2, SO2, CS2, etc.) will be easily sorbed and desorbed. In more concentrated MEA solutions (from 20 to 30%), the probability of formation of MEA-10H2O associate complexes increases significantly due to the implementation in such solutions of a close molar ratio of MEA:H2O and, most importantly, due to the gain in the association energy of such a complex (67.7 kcal/mol). In the presence of such strong associates, the acid gas sorption capacity of solution will not decrease, but the gases inside such associates will be retained for longer, due to their more constrained tricyclic structure (Figure 5), which hinders their ability to desorb gases. In addition, as discussed above, the MEA nitrogen atom in such an associate complex has a tetrahedral environment, which is characteristic of ammonium cations. Upon contact with CO2, the formation of a charge–transfer complex is possible, followed by the formation of an ammonium cation and a carbamate anion.
Thus, the study of aqueous solutions of MEA with various concentrations, carried out by a combination of experimental and theoretical methods of vibrational spectroscopy and quantum chemistry, allows us to draw the following conclusions:
  • MEA molecules with two hydrophilic groups have a high propensity to form associates with each other and with water molecules.
  • In aqueous solutions of MEA with a concentration of 7 to 30%, a large number of associate complexes are realized through MEA-H2O hydrogen bonds. The stability and lifetime of these bonds depend on the composition of the associate and on the number and the length of hydrogen bonds.
  • In aqueous solutions, where the concentration of which does not exceed 22%, primarily small associates are realized, in which MEA molecules are isolated from each other, due to their environment featuring energy-intensive associates from water molecules. In such solutions, both the absorption of carbon dioxide and its desorption can easily take place.
  • In aqueous solutions of MEA with a concentration above 22%, the probability of formation of very energy-intensive (67.7 kcal/mol) complexes of MEA-10H2O associates increases, the structure of which makes it possible to retain CO2 more firmly, i.e., it does not interfere with the absorption of acid gases, but hinders their desorption.
  • In IR spectra, the bands characterizing the energy-intensive associates of MEA-10H2O were identified (Table 3) and the conditions for the occurrence of such associates in aqueous solutions of MEA were established.

3. Materials and Methods

3.1. Materials and Characterization

A stand for obtaining homogeneous transparent aqueous solutions of MEA with various concentrations and sequential saturation of these solutions with carbon dioxide was developed and modified. Using this stand, transparent solutions of MEA in distilled water of six different concentrations in the range of 7.5–30 wt.% were prepared. For the preparation of solutions, MEA of chemically pure grade was used; the mass fraction of the main substance was 99.6%.

3.2. FTIR-Spectroscopy, High-Temperature ATR-FTIR Spectroscopy

IR spectra were recorded on an IFS-66-v/s vacuum FT-IR spectrometer (Bruker) in transmission mode (liquid cells with CaF2 glasses), using a heated cell and on a Vertex 70 spectrometer (Bruker, Billerica, MA, USA), using a special high-temperature “Platinum ATR” attachment (crystal diamond). The spectra were processed using the OPUS-7 software package.

3.3. Quantum-Chemical Calculations

Quantum-chemical calculations were performed using the Density Functional Method (DFT B3LYP/6–31++G(d,p)) and the Hartree–Fock Method (6–31++g(d,p)) in the Gaussian software package, with full optimization of all geometric parameters of the calculated models in two media (vacuum and water), providing the calculations to obtain theoretical vibrational spectra.

Author Contributions

Conceptualization, S.A.L., G.N.B., J.V.K., E.G.N. and S.D.B.; methodology, S.A.L., G.N.B., J.V.K., E.G.N. and S.D.B.; software, S.A.L., G.N.B. and E.G.N.; investigation, S.A.L., G.N.B., J.V.K., E.G.N., S.D.B., A.V.V. and V.V.V.; resources, S.D.B., A.V.V. and V.V.V.; data curation, S.A.L., G.N.B., J.V.K., E.G.N. and S.D.B.; writing—original draft preparation, S.A.L., G.N.B. and E.G.N.; writing—review and editing, S.A.L., G.N.B., J.V.K. and E.G.N.; visualization, S.A.L. and G.N.B.; supervision, G.N.B., A.V.V. and V.V.V.; project administration, S.A.L.; funding acquisition, S.D.B., A.V.V. and V.V.V. All authors have read and agreed to the published version of the manuscript.

Funding

This work was supported by the Russian Foundation for Basic Research (Grant No. 20-08-00644 A).

Institutional Review Board Statement

Not applicable.

Informed Consent Statement

Not applicable.

Data Availability Statement

Not applicable.

Conflicts of Interest

The authors declare no conflict of interest.

References

  1. Roger, B.R. Process for Separating Acidic Gases. U.S. Patent 1783901, 2 December 1930. [Google Scholar]
  2. Smith, G.D.; Tooley, N.; Cummings, A.L. Making amine systems sing, GPA Europe. In Proceedings of the Gas Processing Symposium, Barcelona, Spain, 13–15 May 2009. [Google Scholar]
  3. Talzi, V.P. Investigation of Product Composition Produced by Degradation of Monoethanolamines in Absorption Cleaning of Exhaust Gas. Russ. J. Appl. Chem. 2010, 83, 1139–1146. [Google Scholar] [CrossRef]
  4. Rochelle, G.T. Amine Scrubbing for CO2 Capture. Science 2009, 325, 1652–1654. [Google Scholar] [CrossRef] [PubMed]
  5. Moser, P.; Schmidt, S.; Stahl, K. Investigation of Trace Elements in the Inlet and Outlet Streams of a MEA-Based Post-Combustion Capture Process Results from the Test Programme at the Niederaussem Pilot Plant. Energy Procedia 2011, 4, 473–479. [Google Scholar] [CrossRef] [Green Version]
  6. Wang, T.; Hovland, J.; Jens, K.J. Amine Reclaiming Technologies in Post-Combustion Carbon Dioxide Capture. J. Environ. Sci. 2015, 27, 276–289. [Google Scholar] [CrossRef] [PubMed]
  7. Lv, B.; Guo, B.; Zhou, Z.; Jing, G. Mechanisms of CO2 Capture into Monoethanolamine Solution with Different CO2 Loading during the Absorption/Desorption Processes. Environ. Sci. Technol. 2015, 49, 10728–10735. [Google Scholar] [CrossRef] [PubMed]
  8. Talzi, V.P.; Ignashin, S.V. NMR Study of Decomposition of Monoethanolamine under Conditions of Industrial Gas Treatment. Russ. J. Appl. Chem. 2002, 75, 80–85. [Google Scholar] [CrossRef]
  9. Talzi, V.P. NMR Determination of the Total Composition of Commercial Absorbents Based on Monoethanolamine. Russ. J. Appl. Chem. 2004, 77, 430–434. [Google Scholar] [CrossRef]
  10. Strazisar, B.R.; Anderson, R.R.; White, C.M. Degradation Pathways for Monoethanolamine in a CO2 Capture Facility. Energy Fuels 2003, 17, 1034–1039. [Google Scholar] [CrossRef]
  11. Bello, A.; Idem, R.O. Pathways for the Formation of Products of the Oxidative Degradation of CO2-Loaded Concentrated Aqueous Monoethanolamine Solutions during CO2 Absorption from Flue Gases. Ind. Eng. Chem. Res. 2005, 44, 945–969. [Google Scholar] [CrossRef]
  12. Chi, S.; Rochelle, G.T. Oxidative Degradation of Monoethanolamine. Ind. Eng. Chem. Res. 2002, 41, 4178–4186. [Google Scholar] [CrossRef]
  13. Jackson, P.; Robinson, K.; Puxty, G.; Attalla, M. In Situ Fourier Transform-Infrared (FT-IR) Analysis of Carbon Dioxide Absorption and Desorption in Amine Solutions. Energy Procedia 2009, 1, 985–994. [Google Scholar] [CrossRef] [Green Version]
  14. Vasilevskii, V.P.; Novitskii, E.G.; Volkov, V.V. Electro membrane regeneration of amine solutions of gas processing plants. Membrany 2010, 48, 26–28. [Google Scholar]
  15. Novitskii, E.G.; Vasilevskii, V.P.; Vasil’eva, V.I.; Goleva, E.A.; Grushevenko, E.A.; Volkov, A.V. Effect of Composition and Structure of Aqueous Monoethanolamine Solutions on Carbon Dioxide Sorption and Desorption in Purification of Gas Mixtures. Russ. J. Appl. Chem. 2018, 91, 813–821. [Google Scholar] [CrossRef]
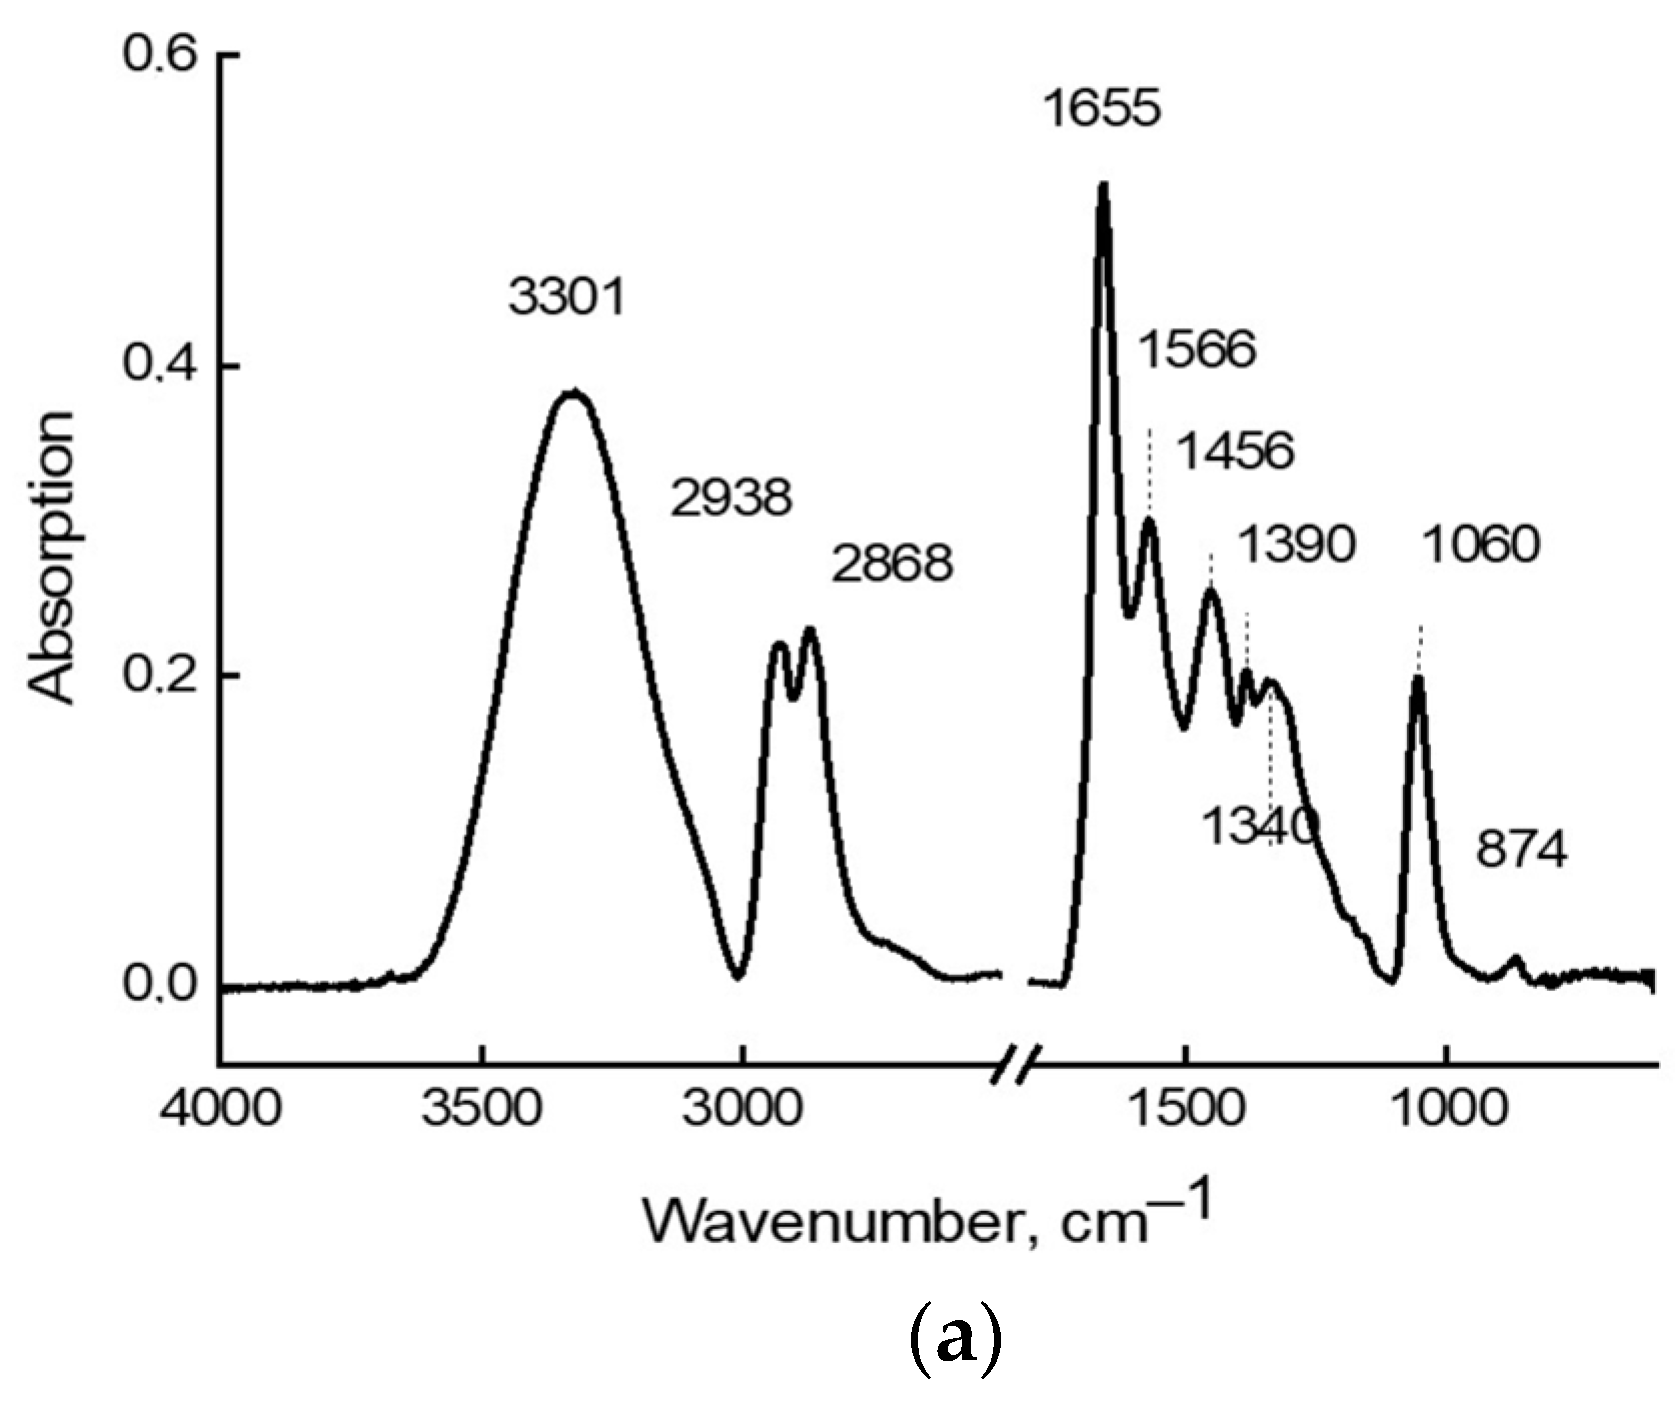
Figure 1. IR absorption spectra of (a) anhydrous MEA; (b) MEA aqueous solutions of various concentrations (12%, 15%, 20%, and 30%, respectively) recorded at room temperature.
Molecules 28 00403 g001aMolecules 28 00403 g001b
Figure 2. Models of two isomers of individual MEA molecules (transoidal (a) and gauche (b) structures).
Molecules 28 00403 g002
Figure 3. Theoretical IR spectrum of a flat transoidal model of the MEA.
Molecules 28 00403 g003
Figure 4. Structure of associate complexes: (a) MEA-2H2O, (b) 3 MEA-3H2O.
Molecules 28 00403 g004
Figure 5. Model of MEA-10 H2O complex and theoretical IR spectrum of MEA-10H2O model.
Molecules 28 00403 g005
Figure 6. Model of 10H2O associate complex and theoretical IR spectrum of 10H2O model.
Molecules 28 00403 g006
Figure 7. High-temperature IR absorption spectra of 12% aqueous MEA solutions: 1–35 °C, 2–50 °C, 3–60 °C, 4–70 °C, 5–80 °C, 6–90 °C, 7–90 °C after 20 min; 8-MEA (30 %) at 25 °C.
Molecules 28 00403 g007
Figure 8. Differential spectrum of MEA (30%) registered at 90 °C.
Molecules 28 00403 g008
Table 1. Hydrogen bond lengths and association energies in complexes Figure 4.
Associate ModelE∆, kcal/molHydrogen Bond Lengths (Å)
MEA2H2O−9.11MEA⋯H2O1.816 (O1-H13)
H2O⋯H2O2.539 (O15-H11)
3MEA⋯3H2O−17.87MEA⋯H2O2007 (N4-H42)
1.987 (O1-H13)
1.952 (O29-H14)
1.968 (O15-H41)
1.878 (O26-H19)
H2O⋯H2O1.904 (O12-H28)
3.092 (O26-H14)
MEA⋯MEA2.022 (O15-H33)
Table 2. Structural, electronic, and energy characteristics of models of various associates in comparison with the initial models of MEA and H2O. An analysis of data presented in Table 2 allows us to conclude that association energy, which determines the stability of a complex, depends significantly on the structure of the complex and, to a large extent, on the number of hydrogen bonds. As the strength of the associate increases, the polarizability of N-H and O-H atoms involved in association increases, i.e., positive charges on hydrogen atoms and negative charges on oxygen and nitrogen atoms involved in the association increase. Lengths of hydrogen bonds in the most stable complexes are shorter, while bonds between atoms inside the molecule are lengthened. From the data in Table 2, it is obvious that all listed changes in structural and electronic characteristics are more pronounced in the MEA-10H2O associate, as well as in the associate of 10 water molecules (last 2 rows of Table 2). Structures of these associates, together with the theoretical vibrational spectra, are shown in Figure 5 and Figure 6. In these associates, oxygen atoms arise in water molecules with a negative charge equal to −1, and the total charge of two protons at such oxygen atoms is equal to +1.
No.Associate ModelE. kcal/molBond Lengths (Å)Charges on Atoms (e)Angle
H-N-Ho
Dip. Moment (D)
MEAH2O:O-HHO⋯HHN⋯HMEAH2O
O-HN-HNHNOHoOH
1MEA-0.9671.017---0.60+0.31−0.54+0.37--106.32.232
2H2O---0.967-------+0.38-2.456
32 MEA−3.730.9501.00--2.090−0.78+0.31−0.68+0.36--106.90.516
43 MEA−3.280.9451.002--2.281−0.78+0.31−0.68+0.36--106.57.120
52H2O−5.02--0.9482.040-----−0.76+0.42-3.296
6MEA-H2O−5.510.9431.0000.9492.001-−0.63+0.29−0.63+0.37−0.78+0.44107.62.884
7MEA-2H2O−9.110.9681.0200.9831.8152.359−0.61+0.33−0.57+0.40−0.84+0.45106.93.589
83 MEA-3H2O−17.870.9551.0020.9571.8782.007−0.77+0.30−0.72+0.38−0.75+0.41106.23.650
910H2O−59.70--0.9951.645-----−1.06+0.66-7.660
10MEA-10H2O−67.740.9881.0200.9921.6931.890−0.66+0.45−0.94+0.49−1.00+0.50109.12.825
Table 3. Comparison of theoretical frequencies of associate-complex MEA-10H2O with the experimental spectra (Figure 7 and Figure 8) and their attribution.
No.Theoretical Frequency,
cm−1
Intensity
Con. UNITS
Infrared Band,
CM−1
Attribution
1 *270.8-δOH (H2O)
2324.9--“-
3441.1--“-
4473.0--“-
5523.9--“-
1858 + 865293867 m *H2O⋯H2O⋯H2O
2947166946 mH2O⋯H2O⋯NH2
310272301024 mNH2⋯ H2O + OH⋯OH2
410801101075 mH2O ⋯H2O⋯H2O⋯NH2
51147141169 mδNH2 + OH⋯OH2
61268561250 mδNH2-CH2
71352121358 mδCH2
814561121458 mδCH2
916182521605 mH2O⋯H2O⋯H2O
101653781650NH2⋯H2O
* The first five theoretical frequencies have positive values, i.e., they are not “imaginary”, which confirms the presence of the molecule (the associate complex MEA-10H2O) in the energy global minimum.
Table 4. The ratio of % concentration of MEA in water and the number of water molecules per 1 molecule of MEA in these solutions.
Concentration (%) MEA712152030
Number of H2O molecules per 1 MEA molecule45.024.819.213.67.9
Disclaimer/Publisher’s Note: The statements, opinions and data contained in all publications are solely those of the individual author(s) and contributor(s) and not of MDPI and/or the editor(s). MDPI and/or the editor(s) disclaim responsibility for any injury to people or property resulting from any ideas, methods, instructions or products referred to in the content.