Article

Comparative Metabolite Fingerprinting of Four Different Cinnamon Species Analyzed via UPLC–MS and GC–MS and Chemometric Tools

1
Pharmacognosy Department, College of Pharmacy, Cairo University, Kasr El Aini St., Cairo 11562, Egypt
2
Phytochemistry Department, National Organization for Drug Control and Research, Giza 12622, Egypt
3
Institute of Systems Biology (INBIOSIS), Universiti Kebangsaan Malaysia (UKM), Bangi 43600, Selangor, Malaysia
4
German Centre for Integrative Biodiversity Research (iDiv) Halle-Jena-Leipzig, Puschstraße 4, 04103 Leipzig, Germany
5
Institute of Biodiversity, Friedrich Schiller University Jena, Dornburger-Str. 159, 07743 Jena, Germany
6
Department of Food Development and Food Quality, Institute of Food Science and Human Nutrition, Gottfried Wilhelm Leibniz University Hannover, Am KleinenFelde 30, 30167 Hannover, Germany
7
Pharmacognosy Department, Faculty of Pharmacy, University of Sadat City, Sadat City 32897, Egypt
*
Authors to whom correspondence should be addressed.
Molecules 2022, 27(9), 2935; https://doi.org/10.3390/molecules27092935
Submission received: 28 March 2022 / Revised: 25 April 2022 / Accepted: 28 April 2022 / Published: 4 May 2022
(This article belongs to the Special Issue Chemometrics in Analytical Chemistry)

Abstract

:
The present study aimed to assess metabolites heterogeneity among four major Cinnamomum species, including true cinnamon (Cinnamomum verum) and less explored species (C. cassia, C. iners, and C. tamala). UPLC-MS led to the annotation of 74 secondary metabolites belonging to different classes, including phenolic acids, tannins, flavonoids, and lignans. A new proanthocyanidin was identified for the first time in C. tamala, along with several glycosylated flavonoid and dicarboxylic fatty acids reported for the first time in cinnamon. Multivariate data analyses revealed, for cinnamates, an abundance in C. verum versus procyandins, dihydro-coumaroylglycosides, and coumarin in C. cassia. A total of 51 primary metabolites were detected using GC-MS analysis encompassing different classes, viz. sugars, fatty acids, and sugar alcohols, with true cinnamon from Malaysia suggested as a good sugar source for diabetic patients. Glycerol in C. tamala, erythritol in C. iners, and glucose and fructose in C. verum from Malaysia were major metabolites contributing to the discrimination among species.

1. Introduction

Cinnamon is produced mainly from the dried inner bark of various evergreen trees from the genus Cinnamomum [1]. The genus Cinnamomum, a member of the Lauraceae family, includes ca. 250 species cultivated widely in sub-tropical and tropical Asia, Africa, and South America for their culinary and medicinal attributes [2]. As it is traded on a global scale, cinnamon also has economic importance, with Sri Lanka considered the world’s largest supplier of cinnamon products. It was reported that Sri Lanka exported cinnamon in various forms in 2016, with an estimated value of USD 167 million [3]. There are two distinct species of cinnamon, namely, C. verum (syn. C. zeylanicum), known as true cinnamon, and C. cassia (syn. C. aromaticum.), recognized as Chinese cinnamon [4]. True cinnamon, also known as Ceylon cinnamon, is indigenous to Sri Lanka [5], while Chinese cinnamon is native to South-East China [6]. True cinnamon has been substituted by Chinese cinnamon, available at a much lower price, albeit the latter encompassed higher levels of coumarin (ca. 0.31 mg/g), posing health risks when consumed regularly owing to its hepatotoxicity [7]. Other Cinnamomum species included C. tamala from North India [8] and C. iners from Central Malaysia [9].
Cinnamon is marked by a pungent aromatic taste with a spicy warm woody fragrance that is mediated mainly via its chemicals (E)-cinnamaldehyde and eugenol [10]. Therefore, cinnamon is employed as a seasoning and flavoring agent in cuisine, baked products, ice cream, and confections [11], but the presence of a toxic compound, coumarin, has raised safety concerns [7]. It was pointed out that (E)-cinnamaldehyde may constitute 40 to 90% of the volatile oils obtained from cinnamon bark [12]. During the storage of cinnamon oil, (E)-cinnamaldehyde is subjected to oxidation, forming benzaldehyde [13].
Aside from its culinary properties, cinnamon has been widely used in traditional folk medicine to relieve headache, toothache, flatulence, amenorrhea, common cold, and diarrhea [14]. Pharmacological studies confirmed cinnamon bark’s therapeutic effects viz., antimicrobial, anti-ulcerogenic, anti-allergic, antihypertensive, antioxidant, antidiabetic, antipyretic, hypolipidemic, and chemo-preventive effects [15]. A myriad of these biological activities, i.e., anti-obesity, cytotoxic, antibacterial, anti-mutagenic, anti-hyperglycemic, were attributed to (E)-cinnamaldehyde [16].
When considering its unique chemical composition, cinnamon is well-known for its richness in aromatics, diterpenes, and polyphenols [6]. Previous studies reported that C. zeylanicum comprised terpenoids, tannins, alkaloids, saponins, and considerable quantities of flavonoids and phenolics [17], while (E)-cinnamaldehyde, benzyl alcohol, and eugenol are the major components of the essential oil [18]. However, another study on the same species revealed that (E)-cinnamaldehyde, cinnamyl acetate, and linalool were the predominant constituents of the essential oil [19] and suggestive of origin based differences as typical in an essential oil [20]. Diethyl malonate (7%) was considered a major component besides (E)-cinnamaldehyde in C. tamala bark oil [21]. Differences in herbal product composition based on origin, genotype, or processing methods warrant for development of analytical methods for the quality control of these valuable drugs, as in the case of cinnamon [22].
Recently, advanced chemical profiling has made a tremendous contribution to the quality control and analysis of food metabolomics or foodomics [23,24]. In order to analyze food components on a metabolite level, hyphenated techniques such as liquid chromatography (LC) or gas chromatography (GC) coupled to mass spectrometry (MS) are performed, improving the opportunity to detect minor or novel metabolites in a complex sample [25]. Additionally, the quantitative NMR metabolomics approach was previously used to distinguish between true cinnamon (C. verum) and Chinese cinnamon (C. cassia), which are interchangeably used in food products [22].
Aside from its excellent resolution and high mass accuracy, high throughput UPLC-MS-based metabolomics represented key steps in investigating phytochemical differences across various plant genera in addition to closely related species and taxa [26]. With stable separation and great peak resolution, GC-MS is a powerful platform providing metabolite annotation in a relatively simple manner [27]. While most studies on cinnamon have targeted certain classes of metabolites, a large-scale metabolomics analysis was adopted in this study to characterize the secondary and primary constituents of this economically important spice in the context of the genetic diversity depicted by four different Cinnamomum species viz., C. cassia, C. iners, C. tamala and C. verum. This study provides detailed insight into the Cinnamomum species’ bioactive makeup to achieve reliable sample classifications in addition to biomarkers discovery of C. verum adulteration. A comprehensive profile for the main metabolites distinguishing C. verum based on UPLC-MS and GC-MS metabolomics approaches is presented and to be adopted for determining other factors or in other nutraceuticals.

2. Results and Discussion

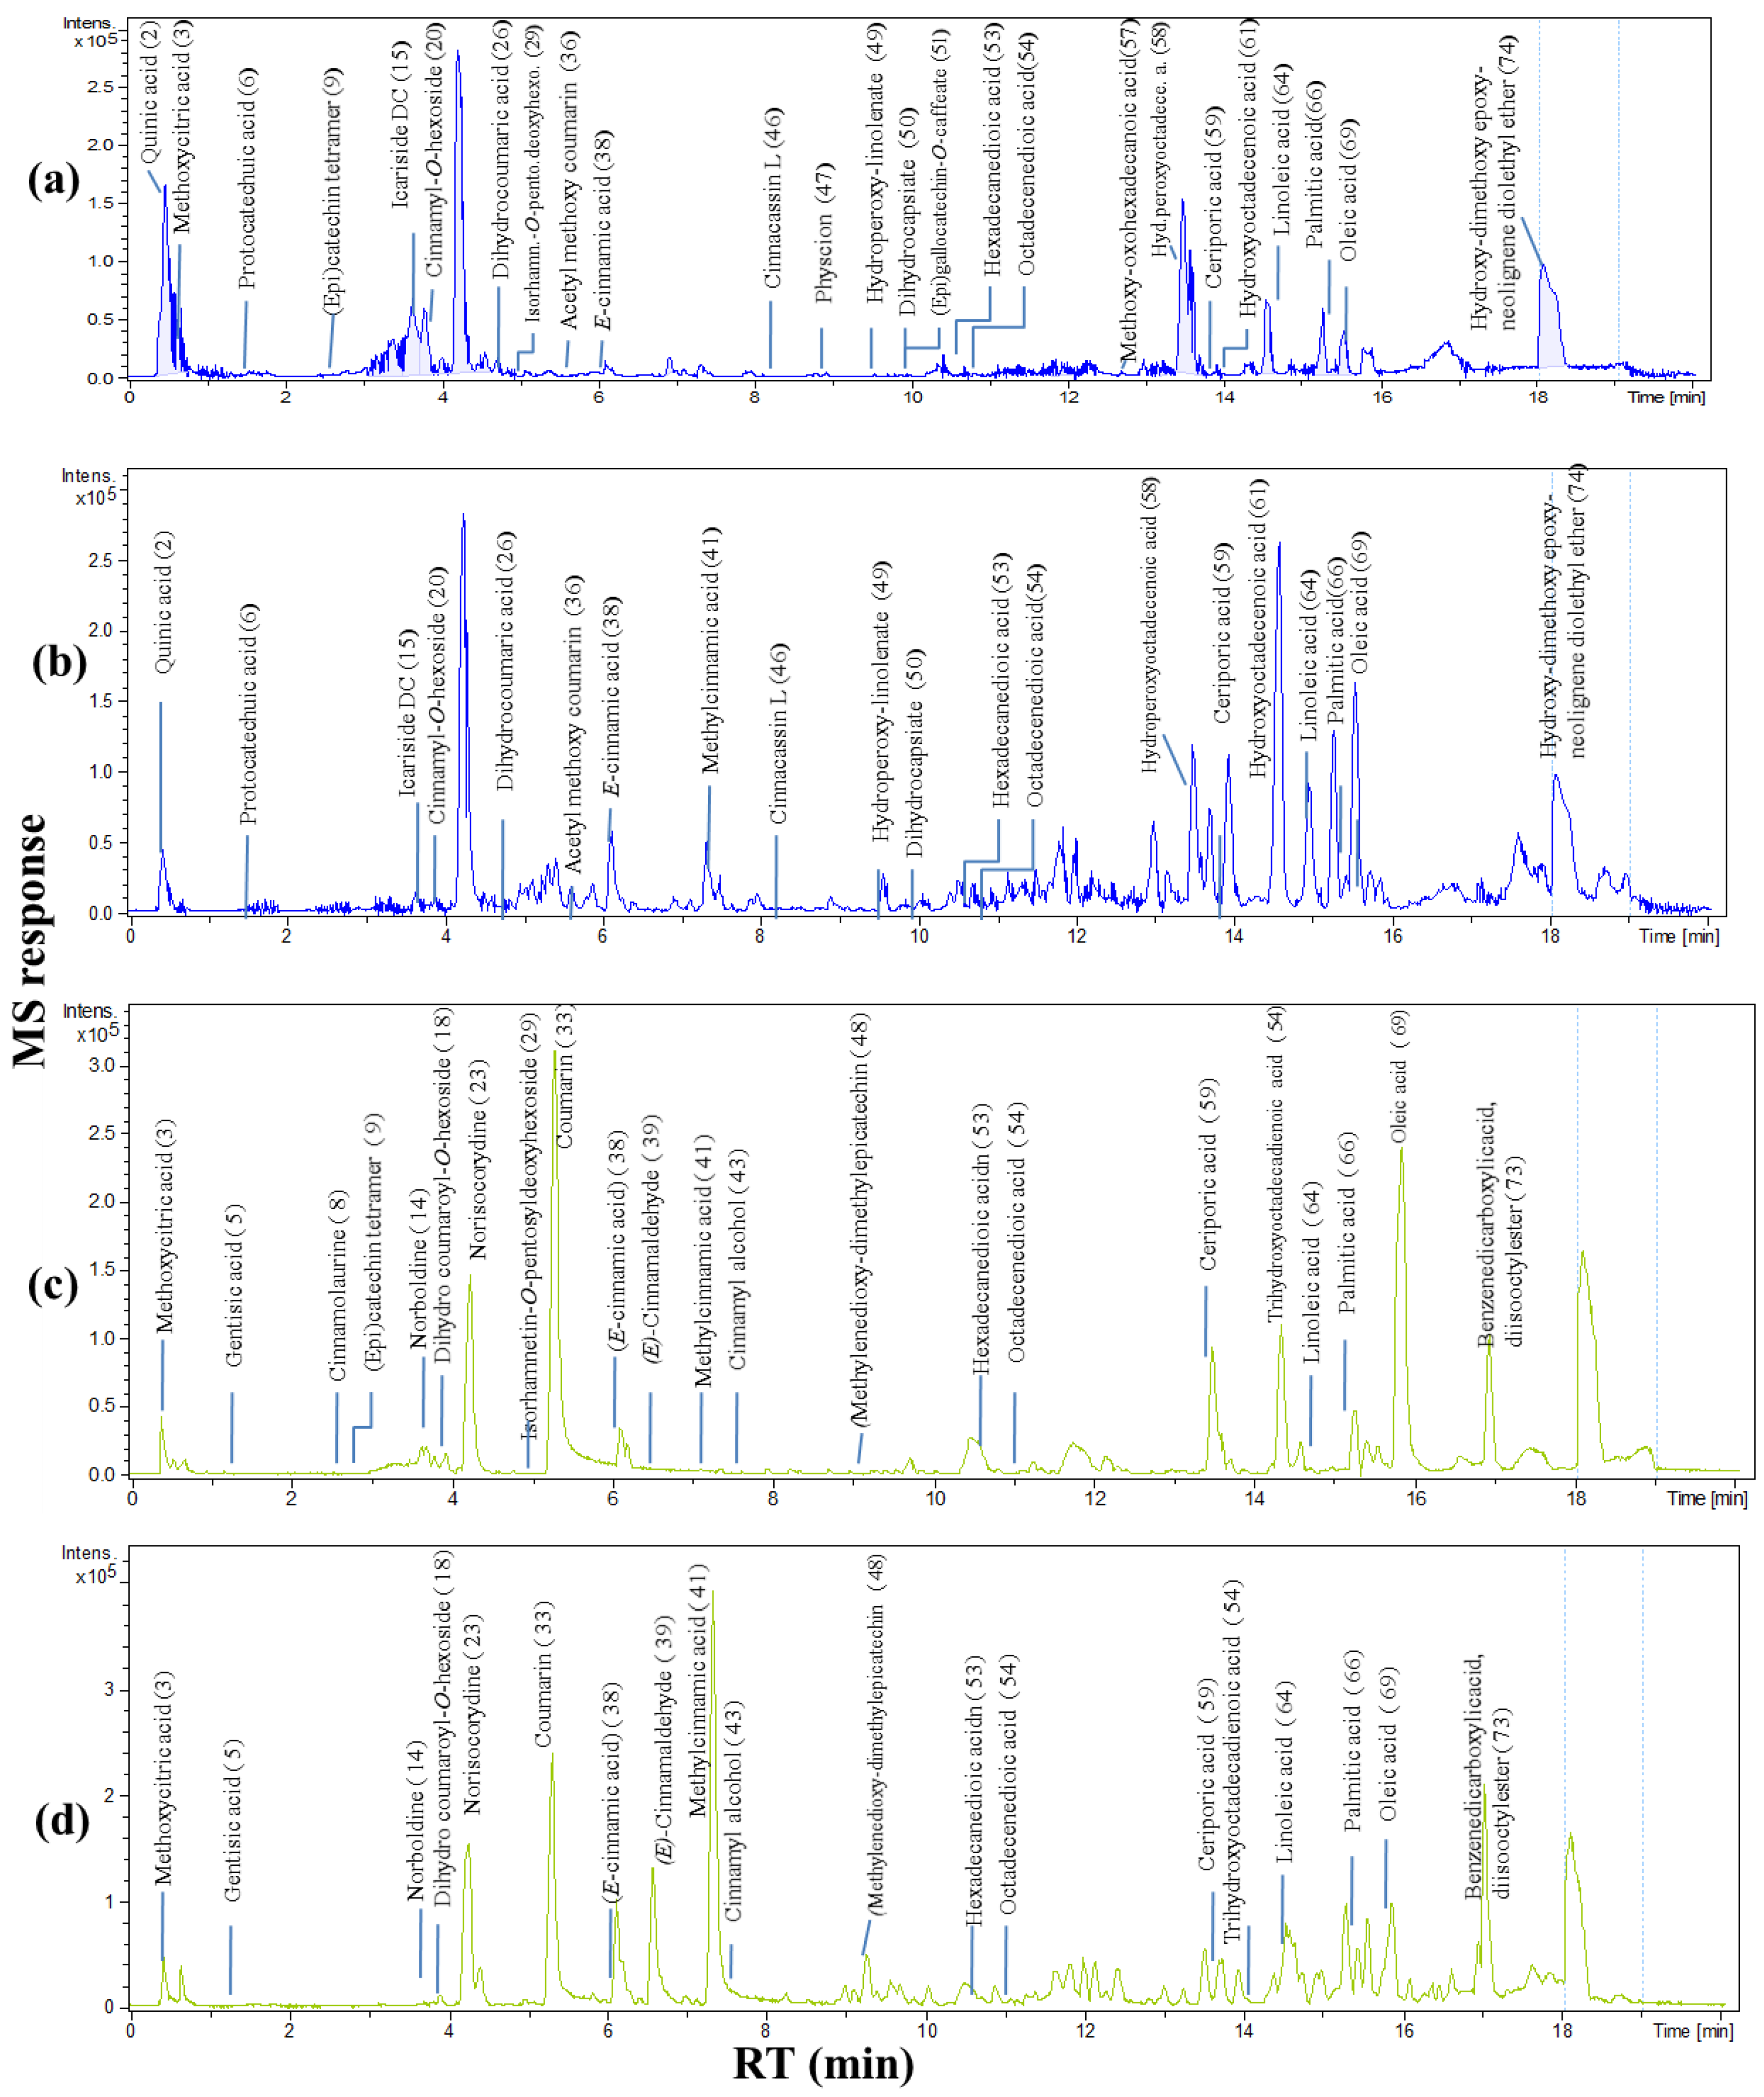
2.1. Secondary Metabolites Profiling Using UPLC-ESI-MS

UPLC-ESI-MS analysis was carried out in both negative and positive ionization modes, allowing the annotation of 74 metabolites (Figure 1) in the examined four Cinnamomum species from which C. verum was obtained from two different sources, in addition to C. cassia, C. iners, and C. tamala. Metabolites belonged to different classes, including phenolic acids, tannins, phenyl propanoids (i.e., hydroxycinnamates, coumaroyl derivatives), flavonoids, lignans, amides, terpenes, and fatty acids (i.e., dicarboxylated and tricarboxylated fatty acids). A list of identified peaks along with their chromatographic and spectroscopic data is presented in Table 1. The structures and fragmentation patterns of some identified metabolites discussed in the manuscript are shown in the Supplementary Material (Supplementary Figures S1–S7). Metabolites were eluted based on their polarity in descending order. Positive and negative ionization modes provide greater coverage of the metabolome. The negative ionization mode showed better sensitivity than the positive mode, with lower noise and higher signal-to-noise ratios except for a few compounds (ca. 21 peaks), including alkaloids and some hydroxycinnamates, which readily ionized in the positive ion mode.

2.1.1. Proanthocyanidins

Proanthocyanidins show UV-absorbance maxima at 235 and 280 nm corresponding to the absorbance spectrum of flavan-3-ols. UPLC-ESI-MSn led to the identification of five procyanidins (PAs) and two prodelphinidins with a strong deprotonated molecular ion [M − H] in the negative ion mode. Common fragmentation pathways for PAs include Retro Diels–Alder fission (RDA-F) [M − H-152], heterocyclic ring fission (HRF) [M − H-126], benzofuran-forming fission (BFF) [M − H-122], and quinine methide cleavage (QMC) that yielded characteristic ions for sequencing of PAs [61].

Procyanidin

As depicted from the UPLC chromatograms in Figure 1, two A-type (epi)catechin tetramers (peaks L9, L10) and three trimers (peaks L11, L12, L25) procyanidins were identified in the studied extracts. Peak L9 showed deprotonated and protonated molecular ions at [(M − H) at m/z 1151.2454 (C60H47O24)] and [(M + H)+ at 1153.2626 (C60H49O24)+] respectively, indicate a procyanidin trimer with A-type interflavanyl bonds. It had main fragment ions at m/z 863 [−288 amu], attributed to the loss of the upper (epi)catechin unit, and m/z 575 [M − H-(2 × 288)], indicating the presence of the A-type bond between the third and the terminal flavan-3-ols units (Supplementary Figure S1) and annotated as (epi)catechin tetramer. It was identified in C. cassia and C. iners while being absent in other specimens. Peak L10 [(M − H) at m/z 1151.25, (C60H47O24)] showed MS2 fragments at m/z 863 [−288 amu] due to the loss of upper EC unit and m/z 573 due to the successive loss of terminal EC unit (Supplementary Figure S2), indicative for the presence of the A-type bond between the second and third flavan-3-ol. This tetramer was found only in C. cassia species. Therefore, peak L10 could serve as a marker for that species among cinnamon food products has yet to be confirmed.
Peak L11 [(M − H) at 863.1885 (C45H35O18)] showed fragment ion peaks at m/z 711 [M − H-152] due to RDA, and m/z 573 [M − H-290] related to the loss of terminal (epi)catechin suggesting for the presence of A linkage between the top and middle units (Supplementary Figure S3A). While main fragments in peak L12 [(M − H) at 863.1853 (C45H35O18)] were at m/z 577 [M − H-286] (loss of extension A-type (E)C unit), m/z 427 (loss of extension (E)C unit and RDA fragmentation) and m/z 289 related to the terminal (E)C unit (Supplementary Figure S3B). This may indicate that the structural differences in L11 and L12 lie in the stereochemistry of their subunits (epicatechin/catechin) and thus cannot be distinguished by means of MS and with both annotated as A-type (epi)catechin trimer C. Peak L25 with deprotonated and protonated molecular ion peaks [(M − H) at m/z 861.1699 (C45H33O18)] and [(M + H)+ at m/z 863.1811 (C45H35O18)+], respectively, suggested for a procyanidin trimer with two A-type interflavonoid linkages. It was detected only in C. cassia and C. tamala. The MS2 fragment ions at m/z 575 [M − H-286] are due to the loss of upper EC unit by QM cleavage and consequently annotated as (epi)catechin trimer with double A linkage. It was noticed that no PA trimers were detected in both C. verum accessions from either origin (Pakistan or Malaysia). This may account for its less astringent taste than C. cassia based on its tannins content [22].

Prodelphinidins

Prodelphinidin detection is particularly interesting as the pyrogallol group in gallo(epi)catechins (EG) is related to the biological activity of grape and tea polyphenols, as previously reported [32]. Thus, the identification of these substructures may explain some of the properties of cinnamon extracts. Among the studied extracts, it was detected only in C. tamala; thus, it may give this species more attention regarding its biological activity.
The main fragments detected in peak L51 [(M − H) 467.097 (C24H19O10)] were at m/z 313 (due to RDA fragmentation) and m/z 161 (due to loss of terminal (E)G unit) annotated as epigallocatechin-O-caffeate. It was previously detected in tea extract, albeit it is the first time that it has been detected in cinnamon. The pyrogallol moieties of (epi)gallocatechins (e.g., in tea) are more reactive than the catechol moieties of (epi)catechins regarding their antioxidant activity [62]. Peak L52 [(M − H) 593.2696 (C30H41O12)] showed fragment ions at m/z 467 [M − H-126] due to HRF and m/z 305 due to QM cleavage between EC and EG units assigning this peak as gallo(epi)catechin-(epi)catechin.
A novel procyanidin was detected in peak L37 [(M − H) 995.2404 (C51 H47 O21)] (Supplementary Figure S4) in C. tamala and absent in other specimens. It exhibited MS2 fragment ions at m/z 705 [M − H-290] due to the loss of terminal EC, m/z 543 [M − H-290-162] and m/z 289 [M − H-290-162-254] due to the loss of hexose and chrysin moieties. The fragmentation pattern suggested its annotation as a new procyanidin containing two (epi)catechin units attached to chrysin and a hexose moiety. Further investigation is required to confirm this identification using other spectroscopic tools.

2.1.2. Hydroxycinnamates (HCAs)

Hydroxycinnamates (HCAs) represent one of the characteristic constituents in cinnamon, which possess various biological activities such as antitumor, anti-inflammatory, antioxidant, and neuroprotective activities [63]. Eight cinnamyl derivatives (peaks L20, L24, L27, L38, L39, L42, L43, and L63) were identified in both negative and positive ionization modes. Peak L38 showed (M − H) [m/z 147.0447 (C9H7O2)] with the main fragment ion at m/z 103 [(M − H-44)], identified as cinnamic acid, and more prominent in C. verum from Malaysia and Pakistan. Cinnamic acid exhibited potential antibacterial activity [64], in addition to its anti-inflammatory and analgesic effect [65], posing these species to be further investigated for such indications. Peaks L20, L24, L27, and L62 were cinnamoyl glycosides showing characteristic sugar losses. Peak (L20) [(M − H) m/z 295.1155 (C15H19O6)] was identified as cinnamyl-O-hexoside. Peak L24 [(M − H) m/z 427.1673 (C20H27O10)] was identified as cinnamyl-O-pentosylhexoside (rosavin), previously reported in C. cassia [40], confirmed from fragment ion at m/z 293 [M − H-134] due to the loss of cinnamyl alcohol, while the fragment ions at m/z 233 and 191 appeared due to sugar losses. Herein It was detected only in C. cassia; thus, it may be used as a marker for this species. Peak L27 [(M − H) m/z 429.1762 (C20H29O10)] with a mass difference of 2 amu compared to compound L24 was identified as dihydrocinnamyl-O-pentosylhexoside, which is the first time being reported in cinnamon (Supplementary Figure S5), and only identified in C. iners species. Furthermore, peak (L63) [(M − H) m/z 395.2781 (C23H39O5)], with its fragment ion at m/z 263 [M − H-132], was identified as cinnamoylcinnamate-O-pentoside detected only in C. iners species. Whether peaks L27 and L63 could serve as markers for that species has yet to be confirmed. Peak L39 [(M + H)+ m/z 133.0652 (C9H9O)+] was identified as (E)-cinnamaldehyde that was reported to exhibit antibacterial, antifungal [66], antioxidant, and anti-inflammatory activities [67], in addition to its flavor imparting properties in cinnamon spice found most abundant in C. verum and C. iners compared to other species and to likely account for their pungent taste. Peak L42 [(M + H)+ m/z 163.076 (C10H11O2)+] was identified as methoxy-cinnamaldehyde, found most prominent in C. verum species. C. verum was reported to exhibit antitumor activity due to its richness in methoxy-cinnamaldehyde [68] and rationalizing for its superiority among cinnamon drugs. Standardization of methoxy-cinnamaldehyde and cinnamaldehyde should provide a better indication of cinnamon’s health benefits. Peak L43 [(M + H)+ m/z 135.081 (C9H11O)+] was identified as cinnamyl alcohol that was previously detected in bark and twigs of C. cassia [69].
Compounds L16, L17, L18, L19, and L33 were coumaroyl derivatives, a precursor to cinnamates. Peaks L18 and L19 showed the same molecular ions at m/z 327, whereas MS2 fragment ions revealed the main difference in their structures. Peak L18 showed fragment ion at m/z 283 [M − H-44], followed by m/z 165 [M − H-162], suggestive for the presence of free carboxylic group and annotated as dihydrocoumaroyl-O-hexoside and was identified in C. cassia, C. tamala and C. verum from Pakistan, while peak L19 showed fragment ion at m/z 165 [M − H-162], followed by m/z 121 [M − H-162-44], assigning it as dihydrocinnacasside. Likewise, peaks L16 and L17 showed the same (M − H) at m/z 459 with a mass difference of 132 amu than peaks L18 and L19, and annotated as dihydrocinnacasside-O-pentoside and dihydrocoumaroyl-O-pentosylhexoside, respectively. Dihydrocinnacasside-O-pentoside was identified in all Cinnamomum species except C. cassia. Peak L33 [(M + H)+m/z 147.0446 (C9H6O2)+] was identified as coumarin found most abundant in C. cassia, consistent with previous results ensuring its richness in coumarin with though health risks when consumed regularly. The lowest level of coumarin among the studied species was found in C. iners. This finding, together with the high level of cinnamaldehyde, poses its use as a flavoring agent instead of the more expensive true cinnamon.

2.1.3. Flavonoids

Three flavonoid glycosides were detected for the first time in Cinnamomum species, including peak L28 [(M − H) m/z 595.1699 (C27H29O17)] and peak L29 [(M − H) m/z 593.1848 (C28H33O14)] assigned as naringenin di-O-hexoside in C. iners and C. tamala and isorhamnetin-O-pentosyldeoxyhexoside in C. cassia and C. tamala, respectively. A novel O- and C-glycosylated flavonoid (peak L30) was detected for the first time in C. cassia and C. tamala. Peak L30 [(M − H) m/z 609.1998 (C27H29O16)] showed main fragment ions at m/z 447 [M − H-162] (due to loss of O-linked hexose sugar), and m/z 327 [M − H-162-120], indicating the presence of C-linked hexose moiety and annotated as luteolin-O-hexosyl-C- hexoside (Supplementary Figure S6). Peak L28 showed main fragment ions at m/z 433 [M − H-162] and m/z 271 [M − H-162 × 2] confirming naringenin as its aglycone, whereas peak L29 showed main fragment ions at m/z 447 [M − H-146] and m/z 315 [M − H-146-132] for isorhamnetinaglycone.

2.1.4. Alkaloids

UPLC-MS/MS analysis in positive ionization mode identified several alkaloids belonging to the isoquinoline type—mainly benzylisoquinolines and aporphines [70]. Peak L14 [(M + H)+m/z 314.1382 (C18H20NO4)+] showed a fragment ion at m/z 297 [M + H-17]+ and was identified as norboldine. Antiplasmodial and antiviral activities of norboldine were reported [70], with the relative highest levels in C. iners species, posing its extract to be tested for these effects in the future. Compared to peak L14 showing UV maxima at 220, 280, and 310 nm, peak L21 showed absorbance at 270 and 310 nm, suggested of a substituted aporphine. Its mass spectrum (Supplementary Figure S7) showed (M + H)+ at m/z 342.1678 (C20H24NO4)+] and a fragment ion peak at m/z 297 due to the opening of ring B and loss of methylene imine group as typical of aporphines and identified as corydine [39]. Peak L23 [(M + H)+ m/z 328.1528 (C19H22NO4)+] showed an ultraviolet absorption spectrum similar to that of peak L21 and was identified as norisocorydine. Peak L22 [(M + H)+ m/z 330.1680 (C19H20NO4)+] showed UV max typical of benzylisoquinolines annotated as reticuline, previously isolated from C. camphora [35].

2.1.5. Lignans and Terpenes

Lignans from different plant sources were reported to show neuroprotective activities being useful in the treatment and prevention of neurodegenerative diseases [71]. In the present study, the negative ionization mode allowed the detection of two lignans, namely dihydroxy-tetramethoxy-epoxylignanol-7-one (peak L34 [(M − H) at m/z 433.1479 (C22H25O9)]), cinnacassin L (peak L46 [(M − H) at m/z 281.1168 (C17H18O3)]), and one neolignan; and hydroxy-dimethoxyepoxy-neolignenediolethyl ether (peak L74 [(M − H) at m/z 385.1657 (C22H26O6)]), which were previously detected in the twigs of C. cassia [51]. The three compounds were detected in C. iners and C. verum from Pakistan. Different diterpenoids were previously detected in C. cassia with immunosuppressive activities that may play roles in the treatment or prevention of autoimmune diseases and chronic inflammatory disorders [59]. Herein two diterpenes were identified in all Cinnamomum species, namely cinncassiol B [(M − H) at m/z 399.1961 (C20H31O8)] and cinncassiol A [(M − H) at m/z 381.1724 (C20H29O7)].

2.1.6. Fatty Acids

Negative ionization mode identified a number of saturated and unsaturated fatty acids, showing typical loss of H2O [M − H-18] and/or loss of carboxylic moieties [M − H-44]. Peaks L64, L66, and L69 with [M − H] m/z 279.232 (C18H31O2), 255.2328 (C16H31O2), and m/z 281.2483 (C18H33O2), respectively, constituted the major peaks in all specimen, especially C. verum from both origins and C. iners. They were tentatively identified as linoleic acid, palmitic acid, and oleic acid, respectively. A mass difference of 16 amu between peaks L64 and L55 was indicative of an extra hydroxy group and assigning peak L55 as hydroxy linoleic acid identified in C. tamala and C. verum of both origins. Likewise, peak L60, a trihydroxylated fatty acid, was detected in cinnamon for the first time as trihydroxyoctadecaenoic acid [(M − H), m/z 327.2167] with the main fragment ion at m/z 283 due to the loss of carboxylic group. It was detected in C. iners and C. verum of both origins. Three dicarboxylic fatty acids were observed for the first time in cinnamon annotated as hexadecanedioic acid (L53) [m/z 285.2060, (C16H30O4)] in C. iners and C. verum of both origins, octadecenedioic acid (L54) [m/z 311.2205, (C18H31O4)] in all Cinnamomum species, and hexadecanedioic acid methyl ester (L57) [m/z 299.2060, (C17H31O4)] in all Cinnamomum species except C. verum (Supplementary Figure S8A–C).

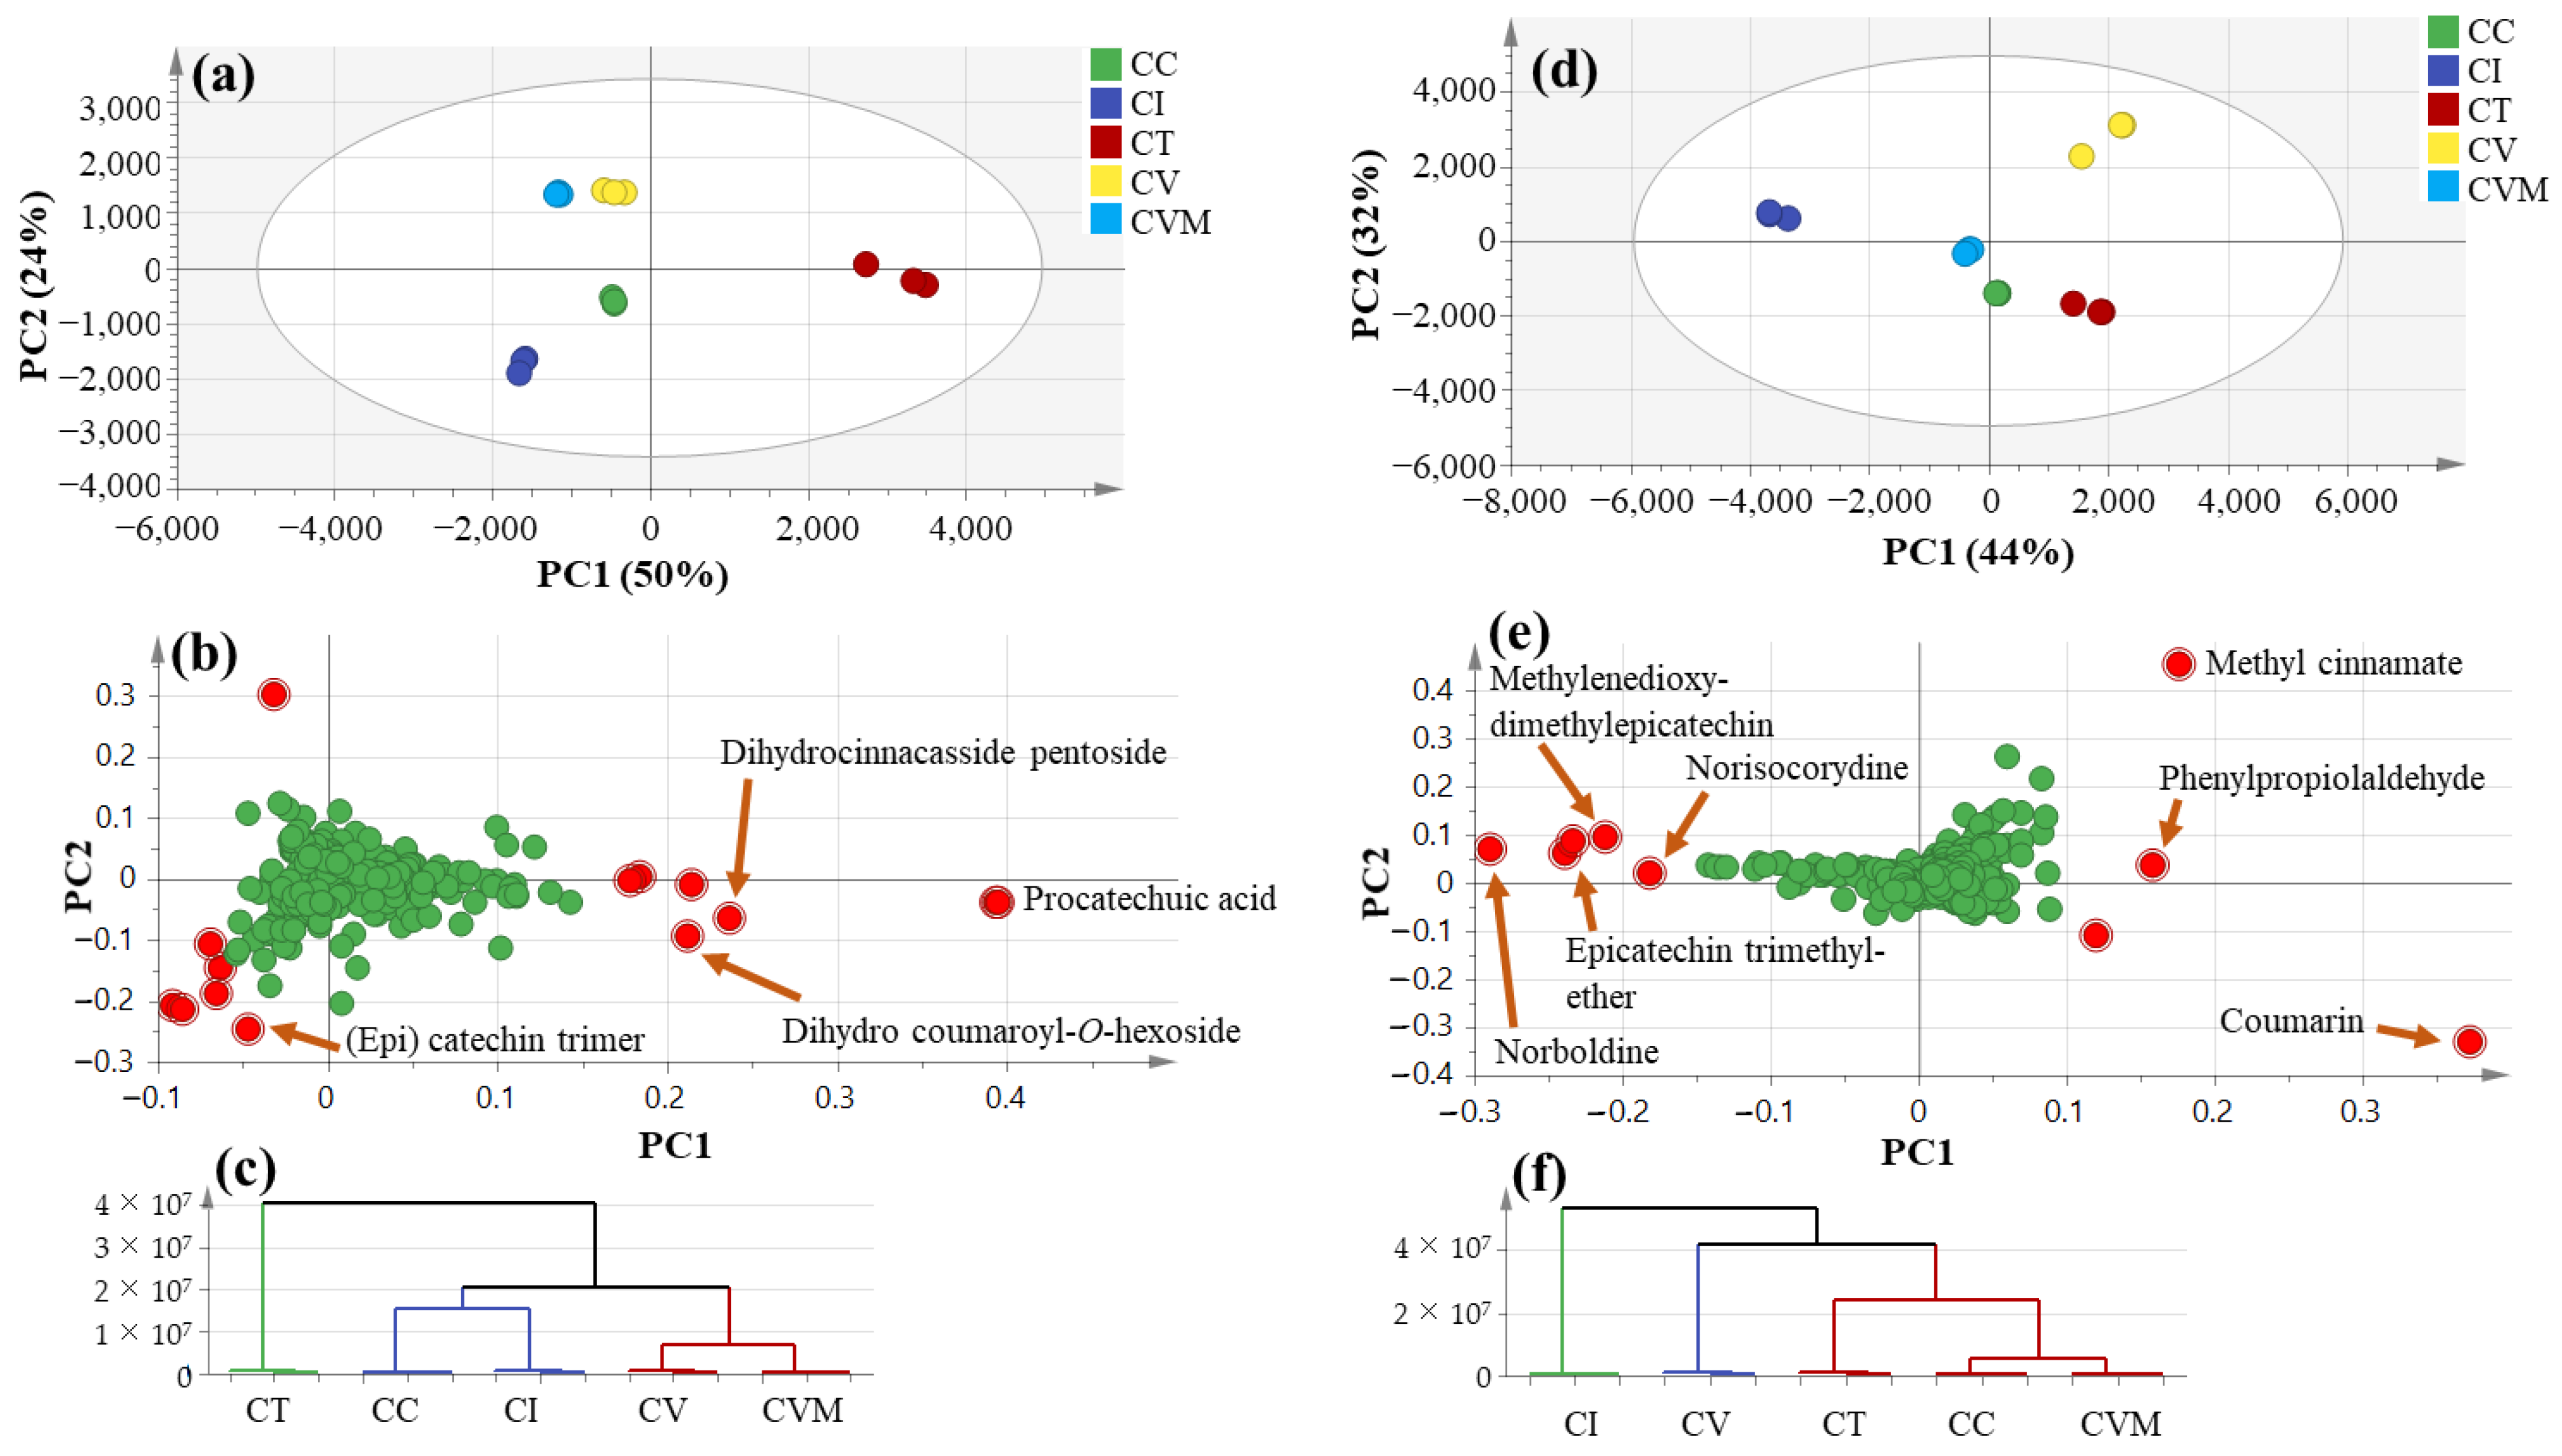
2.2. Multivariate Data Analysis of UPLC-ESI-MS Data

Although the visual inspection of the UPLC-MS chromatograms (Figure 1) of the examined species revealed different metabolite patterns. The data were further analyzed in a more holistic way using principal component analysis (PCA) to assess the variance within specimens in an untargeted manner. PCA is an unsupervised multivariate data analysis technique requiring no knowledge of the data set and was used to explain metabolite differences and possible discrimination between the studied species [72]. The PCA model for the studied species in negative mode (Figure 2a–c) accounted for 50% of the total variance in the first component, PC1, whereas the second principal component, PC2, explained 24% of the variance. The score plot (Figure 2a) revealed the clustering of the two true Cinnamomum specimens C. verum (CV from Pakistan and CVM from Malaysia) from different locations together in one quadrant, while C. iners (CI) and C. cassia (CC) were at another quadrant with negative PC1 values. On the other hand, C. tamala (CT) was separated from the rest of the samples with positive PC1 values. The loading plot (Figure 2b) revealed that phenolic acids, i.e., protocatechuic acid, dihydrocinnacasside pentoside and dihydro coumaroylhexoside were responsible for the segregation of CT in a separate quadrant from the rest of the other species. Hierarchical clustering analysis (HCA) (Figure 2c) confirmed the same clustering pattern obtained from the PCA model.
The UPLC-MS dataset from the positive ionization mode was also subjected to PCA analysis (Figure 2d–f), showing relatively different clustering for the studied cultivars with PC1 and PC2 to account for 44 and 32%, respectively. The score plot (Figure 2d) showed likewise that CI was the most segregated species among specimens, whereas CV failed to cluster with CVM as they represent the same species and opposite to negative ion mode results (Figure 2a). The rest of the cinnamon specimens were clustered together. The loading plot (Figure 2e) showed that CI was more enriched in (epi)catechins represented by methylenedioxy-dimethylepicatechin and epicatechintrimethylether, as well as alkaloids represented by norboldine and norisocorydine, and warrant for the profiling of plant extracts in different ionization modes. In contrast, methyl cinnamate and coumarin were most abundant in CV and CT, respectively. To identify whether variant metabolites revealed from PCA could serve as potential markers for examined species, supervised partial least squares-discriminant analysis (OPLS-DA) was employed.
The data from negative ion mode were first subjected to OPLS-DA analysis (Supplementary Figure S9a,b) using C. tamala (CT) as first-class against all other species to identify the markers that are most distant among examined cinnamon specimens. OPLS-DA, as a supervised multivariate data analysis technique, has greater potential in the identification of markers by providing the most relevant variables for the differentiation between two class groups. OPLS results confirmed PCA regarding the richness of C. tamala in protocatechuic acid at a p-value less than 0.05. In the positive ionization mode, another OPLS-DA model (Supplementary Figure S9c,d) using CI against other samples confirmed its richness in (epi)catechins and alkaloids concurrent with lower levels of coumarin. These findings rank CI as the closest species to CV, suggesting the former as a potential substitute for true cinnamon with minimal coumarin health risk. In an attempt to distinguish between true (CV and CVM) and Chinese cinnamon (CC), especially since CC is the common adulterant of true cinnamon, the OPLS-DA model was conducted in the negative (Supplementary Figure S10a,b) and positive ionization (Supplementary Figure S10c,d) modes. Supplementary Figure S10 revealed that (epi)catechin trimer A type, dihydrocoumaroylhexoside, dihydrocoumaroyl-O-pentosylhexoside, and coumarin were characteristic markers for Chinese cinnamon. Novel markers for true cinnamon revealed in this study included methyl cinnamate and cinnamoyl alcohol and are suggestive of the abundance of cinnamates in true cinnamon.
Lastly, to distinguish between true cinnamon of different origins that are CV and CVM, both specimens were modeled against each other using OPLS-DA (Figure S11a) in negative ion mode with R2 and Q2 values of 0.97 and 0.96, respectively. The S-loading plot (Supplementary Figure S11b) showed the exact markers for true cinnamon from Malaysia belonged mostly to phenolic acids, i.e., Protocatechualdehyde, cinnamic acid and protocatechuic acid. The most discriminatory metabolites, as revealed from UPLC-ESI-MS and multivariate analysis, were then subjected to ANOVA analysis to confirm their statistical significance in differentiating between the samples under study (Supplementary Table S2). C. iners showed a significantly higher level (p < 0.05) of (E)-Cinnamaldehyde and norboldine with the lowest level of coumarin. A significantly higher level (p < 0.05) of protocatechuic acid was observed in C. tamala, while true cinnamon showed its richness in cinnamate, including cinnamic acid, (E)-cinnamaldehyde, and methylcinnamic confirmed the results obtained from MVA.

2.3. Primary Metabolites Profiling Using GC-MS

Primary metabolites of cinnamon were assessed post-silylation using GC-MS analysis (Supplementary Figure S12) in order to account for the nutritive value of cinnamon. The results (Table 2) revealed 51 primary metabolites categorized into 10 various chemical classes, i.e., sugars, esters, amino acids, phenolics, organic and fatty acids. All Cinnamomum species were enriched in sugars and esters, while amino acids were present at much lower levels.

2.3.1. Sugars

Sugars were the most abundant class in all Cinnamomum species except for CV (C. verum from Pakistan). The highest relative levels of total sugars were detected in CVM (C. verum from Malaysia) at ca. 64%, followed by CT at 53%. Monosaccharides were present at much higher levels compared to disaccharides represented by psicose (peaks G29, G30), glucose (G32, G33), and fructose (G31). Glucose (G32, G33) was the most dominant monosaccharide amounting to 23% in CVM versus the lowest levels in CI (C. iners) at ca. 2%. Psicose (G29, G30), a low-calorie monosaccharide sugar that is 70% as sweet as sucrose with anti-obesity and antidiabetic effects [73], was detected at the highest levels in true cinnamon from Malaysia, posing it as a good sugar source for diabetic patients. The only identified disaccharide sucrose (G34) was detected at 2% in CC (Chinese cinnamon) ca. three-folds higher than other cinnamon samples.
CI and CT contained the highest levels of sugar alcohols at 29 and 19%, respectively, versus the lowest levels (5%) in CVM (C. verum from Malaysia). Generally recognized as safe food additives, sugar alcohols are low digestible carbohydrates [74] and pose CI as a good source of sugar alcohols. Glycerol (G41) was the most abundant sugar alcohol in all Cinnamomum species except for CI (C. iners), where meso-erythritol (G43) and arabitol (G44, G45) were the major sugar alcohols detected at 16 and 6%, respectively. Among all sugar alcohols, meso-erythritol (43) and arabitol (G44, G45) provide the lowest calories (0.2 kcal/g) [75], posing CI as a potential low-calorie sweetener. Sensory analysis to compare taste preferences for CI compared to true cinnamon should now follow. As they possess antimicrobial activity [76], sugar acids were most enriched in C. verum from Malaysia (12%), while the lowest levels were detected in the same species from Pakistan (2%), suggesting geographical origin impact. However, such a hypothesis should be confirmed by analyzing true cinnamon samples from other origins. Major sugar acids detected in CVM included galactonic acid γ-lactone (G37, G38) at 12% of total metabolites composition.

2.3.2. Fatty Acids/Esters

Fatty acyl esters constituted the second major class in all Cinnamomum species (16–34%), reaching the highest content in CV. Major fatty acid esters included glycerol monostearate (G4) and followed by 1-monopalmitin (G3) in all Cinnamomum species. Glycerol monostearate (G4) is broadly used in bakery products to enhance the taste and appearance of flour foods owing to its anti-staling properties that rationalize the incorporation of cinnamon in pastry aside from its role as a natural flavor [77]. Monoglycerides generally act as emulsifiers resulting in a more stable air dispersed baked cake with a relatively soft crumb [78]. The abundance of esters in Cinnamomum species was affected by the levels of their corresponding fatty acids.
Fatty acids were present in all Cinnamomum species at considerable levels reaching 12% in CV and accounting for its fatty taste [79]. Stearic (G13) and palmitic (G9) acids were the main fatty acids at ca. 4%. Subsequently, these saturated fatty acids act as precursors for their counterpart major esters in cinnamon. CVM (C. verum from Malaysia) contained the least free fatty acids level [80].

2.3.3. Organic Acids

Another primary metabolite class posing quantitative differences among examined cinnamon specimens was organic acids to impart a slightly bitter taste, especially in CT (C. tamala), which has the highest levels (8%). Oxalic (G18), (E)-cinnamic (G23), and quinic (G25) acids were the major constituents of this class. Oxalic acid (G18) is considered an anti-nutrient, whereas quinic acid (G25) exhibits anti-inflammatory and immune-enhancing activities [81]. As it was detected at a seven-fold higher level in CVM than CV, (E)-cinnamic acid (G23) has a honey-like odor with anti-obesity effects [82]. The elevated levels of (E)-cinnamic acid (G23) in CVM (C. verum from Malaysia) compared to CV (C. verum from Pakistan) were in agreement with UPLC-MS results in negative ion mode (Supplementary Figure S11). Moreover, a direct correlation was observed between (E)-cinnamaldehyde and its precursor (E)-cinnamic acid, which is more enriched in CVM than CV.

2.3.4. Phenolics

Phenolics were more abundant in CT (5%) and CV (2%) than in other cinnamon samples, and they are considered natural antioxidants [83]. Major phenolics detected using GC-MS included catechin (G27) and protocatechuic acid (G26) in all Cinnamomum species. Catechin (G27), a predominant component in tea, exhibited a bitter taste [84], though with many health benefits, including antioxidant and antidiabetic activities [85] contributing to the overall biological effects of cinnamon. Protocatechuic acid (G26) was present at much higher levels in CT at 5% as indicated by OPLS-DA-UPLC-MS results (Figure 2b) and in accordance with GC-MS results posing this accession as a potential antioxidant.

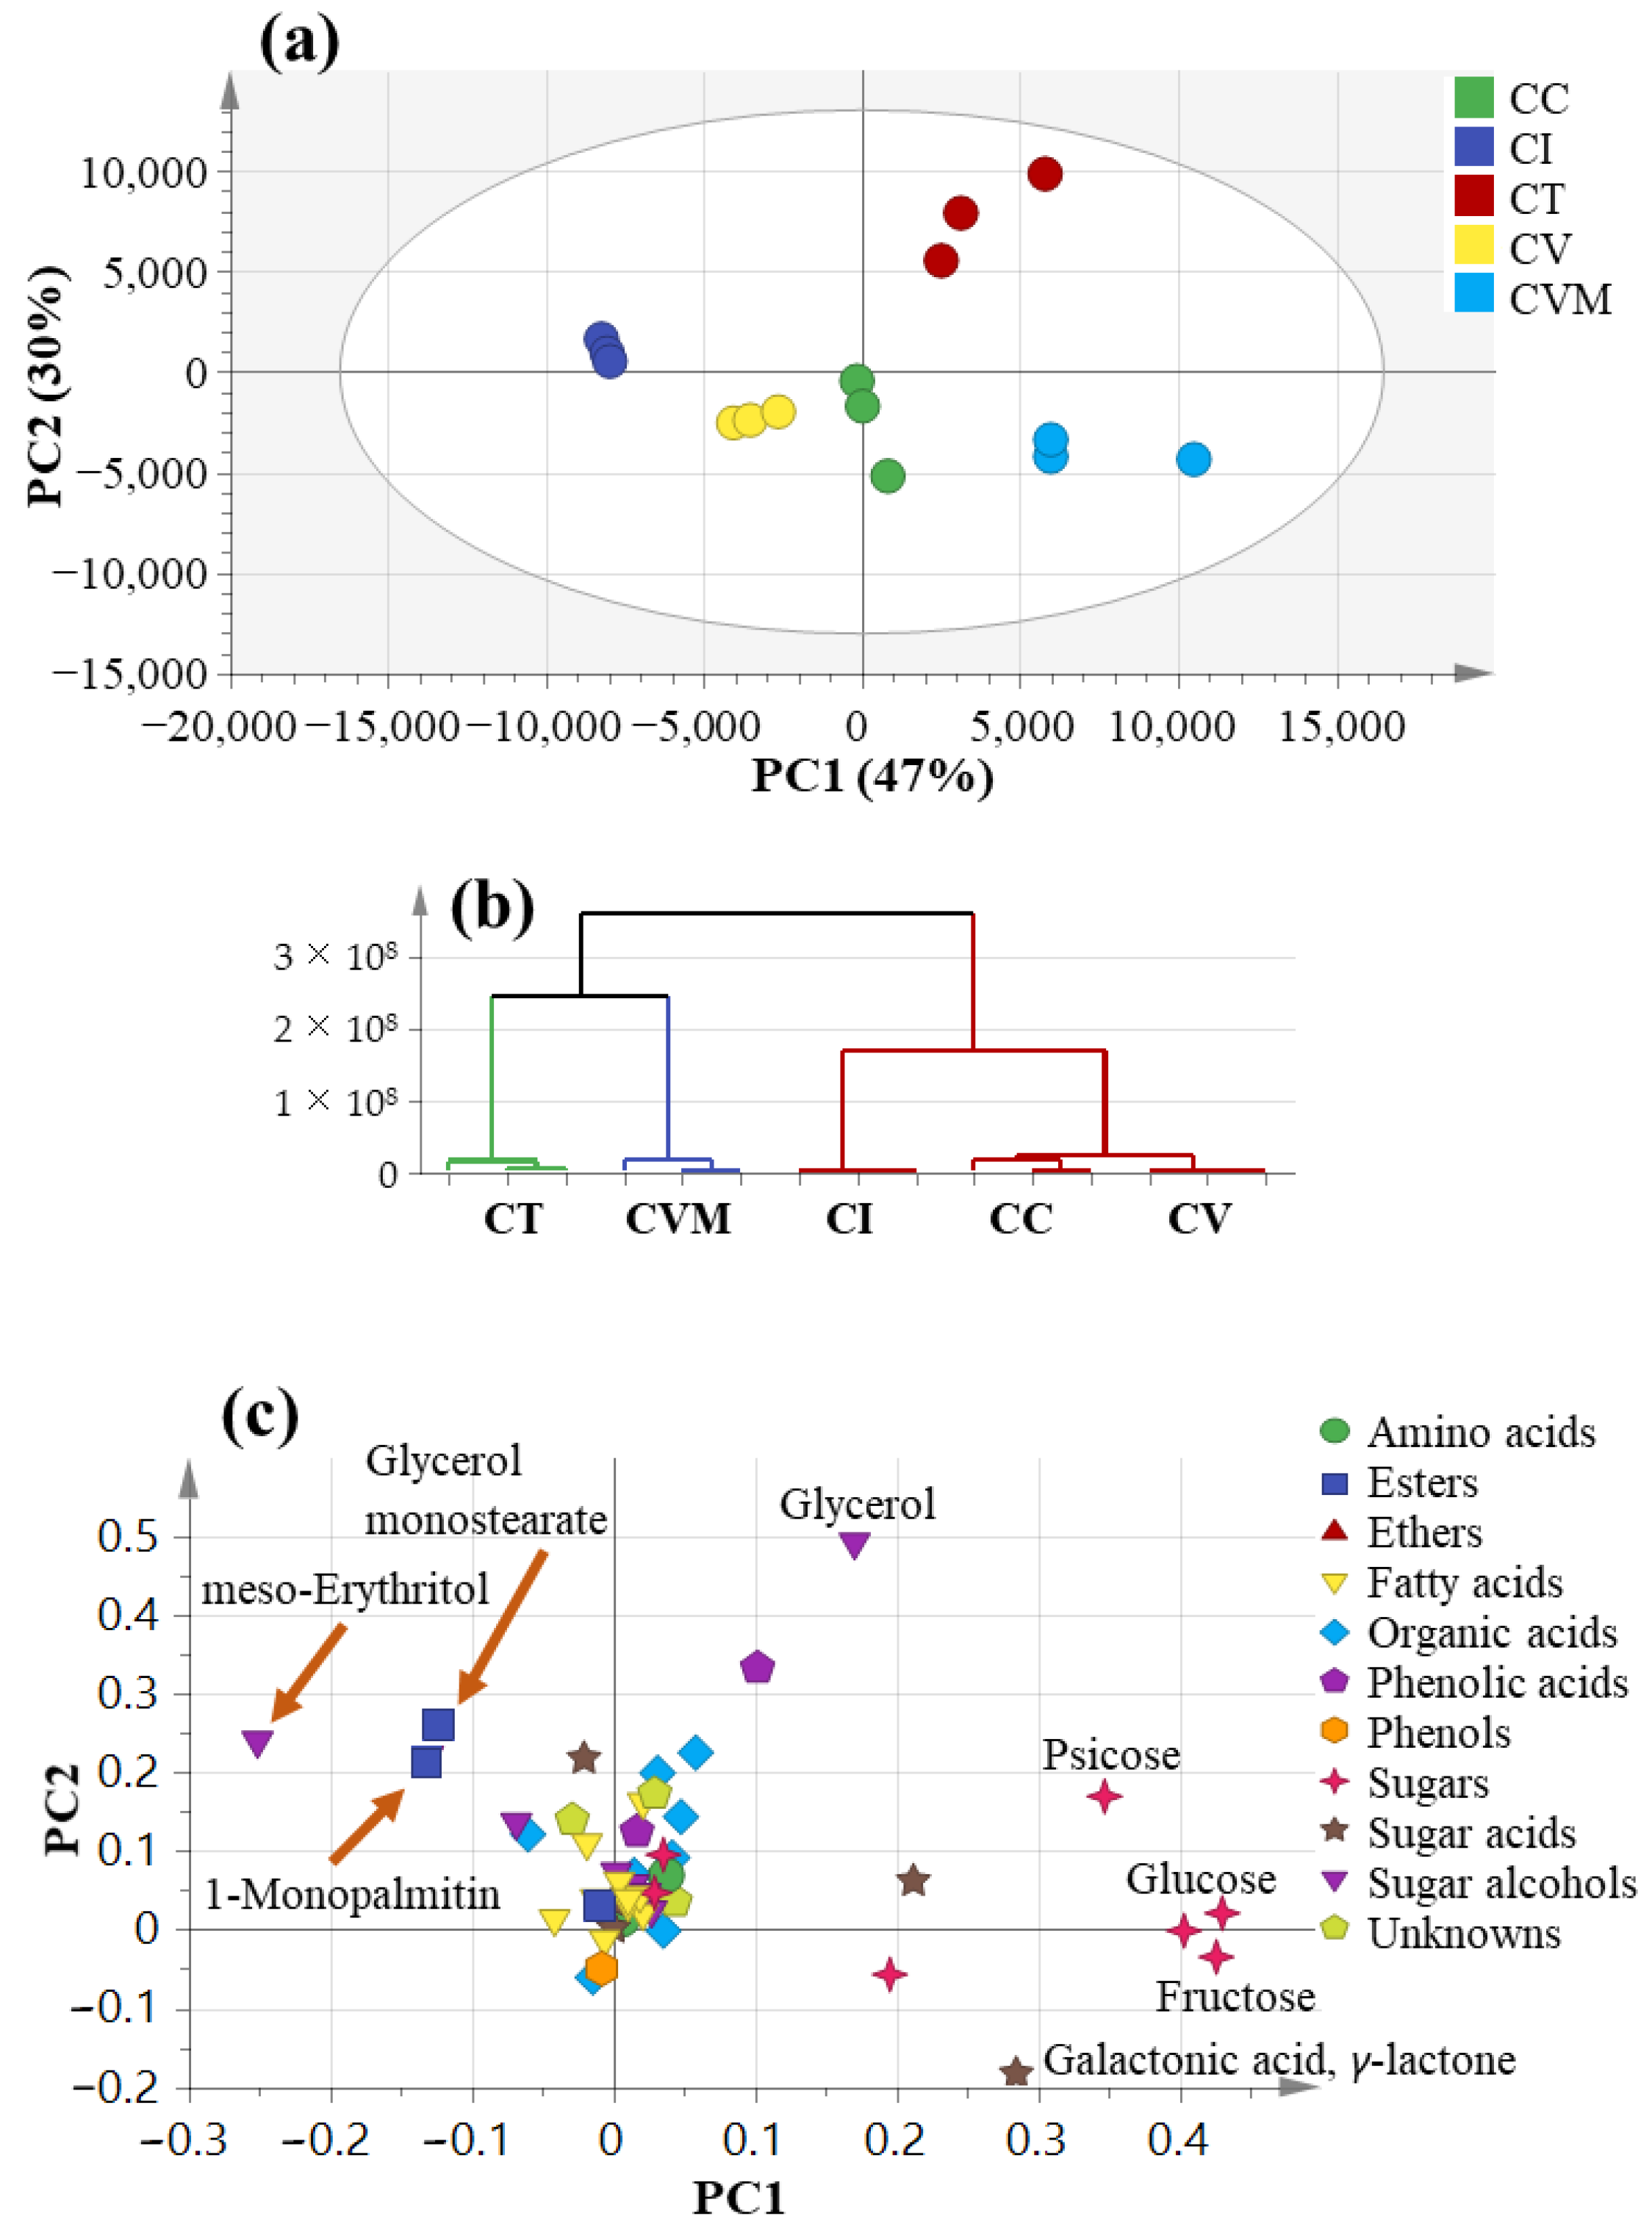
2.4. Multivariate Data Analysis Using GC-MS Data

The GC-MS data were likewise analyzed using PCA (Figure 3) to assess the variance within cinnamon specimens in an untargeted manner and to compare the classification potential of GC-MS compared to the UPLC-MS platform. The PCA model for the studied species (Figure 3a) explained 47% of the total variance in PC1, whereas the second principal component, PC2, explained 30% of the variance. HCA (Figure 3b) showed that CT was the most distant among other samples in agreement with UPLC-MS results (Figure 2a). However, this model failed to cluster CV and CVM together, which are of the same genotype and appear together from the UPLC-MS-based PCA model (Figure 2a). Examination of the loadings plot (Figure 3c) pointed out that glycerol (G41) and protocatechuic acid (G26) were more abundant in CT. Moreover, Cl (C. iners) was more enriched in sugar alcohols represented by meso-erythritol (G43), while CV (C. verum from Pakistan) encompassed more fatty acyl esters, i.e., glycerol monostearate (G4) and 1-monopalmitin (G3). On the right side of the loading plot along PC1, CVM (C. verum from Malaysia) was characterized by higher levels of sugar acids viz. galactonic acid γ-lactone (G37) and its isomer (G38) in addition to sugars viz., fructopyranose (G31), psicofuranose (G29/G30), and glucopyranose (32/33). Sugars are of low taxonomic value and are thus not clear markers for distinguishing CV and CVM accessions, which are dependent on agricultural practices or growing conditions [86].
Considering CT distant segregation in the PCA model, it was modeled as one class using OPLS-DA analysis (Supplementary Figure S13) versus all other species in order to identify its significant markers at a p-value less than 0.001. The OPLS-DA score plot (Supplementary Figure S13a) displayed model parameters R2 (goodness of fit) and Q2 (goodness of prediction) at 0.90 and 0.83, respectively, proving the good model predictability and fitness. The OPLS-DA derived S-plot (Supplementary Figure S13b) illustrated that protocatechuic acid (G26) was a marker for CT confirming results derived from UPLC-MS analysis (Figure 2b) in addition to glycerol (G41). Another OPLS-DA model (Supplementary Figure S14) was employed for identifying markers for Chinese cinnamon CC adulteration in true cinnamon CV with a p-value less than 0.001. The OPLS-DA score plot (Supplementary Figure S14a) also displayed good model prediction parameters R2 and Q2 at 0.99 and 0.91, respectively. The OPLS-DA derived S-plot (Supplementary Figure S14b) revealed sugars enrichment, i.e., glucopyranose (G32), fructopyranose (G31), and psicofuranose (G30) in CC (Cinnamomum cassia; Chinese cinnamon) compared to true cinnamon that displayed no specific markers.

3. Materials and Methods

3.1. Plant Material

Bark specimens of four different Cinnamomum species viz., C. cassia, C. iners, C. tamala, and C. verum were obtained from different sources with sample information presented in Supplementary Table S1. The bark from each specimen was separately homogenized with a mortar and pestle under liquid nitrogen and then stored in tight glass containers at −20 °C until further analysis. Vouchers of cinnamon specimens are deposited at the College of Pharmacy Herbarium, Cairo University, Egypt.

3.2. Chemicals

Formic acid and acetonitrile (HPLC grade) were provided by Baker (The Netherlands). All other solvents, standards, and chemicals were obtained from Sigma Aldrich (St. Louis, MO, USA).

3.3. UPLC-ESI-QTOF-MS Analysis and Metabolites Identification

Dried finely pulverized cinnamon specimens (10 mg) were extracted by adding 2 mL 70% MeOH, containing 10 μg mL −1 umbelliferone as an internal standard sonicated for 20 min with frequent shaking, then centrifuged at 12,000× g for 10 min to remove debris. The filtered extract through a 0.22 μm filter was subjected to solid-phase extraction using a C18 cartridge (Sep-Pack, Waters, Milford, MA, USA) as previously described [87]. Cinnamon bark methanol extracts (2 μL) were injected on an HSS T3 column (100 × 1.0 mm, particle size 1.8 μm; Waters, Milford, MA, USA) installed on an ACQUITY UPLC system (Waters, Milford, MA, USA) equipped with a 6540 Agilent Ultra-High-Definition (UHD) Accurate-Mass Q-TOF-LC-MS (Palo Alto, CA, USA) coupled to an ESI interface, operated in positive or negative ion mode under the exact conditions of our previous work [56]. Characterization of metabolites was performed using their UV–VIS spectra (220–600 nm), exact masses, in addition to MS2 in both ionization modes, RT data, and reference literature and searching the phytochemical dictionary of natural products [88].

3.4. GC-MS Analysis of Silylated Primary Metabolites and Identification

Dried finely pulverized cinnamon specimens (100 mg) were extracted by adding 5 mL 100% MeOH, sonicated for 30 min with frequent shaking, then centrifuged at 12,000× g for 10 min to remove debris. Next, 100 µL of the methanol extract was transferred into screw-cap vials and evaporated under nitrogen gas until complete dryness. Then, 150 µL of MSTFA (N-methyl-N-(trimethylsilyl)-trifluoroacetamide), previously diluted 1:1 (v/v) with anhydrous pyridine, was added and incubated for 45 min at 60 °C for derivatization. Silylated products were separated by an Rtx-5MS column (30 m length, 0.25 mm i.d., and 0.25 µm film) [89]. For evaluation of biological replicates, under the same conditions, three separate samples were analyzed for each cinnamon specimen. Non-volatile silylated components were identified by comparing their Kovats indices (KI) relative to the C6-C20 n-alkane series, as well as matching the mass spectra obtained with the NIST and WILEY libraries and with standards when available. Before mass spectral matching, peaks were first deconvoluted through AMDIS software (www.amdis.net, accessed on 16 October 2020), and their abundance data were extracted using the MET-IDEA tool [90].

3.5. Multivariate Data (MVA) and Statistical Analyses

Each cinnamon group’s data were represented as the mean ± standard deviation (SD) of three replicates. One-way analysis of variance (ANOVA) was employed through IBM SPSS Statistics, Version 28.0. (Armonk, NY, USA: IBM Corp) with a p-value less than 0.05 to indicate significance between groups. The data table of MS abundances generated from either UPLC-MS or GC-MS was subjected to modeling, i.e., PCA (principal component analysis), HCA (hierarchical clustering analysis), and OPLS-DA (partial least-squares discriminant analysis) using SIMCA-P version 13.0 software package (Umetrics, Umeå, Sweden). Subsequently, markers were determined by analyzing the S-plot, which revealed covariance (p) and correlation (pcor). All variables were Pareto scaled and mean-centered. Validation of models was evaluated by computing the diagnostic indices, i.e., Q2 and R2 values, and permutation testing of iterations.

4. Conclusions

This study provides the most holistic map of cinnamon spice primary and secondary metabolites composition using a multiplex approach of UPLC-MS and GC-MS techniques analyzed using chemometric tools. Such metabolite profiling justifies the premium value of C. verum as a flavoring agent and in functional foods. UPLC-MS analysis allowed the identification of 74 metabolites, of which a new proanthocyanidin suggested to encompass catechin, chrysin, catechin, and hexose was detected for the first time, trihydroxylated fatty acid (trihydroxyoctadecaenoic acid) and three dicarboxylic fatty acids (hexadecanedioic acid, octadecenedioic acid, and hexadecanedioic acid methyl ester) were detected for the first time in cinnamon, albeit, though other spectroscopic analysis, i.e., NMR still required for complete elucidation of these metabolites. In addition, a number of newly identified flavonoid glycosides included naringenin di-O-hexoside, isorhamnetin-O-pentosyldeoxyhexoside, and luteolin-O-hexosyl-C-hexoside. It revealed the richness of Chinese cinnamon in coumarin, while C. verum and C. tamala were rich sources of cinnamates. Norboldine, an aporphine alkaloid of potential inhibitory activity against type I HIV, was detected at high levels in C. iners species, warranting further assays of its extract against different viruses. Despite the great proximity between C. verum of both origins, UPLC-MS allowed the detection of a number of compounds that accounted for differences between both origins, including dihydrocoumaroyl-O-hexoside and lignans. The palatability and agreeable taste of cinnamon spice pose it as an ingredient in nutraceuticals. According to the UPLC-MS profile, C. iners was the closest species to official C. verum concurrent with a low level of coumarin with a relatively high level of cinnamaldehyde, suggesting the former as a potential substitute for true cinnamon regarding minimal health hazards.
Primary metabolites analysis by GC-MS revealed true cinnamon richness in fatty acids and acyl esters, though with qualitative variation among different origins. Our findings also revealed that sugars were the most discriminatory metabolites among Cinnamomum species, with true cinnamon encompassing the highest levels compared to other specimens. Whereas C. iners showed the healthiest low-calorie sugar profile with lower sugars and high sugar alcohol levels at 29%, viz., meso-erythritol (16%) and arabitol (6%) and thus posing it as a sugar source for diabetics.
MVA of GC-MS and UPLC-MS detected in negative ion mode data revealed that C. tamala was the most chemically distinctive species attributed to the elevated dihydrocinnacasside pentoside, protocatechuic acid, and glycerol. In contrast, positive ion UPLC-MS mode revealed that C. iners was the most distant species, as it is rich in catechins and alkaloids, i.e., norboldine and norisocorydine. Among GC-MS and UPLC-MS employed analytical platforms, UPLC-MS in negative ion mode provided the most rational classification, with close segregation of CV and CVM specimens, and not observed in other PCA models. Novel markers revealed from this study to identify adulteration of true cinnamon (CV) with Chinese cinnamon (CC) included dihydrocoumaroyl-O-hexoside and dihydrocoumaroyl-O-pentosylhexoside in addition to the well-recognized coumarin. On the other hand, cinnamates represented by methyl cinnamate, (E)-cinnamaldehyde, and cinnamoyl alcohol were enriched in true cinnamon. Such chemical marker should aid in the detection of adulteration in true cinnamon, especially when present in extract lacking the typical morphological features to distinguish it from its allied drugs, i.e., Chinese type.
Although the selected Cinnamomum species do not represent all accessions of cinnamon worldwide, our approach is certainly feasible for analyzing other Cinnamomum species from such further sources to exploit factors that might impact the metabolic makeup, i.e., storage, seasonal variation and growth stage. Combining our variable metabolite profile data with gene expression can further assist in exploring involved genes, evaluating biosynthetic pathways, and ultimately enhancing breeding. The isolation and complete identification of the discriminative chemo-markers along with the newly highlighted metabolites should follow on as future work.

Supplementary Materials

The following supporting information can be downloaded at https://www.mdpi.com/article/10.3390/molecules27092935/s1: Figure S1: MS2 Spectra of (epi) catechin tetramer (peak 9) [M − H] m/z 1151.2454, C60H48O24; Figure S2: MS2 Spectra of (epi) catechin tetramer (peak 10) [M − H] m/z 1151.25, C60H48O24; Figure S3: MS2 Spectra of A, B (epi) catechin trimer A type (peaks 11, 12) [M − H] m/z 863.1885, C45H36O18; Figure S4: MS2 Spectra of Catechin-chrysin-catechin-O-hexoside (peak 37) [M − H] m/z 995.2414, C51H48O21; Figure S5: MS2 Spectra of dihydrocinnamyl-O-pentosylhexoside (peak 27) [M − H] m/z 429.1762, C20H32O12; Figure S6: MS2 Spectra of luteolin-O/C-di-hexoside (peak 30) [M − H] m/z 609.1998, C27H30O16; Figure S7: MS2 Spectra of corydine (peak 21) [M − H] m/z 342.1678, C20H23NO4; Figure S8: MS2 Spectra of dicarboxylic fatty acids; Figure S9: UPLC-MS OPLS-DA, (a) score plot and (b) loading S-plots derived from modelling CT (C. tamala from Pakistan) against other samples in a separate group on negative ion mode. OPLS-DA (c) score plot and (d) loading S-plots derived from modeling CI (C. iners from Malaysia) against other samples in a separate group on positive ion mode; Figure S10: UPLC-MS OPLS-DA (a) score plot and (b) loading S-plots derived from modeling CC (Cinnamomum cassia from Malaysia) versus CV (C. verum from Pakistan) and CVM (C. verum from Malaysia) in a separate group on negative ion mode. OPLS-DA (c) score plot and (d) loading S-plots derived from modeling CC versus CV and CVM on positive ion mode. Each S-plot revealed the covariance p[1] against the correlation p(cor)[1] of the variables of the discriminating component; Figure S11: UPLC-MS OPLS-DA (a) score plot and (b) loading S-plots derived from modelling CV (C. verum from Pakistan) versus CVM (C. verum from Malaysia) on negative ion mode revealing the covariance p[1] against the correlation p(cor)[1] of the variables of the discriminating component; Figure S12: Representative SPME-GC-MS chromatograms of cinnamon primary metabolites, acquired from (a) CI (C. iners from Malaysia), (b) CT (C. tamala from Pakistan) and (c) CV (C. verum from Pakistan); Figure S13: GC-MS OPLS-DA (a) score plot and (b) loading S-plots derived from modelling CT (C. tamala from Pakistan) versus all other samples revealing the covariance p[1] against the correlation p(cor)[1] of the variables of the discriminating component; Figure S14: GC-MS OPLS-DA (a) score plot and (b) loading S-plots derived from modelling CC (Cinnamomum cassia from Malaysia) versus CV (C. verum from Pakistan) revealing the covariance p[1] against the correlation p(cor)[1] of the variables of the discriminating component; Table S1: Origin of the different species of cinnamon barks used in the analysis; Table S2: Relative quantification of the most discriminatory metabolites in the studied Cinnamomum species identified by UPLC-ESI-MS and multivariate analysis. Values are represented as average (n = 3) of normalized peak areas × 103 to umbelliferon (internal standard) ± standard error. Different letters indicate significant differences between cinnamon accessions according to the least significant difference analysis (p < 0.05; Tukey’s test).

Author Contributions

Conceptualization, M.A.F., E.M.K., A.M., S.D., T.E. and S.M.A.; Formal analysis, M.A.F., S.D. and S.M.A.; Investigation, M.A.F., E.M.K., A.M., S.D., T.E. and S.M.A.; Writing—original draft, M.A.F., E.M.K. and S.M.A.; Writing—review and editing, M.A.F., E.M.K., A.M., S.D., T.E. and S.M.A. All authors have read and agreed to the published version of the manuscript.

Funding

The publication of this article was funded by the Open Access Fund of Leibniz Universität Hannover.

Institutional Review Board Statement

Not applicable.

Informed Consent Statement

Not applicable.

Data Availability Statement

The data presented in this study are available in the Supplementary Material.

Acknowledgments

The authors gratefully acknowledge the Alexander von Humboldt Foundation, Germany, for support.

Conflicts of Interest

The authors declare no conflict of interest.

Sample Availability

Samples of the compounds are not available from the authors.

References

  1. Suriyagoda, L.; Mohotti, A.J.; Vidanarachchi, J.K.; Kodithuwakku, S.P.; Chathurika, M.; Bandaranayake, P.C.; Hetherington, A.M.; Beneragama, C.K. “Ceylon cinnamon”: Much more than just a spice. Plants People Planet 2021, 3, 319–336. [Google Scholar] [CrossRef]
  2. Jayaprakasha, G.; Rao, L.J.M. Chemistry, biogenesis, and biological activities of Cinnamomum zeylanicum. Crit. Rev. Food Sci. Nutr. 2011, 51, 547–562. [Google Scholar] [CrossRef]
  3. Hettiarachchi, I.; De Silva, D.; Esham, M.; Liyanagamage, T.; Abeysinghe, A.; Warnakulasooriya, S.; Harindra, W. An assessment of market landscape of cinnamon in Sri Lanka. J. Agric. Sci.–Sri Lanka 2020, 15, 198–206. [Google Scholar] [CrossRef]
  4. Gruenwald, J.; Freder, J.; Armbruester, N. Cinnamon and health. Crit. Rev. Food Sci. Nutr. 2010, 50, 822–834. [Google Scholar] [CrossRef] [PubMed]
  5. Kazemi, M.; Mokhtariniya, S. Essential oil composition of bark of Cinnamomum zeylanicum. J. Essent. Oil Bear. Plants 2016, 19, 786–789. [Google Scholar] [CrossRef]
  6. Chen, P.Y.; Yu, J.W.; Lu, F.L.; Lin, M.C.; Cheng, H.F. Differentiating parts of Cinnamomum cassia using LC-qTOF-MS in conjunction with principal component analysis. Biomed. Chromatogr. 2016, 30, 1449–1457. [Google Scholar] [CrossRef] [PubMed]
  7. Wang, Y.-H.; Avula, B.; Nanayakkara, N.D.; Zhao, J.; Khan, I.A. Cassia cinnamon as a source of coumarin in cinnamon-flavored food and food supplements in the United States. J. Agric. Food Chem. 2013, 61, 4470–4476. [Google Scholar] [CrossRef] [PubMed]
  8. Kumar, S.; Sharma, S.; Vasudeva, N. Chemical compositions of Cinnamomum tamala oil from two different regions of India. Asian Pac. J. Trop. Dis. 2012, 2, S761–S764. [Google Scholar] [CrossRef]
  9. Salleh, W.M.N.H.; Ahmad, F.; Yen, K.H.; Zulkifli, R.M. Essential oil compositions of Malaysian Lauraceae: A mini review. Pharm. Sci. 2016, 22, 60–67. [Google Scholar] [CrossRef] [Green Version]
  10. Al-Sayed, H. Evaluation of antioxidant activity of some spices and their application in croissant and filling cream. Arab Univ. J. Agric. Sci. 2008, 16, 97–114. [Google Scholar] [CrossRef]
  11. Muhammad, D.R.A.; Dewettinck, K. Cinnamon and its derivatives as potential ingredient in functional food—A review. Int. J. Food Prop. 2017, 20 (Suppl. S2), 2237–2263. [Google Scholar] [CrossRef] [Green Version]
  12. Liu, F.; Niu, X.; Ren, J. Analysis of cinnamon oil extracted by supercritical fluid. China Condiment 2011, 4, 76–86. [Google Scholar]
  13. Chuesiang, P.; Siripatrawan, U.; Sanguandeekul, R.; Yang, J.S.; McClements, D.J.; McLandsborough, L. Antimicrobial activity and chemical stability of cinnamon oil in oil-in-water nanoemulsions fabricated using the phase inversion temperature method. LWT 2019, 110, 190–196. [Google Scholar] [CrossRef]
  14. Hajimonfarednejad, M.; Ostovar, M.; Raee, M.J.; Hashempur, M.H.; Mayer, J.G.; Heydari, M. Cinnamon: A systematic review of adverse events. Clin. Nutr. 2019, 38, 594–602. [Google Scholar] [CrossRef]
  15. Bandara, T.; Uluwaduge, I.; Jansz, E. Bioactivity of cinnamon with special emphasis on diabetes mellitus: A review. Int. J. Food Sci. Nutr. 2012, 63, 380–386. [Google Scholar] [CrossRef]
  16. Camacho, S.; Michlig, S.; de Senarclens-Bezençon, C.; Meylan, J.; Meystre, J.; Pezzoli, M.; Markram, H.; Le Coutre, J. Anti-obesity and anti-hyperglycemic effects of cinnamaldehyde via altered ghrelin secretion and functional impact on food intake and gastric emptying. Sci. Rep. 2015, 5, 7919. [Google Scholar] [CrossRef] [Green Version]
  17. Batiha, G.E.-S.; Beshbishy, A.M.; Guswanto, A.; Nugraha, A.; Munkhjargal, T.; M Abdel-Daim, M.; Mosqueda, J.; Igarashi, I. Phytochemical characterization and chemotherapeutic potential of Cinnamomum verum extracts on the multiplication of protozoan parasites in vitro and in vivo. Molecules 2020, 25, 996. [Google Scholar] [CrossRef] [Green Version]
  18. Yap, P.; Krishnan, T.; Chan, K.-G.; Lim, S. Antibacterial mode of action of Cinnamomum verum bark essential oil, alone and in combination with piperacillin, against a multi-drug-resistant Escherichia coli strain. J. Microbiol. Biotechnol. 2015, 25, 1299–1306. [Google Scholar] [CrossRef]
  19. Ainane, T.; Khammour, F.; Merghoub, N. Cosmetic bio-product based on cinnamon essential oil “Cinnamomum verum” for the treatment of mycoses: Preparation, chemical analysis and antimicrobial activity. MOJ Toxicol. 2019, 5, 5–8. [Google Scholar] [CrossRef]
  20. Afifi, S.M.; El-Mahis, A.; Heiss, A.G.; Farag, M.A. Gas chromatography–mass spectrometry-based classification of 12 fennel (Foeniculum vulgare Miller) varieties based on their aroma profiles and estragole levels as analyzed using chemometric tools. ACS Omega 2021, 6, 5775–5785. [Google Scholar] [CrossRef]
  21. Huang, Z.; Jia, S.; Zhang, L.; Liu, X.; Luo, Y. Inhibitory effects and membrane damage caused to fish spoilage bacteria by cinnamon bark (Cinnamomum tamala) oil. LWT 2019, 112, 108195. [Google Scholar] [CrossRef]
  22. Farag, M.A.; Labib, R.M.; Noleto, C.; Porzel, A.; Wessjohann, L.A. NMR approach for the authentication of 10 cinnamon spice accessions analyzed via chemometric tools. LWT 2018, 90, 491–498. [Google Scholar] [CrossRef]
  23. Farag, M.A.; Afifi, S.M.; Rasheed, D.M.; Khattab, A.R. Revealing compositional attributes of Glossostemon bruguieri Desf. root geographic origin and roasting impact via chemometric modeling of SPME-GC-MS and NMR metabolite profiles. J. Food Compos. Anal. 2021, 102, 104073. [Google Scholar] [CrossRef]
  24. Bayram, B.; Esatbeyoglu, T.; Schulze, N.; Ozcelik, B.; Frank, J.; Rimbach, G. Comprehensive analysis of polyphenols in 55 extra virgin olive oils by HPLC-ECD and their correlation with antioxidant activities. Plant Foods Hum. Nutr. 2012, 67, 326–336. [Google Scholar] [CrossRef] [PubMed]
  25. Farag, M.A.; Gad, H.A.; Heiss, A.G.; Wessjohann, L.A. Metabolomics driven analysis of six Nigella species seeds via UPLC-qTOF-MS and GC–MS coupled to chemometrics. Food Chem. 2014, 151, 333–342. [Google Scholar] [CrossRef] [PubMed]
  26. Abu-Reidah, I.M.; Arráez-Román, D.; Warad, I.; Fernández-Gutiérrez, A.; Segura-Carretero, A. UHPLC/MS2-based approach for the comprehensive metabolite profiling of bean (Vicia faba L.) by-products: A promising source of bioactive constituents. Food Res. Int. 2017, 93, 87–96. [Google Scholar] [CrossRef] [PubMed]
  27. Ibrahim, H.; Serag, A.; Farag, M.A. Emerging analytical tools for the detection of the third gasotransmitter H2S, a comprehensive review. J. Adv. Res. 2020, 27, 137–153. [Google Scholar] [CrossRef]
  28. Fang, N.; Yu, S.; Prior, R.L. LC/MS/MS characterization of phenolic constituents in dried plums. J. Agric. Food Chem. 2002, 50, 3579–3585. [Google Scholar] [CrossRef]
  29. Chen, C.-Y.; Hong, Z.-L.; Yang, W.-L.; Wu, M.-H.; Huang, J.-C.; Lee, J.-Y. A novel homosesquiterpenoid from the stems of Cinnamomum burmanii. Nat. Prod. Res. 2012, 26, 1218–1223. [Google Scholar] [CrossRef]
  30. Lin, Y.; Xu, W.; Huang, M.; Xu, W.; Li, H.; Ye, M.; Zhang, X.; Chu, K. Qualitative and quantitative analysis of phenolic acids, flavonoids and iridoid glycosides in Yinhua Kanggan Tablet by UPLC-QqQ-MS/MS. Molecules 2015, 20, 12209–12228. [Google Scholar] [CrossRef] [Green Version]
  31. Chowdhury, B.K.; Sethi, M.L.; Lloyd, H.; Kapadia, G.J. Aporphine and tetrahydrobenzylisoquinoline alkaloids in Sassafras albidum. Phytochemistry 1976, 15, 1803–1804. [Google Scholar] [CrossRef]
  32. Mateos-Martín, M.L.; Fuguet, E.; Quero, C.; Pérez-Jiménez, J.; Torres, J.L. New identification of proanthocyanidins in cinnamon (Cinnamomum zeylanicum L.) using MALDI-TOF/TOF mass spectrometry. Anal. Bioanal. Chem. 2012, 402, 1327–1336. [Google Scholar] [CrossRef]
  33. Jiang, J.; Feng, Z.; Wang, Y.; Zhang, P. New phenolics from the roots of Symplocos caudata W all. Chem. Pharm. Bull. 2005, 53, 110–113. [Google Scholar] [CrossRef] [Green Version]
  34. Lin, I.; Yeh, H.; Cham, T.; Chen, C. A new butanolide from the leaves of Cinnamomum reticulatum. Chem. Nat. Compd. 2011, 47, 43. [Google Scholar] [CrossRef]
  35. Ravindran, P.; Nirmal-Babu, K.; Shylaja, M. Cinnamon and Cassia: The Genus Cinnamomum; CRC Press: Boca Raton, FL, USA, 2003. [Google Scholar]
  36. Ngoc, T.M.; Lee, I.; Ha, D.T.; Kim, H.; Min, B.; Bae, K. Tyrosinase-inhibitory constituents from the twigs of Cinnamomum cassia. J. Nat. Prod. 2009, 72, 1205–1208. [Google Scholar] [CrossRef]
  37. Tolonen, A.; György, Z.; Jalonen, J.; Neubauer, P.; Hohtola, A. LC/MS/MS identification of glycosides produced by biotransformation of cinnamyl alcohol in Rhodiola rosea compact callus aggregates. Biomed. Chromatogr. 2004, 18, 550–558. [Google Scholar] [CrossRef]
  38. Nasrullah, A.A. Phytochemicals and Bioactivities of Cryptocarya nigra (Lauraceae)/Ayu Afiqah Binti Nasrullah. Ph.D. Thesis, University of Malaya, Kuala Lumpur, Malaysia, 2014. [Google Scholar]
  39. Summons, R.E. The Alkaloids of Some Australian and New Guinea Plants; Wollongong University College: Wollongong, NSW, Australia, 1971. [Google Scholar]
  40. Luo, Q.; Wang, S.-M.; Lu, Q.; Luo, J.; Cheng, Y.-X. Identification of compounds from the water soluble extract of Cinnamomum cassia barks and their inhibitory effects against high-glucose-induced mesangial cells. Molecules 2013, 18, 10930–10943. [Google Scholar] [CrossRef] [Green Version]
  41. Tolonen, A.; Pakonen, M.; Hohtola, A.; Jalonen, J. Phenylpropanoid glycosides from Rhodiola rosea. J. Chem. Pharm. Bull. 2003, 51, 467–470. [Google Scholar] [CrossRef] [Green Version]
  42. Hamed, A.I.; Al-Ayed, A.S.; Moldoch, J.; Piacente, S.; Oleszek, W.; Stochmal, A. Profiles analysis of proanthocyanidins in the argun nut (Medemia argun--an ancient Egyptian palm) by LC-ESI-MS/MS. J. Mass Spectrom. 2014, 49, 306–315. [Google Scholar] [CrossRef] [PubMed]
  43. Marmet, C.; Actis-Goretta, L.; Renouf, M.; Giuffrida, F. Quantification of phenolic acids and their methylates, glucuronides, sulfates and lactones metabolites in human plasma by LC-MS/MS after oral ingestion of soluble coffee. J. Pharm. Biomed. Anal. 2014, 88, 617–625. [Google Scholar] [CrossRef]
  44. Ali, A.; Bashmil, Y.M.; Cottrell, J.J.; Suleria, H.A.R.; Dunshea, F.R. LC-MS/MS-QTOF Screening and Identification of Phenolic Compounds from Australian Grown Herbs and Their Antioxidant Potential. Antioxidants 2021, 10, 1770. [Google Scholar] [CrossRef] [PubMed]
  45. Farag, M.A.; Ali, S.E.; Hodaya, R.H.; El-Seedi, H.R.; Sultani, H.N.; Laub, A.; Eissa, T.F.; Abou-Zaid, F.O.; Wessjohann, L.A. Phytochemical profiles and antimicrobial activities of Allium cepa red cv. and A. sativum subjected to different drying methods: A comparative MS-based metabolomics. Molecules 2017, 22, 761. [Google Scholar] [CrossRef] [PubMed]
  46. Xiong, L.; Zhu, C.; Li, Y.; Tian, Y.; Lin, S.; Yuan, S.; Hu, J.; Hou, Q.; Chen, N.; Yang, Y. Lignans and neolignans from Sinocalamus affinis and their absolute configurations. J. Nat. Prod. 2011, 74, 1188–1200. [Google Scholar] [CrossRef] [PubMed]
  47. Wang, J.; Jia, Z.; Zhang, Z.; Wang, Y.; Liu, X.; Wang, L.; Lin, R. Analysis of chemical constituents of Melastoma dodecandrum lour. by UPLC-ESI-Q-exactive focus-MS/MS. Molecules 2017, 22, 476. [Google Scholar] [CrossRef] [Green Version]
  48. Tine, Y.; Renucci, F.; Costa, J.; Wélé, A.; Paolini, J. A method for LC-MS/MS profiling of coumarins in Zanthoxylum zanthoxyloides (Lam.) B. Zepernich and Timler extracts and essential oils. Molecules 2017, 22, 174. [Google Scholar] [CrossRef] [Green Version]
  49. Shahwar, D.; Raza, M.A.; Shafiq-Ur-Rehman; Abbasi, M.A.; Atta-Ur-Rahman. An investigation of phenolic compounds from plant sources as trypsin inhibitors. J. Nat. Prod. Res. 2012, 26, 1087–1093. [Google Scholar] [CrossRef]
  50. Avula, B.; Smillie, T.J.; Wang, Y.-H.; Zweigenbaum, J.; Khan, I.A. Authentication of true cinnamon (Cinnamon verum) utilising direct analysis in real time (DART)-QToF-MS. Food Addit. Contam. Part A 2015, 32, 1–8. [Google Scholar] [CrossRef]
  51. Liu, X.; Fu, J.; Yao, X.-J.; Yang, J.; Liu, L.; Xie, T.-G.; Jiang, P.-C.; Jiang, Z.-H.; Zhu, G.-Y. Phenolic constituents isolated from the twigs of Cinnamomum cassia and their potential neuroprotective effects. J. Nat. Prod. 2018, 81, 1333–1342. [Google Scholar] [CrossRef]
  52. Wang, J.; Su, B.; Jiang, H.; Cui, N.; Yu, Z.; Yang, Y.; Sun, Y. Traditional uses, phytochemistry and pharmacological activities of the genus Cinnamomum (Lauraceae): A review. Fitoterapia 2020, 146, 104675. [Google Scholar] [CrossRef]
  53. Zhao, H.-Y.; Fan, M.-X.; Wu, X.; Wang, H.-J.; Yang, J.; Si, N.; Bian, B.-L. Chemical profiling of the Chinese herb formula Xiao-Cheng-Qi decoction using liquid chromatography coupled with electrospray ionization mass spectrometry. J. Chromatogr. Sci. 2013, 51, 273–285. [Google Scholar] [CrossRef] [Green Version]
  54. Agalar, H.G.; Çiftçi, G.A.; Göğer, F.; Kırımer, N. Activity guided fractionation of Arum italicum Miller Tubers and the LC/MS-MS profiles. Rec. Nat. Prod. 2017, 12, 64–75. [Google Scholar] [CrossRef]
  55. Tala, V.R.S.; Candida da Silva, V.; Rodrigues, C.M.; Nkengfack, A.E.; Campaner dos Santos, L.; Vilegas, W. Characterization of proanthocyanidins from Parkia biglobosa (Jacq.) G. Don.(Fabaceae) by flow injection analysis—Electrospray ionization ion trap tandem mass spectrometry and liquid chromatography/electrospray ionization mass spectrometry. Molecules 2013, 18, 2803–2820. [Google Scholar] [CrossRef] [Green Version]
  56. Serag, A.; Baky, M.H.; Döll, S.; Farag, M.A. UHPLC-MS metabolome based classification of umbelliferous fruit taxa: A prospect for phyto-equivalency of its different accessions and in response to roasting. RSC Adv. 2020, 10, 76–85. [Google Scholar] [CrossRef] [Green Version]
  57. Yang, S.-S.; Hou, W.-C.; Huang, L.-W.; Lee, T.-H. A new γ-lactone from the leaves of Cinnamomum kotoense. J. Nat. Prod. Res. 2006, 20, 1246–1250. [Google Scholar] [CrossRef]
  58. Kerwin, J.L.; Wiens, A.M.; Ericsson, L.H. Identification of fatty acids by electrospray mass spectrometry and tandem mass spectrometry. J. Mass Spectrom. 1996, 31, 184–192. [Google Scholar] [CrossRef]
  59. Zeng, J.; Xue, Y.; Shu, P.; Qian, H.; Sa, R.; Xiang, M.; Li, X.-N.; Luo, Z.; Yao, G.; Zhang, Y. Diterpenoids with immunosuppressive activities from Cinnamomum cassia. J. Nat. Prod. 2014, 77, 1948–1954. [Google Scholar] [CrossRef]
  60. Hema, R.; Kumaravel, S.; Martina, S. Chromatograph interfaced to a mass spectrometer analysis of Cinnamomum verum. J. Nat. Sci. 2010, 8, 152–155. [Google Scholar]
  61. Farag, M.A.; Abdelfattah, M.S.; Badr, S.E.A.; Wessjohann, L.A. Profiling the chemical content of Ficus lyrata extracts via UPLC-PDA-qTOF-MS and chemometrics. Nat. Prod. Res. 2014, 28, 1549–1556. [Google Scholar] [CrossRef]
  62. Touriño, S.; Lizárraga, D.; Carreras, A.; Lorenzo, S.; Ugartondo, V.; Mitjans, M.; Vinardell, M.P.; Juliá, L.; Cascante, M.; Torres, J.L. Highly galloylated tannin fractions from witch hazel (Hamamelis virginiana) bark: Electron transfer capacity, in vitro antioxidant activity, and effects on skin-related cells. Chem. Res. Toxicol. 2008, 21, 696–704. [Google Scholar] [CrossRef]
  63. Carvalho, A.A.; Andrade, L.N.; de Sousa, É.B.V.; de Sousa, D.P. Antitumor phenylpropanoids found in essential oils. BioMed Res. Int. 2015, 2015, 392674. [Google Scholar] [CrossRef]
  64. El Atki, Y.; Aouam, I.; El Kamari, F.; Taroq, A.; Nayme, K.; Timinouni, M.; Lyoussi, B.; Abdellaoui, A. Antibacterial activity of cinnamon essential oils and their synergistic potential with antibiotics. J. Adv. Pharm. Technol. Res. 2019, 10, 63. [Google Scholar] [CrossRef]
  65. Chae, H.K.; Kim, W.; Kim, S.K. Phytochemicals of cinnamomi cortex: Cinnamic acid, but not cinnamaldehyde, attenuates oxaliplatin-induced cold and mechanical hypersensitivity in rats. Nutrients 2019, 11, 432. [Google Scholar] [CrossRef] [Green Version]
  66. Wang, Y.; Zhang, Y.; Shi, Y.-Q.; Pan, X.-H.; Lu, Y.-H.; Cao, P. Antibacterial effects of cinnamon (Cinnamomum zeylanicum) bark essential oil on Porphyromonas gingivalis. Microb. Pathog. 2018, 116, 26–32. [Google Scholar] [CrossRef]
  67. Kim, M.S.; Kim, J.Y. Cinnamon subcritical water extract attenuates intestinal inflammation and enhances intestinal tight junction in a Caco-2 and RAW264. 7 co-culture model. Food Funct. 2019, 10, 4350–4360. [Google Scholar] [CrossRef]
  68. Liu, Y.-H.; Tsai, K.-D.; Yang, S.-M.; Wong, H.-Y.; Chen, T.-W.; Cherng, J.; Cherng, J.-M. Cinnamomum verum ingredient 2-methoxycinnamaldehyde: A new antiproliferative drug targeting topoisomerase I and II in human lung squamous cell carcinoma NCI-H520 cells. Eur. J. Cancer Prev. 2017, 26, 314–323. [Google Scholar] [CrossRef]
  69. Yan, Y.-M.; Fang, P.; Yang, M.-T.; Li, N.; Lu, Q.; Cheng, Y.-X. Anti-diabetic nephropathy compounds from Cinnamomum cassia. J. Ethnopharmacol. 2015, 165, 141–147. [Google Scholar] [CrossRef]
  70. Custodio, D.L.; da Veiga Junior, V.F. Lauraceae alkaloids. RSC Adv. 2014, 4, 21864–21890. [Google Scholar] [CrossRef]
  71. Ozkan, G.; Kostka, T.; Esatbeyoglu, T.; Capanoglu, E. Effects of lipid-based encapsulation on the bioaccessibility and bioavailability of phenolic compounds. Molecules 2020, 25, 5545. [Google Scholar] [CrossRef]
  72. Farag, M.A.; Sharaf Eldin, M.G.; Kassem, H.; Abou el Fetouh, M. Metabolome classification of Brassica napus L. organs via UPLC–QTOF–PDA–MS and their anti-oxidant potential. Phytochem. Anal. 2013, 24, 277–287. [Google Scholar] [CrossRef]
  73. Chen, J.; Huang, W.; Zhang, T.; Lu, M.; Jiang, B. Anti-obesity potential of rare sugar D-psicose by regulating lipid metabolism in rats. Food Funct. 2019, 10, 2417–2425. [Google Scholar] [CrossRef]
  74. Grembecka, M. Sugar alcohols—Their role in the modern world of sweeteners: A review. Eur. Food Res. Technol. 2015, 241, 104675. [Google Scholar] [CrossRef] [Green Version]
  75. Tomaszewska, L.; Rywińska, A.; Gładkowski, W. Production of erythritol and mannitol by Yarrowia lipolytica yeast in media containing glycerol. J. Ind. Microbiol. Biotechnol. 2012, 39, 1333–1343. [Google Scholar] [CrossRef] [PubMed] [Green Version]
  76. Mehtiö, T.; Toivari, M.; Wiebe, M.G.; Harlin, A.; Penttilä, M.; Koivula, A. Production and applications of carbohydrate-derived sugar acids as generic biobased chemicals. Crit. Rev. Biotechnol. 2016, 36, 904–916. [Google Scholar] [CrossRef] [PubMed]
  77. Ding, S.; Yang, J. The influence of emulsifiers on the rheological properties of wheat flour dough and quality of fried instant noodles. LWT-Food Sci. Technol. 2013, 53, 61–69. [Google Scholar] [CrossRef]
  78. Lee, L.Y.; Chin, N.L.; Lim, C.H.; Yusof, Y.A.; Talib, R.A. Saturated distilled monoglycerides variants in gel-form cake emulsifiers. Agric. Agric. Sci. Procedia 2014, 2, 191–198. [Google Scholar] [CrossRef] [Green Version]
  79. Ozdener, M.H.; Subramaniam, S.; Sundaresan, S.; Sery, O.; Hashimoto, T.; Asakawa, Y.; Besnard, P.; Abumrad, N.A.; Khan, N.A. CD36-and GPR120-mediated Ca2+ signaling in human taste bud cells mediates differential responses to fatty acids and is altered in obese mice. Gastroenterology 2014, 146, 995–1005.e5. [Google Scholar] [CrossRef] [Green Version]
  80. Briggs, M.A.; Petersen, K.S.; Kris-Etherton, P.M. Saturated fatty acids and cardiovascular disease: Replacements for saturated fat to reduce cardiovascular risk. In Healthcare; Multidisciplinary Digital Publishing Institute: Basel, Switzerland, 2017; p. 29. [Google Scholar]
  81. Zeng, K.; Thompson, K.E.; Yates, C.R.; Miller, D.D. Synthesis and biological evaluation of quinic acid derivatives as anti-inflammatory agents. Bioorg. Med. Chem. Lett. 2009, 19, 5458–5460. [Google Scholar] [CrossRef]
  82. Mnafgui, K.; Derbali, A.; Sayadi, S.; Gharsallah, N.; Elfeki, A.; Allouche, N. Anti-obesity and cardioprotective effects of cinnamic acid in high fat diet-induced obese rats. J. Food Sci. Technol. 2015, 52, 4369–4377. [Google Scholar] [CrossRef] [Green Version]
  83. Silva, V.; Igrejas, G.; Falco, V.; Santos, T.P.; Torres, C.; Oliveira, A.M.; Pereira, J.E.; Amaral, J.S.; Poeta, P. Chemical composition, antioxidant and antimicrobial activity of phenolic compounds extracted from wine industry by-products. Food Control 2018, 92, 516–522. [Google Scholar] [CrossRef] [Green Version]
  84. Polášková, P.; Herszage, J.; Ebeler, S.E. Wine flavor: Chemistry in a glass. Chem. Soc. Rev. 2008, 37, 2478–2489. [Google Scholar] [CrossRef]
  85. Mrabti, H.N.; Jaradat, N.; Fichtali, I.; Ouedrhiri, W.; Jodeh, S.; Ayesh, S.; Cherrah, Y.; Faouzi, M.E.A. Separation, identification, and antidiabetic activity of catechin isolated from Arbutus unedo L. plant roots. Plants 2018, 7, 31. [Google Scholar] [CrossRef] [Green Version]
  86. Farag, M.A.; Porzel, A.; Wessjohann, L.A. Comparative metabolite profiling and fingerprinting of medicinal licorice roots using a multiplex approach of GC–MS, LC–MS and 1D NMR techniques. Phytochemistry 2012, 76, 60–72. [Google Scholar] [CrossRef]
  87. El-Newary, S.A.; Afifi, S.M.; Aly, M.S.; Ahmed, R.F.; El Gendy, A.E.-N.G.; Abd-ElGawad, A.M.; Farag, M.A.; Elgamal, A.M.; Elshamy, A.I. Chemical profile of Launaea nudicaulis ethanolic extract and its antidiabetic effect in streptozotocin-induced rats. Molecules 2021, 26, 1000. [Google Scholar] [CrossRef]
  88. Buckingham, J. Dictionary of Natural Products on DVD; Chapman & Hall: New York, NY, USA, 2011; Volume 43. [Google Scholar]
  89. Farag, M.A.; Fathi, D.; Shamma, S.; Shawkat, M.S.A.; Shalabi, S.M.; El Seedi, H.R.; Afifi, S.M. Comparative metabolome classification of desert truffles Terfezia claveryi and Terfezia boudieri via its aroma and nutrients profile. LWT 2021, 142, 111046. [Google Scholar] [CrossRef]
  90. Broeckling, C.D.; Reddy, I.R.; Duran, A.L.; Zhao, X.; Sumner, L.W. MET-IDEA: Data extraction tool for mass spectrometry-based metabolomics. Anal. Chem. 2006, 78, 4334–4341. [Google Scholar] [CrossRef]
Figure 1. Representative Ultra -Performance Liquid Chromatography–Mass Spectrometry (UPLC-MS) base peak chromatogram of cinnamon bark 70% methanol extract in negative ion mode (a) CC (Cinnamomum cassia from Malaysia), (b) CV (C. verum from Pakistan), and positive ion mode (c) CC, (d) CV.
Molecules 27 02935 g001
Figure 2. UPLC-MS principal component analyses of the different cinnamontaxa (n = 3) on negative ion mode: (a) Score plot of PC1 vs. PC2, (b) respective loading plot with contributing mass peaks, (c) HCA and on positive ion mode, (d) Score plot of PC1 vs. PC2, (e) respective loading plot, (f) HCA. CC: Cinnamomum cassia from Malaysia, CI: C. iners from Malaysia, CT: C. tamala from Pakistan, CV: C. verum from Pakistan, CVM: C. verum from Malaysia.
Molecules 27 02935 g002
Figure 3. GC-MS principal component analyses of the different cinnamon taxa (n = 3) (a) score plot of PC1 vs. PC2, (b) respective loading plot with contributing chemical classes, and (c) HCA plot. The metabolome clusters are placed in two-dimensional space at the distinct locations defined by two vectors of principal component PC1 = 47% and PC2 = 30%. CC: Cinnamomum cassia from Malaysia, CI: C. iners from Malaysia, CT: C. tamala from Pakistan, CV: C. verum from Pakistan, CVM: C. verum from Malaysia.
Molecules 27 02935 g003
Table 1. Metabolites identified in 70% methanol extract of Cinnamomum species by UPLC-ESI-MS (peak numbers are preceded by L in text) in both negative and positive ionization modes.
No.RtCompound NameChemical ClassUV[M − H]/
[M + H]+
Molecular FormulaErrorMS/MS
Fragments
ReferenceCCCICTCVCVM
L10.41HexoseSugar244179.0561C6H11O63.1161.0422
135.0323
+++++
L20.49Quinic acidPhenolic acid222
264
191.0551C7H11O65.5173.0418
129.0186
[28]+++++
L30.72Methoxycitric acidOrganic acid 221.0302
223.0145
C7H9O8
C7H11O8+
0.4
0.6
189.0034
145.0131
127.0038
+
L41.55Protocatechuic acid hexosidePhenolic acid223
280
315.0710C13H15O93.7153.0185
109.0292
[29]+
L51.62Gentisic acidPhenolic acid280153.0188
155.0206
C7H5O4
C7H7O4+
1.4109.0291 ++++
L61.82Protocatechuic acidPhenolic acid280153.0189C7H5O40.4-[30]+++++
L72.41ProtocatechualdehydePhenolic aldehyde 137.0233C7H5O30.9-[29]+++++
L82.62CinnamolaurineAlkaloid270
310
298.1433C18H19NO3+1.7-[31]+
L92.88(Epi)catechin tetramer
(EC-EC-EC-A-EC)
Proanthocyanidin234
275
1151.2454
1153.2626
C60H47O24
C60H49O24+
0.8863.1824
575.1204
[32]++
L103.20(Epi)catechin tetramer
(EC-EC-A-EC-EC)
Proanthocyanidin234
275
1151.25C60H47O24−3.2863.1870
573.1048
+
L113.27(Epi)catechin trimer A type
(EC-A-EC-EC)
Proanthocyanidin234
280
863.1885C45H35O18−6.5711.1297
573.1144
289.0711
+++
L123.40(Epi)catechin trimer A type
(EC-A-EC-EC)
Proanthocyanidin280863.1853
865.1958
C45H35O18
C45H37O18+
0.6577.1333
427.1819
+++
L133.43Dimethoxyphenol-O-pentosyl hexosidePhenol214447.1501C19H27O121.6269.1029
161.0448
[33]+++++
L143.55NorboldineAlkaloids220
280
310
312.1241
314.1382
C18H18NO4
C18H20NO4+
2.7297.0998[34]
[35]
+++++
L153.62Phenylethyl-O-pentosyl hexoside (Icariside DC)Hydroxycinnamates214415.1237C19H27O100.4269.1034[36]++++
L163.64Dihydrocinnacasside pentosideHydroxycinnamates214459.1481C20H27O126165.0552 ++++
L173.66Dihydro coumaroyl-O-pentosylhexosideHydroxycinnamates214459.1506C20H27O120.5415.1240
327.1078
165.0545
+++
L183.67Dihydro coumaroyl-O-hexoside
(Dihydomelilotoside)
Hydroxycinnamates214327.1085
329.1034
C15H19O8
C15H21O8+
0.7281.1395
165.0544
[36]+++
L193.78Dihydrocinnacasside
(Hydroxyphenylpropanoy-O-hexoside)
Hydroxycinnamates214327.1063C15H19O86.8165.055
121.0675
++++
L203.84Cinnamyl-O-hexosideHydroxycinnamates280295.1155C15H19O610.7251.1266[37]++
L213.84CorydineAlkaloids270
310
342.1678C20H24NO4+6.3297.1106
265.0842
[38]
[39]
+++++
L223.97ReticulineAlkaloids280330.1680C19H24NO4+5.9192.1014 +++++
L234.16Norisocorydine/
Boldine
Alkaloids270
310
328.1528C19H22NO4+0.9 +++++
L244.50Cinnamyl-O-pentosylhexosideHydroxycinnamates251
280
427.1673C20H27O10−6.3293.0854
233.0659
149.0447
[40]
[41]
+
L254.59(Epi) catechin trimer with double A linkageProanthocyanidins280861.699
863.1811
C45H33O18
C45H35O18+
−2.7595.1699
575.118
473.1653
[42]++
L264.60Dihydrocoumaric acidHydroxycinnamates310165.0555C9H9O312.9121.0657[43]++++
L274.63Dihydrocinnamyl-O-pentosyl hexosideHydroxycinnamates251
280
429.1726C20H31O121297.1323
149.0440
[41]+
L284.68Naringenin di-O-hexosideFlavonoids 595.1699
597.1254
C27H31O15
C27H33O15+
−20.4433.1139
271.0611
[44]++
L294.85Isorhamnetin-O-pentosyldeoxyhexosideFlavonoids256
354
593.1848C28H33O144.7447.1285
315.0701
++
L304.93Luteolin-O-hexoside-C-hexosideFlavonoids260
348
609.1998C27H29O16−5.2447.0924
327.1076
++
L315.12Dipropylmalonic acidOrganic acid 187.0973
189.0721
C9H15O4
C9H17O4+
1.3169.0866
143.1078
+++++
L325.15Trimethoxy phenolPhenol 183.0655
185.0712
C9H11O4
C9H13O4+
4.2155.0708
139.0758
+++++
L335.32CoumarinHydroxycinnamates273
312
147.0446C9H6O2+−3.8 [45]+++++
L345.46Dihydroxy-tetramethoxy-epoxylignanoloneLignans233
303
433.1479C22H25O95.6418.1258
373.1270
285.0428
[46]+++++
L355.61Oxododecanedioic acidFatty acids 243.1228C12H19O54225.1129
181.1215
[47]++++
L365.78Acetyl methoxy coumarinHydroxycinnamates 217.0501C12H9O42.5185.0814
173.0600
[48]+++++
L376.09UnknownCatechins234
280
995.2414C51H47O21−29.1705.1589
543.1298
289.0178
+
L386.13Cinnamic acid (E-cinnamic acid)Hydroxycinnamates270147.0435
149.0723
C9H7O2
C9H9O2+
4.5119.0503[49]+++++
L396.50(E)-CinnamaldehydeHydroxycinnamates 133.0652C9H9O+−3.3-[22]+++++
L407.11Unknownnitrogenous compound 242.1751
244.1574
C13H24NO3
C13H26NO3+
4.5225.1502 +++++
L417.15Methylcinnamic acidHydroxycinnamates 163.074C10H11O2+ -[50]++++
L427.33Methoxy cinnamaldehydeHydroxycinnamates 163.076C10H11O2+0.3- +++++
L437.30Cinnamyl alcoholHydroxycinnamates 135.081C9H11O+−3.8-[50]+++++
L447.51Hydroxyl, dimethoxyphenyl, hydroxy methoxyphenyl propanediolPhenol 349.12C18H22O74.7331.1177
293.1388
225.0767
[51]+++
L457.52Epicatechin trimethyl etherCatechins 333.1323C18H21O6+2.8-[52]+++++
L468.02Cinnacassin LLignans215
245
281.1168C17H18O35.6207.1183
147.0448
[51]++
L478.80PhyscionAnthraquinon 283.0606C16H11O52269.0381[53]++
L489.00Methylenedioxy-dimethylepicatechinCatechins234
280
331.117C18H19O6+1.8- +++++
L499.43Hydroperoxy-linolenateFatty acid 309.2047
311.2137
C18H29O4
C18H31O4+
7.9291.1967
265.2163
+++
L509.83Dihydrocapsiate
(vanillyl-8-methylnonanate)
Methoxyphenols 307.1919C18H27O4−1.5265.1800
223.1331
209.1180
[54]++++
L519.92(Epi)gallocatechin-O-caffeateProanthocyanidins234
280
467.0982C24H19O100.3313.2369
161.0243
+
L529.99(Epi)gallocatechin-(epi)catechinProanthocyanidins278593.2696C30H41O12−15.6467.0971
313.2373
305.1775
[55]+
L5310.52Hexadecanedioic acidFatty acid 285.2060
287.2163
C16H30O4
C16H32O4+
4.4267.1947
223.2042
[56]+++
L5411.12Octadecenedioic acidFatty acid 311.2205
313.2147
C18H31O4
C18H33O4+
5.1293
249.2234
+++++
L5511.36Hydroxylinoleic acidFatty acid221295.2267C18H31O34.1277.2161
195.1379
+++
L5612.30EmodinAnthraquinone 269.2091C15H10O5 225.2199[53]+++++
L5712.85Hexadecanedioic acid, monomethyl ester
(Methoxy-oxohexadecanoic acid)
Fatty acid221299.2060C17H31O41.4255.2320 ++++
L5812.96Hydroperoxyoctadecenoic acidFatty acid 313.2373C18H33O44.2269.2297[54]+++++
L5913.97Ceriporic acidDicarboxylic acid 351.2534
353.2431
C21H35O4
C21H37O4+
1.9- ++++
L6014.02Trihydroxyoctadecadienoic acidFatty acid221327.2177
329.1743
C18H31O5
C18H33O5+
3.2283.2266[54]+++
L6114.25Hydroxyoctadecenoic acidFatty acid 297.2405C18H33O310.1253.2167
235.2058
+++++
L6214.28CinnakotolactoneLactone 309.2426
311.2541
C19H33O3
C19H35O3+
3.7-[57]++++
L6314.39Cinnamyl cinnamate-O-pentosideHydroxycinnamates 395.2781C23H39O52.2263.2389 +
L6414.54Linoleic acidFatty acid221279.232
281.2231
C18H31O2
C18H33O2+
2235.2051[58]+++++
L6514.99IsolinderanolideButanolides 307.2272
309.2103
C19H31O3
C19H33O3+
5.1-[57]+++++
L6615.25Palmitic acidFatty acid221255.2328
257.2167
C16H31O2
C16H33O2+
0.7-[58]+++++
L6715.40Cinncassiol BDiterpene 399.1961C20H31O815.4-[59]+++++
L6815.53Cinncassiol ADiterpene 381.1724C20H29O751337.1820 +++++
L6915.54Oleic acidFatty acid224281.2483
283.2641
C18H33O2
C18H35O2+
0.9-[58]+++++
L7015.75Benzenedicarboxylic acid, bis(2-methylpropyl) esterFatty ester 279.1587C16H23O4+0.4-[60]+++++
L7115.81Methyl palmitateFatty acid221271.2626C17H35O2+0.6- +++++
L7215.84OlealdehydeFatty aldehydes 267.2677C18H35O+2.1- +++++
L7317.03Benzenedicarboxylicacid, diisooctylesterFatty ester 391.2795C24H39O4+0.4-[60]+++++
L7418.11Hydroxy-dimethoxy epoxy-neolignene diolethyl etherLignans205
303
385.1657C22H26O618.6-[46]+++
CC: Cinnamomum cassia from Malaysia, CI: C. iners from Malaysia, CT: C. tamala from Pakistan, CV: C. verum from Pakistan, CVM: C. verum from Malaysia.
Table 2. Relative percentage of non-volatile metabolites detected in cinnamon barks using HS-SPME-GC-MS (peak numbers are preceded by G in text) measurements (n = 3) represented as average ± standard errors. Different letters indicate significant differences between cinnamon accessions according to the least significant difference analysis (p < 0.05; Tukey’s test). CC: Cinnamomum cassia from Malaysia, CI: C. iners from Malaysia, CT: C. tamala from Pakistan, CV: C. verum from Pakistan, CVM: C. verum from Malaysia. (a)–(e) significantly different form the corresponding group. * Compounds confirmed by standards comparison.
No.Rt (min)RIIdentificationCC (a)CI (b)CT (c)CV (d)CVM (e)
Amino acids
G112.2181403L-Aspartic acid, 2TMS2.27 ± 0.362.03 ± 0.361.36 ± 0.152.27 ± 0.211.48 ± 0.08
G212.6521436β-Alanine, 3TMS *0.20 ± 0.040.18 ± 0.020.11 ± 0.000.23 ± 0.020.13 ± 0.01
Total Amino acids2.472.211.472.491.60
Esters
G324.63226021-Monopalmitin, 2TMS6.06 ± 3.8810.43 ± 0.385.03 ± 1.069.03 ± 2.133.72 ± 1.79
G426.1062789Glycerol monostearate, 2TMS15.13 ± 5.5721.73 ± 0.52 e12.01 ± 1.21 d23.96 ± 2.41 c11.46 ± 2.50 b
G526.3222811Sebacic acid di(2-ethylhexyl) ester0.59 ± 0.010.61 ± 0.020.33 ± 0.010.63 ± 0.030.36 ± 0.06
Total esters21.7932.7717.3733.6115.54
Ethers
G69.9181253Diethylene glycol, 2TMS0.25 ± 0.020.25 ± 0.010.15 ± 0.010.27 ± 0.010.15 ± 0.02
Total ethers0.250.250.150.270.15
Fatty acids
G717.7331850Myristic acid, TMS *0.33 ± 0.010.59 ± 0.030.28 ± 0.010.47 ± 0.030.31 ± 0.03
G818.7841949Pentadecanoic acid, TMS0.09 ± 0.010.33 ± 0.020.07 ± 0.000.20 ± 0.030.07 ± 0.02
G919.7792047Palmitic Acid, TMS *2.33 ± 0.152.65 ± 0.062.48 ± 0.164.10 ± 0.361.77 ± 0.41
G1021.4062216Linoleic acid, TMS *0.03 ± 0.000.09 ± 0.010.04 ± 0.010.22 ± 0.090.09 ± 0.05
G1121.442220Oleic Acid, TMS *0.69 ± 0.030.84 ± 0.080.92 ± 0.112.09 ± 0.740.67 ± 0.28
G1221.4952226Elaidic acid TMS0.29 ± 0.010.24 ± 0.030.19 ± 0.040.39 ± 0.110.22 ± 0.04
G1321.6552244Stearic acid, TMS3.35 ± 0.103.60 ± 0.042.11 ± 0.143.94 ± 0.202.08 ± 0.35
G1423.3862444Arachidic acid, TMS0.22 ± 0.010.15 ± 0.010.14 ± 0.040.22 ± 0.040.11 ± 0.04
G1524.9832646Behenic acid, TMS0.55 ± 0.070.28 ± 0.050.29 ± 0.120.41 ± 0.080.22 ± 0.12
G1626.4662824Lignoceric acid, TMS0.25 ± 0.030.18 ± 0.010.17 ± 0.040.25 ± 0.020.13 ± 0.05
Total fatty acids8.148.946.7012.305.68
Organic acids
G177.061076Glycolic acid, 2TMS0.19 ± 0.030.24 ± 0.010.25 ± 0.040.25 ± 0.010.12 ± 0.02
G187.5491113Oxalic acid, 2TMS1.63 ± 0.451.57 ± 0.320.48 ± 0.071.33 ± 0.361.10 ± 0.39
G198.26511533-hydroxypropionic acid, 2TMS0.18 ± 0.040.11 ± 0.010.42 ± 0.020.16 ± 0.010.14 ± 0.02
G209.76612434-hydroxybutyric acid, 2TMS1.01 ± 0.250.82 ± 0.100.52 ± 0.040.98 ± 0.100.10 ± 0.01
G2110.9831322Succinic acid, 2TMS0.60 ± 0.042.08 ± 0.000.82 ± 0.040.47 ± 0.020.36 ± 0.04
G2213.5291502Malic acid, 3TMS *0.64 ± 0.011.41 ± 0.211.52 ± 0.131.50 ± 0.200.49 ± 0.04
G2314.2691557(E)-Cinnamic acid, TMS *0.41 ± 0.050.21 ± 0.021.02 ± 0.100.10 ± 0.010.70 ± 0.08
G2417.4181821Shikimic acid, 4TMS0.44 ± 0.050.37 ± 0.020.90 ± 0.010.25 ± 0.020.26 ± 0.04
G2518.0991885Quinic acid, 5TMS1.10 ± 0.101.05 ± 0.032.03 ± 0.150.45 ± 0.080.44 ± 0.06
Total organic acids6.207.867.965.493.70
Phenolics
G2617.5431832Protocatechuic acid, 3TMS0.63 ± 0.13 c,d0.26 ± 0.01c,d4.52 ± 0.27 a,b,d,e0.19 ± 0.17 a,b,c,e0.36 ± 0.02 c,d
G2726.8492859Catechin, 5TMS0.35 ± 0.090.35 ± 0.060.10 ± 0.031.40 ± 0.030.16 ± 0.03
Total phenolics0.980.614.621.590.52
Sugars
G2815.631667Arabinose, 4TMS0.62 ± 0.090.19 ± 0.040.56 ± 0.010.26 ± 0.030.13 ± 0.02
G2917.4761826Psicofuranose, 5TMS1.96 ± 0.23 b,c,d,e0.11 ± 0.03 a,c,e1.06 ± 0.15 a,b,e0.92 ± 0.22 a,e2.94 ± 0.44 a,b,c,d
G3017.5571834Psicofuranose, 5TMS isomer5.46 ± 0.60 b,d,e0.58 ± 0.04 a,c,d,e6.86 ± 0.11 b,d3.01 ± 0.46 a,b,c,e7.54 ± 1.11 a,b,d
G3117.6621844Fructopyranose, 5TMS *8.45 ± 1.23 b,d,e0.45 ± 0.01 a,c,d,e6.30 ± 0.40 b,e4.21 ± 0.44 a,b,e12.93 ± 0.58 a,b,c,d
G3218.451918Glucopyranose, 5TMS *8.10 ±1.01 b,c,d,e0.27 ± 0.01 a,c,d,e5.98 ±0.47 a,b,d,e3.73 ± 0.53 a,b,c,e10.97 ± 0.68 a,b,c,d
G3319.3472002Glucopyranose, 5TMS isomer10.01 ± 1.46 b,c,d,e0.37 ± 0.04 a,c,d,e7.43 ± 0.35 a,b,d,e4.63 ± 0.49 a,b,c,e12.51 ± 0.36 a,b,c,d
G3425.3182689Sucrose, 8TMS *2.35 ± 0.280.25 ± 0.040.83 ± 0.190.77 ± 0.360.25 ± 0.07
Total sugars36.952.2329.0317.5247.27
Sugar acids
G3511.3381343Glyceric acid, 3TMS0.25 ± 0.050.22 ± 0.010.16 ± 0.010.37 ± 0.020.15 ± 0.02
G3614.5291577Erythronic acid, 4TMS0.03 ± 0.000.05 ± 0.010.06 ± 0.000.08 ± 0.010.01 ± 0.00
G3718.3811909Galactonic acid, γ-lactone, 4TMS1.74 ± 0.33 b,d,e0.13 ± 0.04 a,c,e2.02 ± 0.12 b,d0.74 ± 0.15 a,c,e2.78 ± 0.42 a,b,d
G3818.4931923Galactonic acid, γ-lactone, 4TMS isomer0.11 ± 0.020.28 ± 0.090.71 ± 0.010.11 ± 0.029.03 ± 1.06
G3918.7321944Talonic acid, γ-lactone, 4TMS0.03 ± 0.010.01 ± 0.000.01 ± 0.000.03 ± 0.000.01 ± 0.00
G4019.6272031Gluconic acid, 6TMS0.32 ± 0.021.87 ± 0.071.56 ± 0.270.61 ± 0.090.10 ± 0.02
Total sugar acids2.472.564.521.9412.09
Sugar alcohols
G4110.4341286Glycerol, 3TMS *3.60 ± 0.64 c2.56 ± 0.14 c,d11.29 ± 0.98 a,b,d,e4.63 ±0.38 b,c,e2.36 ±0.37 c,d
G4213.7211516L-Threitol, 4TMS0.04 ± 0.010.19 ± 0.010.20 ± 0.000.05 ± 0.000.04 ± 0.01
G4313.8191524meso-Erythritol, 4TMS1.43 ± 0.26 b,c,d15.96 ± 0.28 a,c,d,e3.84 ±0.12 a,b,d,e2.61 ± 0.06 a,b,c,e1.04 ± 0.14 b,c,d
G4416.3621729Arabitol, 5TMS0.06 ± 0.010.06 ± 0.010.14 ± 0.010.04 ± 0.000.03 ± 0.00
G4516.5021741Arabitol, 5TMS isomer0.54 ± 0.086.14 ± 0.242.13 ± 0.090.33 ± 0.020.13 ± 0.01
G4618.9441965Mannitol, 6TMS0.11 ± 0.020.17 ± 0.040.42 ± 0.030.99 ± 0.110.28 ± 0.03
G4719.1331982Myo-Inositol, 6TMS *0.08 ± 0.010.10 ± 0.000.12 ± 0.010.18 ± 0.020.13 ± 0.02
G4820.52121Myo-Inositol, 6TMS isomer0.79 ± 0.113.49 ± 0.111.29 ± 0.040.72 ± 0.090.78 ± 0.11
Total sugar alcohols6.6728.6819.429.574.80
Unknowns
G4910.9031317Unknown 13.08 ± 0.592.45 ± 0.231.66 ± 0.143.43 ± 0.121.94 ± 0.22
G5011.5961362Unknown 210.23 ± 0.6710.46 ± 0.135.82 ± 0.3611.25 ± 0.336.34 ± 0.89
G5119.8812058Unknown 30.77 ± 0.130.98 ± 0.011.27 ± 0.010.54 ± 0.080.37 ± 0.06
Total unknowns14.0713.898.7615.228.65
Publisher’s Note: MDPI stays neutral with regard to jurisdictional claims in published maps and institutional affiliations.

